visual tools for shared understanding in transdisciplinary...
TRANSCRIPT

Visual Tools for Shared Understanding in Transdisciplinary Knowledge Processes
Tracie N. CurryUniversity of Alaska FairbanksToolik All Scientist’s MeetingJanuary 27, 2017

Knowledge processes:
• Creating information (original research)
• Sharing information (disseminating research)
• Using information (environmental policy and decision-making)

Complex social-environmental systemArctic Context:

Arctic Context:Complex social-environmental system
• Interconnected drivers of change
• Incomplete knowledge
• Uncertainty
• Diverse actors
• Lack of agreement on cause-effect relationships for environmental management

Challenges in Transdisciplinary Knowledge Processes:

Challenge: Ineffective Communication
Misalignment in communication between diverse actors
• Differing levels of information
• Different mental modes of understanding

Solution:Cultivating Shared Understanding:
• Meeting complexity with fl exibility, sensitivity to context, and strategy
• Concerted effort to learn about one’s own and other’s assumptions concerning types of information, their value, and processes for achieving successful outcomes
• Consensus is not a requirement
• Devote time and make benefi ts explicit

Exclusion of differentiated knowledge sources like local and traditional knowledge
• Primacy of conventional, peer-reviewed science as trusted information
• Compromises legitimacy of research fi ndings and the decisions based on them
• Challenge of ensuring meaningful participation from everyone involved
Challenge: Bias Toward Western Science
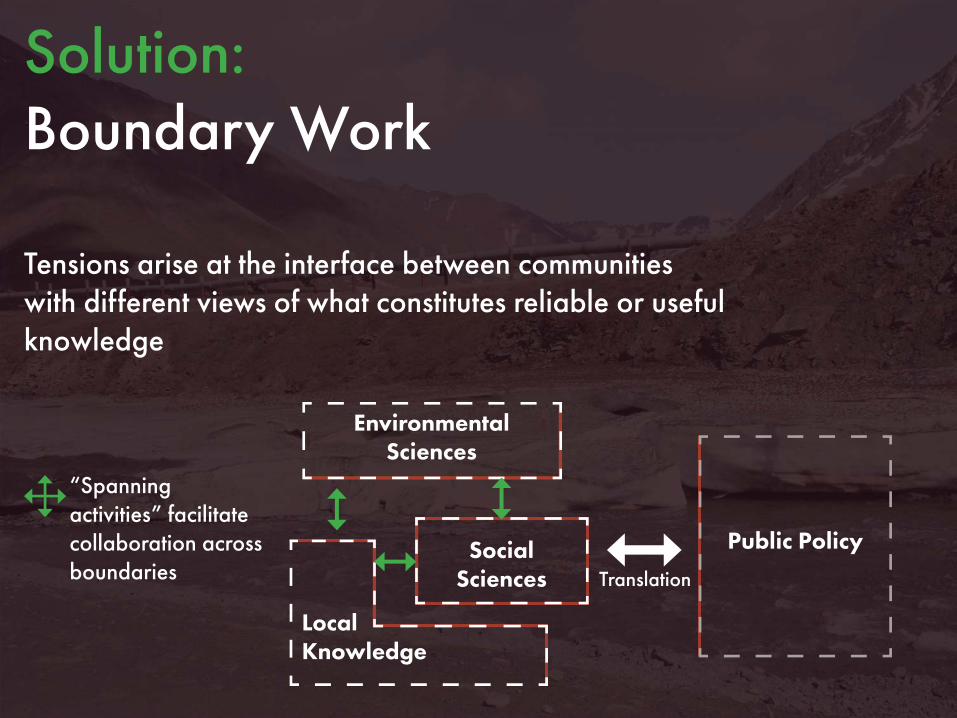
Tensions arise at the interface between communities with different views of what constitutes reliable or useful knowledge
“Spanning activities” facilitate collaboration across boundaries
Solution:Boundary Work
Environmental Sciences
SocialSciences
Public Policy
Translation
LocalKnowledge

Boundary Objects:
Boundary objects help facilitate boundary work. They are scientifi c objects with the dual role of crossing intersecting social groups AND satisfying the informational requirements of each
• Databases
• Standardized forms
• Visual tools

Focus: What tools and processes are most effective at delivering information and creating shared understanding?

Role of Visual Tools in Conveying Place-Based Knowledge:
Researching visual tools and their ability to aid in the development of shared understanding between local communities and outsiders by improving understanding of place-based concepts
• Long-term environmental change
• Scale and magnitude of change
• Impact on local ways of life

Visual Tools:
The range of “visual artifacts” (maps, drawings, diagrams, digital graphics, photographs, etc) with different functions and uses in constructing meaning

For Example: Photography
Credit: Jessica Cherry

Benefi ts
• “Naturalistic” images
• Abundance of detail
• A sense of “trustworthiness”
For Example: Photography

Drawbacks
• Snapshot in time
• Hidden processes
• Limited to what has already happened
For Example: Photography

1972 1990 1997 20031982 2013
Prudhoe Bay, Colleen Site ACredit: BP Exploration Alaska, Inc.
UAF Geobotany
Time series

Revealing hidden processes
Thermokarst degradationCredit: Anna Liljedahl, et al.
Tracie Curry

Potential futures
Arctic Food NetworkCredit: Lateral Offi ce Architecture
Venice Architecture Biennale 2014

Benefi ts of visuals:
Benefi ts of visuals:
• Showing versus telling
• Brings an additional aesthetic and affective dimension into communication.
• Can enhance the potential to express identities and values through color, perspective, typography, etc.

Project details:
• Participatory action research in partnership with Native Village of Wainwright
• Elder interviews
• Visual representation of interview narratives
• Focus groups

Target Audience:
Academically trained persons involved in natural resource management and environmental policy

Target Audience:
Academically trained persons involved in natural resource management and environmental policy
LocalCommunities
Academia
Publicagencies
Industry

Target Audience:Considerations
• Trained in the conventions of Western science
• Accustomed to charts, diagrams, and technical line drawings with limited color, texture, and perspective
• Assigning greater truth to abstracted images of generalizable scientifi c information,
• and lesser truth to naturalistic or interpretive images about concrete, individual events and people

1
1, 2: Kofi nas et al. (2016), Subsistence Sharing and Cooperation Networks: Kaktovik, Wainwright, and Venetie, Alaska. OCS Study BOEM 2015-0233: ISER North Slope Survey, 19772
3

Target Audience:Considerations
• Trained in the conventions of Western science
• Accustomed to charts, diagrams, and technical line drawings with limited color, texture, and perspective
• Assigning greater truth to abstracted images of generalizable scientifi c information,
• and lesser truth to naturalistic or interpretive images about concrete, individual events and people


Collaboration Between Social and Ecological Scientists:
• Establishing shared understanding
• Create a strategy for continual collaboration early in the process
• Ability to downscale

Doyle, J. (2007). Picturing the clima (c) tic: Greenpeace and the representational politics of climate change communication. Science as culture, 16(2), 129-150.
Kress, G. R., & Van Leeuwen, T. (1996). Reading images: The grammar of visual design: Psychology Press.
McGreavy, B., Hutchins, K., Smith, H., Lindenfeld, L., & Silka, L. (2013). Addressing the complexities of boundary work in sustainability science through communication. Sustainability, 5(10), 4195-4221.
Star, S. L., & Griesemer, J. R. (1989). Institutional ecology,translations’ and boundary objects: Amateurs and professionals in Berkeley’s Museum of Vertebrate Zoology, 1907-39. Social studies of science, 19(3), 387-420.
Van Wyk, E., Roux, D. J., Drackner, M., & McCool, S. F. (2008). The impact of scientifi c information on ecosystem management: making sense of the contextual gap between information providers and decision makers. Environmental Management, 41(5), 779-791
Van Leeuwen, T. (2011). The semiotics of decoration. In K. L. O’Halloran & B. A. Smith (Eds.), Multimodal studies: Exploring issues and domains (pp. 115-131). London: Routledge.
Sources: