visual symbols by: mary joice t. de jesus
TRANSCRIPT
mjkl
Drawings
Cartoons
Strip Drawing
Diagram
Charts
Graphs
Maps
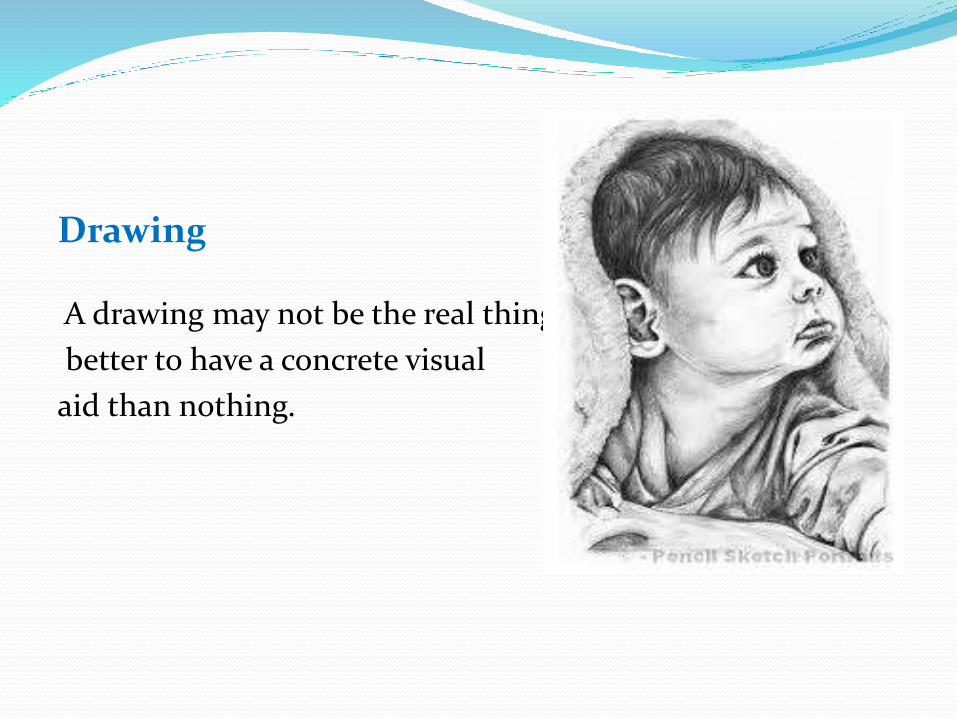
Drawing
A drawing may not be the real thing but
better to have a concrete visual
aid than nothing.
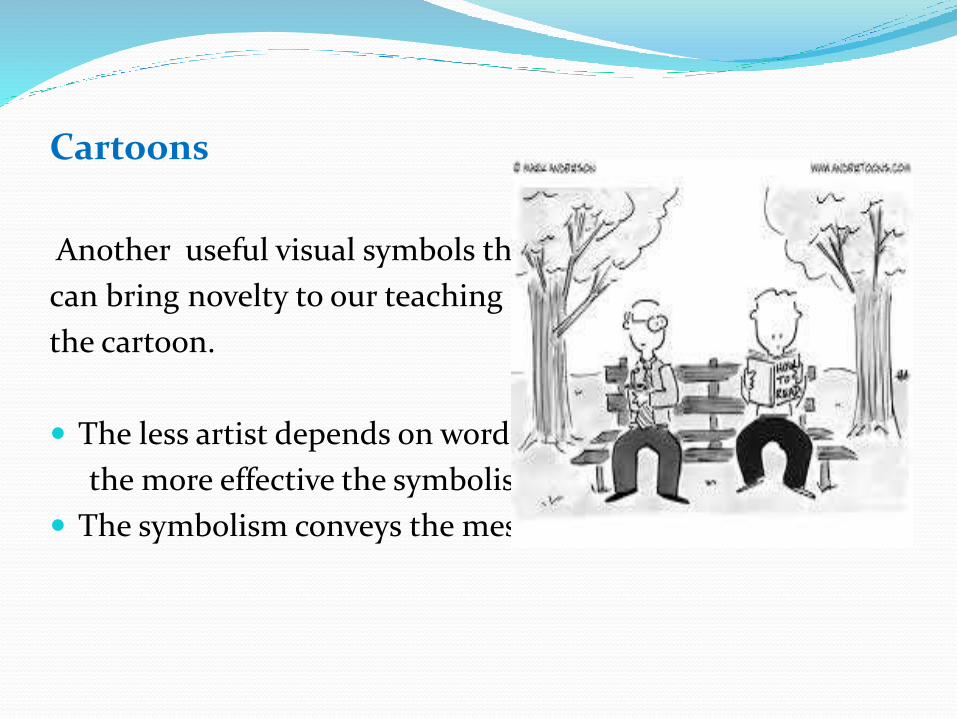
Cartoons
Another useful visual symbols that
can bring novelty to our teaching is
the cartoon.
The less artist depends on words,
the more effective the symbolism.
The symbolism conveys the message.
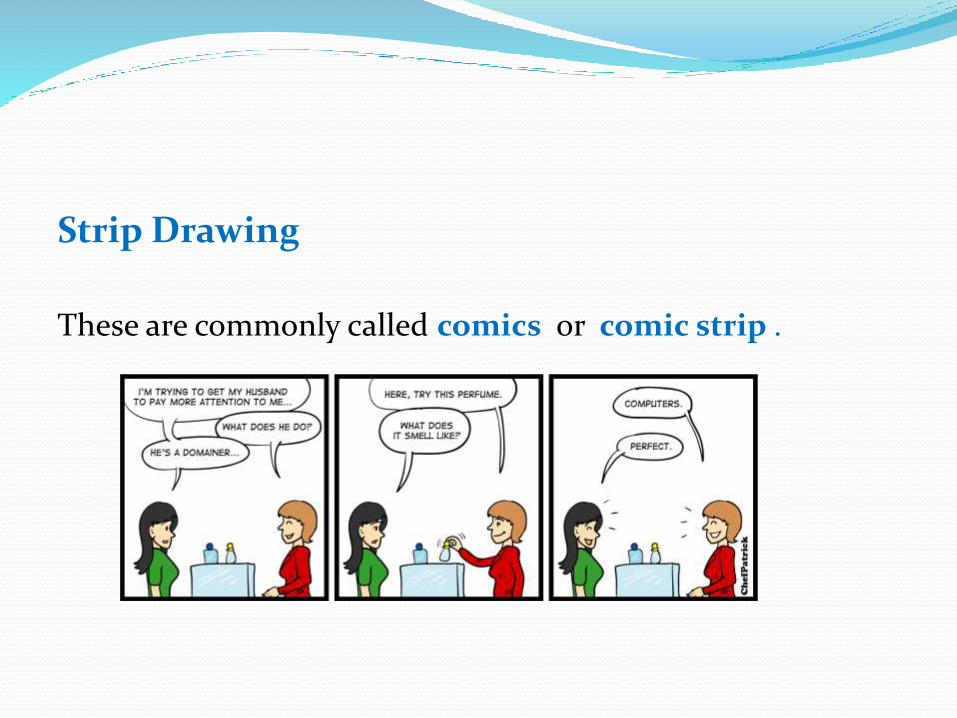
Strip Drawing
These are commonly called comics or comic strip .
Diagrams
It is any line drawing that shows arrangement and relations as of parts to the whole, relative values, origins and development, chronological and fluctuations, distribution.
Examples of Diagram:
Affinity diagram- used to cluster complex apparently unrelated
data into natural and meaningful groups.
Tree diagram- used to chart out, in increasing detail, the
various tasks that must be accomplished to complete a project or achieve a specific objective.
Fishbone diagram- it is also called cause-and-effect diagram. It
is a structured form of brainstorming.
Charts
A chart is a diagrammatic representation of relationships among individuals within an organization.
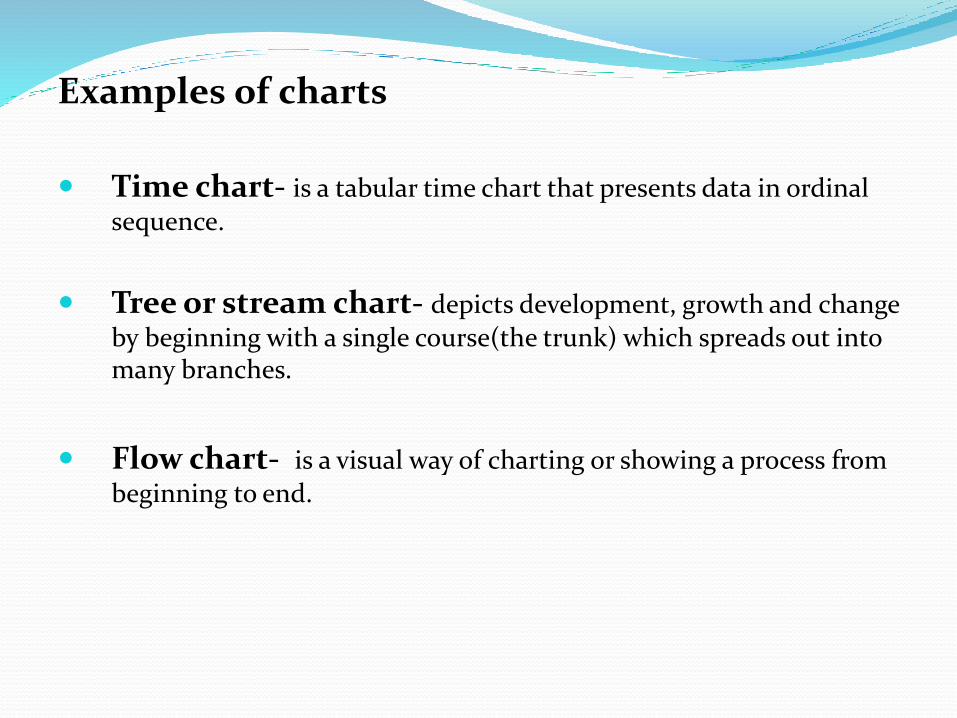
Examples of charts
Time chart- is a tabular time chart that presents data in ordinal
sequence.
Tree or stream chart- depicts development, growth and change
by beginning with a single course(the trunk) which spreads out into many branches.
Flow chart- is a visual way of charting or showing a process from
beginning to end.
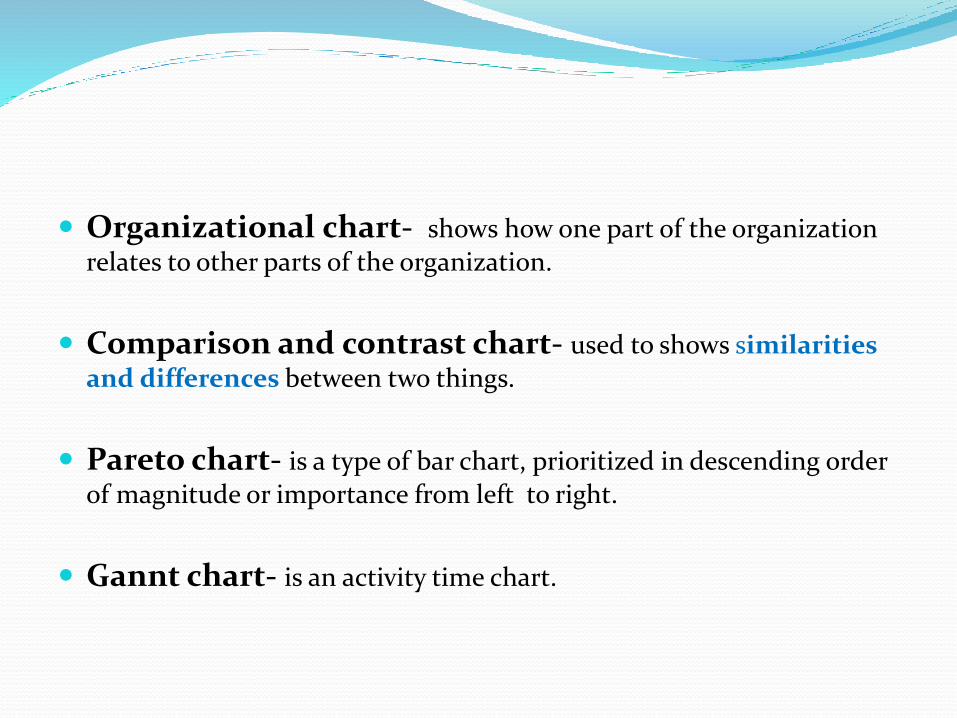
Organizational chart- shows how one part of the organization
relates to other parts of the organization.
Comparison and contrast chart- used to shows similarities
and differences between two things.
Pareto chart- is a type of bar chart, prioritized in descending order
of magnitude or importance from left to right.
Gannt chart- is an activity time chart.
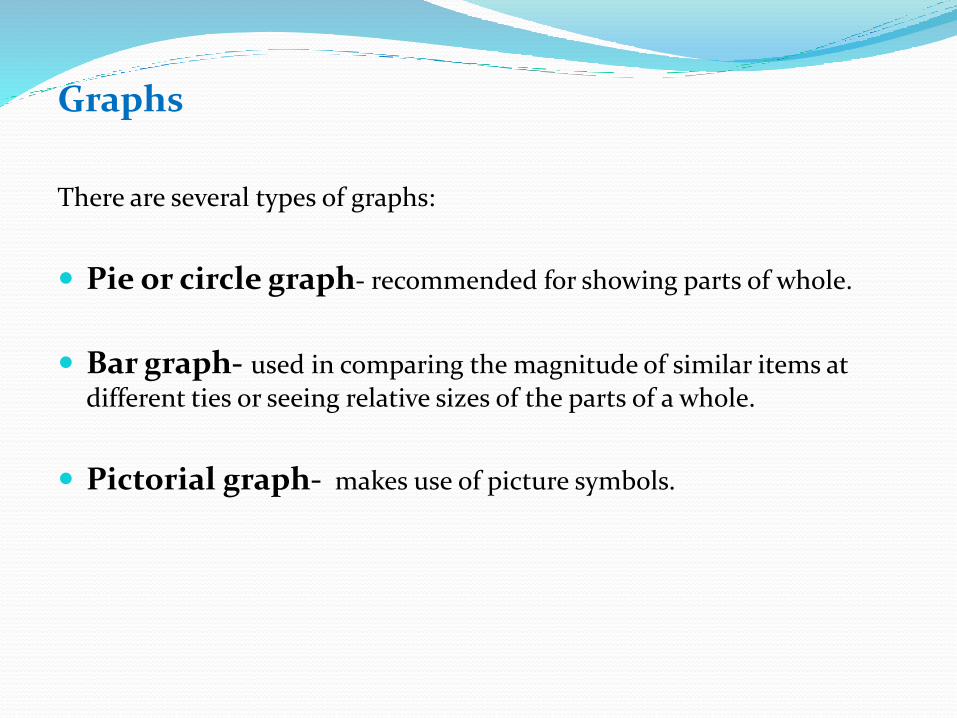
Graphs
There are several types of graphs:
Pie or circle graph- recommended for showing parts of whole.
Bar graph- used in comparing the magnitude of similar items at
different ties or seeing relative sizes of the parts of a whole.
Pictorial graph- makes use of picture symbols.
Maps
A Map is a representation of the surface of the earth or some part
of it.
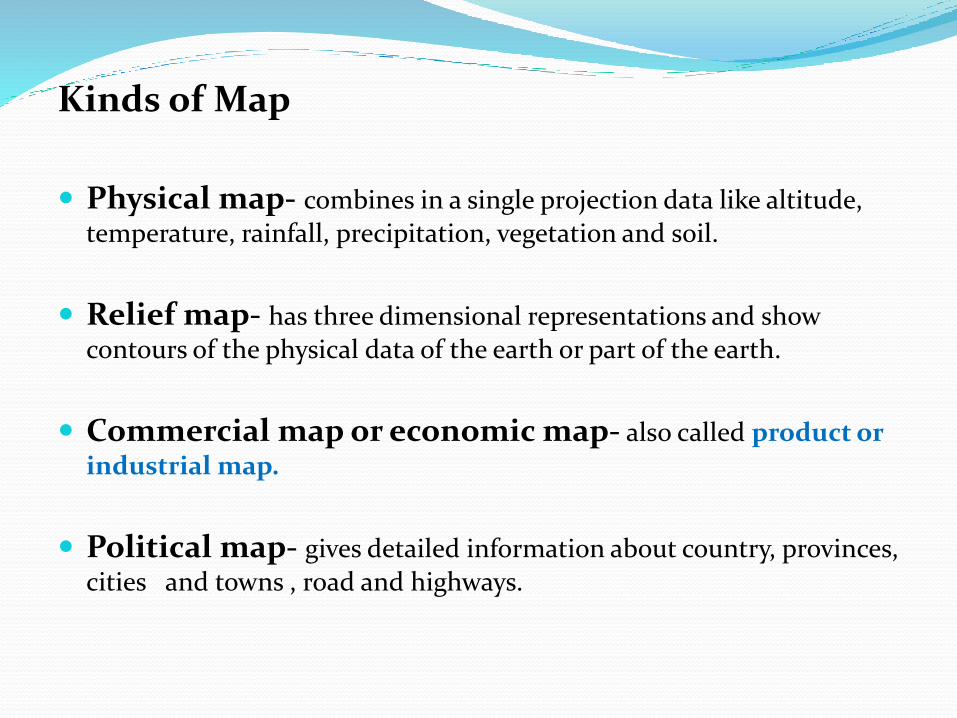
Kinds of Map
Physical map- combines in a single projection data like altitude,
temperature, rainfall, precipitation, vegetation and soil.
Relief map- has three dimensional representations and show
contours of the physical data of the earth or part of the earth.
Commercial map or economic map- also called product or
industrial map.
Political map- gives detailed information about country, provinces,
cities and towns , road and highways.
“Visual symbols will be made meaningful if we can use them as summaries of our own direct experience or our own rich indirect experience…A little can stand for a lot!”

Question
• It is everything clear?
• Who have a question?