visual pigments in the human macula assessed by imaging fundus reflectometry
TRANSCRIPT

Visual pigments in the human macula assessed by imagingfundus reflectometry
Paul E. Kilbride and Kathleen M. Keehan
Multispectral imaging fundus reflectometry and multiple linear regression fitting routines were used tosimultaneously assess the spatial distributions of cone visual pigment and rhodopsin in the human macula.As expected from anatomic studies, the cone visual pigment distribution showed a peak in the central foveaand was elliptical, with the broader axis along the horizontal meridian. The rhodopsin distribution showed aminimum in the fovea and the rhodopsin density increased with eccentricity. Both visual pigment distribu-tions showed striking variability among individuals. These data provide visual pigment distributions in therelatively unexplored parafoveal region. Key words: Rhodopsin, cone visual pigment, macula, fovea,imaging fundus reflectometry.
1. IntroductionImaging fundus reflectometry has been used in the
past to determine noninvasively the spatial distribu-tions of cone visual pigments,l rhodopsin,2-8 and mac-ular pigment9 in the human retina. These measure-ments have provided new information useful indescribing normal visual function and in diagnosing,following, and understanding the processes of retinaldisease. In the case of visual pigments, however, in-vestigators using both imaging and nonimaging reflec-tometry have concentrated on measuring in areas ofthe fundus where either cone visual pigments or rho-dopsin dominate the reflectance signature, i.e., in theperiphery for rhodopsin or in the central fovea for conevisual pigments.' 0 This has left relatively unexploredthe parafoveal region where both cone visual pigmentsand rhodopsin absorb significantly (-4-10). Thisarea is interesting for many reasons, one of which is theappearance in certain maculopathies of a bull's eyelesion surrounding the fovea. This paper describes atechnique by which the rhodopsin and cone visualpigment distributions can be separated and their dis-tributions analyzed independently. We use this tech-nique to determine the rhodopsin and cone visual pig-ment distributions and the average distributions ofthese pigments for ten normal individuals.
The authors are with University of Illinois at Chicago, College ofMedicine, Department of Ophthalmology, 1855 West Taylor Street,Chicago, Illinois 60612.
Received 2 June 1989.0003-6935/90/101427-09$02.00/0.© 1990 Optical Society of America.
II. TheoryIn reflectometry, the reflectance (p) of the fundus is
determined by introducing a known amount of lightinto the eye and measuring the amount of light re-turned:
(1)
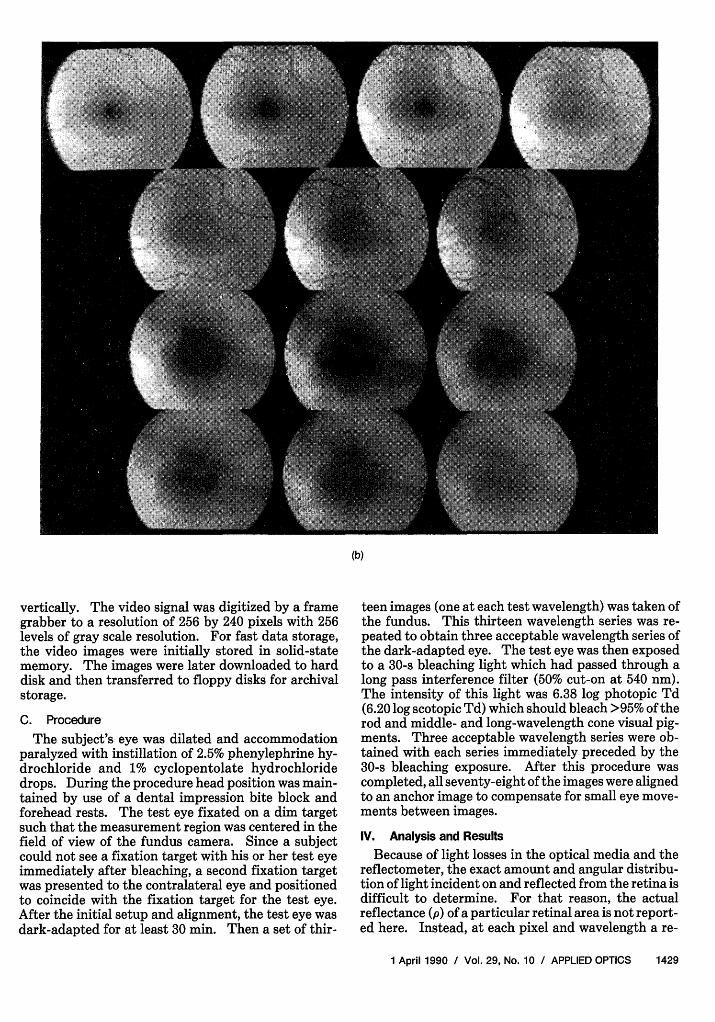
The reflectance of the fundus is determined in part bythe state of light adaptation, as can be seen in Fig. 1.Figure 1(a) shows images of a dark-adapted eye takenunder thirteen different wavelengths of illumination.Figure 1(b) shows images of the same eye after beingexposed to a bleaching light. To determine the densi-ty of visual pigment present in the retina a differencebetween the reflectance of the dark-adapted fundusand the reflectance of the bleached fundus is calculat-ed:
density difference = log(pb/pd), (2)
where Pb is the reflectance of the bleached fundus andPd is the reflectance of the dark-adapted fundus. Thederivation of Eq. (2) assumes that all light reflectedback to the detector has passed twice through thevisual pigment layer. In practice, this is not the case.Scatter in the lens and specular reflections from theinner limiting membrane can introduce light into thedetector that has not passed through the pigment lay-er. Another contributor to this error is light thatpasses through spaces in the photoreceptor matrix.Moreover, the angle at which light strikes the photore-ceptor influences the apparent visual pigment densityas a result of the Stiles-Crawford effect. All of thesesources of error decrease the apparent pigment densi-ties measured by reflectometry. Since these sources oferror are not measurable in an individual, the amount
1 April 1990 / Vol. 29, No. 10 / APPLIED OPTICS 1427
P �_- Ireturnedflintroduced'

(a)
Fig. 1. Spectral set of digitized images (200 by 160) of the fovea taken at thirteen different wavelengths (nm): (top row) 458,478, 499, 519:(second row) 538, 558, 579; (third row) 600, 619, 639; and (bottom row) 658, 679, 700. (a) Dark-adapted. (b) Bleached.
of decrease in the pigment densities is unknown.However, to the extent that these sources of error aresimilar between individuals, the individual pigmentdensities can be compared.
Ill. Methods
A. SubjectsTen subjects with normal vision participated in this
study. All had best-correct Snellen visual acuity of20/20 or better. The mean age of the subjects was 30.5years; the range was 23-44. Informed consent wasobtained from all subjects after the nature of the studywas described to them.
B. ApparatusWith some modification, the imaging fundus reflec-
tometer used in this study has been described previ-ously.9 The use of images allowed us to determine thelight reflected from discrete areas of the retina, while
the use of multiple wavelengths allowed the determi-nation of various wavelength dependent components.This method required an accurate light source for thevarious wavelengths and intensities. This consisted ofa xenon arc (150 W) which was coupled with a neutraldensity wedge and an interference filter wheel. Anelectronic shutter determined the exposure duration.A fiber optic light guide delivered the light to a modi-fied Zeiss fundus camera.
The fundus camera illuminated the eye and imagedthe reflected light for the reflectometric analysis.Light entered the subject's eye in a ring in Maxwellianview. The fundus was viewed down the center of thering. Images were obtained with a microchannel plateintensified, solid-state video camera. This video cam-era had been modified to prevent automatic gainchanges and to allow integration of the video image bythe change injected device (CID) solid-state camera.A lens was placed just in front of the video camera toallow a field of view that was 20° horizontally by 160
1428 APPLIED OPTICS / Vol. 29, No. 10 / 1 April 1990
(b)
vertically. The video signal was digitized by a framegrabber to a resolution of 256 by 240 pixels with 256levels of gray scale resolution. For fast data storage,the video images were initially stored in solid-statememory. The images were later downloaded to harddisk and then transferred to floppy disks for archivalstorage.
C. ProcedureThe subject's eye was dilated and accommodation
paralyzed with instillation of 2.5% phenylephrine hy-drochloride and 1% cyclopentolate hydrochloridedrops. During the procedure head position was main-tained by use of a dental impression bite block andforehead rests. The test eye fixated on a dim targetsuch that the measurement region was centered in thefield of view of the fundus camera. Since a subjectcould not see a fixation target with his or her test eyeimmediately after bleaching, a second fixation targetwas presented to the contralateral eye and positionedto coincide with the fixation target for the test eye.After the initial setup and alignment, the test eye wasdark-adapted for at least 30 min. Then a set of thir-
teen images (one at each test wavelength) was taken ofthe fundus. This thirteen wavelength series was re-peated to obtain three acceptable wavelength series ofthe dark-adapted eye. The test eye was then exposedto a 30-s bleaching light which had passed through along pass interference filter (50% cut-on at 540 nm).The intensity of this light was 6.38 log photopic Td(6.20 log scotopic Td) which should bleach >95% of therod and middle- and long-wavelength cone visual pig-ments. Three acceptable wavelength series were ob-tained with each series immediately preceded by the30-s bleaching exposure. After this procedure wascompleted, all seventy-eight of the images were alignedto an anchor image to compensate for small eye move-ments between images.
IV. Analysis and ResultsBecause of light losses in the optical media and the
reflectometer, the exact amount and angular distribu-tion of light incident on and reflected from the retina isdifficult to determine. For that reason, the actualreflectance (p) of a particular retinal area is not report-ed here. Instead, at each pixel and wavelength a re-
1 April 1990 / Vol. 29, No. 10 / APPLIED OPTICS 1429
flectance factor R(x,y,X) is determined. This reflec-tance factor is the ratio of the radiant intensity of thehuman fundus [Ih(xy,X)] to the radiant intensity of anartificial eye [Ia(x,y,X)] with known reflectance (halonpowder) as a reference:
R(x,y,X) = Ih(x,y,X)IIa(x,Y,X). (3)
This comparison also provides spatial radiometric cor-rection of the images. For the following image analy-sis, the three dark-adapted and three bleached imagestaken at each test wavelength are combined to give oneaverage dark-adapted image and one average bleachedimage. These average images are divided into boxes of1/30 square areas.
For each location on the retina, a density differenceis calculated:
d(x,y,X) = log[Rb(xy,X)IRd(x,y,X)]. (4)
In this analysis the assumption is made that differ-ences between dark-adapted and bleached reflec-tances are due solely to the bleaching of rhodopsin andcone visual pigments. Since rhodopsin and cone visu-al pigments do not absorb light at far red wavelengths,runs that show large density differences at those wave-lengths are excluded. The small changes found in thefar red were not otherwise used to correct the densitydifferences at other wavelengths.
The measured density difference can be describedby the following equation:
d(x,y,X) = br(xy)Nr(X) + b,(xy)Nc(X), (5)
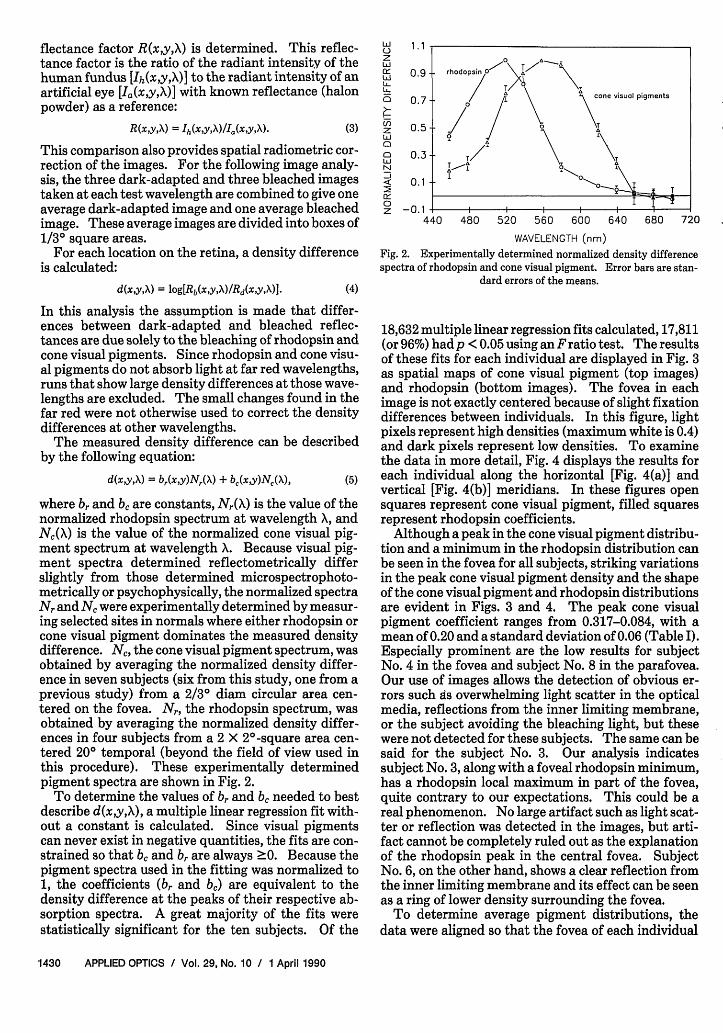
where br and b, are constants, Nr(X) is the value of thenormalized rhodopsin spectrum at wavelength X, andNc(X) is the value of the normalized cone visual pig-ment spectrum at wavelength X. Because visual pig-ment spectra determined reflectometrically differslightly from those determined microspectrophoto-metrically or psychophysically, the normalized spectraNr and NC were experimentally determined by measur-ing selected sites in normals where either rhodopsin orcone visual pigment dominates the measured densitydifference. Nc, the cone visual pigment spectrum, wasobtained by averaging the normalized density differ-ence in seven subjects (six from this study, one from aprevious study) from a 2/30 diam circular area cen-tered on the fovea. N, the rhodopsin spectrum, wasobtained by averaging the normalized density differ-ences in four subjects from a 2 X 20-square area cen-tered 20° temporal (beyond the field of view used inthis procedure). These experimentally determinedpigment spectra are shown in Fig. 2.
To determine the values of br and b, needed to bestdescribe d(xy,X), a multiple linear regression fit with-out a constant is calculated. Since visual pigmentscan never exist in negative quantities, the fits are con-strained so that bc and br are always 20. Because thepigment spectra used in the fitting was normalized to1, the coefficients (br and bc) are equivalent to thedensity difference at the peaks of their respective ab-sorption spectra. A great majority of the fits werestatistically significant for the ten subjects. Of the
Li
Lii
U]
LI
UlC
LuiN
0z
0.9 rhodopsin O' 0
0.7 cone visual pigments
-0.1
440 480 520 560 600 640 680 720
WAVELENGTH (nm)
Fig. 2. Experimentally determined normalized density differencespectra of rhodopsin and cone visual pigment. Error bars are stan-
dard errors of the means.
18,632 multiple linear regression fits calculated, 17,811(or 96%) hadp <0.05 using an Fratio test. The resultsof these fits for each individual are displayed in Fig. 3as spatial maps of cone visual pigment (top images)and rhodopsin (bottom images). The fovea in eachimage is not exactly centered because of slight fixationdifferences between individuals. In this figure, lightpixels represent high densities (maximum white is 0.4)and dark pixels represent low densities. To examinethe data in more detail, Fig. 4 displays the results foreach individual along the horizontal [Fig. 4(a)] andvertical [Fig. 4(b)] meridians. In these figures opensquares represent cone visual pigment, filled squaresrepresent rhodopsin coefficients.
Although a peak in the cone visual pigment distribu-tion and a minimum in the rhodopsin distribution canbe seen in the fovea for all subjects, striking variationsin the peak cone visual pigment density and the shapeof the cone visual pigment and rhodopsin distributionsare evident in Figs. 3 and 4. The peak cone visualpigment coefficient ranges from 0.317-0.084, with amean of 0.20 and a standard deviation of 0.06 (Table I).Especially prominent are the low results for subjectNo. 4 in the fovea and subject No. 8 in the parafovea.Our use of images allows the detection of obvious er-rors such as overwhelming light scatter in the opticalmedia, reflections from the inner limiting membrane,or the subject avoiding the bleaching light, but thesewere not detected for these subjects. The same can besaid for the subject No. 3. Our analysis indicatessubject No.3, along with a foveal rhodopsin minimum,has a rhodopsin local maximum in part of the fovea,quite contrary to our expectations. This could be areal phenomenon. No large artifact such as light scat-ter or reflection was detected in the images, but arti-fact cannot be completely ruled out as the explanationof the rhodopsin peak in the central fovea. SubjectNo. 6, on the other hand, shows a clear reflection fromthe inner limiting membrane and its effect can be seenas a ring of lower density surrounding the fovea.
To determine average pigment distributions, thedata were aligned so that the fovea of each individual
1430 APPLIED OPTICS / Vol. 29, No. 10 / 1 April 1990

Fig. 3. Coefficients for the multiple linear regression fits for cone visual pigment (top image) and rhodopsin (bottom image) for ten subjects.Central gray scale indicates density difference: black = 0, white = 0.4. Central bar gives spatial scale in visual degrees.
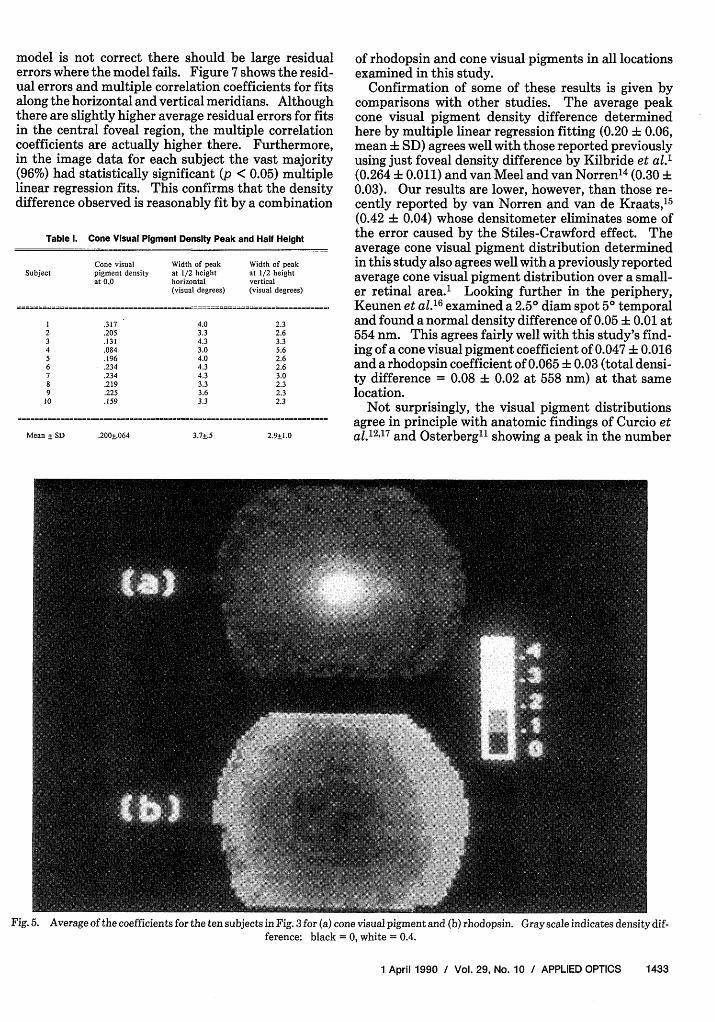
was coincident and then the corresponding cone visualpigment and rhodopsin coefficients at each point wereaveraged. Since each subject had a slightly differentarea of valid data, average coefficients were calculatedonly where there were valid data for four or moreindividuals. Figure 5 shows the calculated averages forcone visual pigment [Fig. 5(a)] and rhodopsin [Fig.5(b)]. As in Fig. 3, light pixels correspond to highdensities, dark pixels to low densities. An ellipticitycan be seen in these images but may be better appreci-ated in contour plots of the average cone visual pig-ment data [Fig. 6(a)]. The horizontal vs vertical me-ridian half heights for each individual are given inTable I. The widths at half height for the cone visualpigment distributions range from 3.0-4.3° with a meanof 3.7° horizontally and from 2.3-5.6° with a mean of2.90 vertically. Also interesting, the center of the iso-density contours for the average rhodopsin distribu-tion is shifted slightly nasally [Fig. 6(b)].
Figure 7 shows the average cone visual pigment andrhodopsin coefficients along the horizontal [top of Fig7(a)] and vertical [top of Fig. 7(b)] meridians. As inFig. 4, the open symbols represent the cone visualpigment, filled symbols represent rhodopsin. In theregion 2-6° in radius, both cone visual pigment andrhodopsin contribute significantly to the density dif-ference spectrum. Figure 7 also shows two indicators
of the closeness of fit spatially: the averages ofsquared multiple correlation coefficients (middleplots) and averages of summed squared errors (bottomplots) for fits along the horizontal and vertical meridi-ans. The error bars for all the plots in Fig. 7 arestandard deviations.
V. DiscussionThe separation of rhodopsin from cone visual pig-
ment density difference in the multispectral images iscritically dependent on how pure the normalized rodand cone spectra are. Our density difference spectrataken from the region 20° temporal in four subjectsshould be largely rhodopsin.11"12 The cone visual pig-ment was taken from the central 2/30 diam regionwhich is well within the estimates of the rod-free zone(1.80 diam by Polyak13; 1.250 diam by Curcio et al.1
2).
Thus, the separation of the multispectral data intorhodopsin and cone visual pigment density differencesshould be reasonably accurate.
As mentioned previously, the model used to derivethe results shown in Figs. 3-7 assumes that the differ-ence in reflectance after the retina has been exposed toa bleaching light can be described as the bleaching ofsome combination of rhodopsin and cone visual pig-ment. One test of this theory is to examine the close-ness of fit for many locations on the retina. If the
1 April 1990 / Vol. 29, No. 10 / APPLIED OPTICS 1431

(a)
0o
0 N
I0.4
-0.3
-0.2
-0.1
0.0
-0. 1
-0.4
-0. 0CD -0
0 0
0
0 0'o
0
0E½-ra
I 0l l l l l l l l l
.- 0.4
- 0.3
.-0.2
--0.1
0.0
-0.1
I0.4
-0.3
-0.2
-0.1
0.0
-0.1
-10 -8 -6 -4 -2 0 2 4 6 8 10
Nasal Temporal
0.4
0.3
0.2
*0.1
*0.0
-n
0.4
0.3
0.2
1 01.
0.0
-0 1
2
0.4
0.3
0.2
,3 0.10.0
-0.1 -
0.4-
0.3 --
0.2 -5 0.1-
0.0
-0. 1
6
0.4-
0.3
0.2 .-7
0.1
100
-
8
0.4
0.3
0.29 0.1
0.0
-0.1
I10
Infl
(b)
0i3oD
0 o
0 0
o o
o o
0.4
1 0.3
.-0.2
.-0. 1
0.0
-0. 1
0.4
0.3
10.2
0.01
0.0
-0.
o Da
* o F
o o
0."
00
00o a00 0
b _~~~~~0
-0.4
.-0.3
.-0.2
-0.1
-0.0
-0.1
0.4
-0.3
-0.2
-0.1
-0.0
-- 0.1
0~p0 0
O 0
-0.4
-0.3
0C,0 ~~~~~-0.2DP 0 -0.1
. .11 - - ~~~~~-0.0I- i i I -- 0.1
) -8 -6 -4 -2 0 2 4 6 8 10
erior SuperiorVISUAL DEGREES VIbUAL UUNILL
Fig. 4. Cone visual pigment (open squares) and rhodopsin (filled squares) distributions along (a) horizontal and (b) vertical meridians for tensubjects.
1432 APPLIED OPTICS / Vol. 29, No. 10 / 1 April 1990
0.4 --
0.3
0.2 --
0.1
0.0
-0. 1
1--z1
00
1--
0
/1
U. I+ .
0.3-
0.2-
0.1 -
0.0--
-0.1
0.4 -
0.3-
0.2-
0.1
0.0
-0.1
0.4--
0.3--
0.2 -
0.1 -.
0.0
-0. 1
0.0 -
-0.1 -iii
0a P,:,p 000
a 0
MA
.r&,
Do0
. .
model is not correct there should be large residualerrors where the model fails. Figure 7 shows the resid-ual errors and multiple correlation coefficients for fitsalong the horizontal and vertical meridians. Althoughthere are slightly higher average residual errors for fitsin the central foveal region, the multiple correlationcoefficients are actually higher there. Furthermore,in the image data for each subject the vast majority(96%) had statistically significant (p < 0.05) multiplelinear regression fits. This confirms that the densitydifference observed is reasonably fit by a combination
Table 1. Cone Visual PIgment Density Peak and Half Height
Cone visual Width of peak Width of peakSubject pigment density at 1/2 height at 1/2 height
at 0,0 horizontal vertical(visual degrees) (visual degrees)
I .317 4.0 2.32 .205 3.3 2.63 .131 4.3 3.34 .084 3.0 5.65 .196 4.0 2.66 .234 4.3 2.67 .234 4.3 3.08 .219 3.3 2.39 .225 3.6 2.3
10 .159 3.3 2.3
Mean + SD .200±.064 3.7+.5 2.9±1.0
of rhodopsin and cone visual pigments in all locationsexamined in this study.
Confirmation of some of these results is given bycomparisons with other studies. The average peakcone visual pigment density difference determinedhere by multiple linear regression fitting (0.20 + 0.06,mean + SD) agrees well with those reported previouslyusing just foveal density difference by Kilbride et al.'(0.264 + 0.011) and van Meel and van Norren14 (0.30 ±0.03). Our results are lower, however, than those re-cently reported by van Norren and van de Kraats,' 5
(0.42 + 0.04) whose densitometer eliminates some ofthe error caused by the Stiles-Crawford effect. Theaverage cone visual pigment distribution determinedin this study also agrees well with a previously reportedaverage cone visual pigment distribution over a small-er retinal area.' Looking further in the periphery,Keunen et al.16 examined a 2.50 diam spot 50 temporaland found a normal density difference of 0.05 I 0.01 at554 nm. This agrees fairly well with this study's find-ing of a cone visual pigment coefficient of 0.047 + 0.016and a rhodopsin coefficient of 0.065 + 0.03 (total densi-ty difference = 0.08 0.02 at 558 nm) at that samelocation.
Not surprisingly, the visual pigment distributionsagree in principle with anatomic findings of Curcio etal.12"17 and Osterberg" showing a peak in the number
Fig.5. Average of the coefficients for the ten subjects in Fig.3 for (a) cone visual pigment and (b) rhodopsin. Gray scale indicates density dif-ference: black = 0, white = 0.4.
1 April 1990 / Vol. 29, No. 10 / APPLIED OPTICS 1433

8 . . . . . . . 8
-2 0 2
VISUAL DEGREES
L
URLaJ0-
UD
U)
LU)LUCDLU)
-j
CZ)
C
0
L
a)f--
6
4
2
0
-2
-4
-6
-7
32d20.5
X~~~~~~~~~~~~~~~~~~~~~~~~~~~~~~~~~~~
0~~~~~~~~~~1
0
- D \ o , - gv
Fig.6. Contour plots of the data shown in Fig.5 for average (a) conevisual pigment and (b) rhodopsin.
(a)
4 6
Temooral
_ -8 L8 -8 -6 -4 -2 0 2
Nasal VISUAL DEGREES
(b)
0 -8 -6 -4 -2 0 2 4 6 8 1 0
0.4- -
0.3 -
0.2 -
0.1 -
0.0
-0.1 I-10 -8 -6 -4 -2 0 2 4 6 8 1
0.8-
N 0.6-
0.4-
0.2-
0.0
0
wof
0.020 -
0.015 -
0.010-
0.005 -
I i - - 0 2 i 8 I
10 -8 -6 -4 -2 0 2 4 6 8 1 0
1.0---- --
0.8 -
0.6 -
0.4 -
0.2 -
0.0 -10 -8
0.020T
0.0 1 5
t
0.010-
0.005 i-
n1 nnn, I I
IJ.ULJLJI u~uuu~-iU.UU I 1 -i 1 I I . --- - I.U
-10 -8 -6 -4 -2 0 2 4 6 8 10 -10 -8 -6 -4 -2 0 2 4 6 8 10Nasal Temporal Inferior Superior
VISUAL DEGREES VISUAL DEGREES
Fig. 7. Average cone visual pigments (open squares) and rhodopsin (filled squares) distributions, multiple correlation coefficients, andresidual errors along the (a) horizontal and (b) vertical meridians. Error bars are standard deviations.
1434 APPLIED OPTICS / Vol. 29, No. 10 / 1 April 1990
L0
,L̂0J
U)
ClLULU
LU
-J
U)
L0
Lj
C
L
4
2
0
-2
-4
-6
-8_I -4-6
Nasal
4 6
Temporal
0.4-
n 0.3-
I 0.2-
U 0.1-LUJ0C 0.0
-0.1)
0
V)
. . . . . . . . . . .
l
TT T
�]Mj= I I .1 F I 1, I . ......I
k' III '���T . t -
14T T T R-
-I -I 3l 1 -�! I .-
l l l l l l l l l l l. . . . . . . . . l l l ll l l
I . U .... _._.. .v||TI .. II . ... . _ _ _ _ - I - T
I
l
8B
I _
I J, IQ, &, 1 14, 1 I �, I U11I I
�-LI I II

of cones per square area in the fovea. These anatomicstudies find a much steeper drop on the number ofcones as one leaves the fovea than the drop found incone visual pigments in this study. This could be dueto both smaller retinal sampling sizes in the fovea incone counting experiments and anatomic differencesin the ratio of pigment per cone spatially.
The large variation in peak cone visual pigmentdensity found in this study is not unexpected. Al-though this variation could be due to some confound-ing error of which we are not currently aware, it is notan unusual range compared to anatomic data. Curcioet al.12 found a more than threefold difference in thepeak number of cones per unit area in the central foveafor seven subjects. Although cone counts do not nec-essarily imply pigment density for the reasons men-tioned in the previous paragraph, large variation inpeak cone counts does introduce the possibility of largevariation in measured cone visual pigment density.
As mentioned previously, the results of this studyshow a slight ellipticity in the distribution of conevisual pigment. We find the cone visual pigmentshave a radially asymmetric distribution with higherdensities found along the horizontal meridian [Figs.4(a) and 5(a)]. This asymmetric distribution is ingood agreement with our earlier mapping of cone visu-al pigment density difference and the anatomic workof Curcio et al.1217 on foveal cone count distributions.
The rhodopsin density difference is at a minimum inthe fovea which is in agreement with anatomic data.Because of the variability present as the fitting coeffi-cient of rhodopsin (br) gets close to zero the center ofthe rhodopsin minimum is difficult to determine. Thecenters of the rhodopsin coefficient contours [Fig.5(b)] are slightly displaced nasally which is in agree-ment with the nasal displacement of rod count con-tours obtained by Curcio et al.12
VI. ConclusionThe multiple linear regression fitting of density dif-
ference to rhodopsin and cone visual pigment spectraspatially provided the means to determine spatial dis-tributions of cone visual pigment and rhodopsin. Asexpected, cone visual pigment density peaked in thecentral fovea and decreased with eccentricity. Therhodopsin distribution showed a minimum in the foveaand increased with eccentricity. The annular region2-6° radius (Fig. 7) has significant amounts of bothrhodopsin and cone visual pigment. Whether theshapes of these distributions contribute to the in-creased vulnerability of this region to maculopathieshas yet to be determined.
The authors thank Neal S. Peachey, Kenneth R.Alexander, and Gerald R. Fishman for helpful com-
ments on the manuscript, and Marlos Viana for hishelp with the statistical analyses. Some of the compu-tations for this study were done on an Alliant FX/8with access time provided by the National Center forSupercomputing Applications (NCSA) at the Univer-sity of Illinois at Urbana-Champaign. This researchwas supported by NEI grant EY06589.
References1. P. E. Kilbride, R. S. Read, G. A. Fishman, and M. Fishman,
"Determination of Human Cone pigment Density DifferenceSpectra in Spatially Resolved Regions of the Fovea," Vision Res.23, 1341-1350 (1983).
2. K. Mizuno, A. Majima, K. Ozawa, and H. Ito, "Fundus Photog-raphy in Ref-Free Light (Rhodopsin Photography)," VisionRes. 8,481-482 (1968).
3. V. N. Highman and R. A. Weale, "Rhodopsin Density and VisualThreshold in Retinitis Pigmentosa," Am. J. Ophthalmol. 75,822-832 (1973).
4. U. B. Sheorey, "Clinical Assessment of Rhodopsin in the Eye,"Br. J. Ophthalmol. 60, 135-141 (1976).
5. T. Tanino and N. Ohba, "Photographic Retinal Densitometry inthe Living Human Eye," Jpn. J. Ophthalmol. 21, 227-241(1977).
6. C. M. Kemp and D. J. Faulkner, "Rhodopsin Measurement inHuman Disease: Fundus Reflectometry Using Television,"Dev. Ophthalmol. 2, 130-134 (1981).
7. D. J. Faulkner and C. M. Kemp, "Human Rhodopsin Measure-ment Using a TV-based Imaging Fundus Reflectometer," VisionRes. 24, 221-231 (1984).
8. A. E. Elsner, S. A. Burns, and R. H. Webb, "PhotopigmentConcentration in Normal and Photocoagulated Human Tissue,"Invest. Ophthalmol. Vis. Sci. 30 (suppl.), 370 (1989).
9. P. E. Kilbride, K. R. Alexander, M. Fishman, and G. A. Fishman,"Human Macular Pigment Assessed by Imaging Fundus Reflec-tometry," Vision Res. 29, 663-674 (1989).
10. For review see P. E. Kilbride and H. Ripps, "Fundus Reflecto-metry," in Noninvasive Diagnostic Techniques in Ophthalmol-ogy, B. R. Masters, Ed., (Springer-Verlag, New York, 1990), inpress.
11. G. Osterberg, "Topography of the Layer of Rods and Cones inthe Human Retina," Acta Ophthalmol. Suppl. 6, 1-102 (1935).
12. C. A. Curcio, K. R. Sloan, R. E. Kalina, and A. E. Hendrickson,"Human Photoreceptor Topography," J. Comp. Neurol., inpress (1990).
13. S. L. Polyak, The Retina, U. Chicago Press, Chicago (1941).14. G. J. van Meel and D. van Norren, "Foval Densitometry in
Retinitis Pigmentosa," Invest. Ophthalmol. Vis. Sic. 24, 1123-1130 (1983).
15. D. van Norren and J. van de Kraats, "Retinal Densitometer withthe Size of a Fundus Camera," Vision Res. 29, 369-374 (1989).
16. J. E. E. Keunen, G. J. van Meel, D. van Norren, V. C. Smith, andJ. Pokorny, "Retinal Densitometry in Acute Posterior Multifo-cal Placoid Pigment Epitheliopathy," Invest. Ophthalmol. Vis.Sci. 30, 1515-1521 (1989).
17. C. A. Curcio, K. R. Sloan Jr., 0. Packer, A. E. Hendrickson, andR. E. Kalina, "Distribution of Cones in Human and MonkeyRetina: Individual Variability and Radial Asymmetry," Sci-ence 236, 579-582 (1987).
1 April 1990 / Vol. 29, No. 10 / APPLIED OPTICS 1435