visual person searches for retail loss detection ... · visual person searches for retail loss...
TRANSCRIPT

Visual Person Searches for Retail Loss Detection: Application and Evaluation
A.W.Senior, L. Brown, C.-F.Shu, Y.-L.Tian, M. Lu, Y. Zhai, A. Hampapur
aws @ us.ibm.comIBM T. J. Watson Research Center, PO Box 704,
Yorktown Heights, NY 10598, USA.
Abstract
We describe a novel computer-vision based system for facilitating the search for people across multiple non-overlappingcameras. The system has been applied in a retail environment for a variety of problems, most specifically for returns fraudprevention. The system detects and tracks people in multiple cameras and enables rapid cross-camera association of tracks.We have created a human-centred application wherein machine-detected events are browsed and associated in a web-baseduser interface by a loss-prevention specialist. The system has been tested in a real store environment and we develop a varietyof performance measures for the task and present results with a breakdown of error types.
1. IntroductionClosed Circuit Television (CCTV) has long been used within shops for the detection of shoplifting. CCTV systems havebeen proven to have a variety of uses to justify investment— as deterrent, record for insurance claims, public safety, stocktracking and employee fraud detection— but they are still costly and very labour intensive. A typical shop may have dozensof cameras but full coverage of the store can only be achieved with the use of Pan-Tilt-Zoom cameras steered and zoomed toa particular area of interest. While an operator may passively monitor as many as half a dozen monitors, showing differentareas of a shop, active control of only one or at most two cameras is possible, and only one subject can be actively tracked ata timeimplying loss of attention on the rest of a store while one person is being observed.
The development of automated visual surveillance systems promises to provide much greater exploitation of the manychannels of video being acquired and recorded in a typical shop. Computer algorithms can continuously monitor multiplechannels of video, detecting and tracking customers, employees and stock with unrelenting vigilance. Thus far, however, thealgorithms fall far short of the human capabilities for scene and activity understanding and recognition of people.
In our Retail Loss Prevention system we have created a first-of-a-kind computer tool to automatically process and indexmany channels of video to enable a human operator rapid access to relevant data needed in a store environment.
1.1. Shrinkage“Shrinkage” is a catch-all term to describe a shortfall in the accounts of retail stores. Stores in developed countries may havea shrinkage of 1–2% of sales [1–3], as indicated by comparing stock levels with the difference between deliveries and sales,but the causes of this shrinkage are usually unknown. Shrinkage is unnecessary loss which businesses are keen to reduce, butreduction is only possible after identifying the causes of shrinkage in a particular retail sector, chain or store.
The main types of shrinkage are:
• Clerical error (miscounting stock, accounting errors)• Misplaced or “lost” stock• Shoplifting• Employee theft• Theft by supplier• Returns fraud• Tag switching (putting a low-price tag on an expensive item)• Sweethearting (employee-customer collusion to obtain discounts or merchandise)
Video surveillance can play a part in reducing all of these sources of shrinkage. In this paper we describe an automatedvideo surveillance system that was developed specifically to detect occurrences of Returns Fraud. This system was developedwithin the context of an integrated in-store digital surveillance deployment by Anon Corporation to measure and counterall kinds of shrinkage. The complete solution involved the deployment of more video cameras particularly targeted at de-partments with high shrinkage, and the integration with digital video recorders to provide easier access to stored video forreview.

1.2. Returns Fraud Prevention
Returns fraud can take one of a number of forms. One of these is the return of items that are not eligible for return (broken, outof policy window) but a more serious problem is that of returning items that were never bought, as recently made headlinesafter U.S. President George Bush’s top domestic political advisor Claude Allen was accused of committing $5000 worth ofreturns fraud: “Authorities accuse Allen of going to stores on more than 25 occasions and buying items, taking them to hiscar and then returning to the store with his receipt where he would carry out the alleged scam.” [4].
This type of return involves a person buying an item and taking it away, then returning to the store with the receipt, takinganother of the items from the shelf and taking it to customer service, asking to return it for a refund. In some stores a liberalrefund policy means that a receipt (and hence purchase) is not even necessary.
A number of possible solutions present themselves before considering video, including the requirement for a receipt, anda stricter returns policy, placement of customer service at the front of the store, unique serial numbers scanned at purchase(rather than product-type codes) or even RFID tracking of items. All of these methods have drawbacks, principally cost andoperational complexity, but also fears of impact on customer satisfaction. In this case, the retail store elected to exploit anexisting video infrastructure to determine whether it can be used to detect returns fraud.
2. Related work
Several previous works have addressed tracking people in retail environments, indeed the PETS 2002 [5] workshop was basedaround video recorded in a shopping mall, with tasks of counting people passing and standing in front of a shop window.Haritaoglu et al. [6] described a system for counting shopping groups waiting in checkout lanes. Several companies offervideo-based people tracking solutions for retail environments, from people counting at entrances and tracking throughout astore (e.g. Brickstream, ShopperTrak) These solutions tend to be designed around top-down camera views useful only for thespecialized vision system, indeed the latter requires stereo cameras, as does some previous research [7].
Our approach, detailed in the following section, involves detecting and tracking customers at entrances and customerservice and associating the two events. A number of authors have tackled the automatic hand-off of tracked objects betweencameras. Many of these have relied on overlapping fields of view for track association [8], although providing completecoverage in a store (often with low ceilings and high shelves) may be costly Wolfe et al. [9] made a system that used low-cost,low-resolution IR sensors for through-store tracking. Other work has used learned temporal constraints for relating tracks innon-overlapping cameras [10]. In the case where there is no overlap and poor temporal correlation (such as significantphysical separation, large numbers of objects, or irregularities of movement such as traffic lights that can group separatedobjects into tight pulses) then object appearance must be used. Strong recognition methods (such as face recognition, licenseplate recognition) may provide the solution where dedicated cameras can be placed to obtain sufficient quality images.Otherwise, colour-based methods have been used, although these are susceptible to problems in normalizing across differentlighting conditions and camera characteristics [11]. Shan et al. [12] have used edges to recognize vehicles across differentcameras.
3. A vision-based solution
In this work the approach to prevention of returns fraud is to verify for each requested return transaction (or each onemeeting certain criteria of value or suspicion) whether the person entered the store with the article they were returning. Sucha solution only requires cameras at the store entrances and returns counters with customer matching between the two views,and is simpler than an approach where the customer is tracked throughout the store and must be continuously monitored todetermine whether items are picked up. Such an approach would require far more cameras and processing and be subject toerrors in camera hand-off as well as the difficulty of reliably detecting when merchandise is picked up.
A store layout is shown in Figure 1. Two cameras at the customer service counter record activity there, including capturingthe appearance of customers returning items. A separate set of cameras points at the doors and capture all activity of peopleentering and leaving the store. Figure 2 shows the fields of view of some of these cameras. (All cameras are conventionalstore surveillance NTSC video cameras. Although they have Pan-Tilt-Zoom capability, this is used only for flexibility ofinitial set up, and the orientations were fixed, with a wide angle view, during this study.)
Our approach to returns fraud is to segment automatically events in each of these cameras, to filter them and then providea user interface to allow the association of returns events with a corresponding door entrance event showing when the personcomes into the store. Figure 3 shows one view of the interface, which is explained in more detail in Section 4.2. Fundamentalto the application are the events detected through the use of visual tracking algorithms and displayed in the interface panes atbottom left and bottom right.
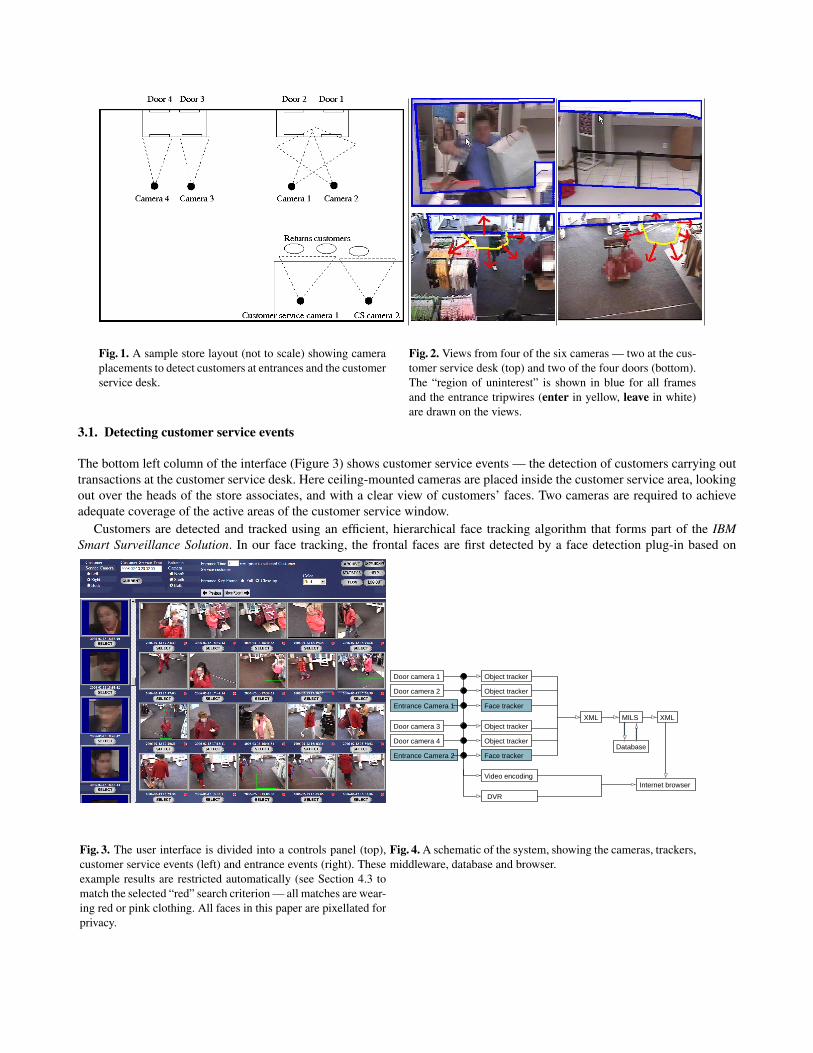
Fig. 1. A sample store layout (not to scale) showing cameraplacements to detect customers at entrances and the customerservice desk.
Fig. 2. Views from four of the six cameras — two at the cus-tomer service desk (top) and two of the four doors (bottom).The “region of uninterest” is shown in blue for all framesand the entrance tripwires (enter in yellow, leave in white)are drawn on the views.
3.1. Detecting customer service events
The bottom left column of the interface (Figure 3) shows customer service events — the detection of customers carrying outtransactions at the customer service desk. Here ceiling-mounted cameras are placed inside the customer service area, lookingout over the heads of the store associates, and with a clear view of customers’ faces. Two cameras are required to achieveadequate coverage of the active areas of the customer service window.
Customers are detected and tracked using an efficient, hierarchical face tracking algorithm that forms part of the IBMSmart Surveillance Solution. In our face tracking, the frontal faces are first detected by a face detection plug-in based on
MILS
Database
XML
Internet browser
Door camera 1
Entrance Camera 1
Door camera 2
Object tracker
Object tracker
Face tracker
Object tracker
Object tracker
Face tracker
Door camera 3
Door camera 4
Entrance Camera 2
Video encoding
DVR
XML
Fig. 3. The user interface is divided into a controls panel (top),customer service events (left) and entrance events (right). Theseexample results are restricted automatically (see Section 4.3 tomatch the selected “red” search criterion — all matches are wear-ing red or pink clothing. All faces in this paper are pixellated forprivacy.
Fig. 4. A schematic of the system, showing the cameras, trackers,middleware, database and browser.

the OpenCV frontal face detector [13] with a background-difference motion filter to filter out false alerts. For continuouslydetected faces, a simple and efficient blob tracking method is employed to track the face based on size and location and toupdate the track model, track history and track state. The track model includes the track image, mask, and size. The trackhistory includes the track length, area, and position. The track state indicates whether the track is an incipient track or astable track. An incipient track will become stable if it continually exists for N frames. In our system, we set N = 2. Tokeep tracking the customer when the face detector failed or the customer turns away, a mean shift tracker is activated onlywhen the track of the face region is stable. When the mean-shift tracker is running, only the track history and track stateare updated. Combining the simple blob-based face tracker and mean-shift tracker brings the following advantages: a) it isless error prone compared to using mean shift all the way through, as in the long run mean shift can be distracted by similarcolored background objects; b) the model distributions are updated more reliably which is harder to perform if mean shift isused all the time; c) it is much faster and more efficient. In the experiments, it was observed that this hierarchical structureperforms 5 to 6 times faster compared to using mean shift alone.
3.2. Detecting Entrance eventsThe lower right hand pane of the interface (Figure 3) shows entrance events — keyframes of every person detected entering thestore. The entrance events are detected using the Colour Field tracker from the IBM Smart Surveillance Solution. A separatetracker runs independently on each of four cameras — one for each customer entrance to the store. Detecting entrance eventsfrom the store doors is a challenging task, because of lighting, geometry and the presence of distracting motion (particularlyof the doors). Here the resolution obtained is barely enough for face detection, and the angle obtained from ceiling-mountedcameras decreased the performance of face detection further. While the cameras can be directed at the glass doors to framecompletely customers entering, bright back lighting during the day, and complex, heavily occluded motion beyond and ofthe doors led us to point the cameras more steeply down into the more constantly illuminated carpet. Since this pilot useddedicated cameras, we were free to position and steer both customer service and entrance cameras, but we had no influenceon the store environment such as layout, lighting and backgrounds.
Doors present an additional complexity in that their movement generates large scene changes that are not of interest in ourapplication, but are not modelled with background subtraction. By angling the cameras down, most of the door area was outof the cameras’ fields of view, but the remaining visible door area was marked as an “region of uninterest” that is eliminatedfrom background subtraction calculations.
On these scenes (example frames are shown in Figure 2) we applied an adaptive background subtraction algorithm [14]which is a fast multiple-Gaussian algorithm that provides robustness to changes of lighting and shadows. This algorithmproduces a foreground mask indicating moving objects that are not explained by the background model.
These foreground regions are then tracked using our “Colour Field” probabilistic appearance model tracking algorithm,earlier versions of which have been described in [15]. This models the shape and appearance of objects and allows pixel-wiseresolution of occlusions of multiple objects, with continuous identity maintenance of objects during visual occlusions.
All detected activity is tracked and stored in the system’s database. Much of the scene activity is not relevant for the ReturnsFraud Prevention (RFP) task, and is not presented to users of the RFP interface, but is available through other interfaces forcarrying out other search tasks (Section 6. The selective presentation of relevant material is carried out by using the instantalerts feature of the system to filter out only those tracks that correspond to a person entering the door. A directional tripwireis drawn (in the image plane) in front of the door, and tracks crossing the tripwire are flagged as “entrance” events. Since thedoor region itself is marked as “uninteresting”, detection of objects only takes place infront of the door region, so the tripwireis bowed out in front of the threshold, as shown in Figure 2.
The tripwire alert described above has the disadvantage that it can be triggered by in-store traffic moving in front of thedoor. To deal with this problem, we developed a new “Region” alert that gave better detection of people entering the store,based around a Region of Interest instead of a linear tripwire. The region alert can be configured to be triggered by thebehaviour of different parts of the object (head, foot, whole area) but here it suffices to use the centroid (as for the tripwire).A variety of rules for the behaviour of the object part are available, in this case we select the behaviour “starts in and thenleaves”. Thus the alert is triggered when the object centroid leaves the region, but only for objects whose centroids startedin the region. Since the region is in front of the door, this is triggered by people entering the door, but removes the tripwirefalse-alarms that are generated by cross-traffic in front of the door (since they do not start in the region).
3.3. Keyframe generationThe automatic tracking systems outlined above partition the video stream into a set of discrete events of interest. These eventscan be reasoned with (counting, looking at object appearance, trajectory etc.) and can be seen as a quantization and filtering of

the video which allows more concise summarization and representation to the user. In this interface the events are presentedto the user through keyframes, and we have experimented with different policies for keyframe extraction and presentation toprovide the most informative visualization of the video activity.
In the current user interface, each event is represented by two keyframes. The first uses the default keyframing policy ofthe tracking system, which is to present the full frame view of the video when the tracked object had the largest visible area.(Which correlates to it being closest to the camera and fully entered into the frame and thus with most recognizable details).Onto this frame, are drawn the bounding box (to distinguish which object the track represents if several are moving in thescene at once) and the trajectory of the object with direction indicated by colour gradient and a “track start” icon.
The second keyframe is a “zoomed-in” view which shows a close-up of the tracked object. In the case of the face tracker,this is just the detected face region (selected to be the frontal face with the maximum area in the track). For the entrancetracker, a head detection algorithm is used to try to extract image regions that correspond to the head-and-shoulders of thetracked person. This process uses two strategies for head detection, assigning a score Qf to the “quality” of the regionextracted. A history of such regions is maintained and only the best four for the track are stored in the database, with a biasto return temporally separated frames.
The first stage in the head detection is to apply the face detector in the upper half of the detected object. Since small areasare considered, this operation is fast. A match is rare, because of the poor resolution and pose of faces in the entrance views,but when one occurs it is given a high score. If this fails, a heuristic is applied to extract the upper portion of the trackedobject. Scores are composed of several heuristic measures:
Qf = 3−H +S
Awhen a face is detected (1)
= P + C +S
Aotherwise (2)
The heuristics measure whether a head-and-shoulder profile is visible (P ∈ [0, 1]); if the object is not at the edge of the frame(C ∈ [0, 1]); if the face is not at the top of the object (H ∈ [0, 1]); and if a high number, S, of skin-tone pixels is visible inthe head/face region of area A. The latter condition biases the head detector towards shots where the face is visible.
4. The RFP Application
As has been noted, the task of recognizing customers across the two camera views is too difficult to be reliably carriedout by machine. Consequently we have developed a Human-Centred [16] application for returns fraud detection, that is thecomputing system is not designed to shoulder the entire burden of detecting returns fraud — an extremely complex taskthat requires both scene understanding far beyond computer vision capabilities and subtle judgments based upon complexmodels of human activities and behaviour. (For instance could the item being returned have been brought into the storein the customer’s pockets or bags?) By taking a human-centred approach, we seek to develop a tool that makes the loss-prevention employee’s task as easy and fast as possible. Indeed the application enables returns fraud detection in a wayhitherto impossible, since the task of finding the entrance match for a single returns customers would involve reviewing hugequantities of video, an unreasonable use of time even with the latest DVR technology.
4.1. Infrastructure
The smart surveillance system uses the above analytics algorithms to extract and filter meaningful content from the delugeof video data from six cameras. This information is transmitted as XML via TCP/IP to a Server running the Middleware forLarge scale Surveillance (MILS). This backend ingests the content through a web services interface and stores the index andcontent in a DB2 database. MILS also provides a web services API to deliver the content to application clients.
A schematic for the RFP application is shown in Figure 4. The application that we have developed for the RFP task is aweb-based AJAX (Asynchronous Javascript and XML) application that runs in a conventional internet browser. Content isdelivered by the MILS web services API in XML format, and transformed and rendered as HTML through XSLT stylesheetsand Javascript.
Simultaneously, the video from all six views is being encoded for subsequent playback. The system can be used for rapidaccess to a video database, whether that video database is stored on a conventional Digital Video Recorder (DVR) or encodedin software and stored by the system itself. Here, for independence and flexibility both DVR and software encoding havebeen used, so significant CPU time is dedicated to encoding of video.

4.2. InterfaceThe interface provides intuitive selection and browsing of the events, summarized by presentation of keyframes (at bothscales), timestamps and original video clips (from DVR or media server).
The fundamental indexing attribute of the database is time. All devices are synchronized (with NTP for the servers, and aproprietary mechanism for the DVR), and database events are timestamped. Temporal constraints from real world conditionsare exploited to limit the events displayed, in particular: (1) customers enter the store before they reach the returns counter attime T , and take at least some minimum time t ( t ≈ 1 minute) to reach the counter; (2) most returns customers go almostdirectly to the returns counter, so there is a high probability that the most recent tracks preceding T − t will contain thematching entrance event; (3) the amount of time a person can spend in the store is absolutely limited by opening hours, (sothe interface only needs to show results on a given day) and in practice durations more than a couple of hours are unlikely.Figure 5 shows the cumulative distribution of times between entering the store and arriving at the customer service desk.The probability distribution has a sharp peak between 1–3 minutes, and decays thereafter, with small probability mass after20 minutes. Fraud cases may well have a different time distribution, as locating and surreptitiously picking up an item to bereturned will presumably take longer than directly walking to the returns counter, but a fraudster is perhaps unlikely to spendtoo long browsing at the scene of their crime.
Fig. 5. Cumulative distribution of time delay between entrance and arrival at customer service, based on 104 matches (1 day of data).
The control pane provides an edit field for selecting a particular time or a “current” button for displaying the most recentresults. After selecting a time, the lower left pane is updated to show those faces detected at returns just before the selectedtime, in reverse chronological order. Thirty results are displayed and may be scrolled through with “earlier” and “more recent”buttons to see other results. Each result is shown as a keyframe, showing the cropped, detected face. Moving the mouse cursorover the keyframe shows the “zoom out” keyframe of the whole field-of-view. Clicking on the keyframe launches a videoviewer to play back the video in which this person was detected.
Once a customer has been selected for investigation (whether by an alert from the returns desk, through prior observationby the Loss Prevention staff, examination of the return transaction, or simply an exhaustive search of all return events) a“select” button beneath the keyframe is clicked, effectively choosing the time T . This then causes the lower right pane torefresh, displaying the thirty entrance events before T − t. Events from all four cameras are displayed together in reversechronological order with their absolute time and the time relative to T . Again, “earlier” and “more recent” buttons allownavigation to further results.
The default view for entrance events is again the “zoomed-in” keyframe (that with highest quality), with mouseoverdisplaying the full-frame view. A toggle in the control panel allows the inversion of this logic for all the keyframes, accordingto user preference. A small button next to each keyframe allows the user to cycle through further (lower quality) zoomed-inkeyframes. Clicking on the keyframe launches a second video display window that shows the video from which the entranceevent was extracted.
4.3. Indexing by appearanceCurrently the computer carries out segmentation, detection and tracking as well as visualization, but most of the matchingis done by human intelligence. As machine vision algorithms progress, more of the matching burden might be transferredfrom human operator to machine. One way to do this without assuming perfect accuracy is to highlight potential matchesdeemed likely by using automatic algorithms, while still making all results available for human search. We have begun thisby automating one of the main cues used by the human operators: salient colour detection.
Salient color detection works by calculating a color histogram of the tracked objects at the entrance and storing thedominant peaks in the database. The histogram is computed in the cylindrical Hue/Saturation/Intensity color space. Thecumulative histogram is computed only when the track is 2n frames old (n an integer ≥ 0) to minimize computational costs.

White and black are defined as the high intensity/high saturation and low intensity/low saturation conic portion of the HSIcylinder respectively. The rest of the cylinder is divided uniformly by hue into 6 colors (red, magenta, blue, cyan, green,yellow). The dominant color is the peak in the 8-color cumulative histogram for the tracked object. At search time, the usercan limit the displayed results to only those matching a particular dominant colour worn by the customer at the customerservice desk, using a pull-down menu of colour names. Figure 3 shows the results when “Red” is selected.
Naturally this task can be automated more fully by deriving the dominant colour from the returns event, and enhancedby using more cues and more sophisticated normalization algorithms for lighting, camera pose and imaging characteristics.Some of the main cues that human operators use to find matches are given below. Coarse clues provided a rapid search, withfiner cues enabling verification of potential matches.
• Torso colour— clothing and accessories.• Hair/ hat colour.• Face colour.• Size / age.• Hair style — human recognition of faces is strongly influenced by hair style and in particular hairline.• Other facial features, particularly obvious, high contrast features such as (sun)glasses and facial hair.• Carried objects (bags or garments).• Companions. While a given person may be hard to distinguish, the fact that someone is accompanied by another person
and the appearance of the companion(s) may be very strong cues.• Strollers and shopping trolleys.
It should be noted that in this application, identification is over a very short time frame (approximately 1 minute to 3hours) and in a constrained environment, so changes that dog other identification scenarios (aging and changes of clothing,makeup, hairstyle and appearance) are absent or very rare.
4.4. Archiving
Using the above affordances to browse through the events, if a match is found, the user can examine the keyframes and videoto attempt to determine if fraud has taken place. An archive button allows the user to save the matched events for rapid futureaccess, and preserves these events from data expiration that may be enabled on the database.
5. Transaction log integration
Above, we have described a standalone vision-based system for the investigation of returns fraud that allows rapid browsingand association of customer service and entrance events. The interface can operate in a live mode — where the interface isused to monitor and investigate customers currently at the customer service desk — or in a forensic mode where previousevents are investigated with equal ease whether they took place an hour, a day or several weeks ago.
Since the focus of the application is Returns Fraud, the forensic mode of investigation is helped considerably by theaddition of a Transaction Log (TLOG) browser. The Transaction Log comes from the store database and consists of onerecord for every transaction carried out on any register in the store. The TLOG data is ingested into MILS using the samemechanism as is used for video events, and is browsed through another page of the web interface. A preliminary page allowsthe user to browse events by time, seeing histograms of TLOG event frequency over time, and then, within a given timeperiod, to view the events of a particular type, including register number and transaction amount. Clicking on a particularTLOG event takes the user to a page showing visually detected returns at the same time, for the register in question, and theinvestigation can continue as previously described, but this time with direct, rapid access to only the events of the desiredtype (in most cases returns).
Using TLOG information allows the user to focus on events of a particular type. Naturally the store database also containsinformation about the articles being returned and, if a store charge card is used, its number, though such information was notmade available in this investigation.
6. Customer counting
A secondary goal of this retail pilot was the counting of customer “shopping groups”. This was achieved as a side-effect of thetrip-wire alerts used for filtering customer entrance events. An alarm statistics page that is part of the IBM Smart SurveillanceSolutionprovides browsing and time-slicing of alarm counts (viewing numbers of entrance events by hour, day or week across

different periods). A second alarm on each door detects exit events which provide a corroborative count. Since customersenter in groups, and retailers are often more interested in “shopping groups” (e.g. a family for which there will usually be nomore than one purchase) rather than individuals, the system is designed to count shopping groups rather than actual people.The entrance and exit counts can be used in conjunction to estimate the number of shopping groups in the store at any timeand the average time spent in the store. While many “customer counting” solutions are available, using techniques such asbeam-breakers and pressure pads, they generally do not provide direction or the potential to distinguish between groups andindividuals. This application shows the flexibility of a computer vision solution — the customer counting was essentiallyavailable “for free” once the returns fraud solution was in place, and it provides richer, more useful data than a dedicatedpeople-counting solution would offer.
The counts can also be used to calculate “conversion rate” data where the sales per customer entering the store are calcu-lated.
Another example of data that can be gathered from the system with the current cameras and no additional processinginclude measuring display effectiveness (looking at track dwell in front of displays at the entrance). The entrance cameraviews also provide a quick mechanism for verification of staff time-and-attendance.
7. Performance evaluation
The task to be tackled with the RFP system is a complex one and affords a number of different evaluation methods. Ultimatelyfor the store the goal is to reduce returns fraud, and gain a financial return on investment in the RFP system. Since in practice,the amount of returns fraud is unknown, more measurable goals are to count the number and value of fraudulent transactions,both to determine the potential number of cases caught and the potential for deterrence by this and other methods. Naturallysuch measures are dependent on the amount of returns fraud being carried out and not purely an evaluation of the effectivenessof the system. Judging if fraud is present only from video can also be somewhat subjective.
7.1. Performance measures
From a more technical viewpoint the function of the interface is to find matches between returns customers and entranceevents, so we will now describe a series of error measures that quantify this performance.
• Overall match proportion: For customers at customer service the proportion who were found at the entrance.• Overall match time: The average time to find a match using the interface.
The primary performance measure of match proportion can be broken down into several performance measures that canbe quantified separately.
• Customer detection: The proportion of people at customer service who were detected and displayed in the interface• Entrance detection: The proportion of people entering the store who were visible in the event keyframes.
Other, secondary, error measures that affect the effectiveness of the solution can also be calculated:
• Customer service false alerts: The ratio of false alerts to true customers at customer service.• Customer service clutter: The ratio of the number of tracks displayed in the interface to the true number of customers at
customer service.• Entrance clutter: the ratio of the number of entrance events displayed to the true number of customers entering.
7.2. Experimental data
The system is deployed live at a store in New York state and has been in operation for several months. For performanceevaluation, several days of video data were recorded from four channels on each of two servers at 1Mb/s per channel. Twochannels of recorded data were not used in the experiments.
Video was then ingested from disk using a replica of the store system configuration (two servers each processing threechannels of video). Several users were assigned performance analysis tasks whereby they carried out the full “people search”task, with or without TLOG information, or compared ingested data to ground truth for the subtasks listed above. Whileentrance video was processed at full frame rate, frames were dropped at the returns counter to reflect the normal operatingspeed of about 6fps.

Evaluation measure Result Amount of data usedProportion of TLOG returns event customers found at entrance 85% 1 day (122 TLOG events)Average time taken by a user to find a customer match 86s 1 hour (11 matches)Proportion of customers entering store visible in keyframes 85.3% 2 hoursProportion of customers at customer service visible in keyframes 95.5% 2 hours (21 ground truth events)Interface clutter (customer service) 2.54 2 hours
Alert Precision RecallTripwire 95% 50%Region 91% 75%
(a) (b)
Table 1. (a) A variety of performance measures evaluated. (b) Effectiveness of counting entering shopping groups using two differentalerts. Evaluated on 1 day (12 hours) of data at one door — 165 shopping groups.
7.3. Results
Table 1(a) shows results using a variety of the performance measures of section 7.1.From the results, it can be seen that the majority of customers can successfully, and quickly, be traced back to the entrance,
which is the prime function of the application. The speed for matching from TLOG data is slower than when choosing anarbitrary customer because the process of determining the correct customer matching a TLOG event is challenging. Reasonsfor failures to find a match are divided between the following:
• Customer torso not imaged. Customers who turn sharply left or right from some of the doors, would only have their legsimaged. At returns only the head and torso are imaged, making reliable matching impossible.
• Human error. From the data presented it is often difficult to recognize customers, especially if major cues change (such asdonning/taking off hats, jackets or glasses). Lighting changes markedly between the cameras, leading to extreme colourchanges.
• It is believed that one customer entered while a few minutes of data were not captured due to machine failure.
Table 1(b) shows further experiments in shopping group counting accuracy. It can be seen that the region alert provides ahigher recall, at the cost of some precision. An analysis of the errors shows that many tripwire false alarms are generated fromcross traffic (not entering) and that both methods miss true positives when people enter the store and move immediately toone side, becoming occluded by clothing racks, and failing to reach the size threshold required by the alerts. This is a problemof camera placement — people can enter the store without being fully visible in the cameras. Naturally a solution designedfor people-counting would choose different camera placement (top-down reduces mutual occlusion and other problems ofoblique camera angles resulting in better accuracy) but would lose the acquisition of faces and appearance that this method(deriving counts from the returns-fraud solution cameras) provides.
7.4. Speed
The system that we have deployed in the store uses four dual 3.6GHz Pentium servers mounted in the store’s DVR rack,together with an RFP-dedicated DVR. In practice two of the servers are used to duplicate the DVR’s encoding and video-serving function, and the solution can be deployed in a scalable manner with only one server per store processing up to eightchannels of video (but doing no video encoding), and one MILS backend server shared across several stores. The end-userapplication can be run on any PC with an internet browser, such as that already found in the DVR room for accessing TLOGdata.
The ColourField tracking algorithm working in the store runs at thirty-frames per second. Figure 6 shows a histogram oftime per frame spent in background subtraction (BGS) and tracking. The graph shows a bimodal distribution for BGS (5.5 or8.5ms). Tracking also shows a bimodal distribution — the majority of frames take under 0.5ms, with a second peak between2 and 4 ms.
The face detection and tracking algorithm is run much slower — around five frames per second – but rapid tracking is notimportant as customer service events are nearly static and last for a minute or longer.
8. Conclusions
This paper has described a practical, first-of-a-kind computer vision based application for the investigation and detection ofretail returns fraud. The system uses detection, tracking and indexing capabilities of the IBM Smart Surveillance Solutionto

0
1000
2000
3000
4000
5000
6000
0 2000 4000 6000 8000 10000 12000 14000 16000
Fre
quen
cyTime (ms)
BGSTracker
Both
Fig. 6. A histogram of execution times per frame for one channel of entrance video. The graph shows times (in microseconds) spent inbackground subtraction, tracking or the sum. Few frames (6%) take longer than 14ms. Every thousandth frame from 7.4 million (68 hours)is shown.
allow browsing and rapid search of returns events and association of these events with customers entering the store. A Human-Centred application presents relevant events to the user, with some capability to filter the events based on characteristics(currently dominant colour).
The people using the system had minimal training and experience in the system, and search strategies with the systemhave been found to evolve over time. Despite the huge time savings afforded by the system, searching over long periods oftime can still be boring, and it can be difficult to maintain focus on the task.
We have evaluated the system’s effectiveness at performing the task, and find satisfactory performance with fast searchingand 85% matching rate. We are now beginning full-scale in-store testing where we will find out if returns fraud detection isin practice enabled by using the system.
Future work will aim to improve the match rate by improving tracking of complex interactions and keyframe generationstrategies, as well as match speed by increasing automation of matching as well as experimentation with alternative interfacedesigns.
References
1. Research, C.F.R.: The european retail theft barometer. Technical report, Centre For Retail Research (2005) www.retailresearch.org.2. Hollinger, R.: National retail security survey final report. Technical report, University of Florida (2003)3. Guthrie, J.: New zealand survey of retail theft and security report. Technical report, University of Otago (2003)4. : Ex-white house aide arrested in alleged refund scam. CNN (2006)5. IEEE Workshop on Performance and Evaluation of Tracking and Surveillance Systems. (2002)6. Haritaoglu, I., Flickner, M.: Detection and tracking of shopping groups in stores. In: CVPR. (2001)7. Haritaoglu, I., Beymer, D., Flickner, M.: Ghost3D: Detecting body posture and parts using stereo. In: Workshop on Motion and Video
COmputing, IEEE (2002) 175–808. Stauffer, C., Tieu, K.: Automated multi-camera planar tracking correspondence modeling. In: Conference on Computer Vision and
Pattern Recognition. Volume I. (July 2003) 259–2669. Wolfe, R.H., Hobbs, P.C., Pankanti, S.: Footprints: An IR approach to human detection and tracking. In: Proc. SPIE
10. Ellis, T., Makris, D., Black, J.: Learning a multi-camera topology. In Ferryman, J., ed.: PETS/Visual Surveillance, IEEE (October2003) 165–171
11. Javed, O., Shafique, K., Shah, M.: Appearance modeling for tracking in multiple non-overlapping cameras. In: Conference onComputer Vision and Pattern Recognition, IEEE (June 2005)
12. Shan, Y., Sawhney, H.S., Kumar, R.: Vehicle identification between non-overlapping cameras without direct feature matching. In:ICCV. (2005)
13. Lienhart, R., Maydt, J.: An extended set of haar-like features for rapid object detection. Volume 1., IEEE (2002) 900–90314. Connell, J., Senior, A., Hampapur, A., Tian, Y.L., Brown, L., Pankanti, S.: Detection and tracking in the IBM PeopleVision system.
In: IEEE ICME. (June 2004)15. Senior, A., Hampapur, A., Tian, Y.L., Brown, L., Pankanti, S., Bolle, R.: Appearance models for occlusion handling. In: International
Workshop on Performance Evaluation of Tracking and Surveillance. (2001)16. Flanagan, J., Huang, T., Jones, P., Kasif, S.: Human-centered systems: Information, interactivity, and intelligence. Technical report,
National Science Foundation (1997)