visual communication for the web - lukew ideation + design
TRANSCRIPT
1!
1
VISUAL COMMUNICATION FOR THE WEB LUKE WROBLEWSKI VIZTHINK, SAN JOSE 2009
2
Luke Wroblewski
Yahoo! Inc. •! Senior Director, Product Ideation & Design
LukeW Interface Designs •! Author & Founder
•! Web Form Design: Filling in the Blanks (Rosenfeld Media)
•! Functioning Form: Web applications, product strategy, & interface design articles
•! Site-Seeing: A Visual Approach to Web Usability (Wiley & Sons)
Previously •! eBay Inc., Lead Designer •! University of Illinois, Instructor •! NCSA, Senior Designer
http://www.lukew.com

2!
3
WHY DOES IT MATTER?
HOW DO WE APPLY IT?
EXAMPLES, EXAMPLES, EXAMPLES…
VISUAL COMMUNICATION ONLINE
4
How We Use the Web
“Look around feverishly for anything that is interesting or vaguely resembles what you are looking for, and is clickable.” -Steve Krug
-Steve Krug, Don’t Make Me Think: A Common Sense Approach to Web Usability

3!
5 Squidoo Eye-tracking study (by etre)
6
Design Considerations
•! Presentation: How your application appears to your audience
•! Interaction: How your app behaves in response to user actions
•! Organization: The structure of your application
Luke Wroblewski, Site-Seeing: A Visual Approach to Web Usability

4!
7
Presentation
•! All interactions occur through the presentation •! Inform users
•! Establish relationships between content
•! Guide users through actions
•! Make organizational systems clear •! Provide situational awareness
•! Maintain consistency to create a sense of place
•! Effectively convey appropriate personality •! Emotional impact
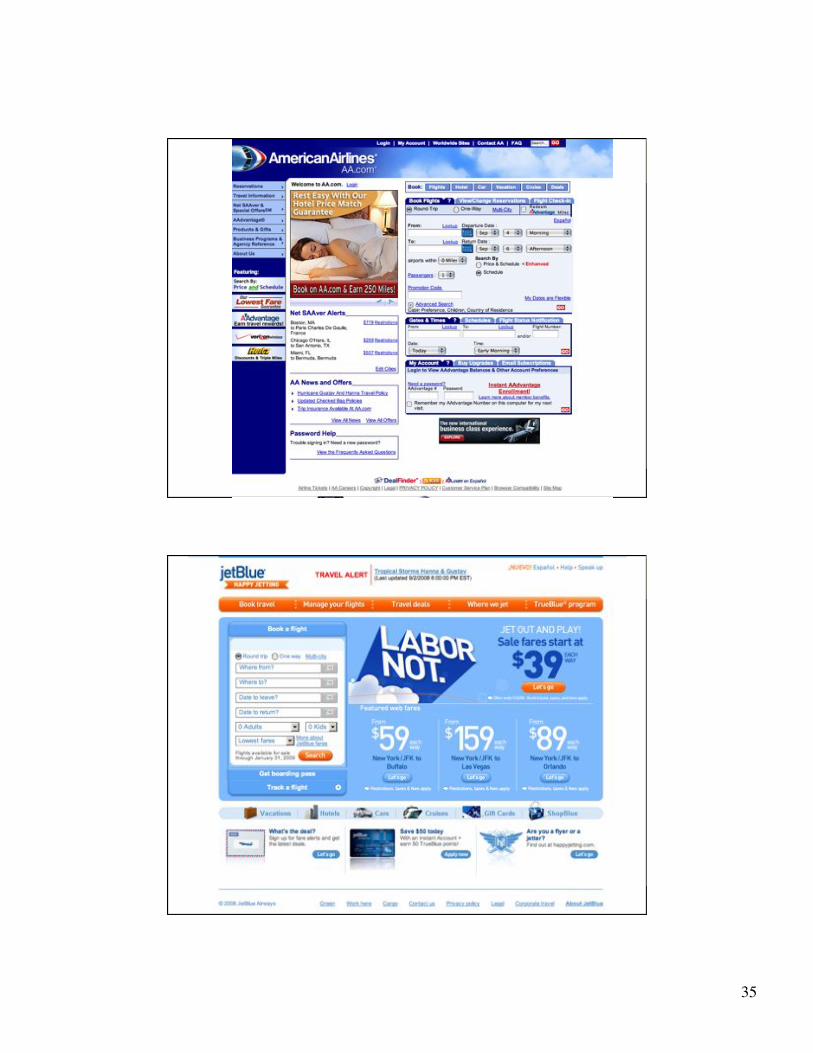
•! Engage and invite
•! Communicate brand message
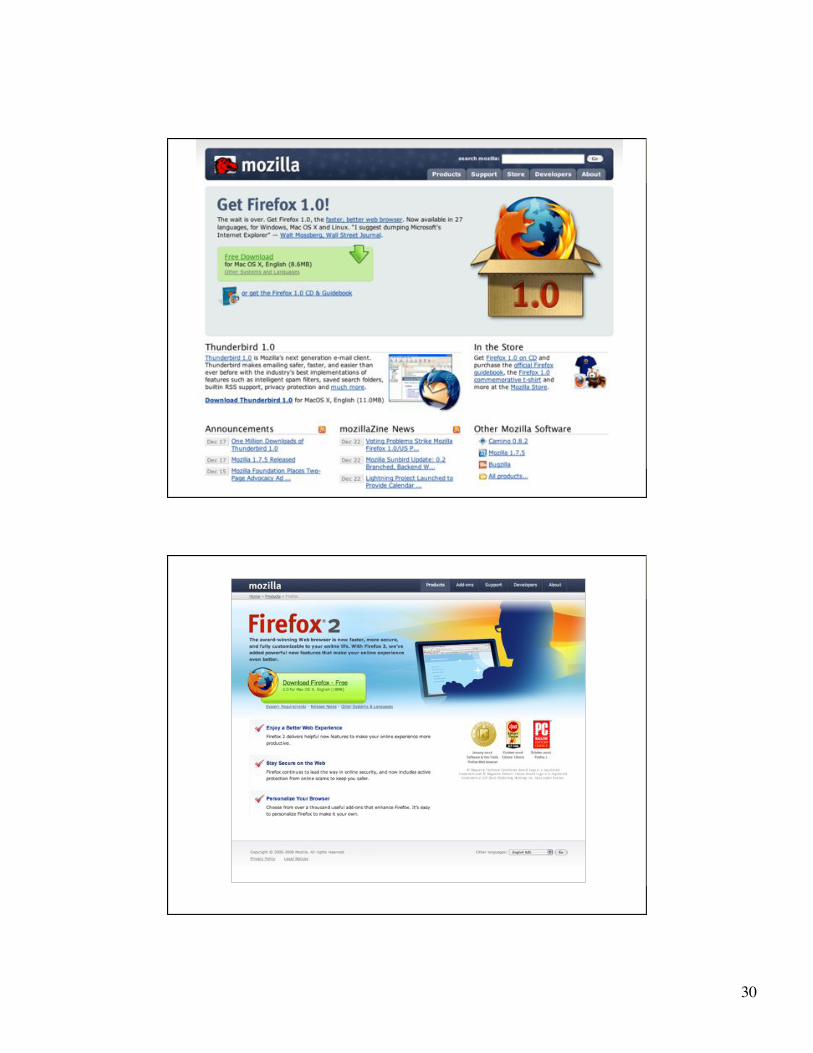
8
What Makes a Great Presentation?
•! Visual Organization •! Communicates the
relationships between user interface elements
•! Enables Interaction Design
•! Information Design
•! Personality •! Communicates the brand
essence of a product
•! Visceral design
•! Color, font, image, pattern selection

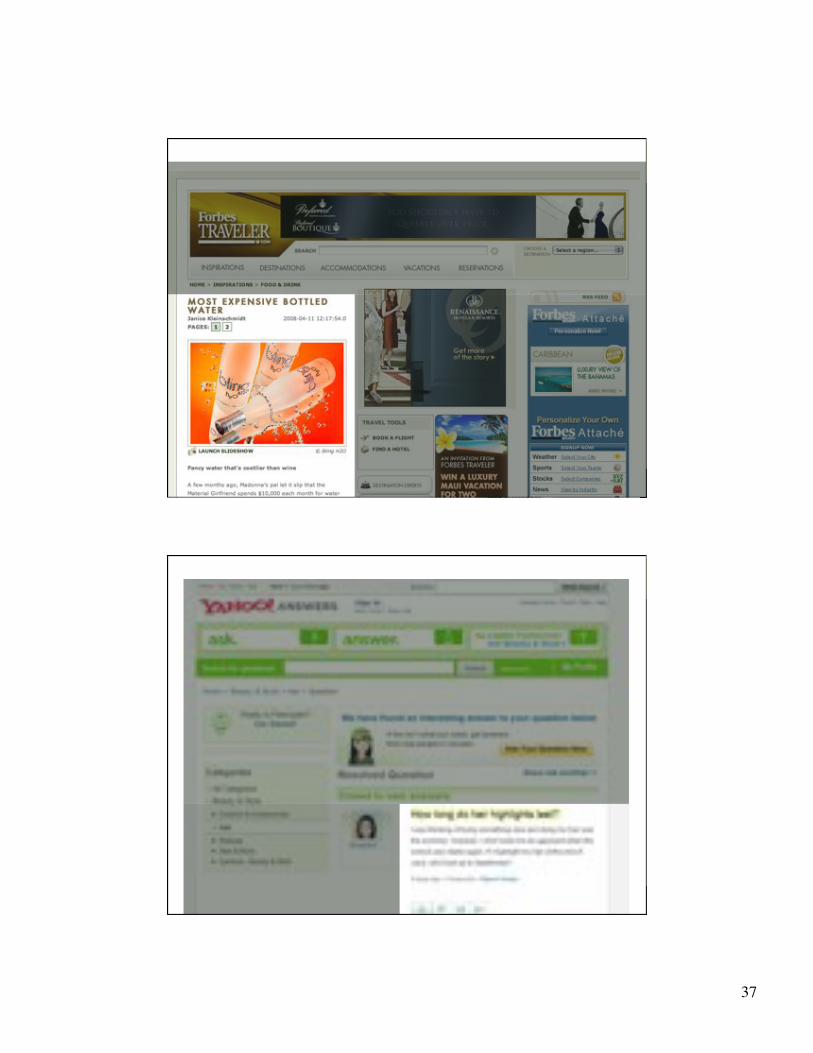
5!
9
The End Goal
Quickly Communicate •! What is this? Usefulness
•! How do I use it? Usability
•! Why should I care? Desirability
10
6!
11
12

7!
13
14
BEFORE & AFTER

8!
15
16

9!
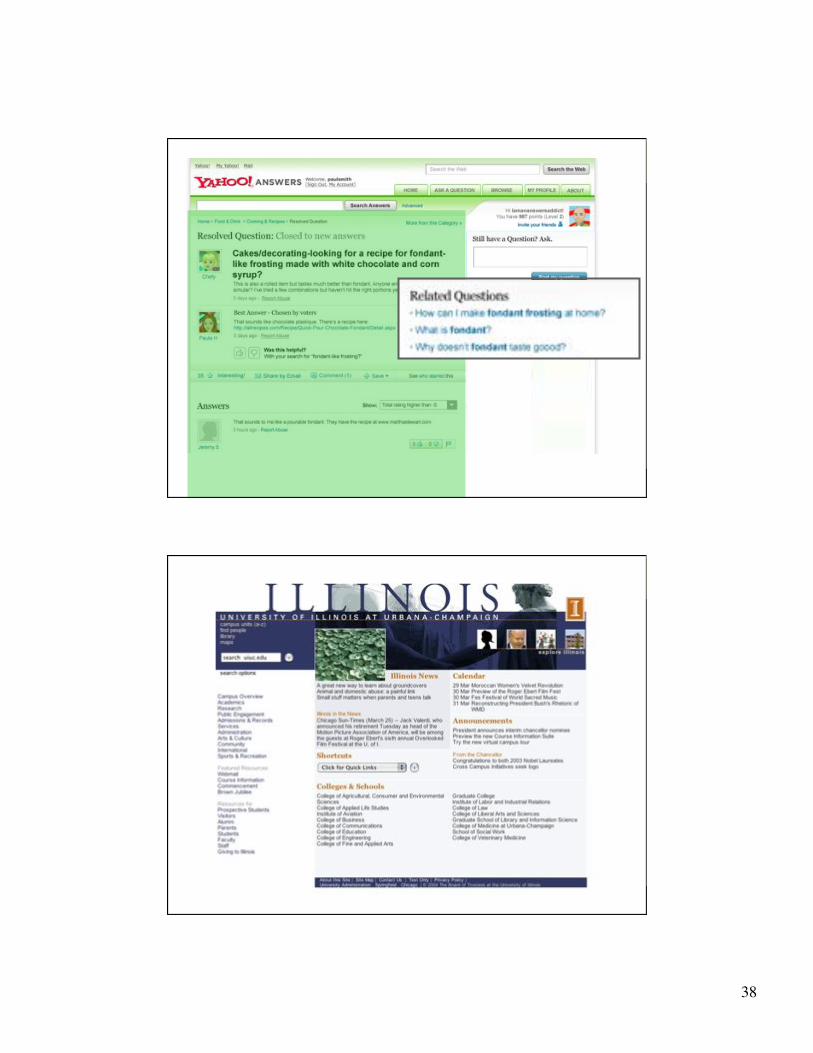
17
18

10!
19
20
11!
21
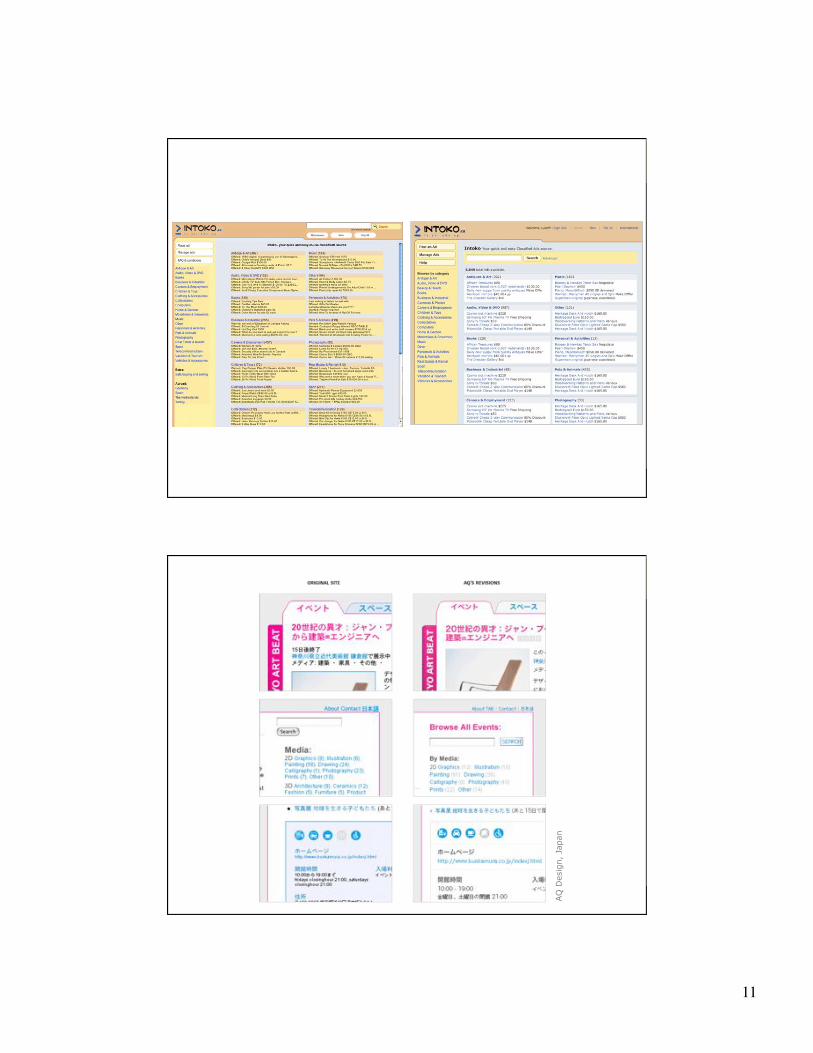
22 AQ
Des
ign,
Jap
an

12!
23
HOW DO WE COMMUNICATE VISUALLY?
PHOTO BY MATTEO PENZO
24
How We See
•! How we make sense of what we see •! Recognizing similarities
& differences •! This allows us to group
information
•! And give it meaning
•! Relationships •! Between individual
elements •! To the whole (story)
Flickr: Uploaded on August 19, 2006 by Tom-Tom
13!
25
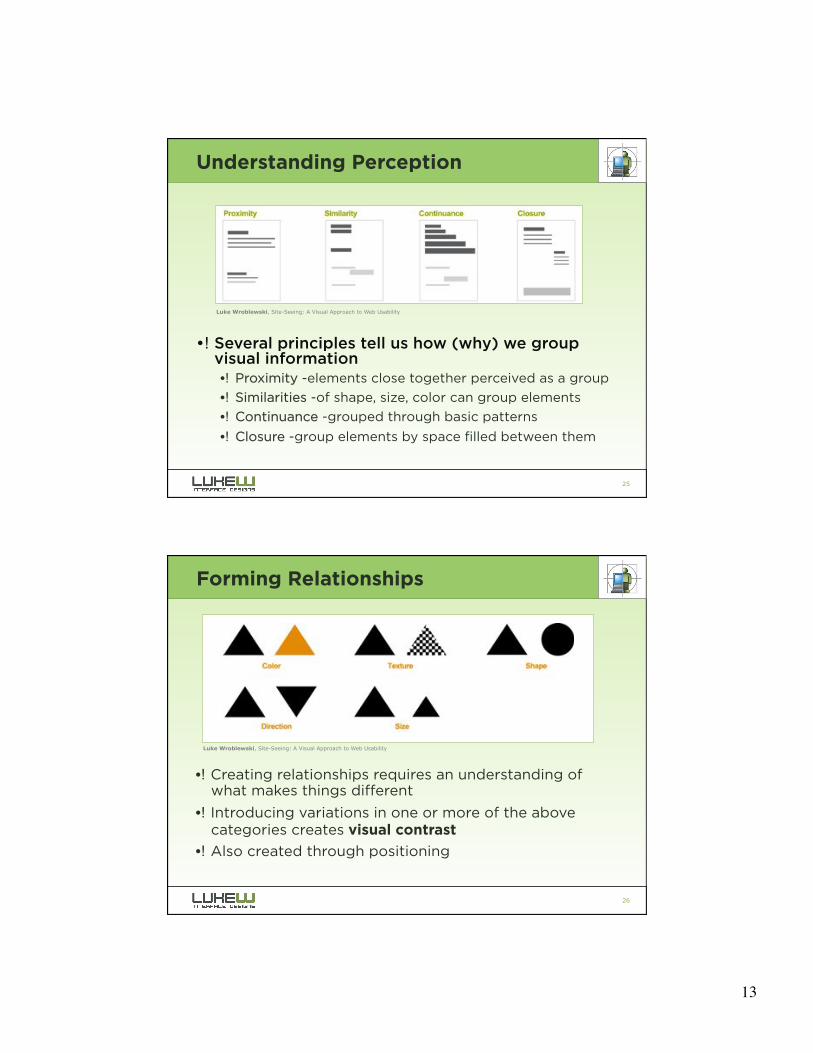
Understanding Perception
•! Several principles tell us how (why) we group visual information •! Proximity -elements close together perceived as a group
•! Similarities -of shape, size, color can group elements
•! Continuance -grouped through basic patterns
•! Closure -group elements by space filled between them
Luke Wroblewski, Site-Seeing: A Visual Approach to Web Usability
26
Forming Relationships
•! Creating relationships requires an understanding of what makes things different
•! Introducing variations in one or more of the above categories creates visual contrast
•! Also created through positioning
Luke Wroblewski, Site-Seeing: A Visual Approach to Web Usability
14!
27
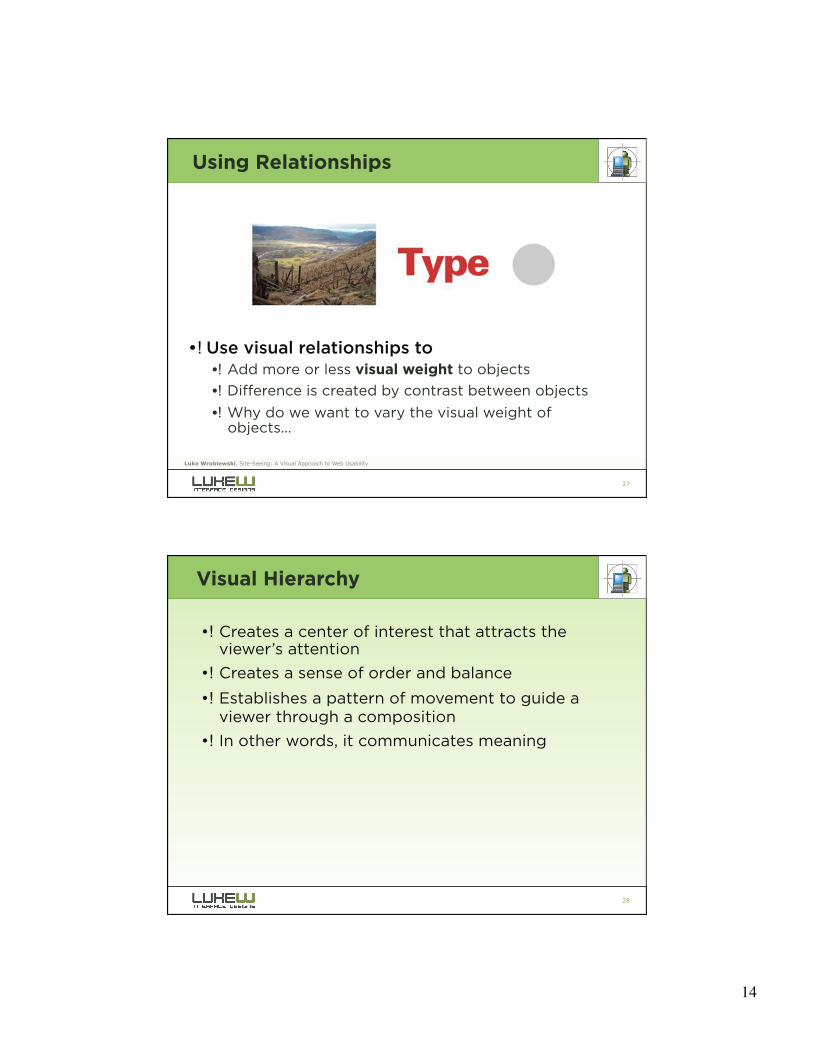
Using Relationships
•! Use visual relationships to •! Add more or less visual weight to objects
•! Difference is created by contrast between objects
•! Why do we want to vary the visual weight of objects…
Luke Wroblewski, Site-Seeing: A Visual Approach to Web Usability
28
Visual Hierarchy
•! Creates a center of interest that attracts the viewer’s attention
•! Creates a sense of order and balance
•! Establishes a pattern of movement to guide a viewer through a composition
•! In other words, it communicates meaning

15!
29
Hierarchy Applied
•! Visual weight guides you through •! Image
•! Title
•! Date & Location
•! Ticket Information
•! Building an effective hierarchy •! Involves use of visual
relationships to add more or less visual weight to elements
30
Building Effective Hierarchies
•! Distribution of visual weight •! Visually dominant images get noticed most
•! Focal point, center of interest
•! Distinct visual weight guides you through narrative •! Essential to keep it balanced
Luke Wroblewski, Site-Seeing: A Visual Approach to Web Usability
16!
31
32

17!
33
34

18!
35
36

19!
37
38
To Summarize
•! Visual Communication is part •! Visual Organization and part personality.
•! Visual Hierarchy is a deliberate prioritization of
•! Visual Weight enabled by the manipulation of
•! Visual Relationships to create
•! Meaning for users.
20!
39
40
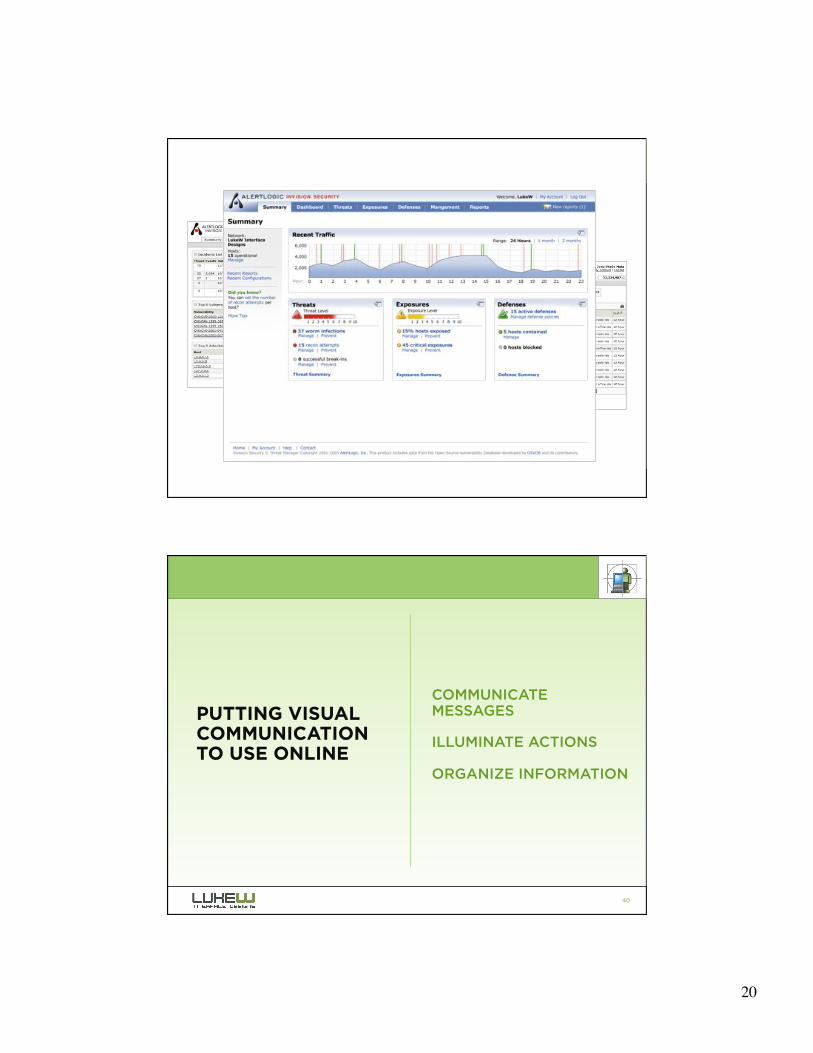
COMMUNICATE MESSAGES
ILLUMINATE ACTIONS
ORGANIZE INFORMATION
PUTTING VISUAL COMMUNICATION TO USE ONLINE
21!
41
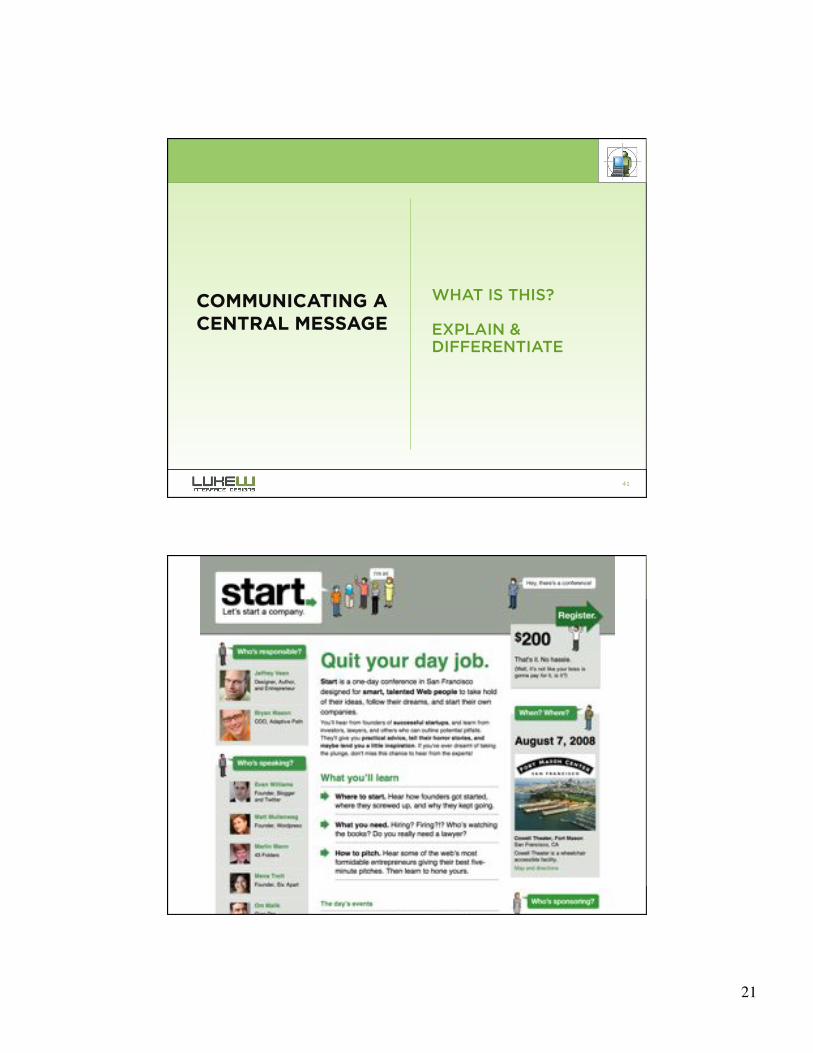
COMMUNICATING A CENTRAL MESSAGE
WHAT IS THIS?
EXPLAIN & DIFFERENTIATE
42

22!
43
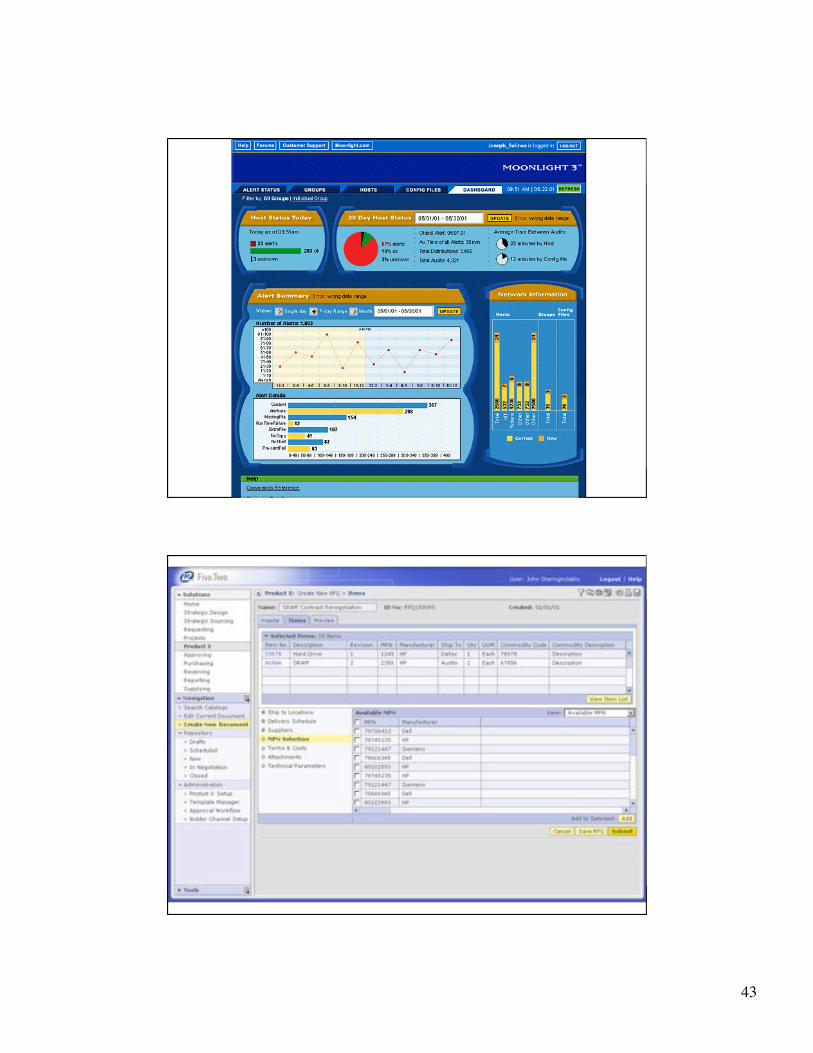
Web Applications •! Hosting costs are extremely affordable
•! Free open source platforms
•! Development toolkits increasingly available
•! Instant global audience: 1.4B people use the Internet (March 2008)
44

23!
45
46
24!
47
48
25!
49
50

26!
51
52
TAKE ACTION WHAT DO I DO NOW?
USER NEEDS & BUSINESS GOALS
27!
53
54

28!
55
56
29!
57
58
30!
59
60

31!
61
62

32!
63
64

33!
65
66

34!
67
68
35!
69
70

36!
71
ORGANIZE INFORMATION
WHAT CAN I FIND HERE?
PRESENT DATA
72
24% CONTENT 76% SITE OVERHEAD
37!
73
74
38!
75
76

39!
77
78
A Simple Table
40!
79
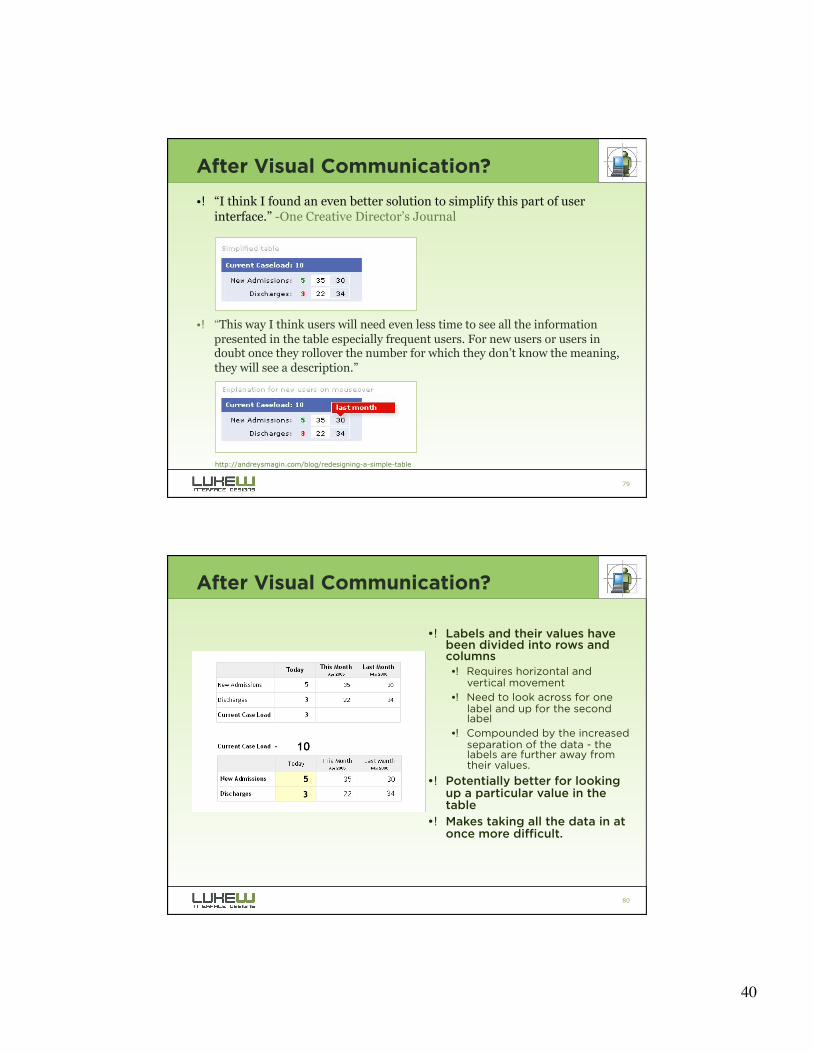
After Visual Communication?
•! “I think I found an even better solution to simplify this part of user interface.” -One Creative Director’s Journal
•! “This way I think users will need even less time to see all the information
presented in the table especially frequent users. For new users or users in doubt once they rollover the number for which they don’t know the meaning,
they will see a description.”
http://andreysmagin.com/blog/redesigning-a-simple-table!
80
After Visual Communication?
•! Labels and their values have been divided into rows and columns •! Requires horizontal and
vertical movement •! Need to look across for one
label and up for the second label
•! Compounded by the increased separation of the data - the labels are further away from their values.
•! Potentially better for looking up a particular value in the table
•! Makes taking all the data in at once more difficult.
41!
81
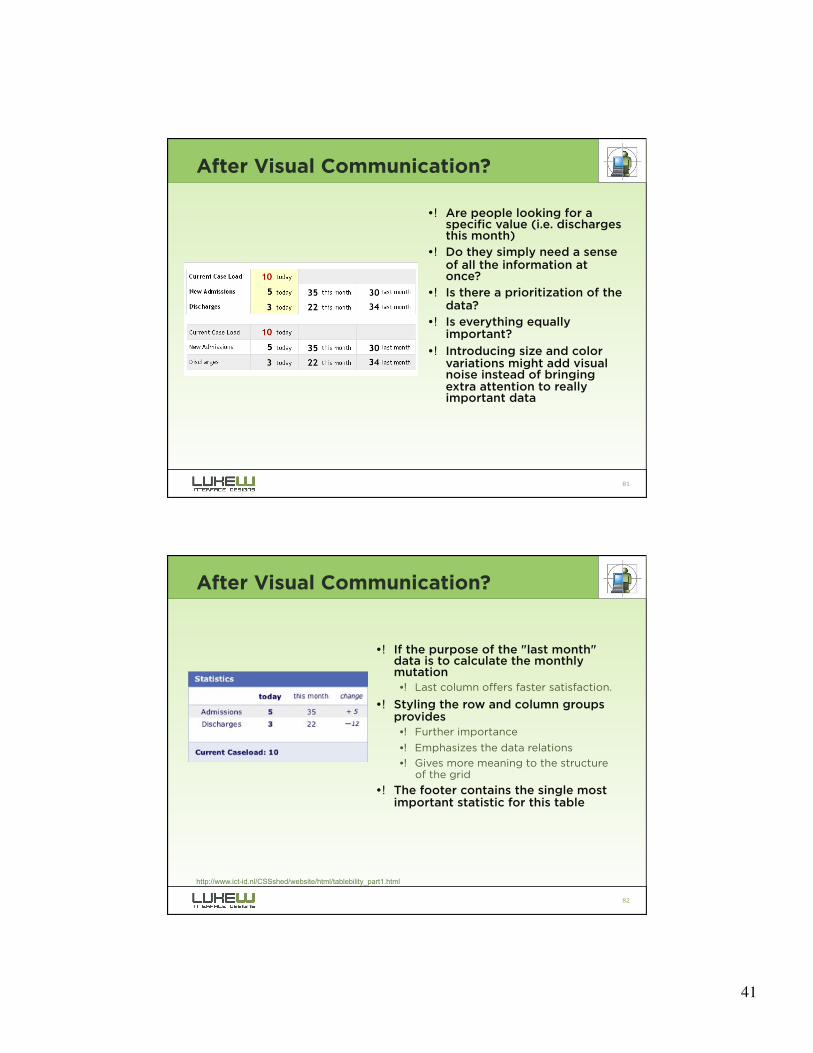
After Visual Communication?
•! Are people looking for a specific value (i.e. discharges this month)
•! Do they simply need a sense of all the information at once?
•! Is there a prioritization of the data?
•! Is everything equally important?
•! Introducing size and color variations might add visual noise instead of bringing extra attention to really important data
82
After Visual Communication?
•! If the purpose of the "last month" data is to calculate the monthly mutation •! Last column offers faster satisfaction.
•! Styling the row and column groups provides •! Further importance
•! Emphasizes the data relations
•! Gives more meaning to the structure of the grid
•! The footer contains the single most important statistic for this table
http://www.ict-id.nl/CSSshed/website/html/tablebility_part1.html
42!
83
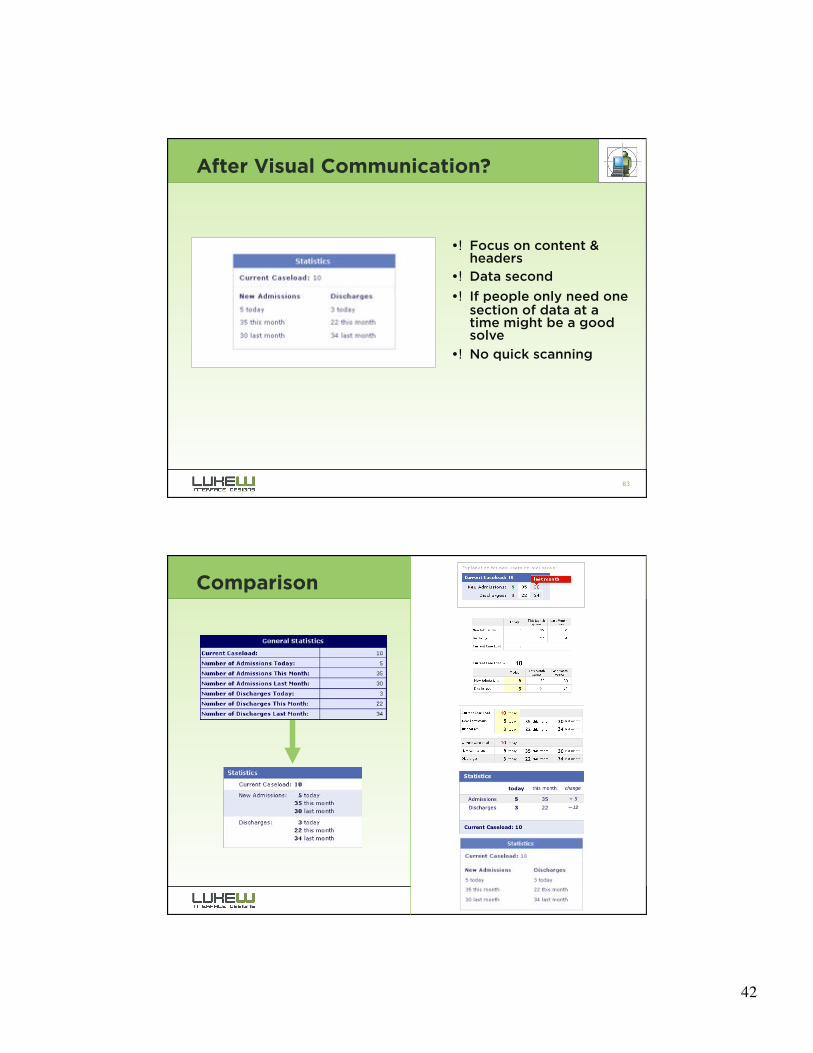
After Visual Communication?
•! Focus on content & headers
•! Data second
•! If people only need one section of data at a time might be a good solve
•! No quick scanning
84
Comparison
43!
85
86

44!
87
88

45!
89
To Summarize
•! Visual Communication is part •! Visual Organization and part personality.
•! Visual Hierarchy is a deliberate prioritization of
•! Visual Weight enabled by the manipulation of
•! Visual Relationships to create
•! Meaning for users. •! Communicate messages •! Illuminate actions •! Organize information
90
For more information…
•! Functioning Form •! www.lukew.com/ff/
•! Web Form Design •! www.rosenfeldmedia.com/books/
webforms/ •! Discount Code: FOLUKE15 (15% off)
•! Drop me a note •! [email protected]