visual color matching of led and tungsten-halogen light sources
TRANSCRIPT

Harbers, G, Color Matching LED Sources
VISUAL COLOR MATCHING OF LED AND TUNGSTEN-HALOGEN LIGHT SOURCES
Gerard Harbers, Kelly McGroddy, Raghuram Petluri, Peter K. Tseng, John Yriberri
Xicato Inc, San Jose, USA
ABSTRACT
Color differences between different LED and halogen fixtures have frequently been noticed in lighting installations. This has res-ulted in failed installations and missed energy saving opportunities. These color dif-ferences can be seen at the onset of install-ations, or they can emerge over time. In the research presented here, practical allowable color differences for architectural and accent lighting applications have been quantified by testing visual color sensitivity to fixtures with specified controlled color dif-ferences. Additionally, we found that color differences are observed between solid state lighting fixtures with different color ren-dering properties and between halogen and LED fixtures, even when they are matched to the same (CIE 1931) chromaticity coordinates. This is related to color match-ing function failures, which we found have a significant effect on the perception of visual color differences. These results provide information to help both lighting specifiers as well as lighting manufacturers under-stand how to avoid observable color vari-ations in LED lighting installations.
Keywords: color consistency, solid state lighting, Tungsten-Halogen, LED, color matching functions
1. INTRODUCTION
An example of a solid state lighting installa-tion is shown in figure 1. In this case the intended lighting effect is a combination of architectural and general lighting. The fix-tures in this installation are mounted relat-ively close to each other which makes the installation relatively sensitive to color dif-ferences between the fixtures. In this partic-ular example no color differences were observed during or after the installation. However, there are many examples where, due to lack of color control during manufac-turing of the LEDs and fixtures, color differ-ences are noticed. In order to avoid these problems, manufacturers and architects need to be aware of the color consistency attributes of lamps and fixtures, i.e. how well does the color point of the light output of the fixture match to a reference?
It is difficult to achieve color consistency between fixtures in general, but even more so with solid state lighting fixtures, due to the following topics which are the subject of this paper:1. there are many potential sources for color
errors in these systems due to the com-plexity of the white LED structure,
2. there is still a lot of confusion regarding the color consistency requirements for different lighting applications in the LED industry; the problems are still frequently ignored,
3. and last but not least, due to issues with LED color matching (specifically the CIE 1931 XYZ matching functions), color dif-ferences can be observed while accord-ing to the chromaticity coordinates the colors should be identical.
Other aspects of light quality which need attention in lighting installations, but are beyond the scope of this paper are: color rendering, beam uniformity (multiple shad-ows due to the LED array configurations, color variation over angle, near field and far field variations), and glare (high luminance of the LEDs due to the small area of emis-sion).
Adequate standards are required for solid state lighting to cover these quality aspects, as failure to do so will delay energy saving and carbon dioxide emission reduc-tion opportunities.
2. CHROMATICITY ERRORS IN SOLID STATE LIGHTING
Color consistency errors tend to occur more frequently with SSL systems than with con-ventional systems due to:1. temperature and current dependence of
the InGaN LED junction, which results in variations in radiometric output power and spectral shifts.
2. temperature dependence of phosphor conversion efficiencies, and the current practice of applying the phosphor in dir-ect contact with the LED chip, so that the phosphors are directly exposed to the heat generated by the LED chip,
1

Harbers, G, Color Matching LED Sources
3. and the lack of control of the phosphor deposition process in combination with spectral variations of the LEDs (due to variations in growth conditions over the wafers), and variations due to inconsist-ent interaction between LED chip and phosphors (variations in surface morpho-logy, chip radiation pattern and phosphor particle size), and variations between the interactions of the phosphor and the encapsulants (LED lenses).
These effects result in production of white LEDs with chromaticity spreads larger than acceptable for most lighting installations. To address this issue all LEDs are tested and ordered into bins. It is common to test luminous flux, chromaticity, and forward voltage. Size of the bins vary per manufac-turer, but frequently sizes of the bins are too large such that color differences can be observed between LEDs from one bin (see section 3). Furthermore, if the binning tester accuracy is too low, additional color errors will occur. This is particularly problematic if LEDs from different manufacturers are com-bined, or if LEDs are received from different production lines from one manufacturer.
And last but not least, it is common prac-tice to bin the LEDs at a junction temperat-ure of 25°C (pulse test), while the junction temperature in actual use can be in the range of 60°C to 120°C. Actual color shift over temperature varies due to chip vari-ations. So even if LEDs are used from the same bin, chromaticity variation in an actual system can be enhanced due to much higher operating temperature.
In most LED fixtures arrays of LEDs are mounted on a (metal core) printed circuit board (PCB) with optical collimator arrays placed over the LED array such that each LED has its own collimator. The fixture or LED module manufacturer, aware of color
consistency targets, needs to manage the LED supply and choose which LEDs (bins) go on which position on the PCB. Currently, it is difficult to only use LEDs from one bin. As LEDs spread in many bins, taking only one bin from a manufacturer would either result in a yield loss (higher cost!), or, if bins are associated with client groups, supply issues and color consistency errors between fixtures from different manufacturers.
The chromaticity of the board is determ-ined by the quantities of each color bin on the board. If a large number of LEDs are present on the board, the spread can be minimized by using binning strategies which take into account available LED inventory. However, if the number of LEDs on the board is limited, this is more difficult.
Care has to be taken regarding place-ment of the different LEDs (bins), in combin-ation with the optical design of the lenses, to minimize color uniformity errors, in particu-lar for near field targets, or (colored) shadow effects in the case of far field targets.
Another source for color errors are the shifts occurring with optical coatings on reflectors and lenses, and absorption in the lens material. Typically these do not pose a problem between fixtures in one series, but do show up if different fixtures are used, or different beam options are combined within one fixture design.
So far this section has been about chro-maticity errors occurring during LED & fix-ture design and manufacturing. The second component of the problem are color shifts over the life of the fixture. Life time vari-ations occur due to material degradations, and temperature variations over time. Junc-tion temperature increases over time due to efficiency reduction (reduced light output over time, at same input power, results in more heat generation) and reduced air flow
2
Fig 1: Example of a retail lighting application using solid state lighting fixtures.

Harbers, G, Color Matching LED Sources
through/around the fixture due to dust and contamination. Material degradation occurs due to high temperature, high humidity, and high current (related to the electronic com-ponents). Color shifts are mainly related to material degradation in phosphors, phos-phor binding material (epoxies, silicones), and optical elements (coating & lens materi-als). Color shift with phosphors occurs due to deteriorating quantum efficiency ('bleach-ing'), while lens materials tend to turn yellow or brown when exposed to high temperature or humidity and high intensity blue or UV light.
To avoid these color shifts over time the right materials have to be chosen. This, in practice, requires extensive accelerated life time testing by the manufacturers, or their suppliers. In addition, care has to be taken in the thermal design of the fixture, includ-ing testing of actual operating temperatures, using sufficiently high 'safety' margins to cope with variations in ambient temperat-ures, and increased heat generation over time due to efficiency reduction, and reduced heat exchange by dust build up.
Given these challenges, one might con-sider color control feedback systems, in which a color sensor is used for in-situ cor-
rection of color shifts. Although a full ana-lysis is beyond the scope of this paper, we would like to mention the impact of issues such as color sensor accuracy and place-ment (to be a true representative of the overall color point), and sensor performance over time when operating under different temperatures and levels of contamination (color filter ageing/bleaching).
3. ACCEPTABLE COLOR DIFFERENCES
How color consistent do LED fixtures need to be? The ground work for determining visual sensitivity to small color differences was done by MacAdam in 1942[1], but many follow-up studies have been done as well (for an overview see [2]). MacAdam used a special colorimeter to determine the just-noticeable color differences (JND) between one half of a 2 visual field with a luminance⁰ of 48 cd/m2, with the other half of the match-ing field. The regions with standard devi-ations of color matching (SDCM), as determined by MacAdam, turned out to be ellipses in the CIE 1931 diagram. The size and orientation of these ellipses vary a lot depending on the actual location in the dia-gram.
3
Figure 2: CIE 1931 diagram with the 1x to 7x Standard Deviation of Color Matching ellipses (as established by MacAdam) around the 3000K black body locus,
Harbers, G, Color Matching LED Sources
For the purpose of this paper our focus is on the chromaticity of Tungsten-Halogen lamps, and we chose to limit ourselves to the region around the 3000K color point, located at the black body locus. The Mac-Adam ellipse, or SDCM ellipse for this color point, is shown in figure 2, together with scaled up versions of the ellipse, so that a 'bull's eye' pattern is created. The SDCM is the smallest ellipse in the center. The biggest ellipse is scaled by a factor of 7 compared to the SDCM.
It is important to note that very often the SDCM ellipses are shown in the CIE dia-gram with a 10x magnification (10x linear size), as else they would be too small to be legible when viewed as part of the complete CIE diagram in a book or a paper. The ellipses shown in figure 2 are to a true scale with regards to the axis shown in this sub-section of this CIE diagram.
To get a better understanding of the actual size of the ellipses, the graph also has a secondary grid (in blue) representing lines of equal correlated color temperature (CCT), and lines of equidistance to the black body locus, ∆UV, as defined in [3]. In gen-eral, people in this industry are quite used to the CCT metric, but it is important to note that from a color consistency perspective, it is as important to consistently specify ∆UV metric as well. The ∆UV gives the deviation off the black body locus. Sometimes this number is given in points, with 1 point being a distance of 0.001.
To quantify the relative size of the ellipses in terms that are easier to interpret by lighting architects, a quadrangle is cut from the ellipses along the CCT and ∆UV grid lines. The data for 1x, 2x, 4x, and 7-8x ellipses are shown in table 1. There are dif-ferent ways to cut a quadrangle from an ellipse, but we chose to take the intersec-tions of the SDCM ellipses with the black-
body line and then find approximate com-binations of CCT and ∆UV numbers. This was based on visual observation experi-ments where it was found that to minimize visual differences across a quadrangle it is better to extend to the maximum CCT range rather than the maximum ∆UV range .
As can be concluded from table 1, the size of a SDCM ellipse is quite small with a tolerance in ∆CCT of ±30K, and a ∆UV of ±0.001.
Of great interest is the last row of this table, a 7-8x SDCM, that represents the ANSI-NEMA CCT range and ∆UV range as defined in [5], and which is currently a good representative of chromaticity variation in white LED manufacturing.
The question now is how applicable these sensitivities are to practical lighting installations such as shown in figure 1, hav-ing different field of views, different lumin-ances, and are viewed with different back-ground levels than the experiments done by MacAdam. In addition, we were interested to get feedback on these type of color differ-ences from lighting architects in the field, and not only from expert observers in the laboratory.
4
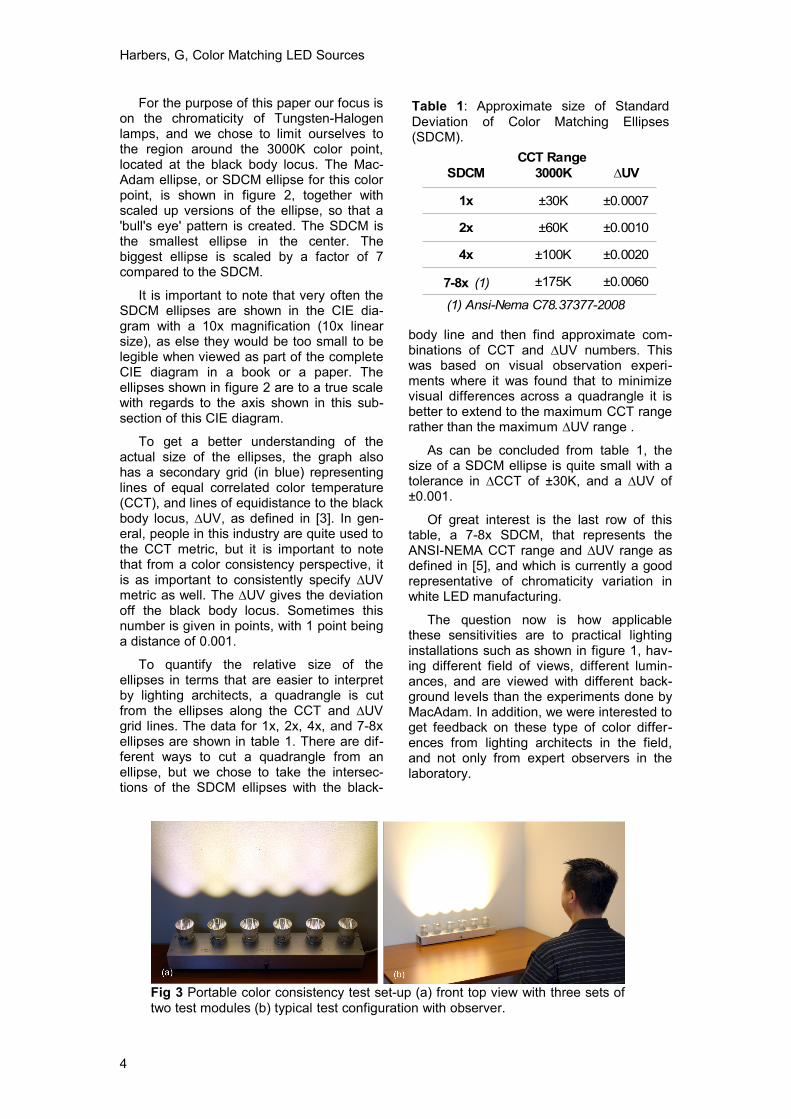
Fig 3 Portable color consistency test set-up (a) front top view with three sets of two test modules (b) typical test configuration with observer.
Table 1: Approximate size of Standard Deviation of Color Matching Ellipses (SDCM).
SDCM ∆UV
1x ±30K ±0.0007
2x ±60K ±0.0010
4x ±100K ±0.0020
±175K ±0.0060
CCT Range3000K
7-8x (1)
(1) Ansi-Nema C78.37377-2008

Harbers, G, Color Matching LED Sources
5
Pitch between modules 10 cm
Viewing distance 1.5 m
Background Illuminance 50 lux
Vertical Illuminance Target Observation Area 600 lux
Luminous Flux for each Module 700 lm
Beam Width (FWHM) 36°
Table 2: Color consistency test set-up parameters
Class 1 Class 2 Class 6
3000
K
±60K ±100K ±175K
ΔUV ±0.001 ±0.002 ±0.006
0.4428 0.4086 0.4473 0.4126 0.4599 0.4270
0.4398 0.4025 0.4412 0.4004 0.4405 0.3902
0.4313 0.3996 0.4273 0.3957 0.4174 0.3824
0.4341 0.4056 0.4328 0.4076 0.4331 0.4178
Table 3: Test samples as used in the color consistency test. Class number is chosen to correspond to the Δuv numbers, being the distance to the black-body locus.
ΔCCT
x1,y
1
x2,y
2
x3,y
3
x4,y
4
Fig 4: Test samples are located at the corners of these quadrangles, which are here shown overlaid over the 1x – 7x SDCM ellipses in the CIE 1931 diagram.

Harbers, G, Color Matching LED Sources
For this purpose we developed a port-able, easy to assemble test set-up which was a reasonable representation of typical lighting configurations as shown in figure 1.
3.1 Color Consistency Test Set-Up
Figures 3(a) and 3(b) show an example of the portable test set-up we used. This partic-ular example has in total 6 SSL modules manufactured by Xicato. The modules con-sist of an array of LEDs in a housing, and the modules are covered with phosphor disks. The disks have a diameter of approx-imately 22mm, which also defines the light output area. The emissions of the disks are approximately Lambertian. The modules can be built up to achieve any desired color point with very high precision. The modules are placed on a mounting bar, which also acts as heat sink, and are positioned with center to center distances of approximately 10 cm.
The modules are mounted in sets of two, with specific color differences per set. The color points of the sets were located at the corners of the CCT and ∆UV ranges shown in Table 3. The first set, called the Class 1 set, had a ∆CCT of ±60K, and a ∆UV of ±0.001. This corresponds to approximately a 2x SDCM ('2 step MacAdam ellipse'). The corresponding color points in CIE 1931 (x,y) coordinates are shown in Table 3. The second set, called Class 2 set, had a CCT range of ±100K, and a ∆UV range of ±0.002. This corresponds to approximately a 4x SDCM ellipse. The last set corresponds to the ANSI-NEMA standard [4], with a ∆CCT of ±175K, and a ∆UV range of ±0.006.
In this case the set-up had three sets of modules, and the total length of the set-up was about 70cm. Besides the set-up with 6 modules (three sets), we created additional set-ups with four modules (two sets), and two modules (one set). On top of the mod-ules a reflector was mounted, creating beams with an approximate full width half maximum (FWHM) angle of 36 . The test⁰ bars were placed along a white wall such that the center of modules was about 10 cm from the wall. Each module had a luminous flux of about 700 lm, resulting in a vertical illuminance of 600 lux in the central viewing area. As this set-up was used in many loca-tions background illumination levels varied, but was typically about 50 lux. Although all the modules are lit in Figure 3, the modules were only lit-up in pairs during the actual
experiments. For each pair the observer was asked to comment on the color differ-ences. Observers were generally asked to view the samples on a distance of 1 to 1.5m, but were allowed to move closer or move further away to create an opinion about the color difference.
The ranges in color difference are shown in a CIE 1931 diagram in figure 4, together with the 1x to 7x SDCM ellipses.
3.2 Results
Due to the portable size of the set-up, it was tested with hundreds of observers in Europe, US, and Japan. In some instances the experiments were performed in well defined conditions, while others were con-ducted impromptu during visits to lighting specifiers or fixture makers.
We obtained consistent feedback from virtually all observers, independent of the viewing conditions:• the class 6 set (±0.006∆UV) was consist-
ently rejected as having unacceptable chromaticity error. Virtually none of the observers wanted to specify, make or use fixtures with these type of color differ-ences;
• the class 2 set (±0.002∆UV) gave a more mixed response: all the observers imme-diately noticed a color difference, but most concluded that they would not accept these types of color differences for architectural and accent lighting applica-tions. Some of them would also not accept these color difference for other applications, such as general lighting, while others thought that it might be acceptable;
• the class 1 set (±0.001∆UV) was con-sidered as acceptable by almost all observers. Color differences were still noticed, but it would require a bit more time and effort to see the actual color dif-ference. A small number of observers concluded that they would like to see even lower color differences than this.
3.3 Discussion
The results indicate that a tolerance in CCT of ± 60K, and a ∆UV of ±0.001 is adequate for virtually all lighting applications – this corresponds to approximately an area of 2x SDCM ellipse. It also indicates that a range of ± 100K, and ∆UV of ± 0.002, correspond-ing to approximately a 4x SDCM ellipse, limits the applications due to color consist-
6

Harbers, G, Color Matching LED Sources
ency errors. The Just Noticeable Difference, defined as the difference where 50% of the observers see a difference, and 50% of observers do not see a difference, is below the class 1 range, as in our experiments almost all the observers still noticed a differ-ence in this range. These tolerances for color differences are smaller than those found by the MacAdam experiments, where the JND level was found to be at the 3x the size of an SDCM ellipse. Similar results to ours were achieved by a team from RPI [5].
4. COLOR MATCHING FUNCTION FAILURES
In the experiments described in the previous sections all the modules had similar spectral power distributions with a color rendering index Ra of about 80. In further experiments we tested visual matching between these modules, and modules with a much higher color rendering index of about Ra of 98 (similar to Tungsten-Halogen lamps). We found that in these experiments the colors were very noticeably different, even after
precisely matching the CIE 1931 chromati-city coordinates. In addition, we found that the high CRI modules matched the color of Tungsten-Halogen lamps much closer than the modules with low CRI. After double checking the test results, and repeating experiments on different integrating spheres and spectro-radiometers, we confirmed the results. After this observation, we decided to adjust the chromaticity of the low CRI ver-sion to achieve a nearly perfect visual match to the high CRI versions, in a set-up as shown in Figure 3.
The spectral compositions of the result-ing visually matched pair of a low and high CRI sample are shown in figure 5. The spectral power distribution of the low CRI version is shown as (A), while the high CRI version is shown as (B). The associated CIE 1931 chromaticity coordinates for both spec-tra are shown in Table 4. Although we see a big difference in CCT (33K), ∆UV (0.0021), and x,y coordinates, we got a virtually per-fect visual match, as confirmed by 8 observ-ers. The actual color points of this test are
7
Table 4 Color data for two visual matched samples.
Sample A Sample B Δ
CCT 3013 2980 33
ΔUV 0.0017 -0.0004 0.0021
Ra 79.4 98.3 -18.8
CIE1931 x 0.4387 0.4379 0.0007
CIE1931 y 0.4093 0.4037 0.0056
Fig 5 Spectral power distributions of two modules with a nearly perfect visual match, but with different CIE 1931 chromaticities (see table 4).
Fig 6 CIE 1931 chromaticity coordinates of the visual matched pairs.
Harbers, G, Color Matching LED Sources
shown in Figure 6, in relation to the size of the 1x to 4x SDCM ellipses..
Failure of the CIE 1931 color matching functions, particularly in the blue region (450nm - 470nm) have been reported by multiple authors [6,7]. Without going into details about these color matching functions' failures, it is important to note that even with fixtures having light outputs perfectly match-ing the CIE 1931 color coordinates, color matching errors equivalent to 30K in CCT, and ∆UV of 0.002 can occur. These types of errors depend on the shape of the spec-trum, and can be higher or lower, depending on how close the spectral power distribution matches to the spectrum of a black body source (or daylight for that matter). This error is significantly higher than what would be acceptable for a class 1 color consist-ency, and falls within the realm of a class 2 consistency.
5. DISCUSSION & CONCLUSIONS
Achieving good visual color consistency between light fixtures is difficult. This is true for not only conventional lamp fixtures, but in particular for solid state lighting fixtures, due to large number of potential color errors, and the claimed long life time of SSL fixtures.
Visibility of color consistency errors is enhanced by two other contributing factors. First, luminous flux levels of LEDs are relat-ively low which requires them to be utilized in arrays. Second, closer spacing of fixtures in installs only makes color inconsistencies more readily apparent. This is particularly true for architectural lighting or lighting applications having mainly monochrome scenes. In these cases CCT variations should be limited to ±60K, with ∆UV's of ±0.001, corresponding to class 1 color con-sistency as defined in this paper.
Although difficult, we have found that good color consistency can be achieved. It requires a thorough understanding of all the potential color consistency errors in the sys-tem and, in particular, a deep understanding and characterization of LED and phosphor properties. We also found that current bin-ning practices used by LED manufacturers are inadequate and result in unacceptable color differences and color points need to be corrected. Last but not least, accelerated life tests need to be performed to check color shifts over time, in order to make sure that the proper materials are utilized.
Authors:Gerard Harbers Kelly McGroddy Raghuram PetluriPeter K. TsengJohn Yriberry
Contact information for all:Xicato Inc4880 Stevens Creek Boulevard #204San Jose, CA 95129 [email protected]://www.xicato.com
REFERENCES
1. MacAdam, D.L., Visual sensitivities to color differences in daylight, J.Op-t.Soc.Am. 32, 247 (1942)
2. Wyszecki & Stiles, Color Science, 2nd Ed, Wiley (2000)
3. Robertson, Alan R. Computation of Cor-related Color Temperature and Distribu-tion Temperature". JOSA 58 11, 1528–1535 (1968)
4. ANSI NEMA ASNLG C78.377-2008, Spe-cifications for the Chromaticity of Solid State Lighting Products (2008)
5. Rensselaer Polytechnic Institute, Lighting Research Center, Developing Color Tol-erance Criteria for White LEDs, Assist Program.
6. Vos, J.J. Colorimetric and photometric properties of a 2 fundamental observer,⁰ Color Res. & Appl. 3, 125 (1978)
7. Stiles, W.S. & Burch, J.M., N.P.L. colour-matching function investigation, Proc. Nat. Acad. Sci. 45, 100 (1959).
8