visual bi - insight · pdf file“are there any reporting best practices, ... beyond just...
TRANSCRIPT

Better Data by Design
Rudy Nadilo President North America [email protected]
Visual BI The better way to present data

Better Data by Design
• Are expectations changing when it comes to the delivery of research results?
• Can modern technology platforms increase the presentation value of MR data?
The Question?

Better Data by Design
“As much as we try, we are continuously re-writing our reports so they are attuned to the executive audience.” “MR insights need to tell a story; we need Do-It-Yourself and ‘InfoGraphic in a Minute’.” “Are there any reporting best practices, tools or resources that can “come to the rescue” here?”
What are Clients saying? Greenbook Blog

Better Data by Design
What are Clients saying? Greenbook Blog
“There is a need to have data visualizations move beyond just pie and bar charts.” “Can the firms & agencies walk this last mile and not leave it to just a PPT presentation?” “Around here we say PPT = No Power, No Point!”

Better Data by Design
Clients say they want better reporting…
but vendors continue to
use PowerPoint.
There has got to be a better way!

Better Data by Design
The Research Process
Design
• Done by 3rd party Research Vendor for client
• Done by internal MR department in large clients
Research Supplier
Data File
“Design”
Execute
• Programming – Voxco
– Questback
– Confirmit
– Qualtics
– etc
• Sample – RIWI
– Survey Sampling
– GMI
– Research Now
• Outsourcing – Annik
– Ugam
– Mrops
3rd Party Vendor
“Execute”
Analyze/Report
• Tools Used – Cross Tabbing
Tools
– Excel
– PowerPoint
– SPSS
Research Supplier
“Reporting”
Better Data by Design
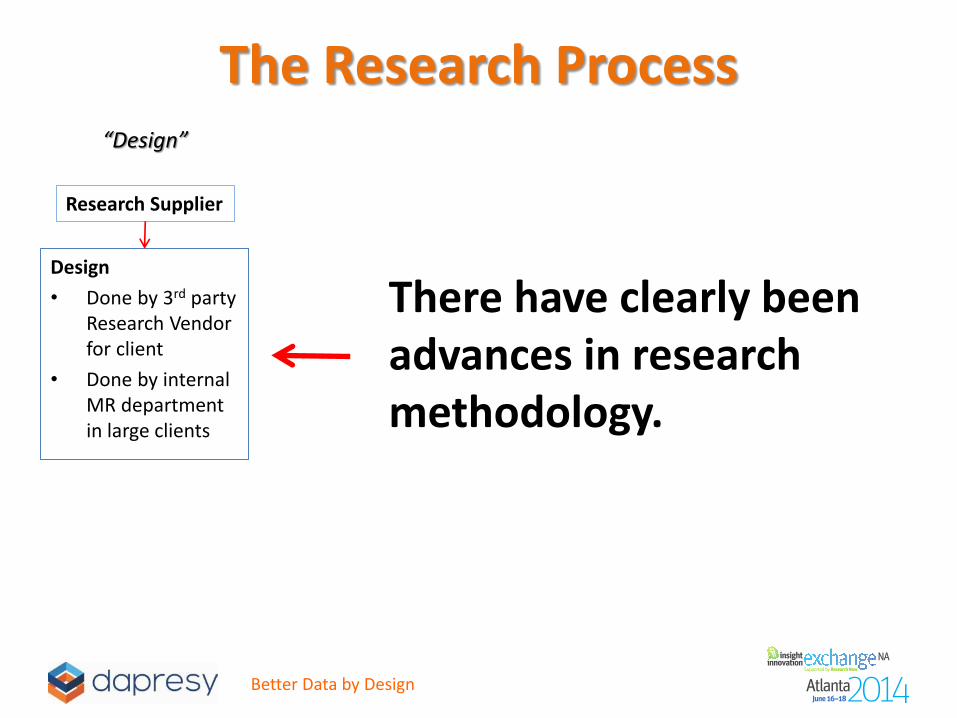
The Research Process
Design
• Done by 3rd party Research Vendor for client
• Done by internal MR department in large clients
Research Supplier
“Design”
There have clearly been advances in research methodology.

Better Data by Design
The Research Process
Execute
• Programming – Confirmit
– Voxco
– Qualtics
– Questback
– etc
• Sample – Survey Sampling
– GMI
– Research Now
• Outsourcing – Annik
– Ugam
– Mrops
– etc
3rd Party Vendor
“Execute”
And major advances in programing & sample acquisition.

Better Data by Design
But…we have been using the same reporting tools for over 20 years!
Analyze/Report
• Tools Used – Cross Tabbing
Tools
– Excel
– PowerPoint
– SPSS Yet - clients are
expecting more user friendly results.

Better Data by Design
Excel Macros
PowerPoint Animation
Linking Excel to PowerPoint
Linking PowerPoint Charts to external tools

Better Data by Design
Crude, Kludged, Clunky Workarounds
at Best!

Better Data by Design

Better Data by Design
Better Data by Design
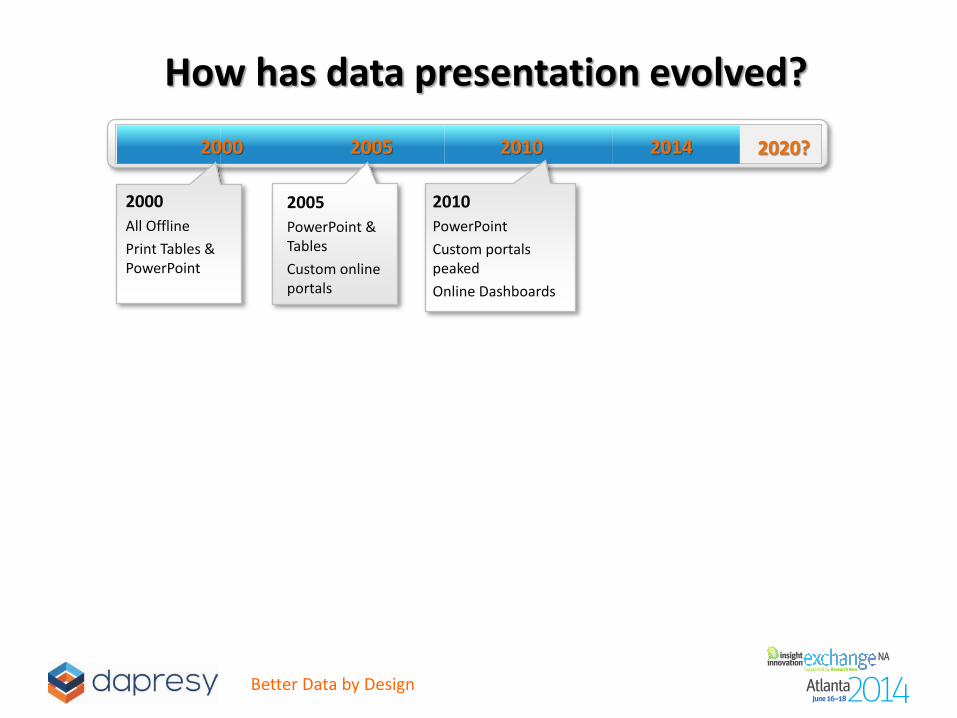
2020? 2005 2000 2010 2014
2000
All Offline
Print Tables & PowerPoint
2005
PowerPoint & Tables
Custom online portals
2010
PowerPoint
Custom portals peaked
Online Dashboards
How has data presentation evolved?

Better Data by Design
2020? 2005 2000 2010 2014
2000
All Offline
Print Tables & PowerPoint
2005
PowerPoint & Tables
Custom online portals
2010
PowerPoint
Custom portals peaked
Online Dashboards
2014
MR Information Strategy
• Visually Engaging
• Dashboard Centric
• Organization Friendly
What are Research Buyers asking for?
Technical Side
• Integration to existing intranet
• DIY Dashboards
• Interactive tools for:
• visualization
• tabulation
• “All in One” Comprehensive reports
• View on Mobile & Tablet Devices
Business Side
• More available to the organization
• MR data viewed & used:
• operationally
• personalized by role
• Fast deployment – “real time”
• Cost effective
• Online deployment for all projects
Better Data by Design
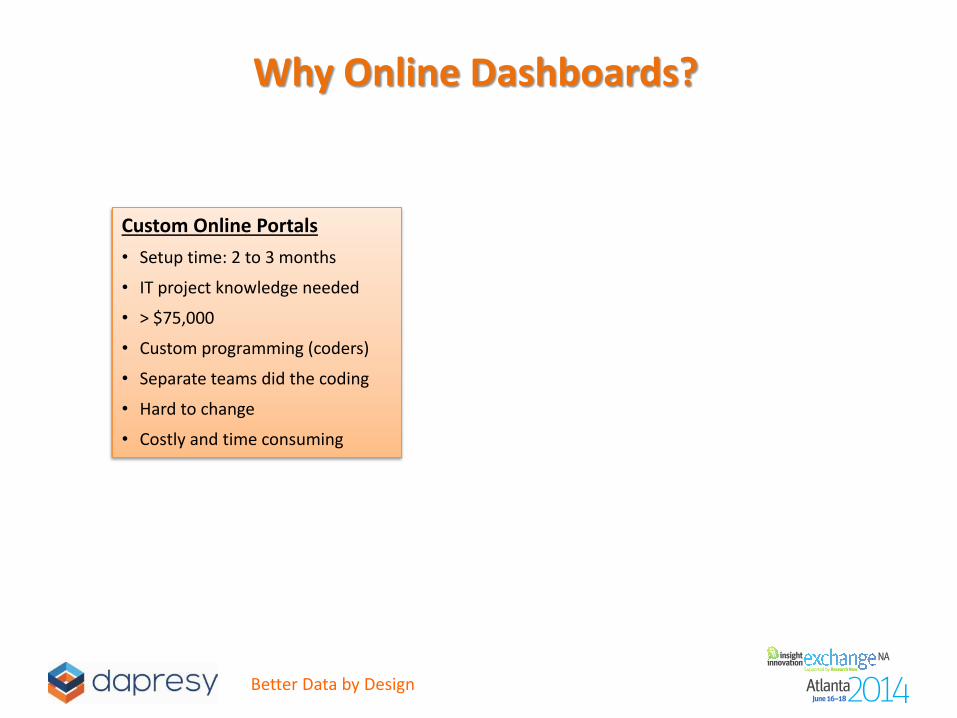
Why Online Dashboards?
Custom Online Portals
• Setup time: 2 to 3 months
• IT project knowledge needed
• > $75,000
• Custom programming (coders)
• Separate teams did the coding
• Hard to change
• Costly and time consuming

Better Data by Design
Why Online Dashboards?
Custom Online Portals
• Setup time: 2 to 3 months
• IT project knowledge needed
• > $75,000
• Custom programming (coders)
• Separate teams did the coding
• Hard to change
• Costly & time consuming
DIY Online Dashboards
• Setup time: 2 hours to a few days
• DIY Dashboard; PowerPoint knowledge
• ~ $20,000
• “Drag & Drop” – No programming
• Researchers control process
• Easy to change
• Cost effective & fast

Better Data by Design
• Publish MR data thru company Intranet
• Deploy to a wider audience of stakeholders to participate & utilize the MR results
• Move MR Information from Push to Pull through interactive consumption
• Create an organization that acts proactively to MR data
MR Information Strategy

Better Data by Design
Imagine instead of static slides . . . you could provide dynamically
accessible data to the decision maker in a visually engaging format.

Better Data by Design
StoryTelling

Better Data by Design
Start the “Story” Simple to Understand Overview Results
• Multi object dashboard; different projects in one view
• Each item in the dashboard is the entrance to a detailed report
• Different items shown depending on user role
• Results are always up-to-date
“Gateway to multiple Projects” The user clicks a dashboard

Better Data by Design
InfoGraphics “Tell the Story”
• Visually explain complex information
• InfoGraphic automatically changes when target group changes (avoid manual work)
• Drill Down for more comprehensive reports
“A picture speaks a 1000 words” The user clicks an area of interest
Better Data by Design
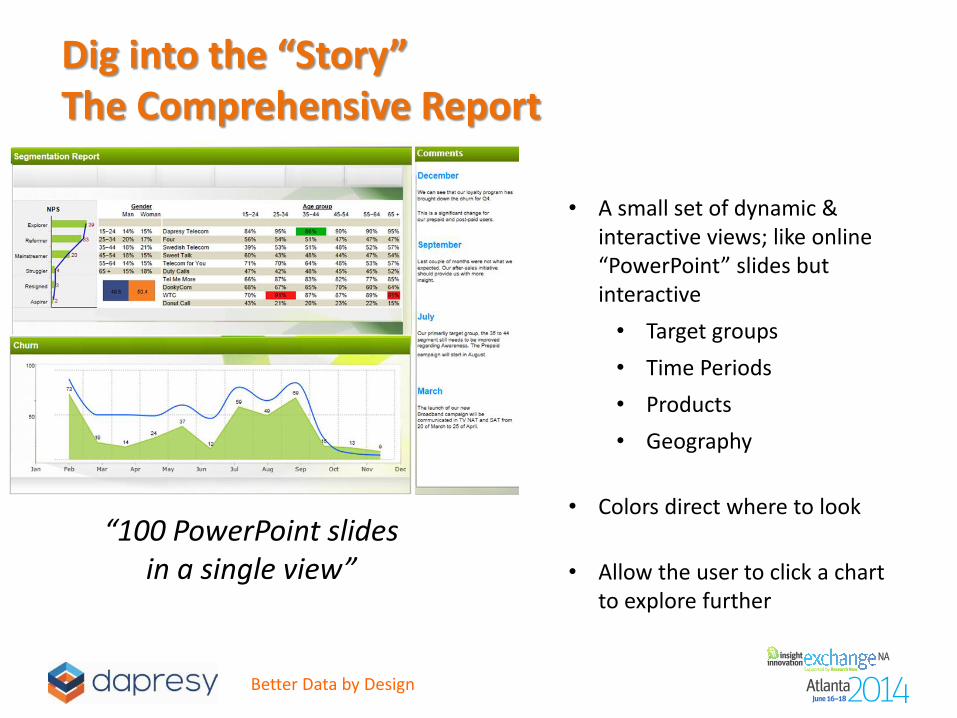
Dig into the “Story” The Comprehensive Report
• A small set of dynamic & interactive views; like online “PowerPoint” slides but interactive
• Target groups
• Time Periods
• Products
• Geography
• Colors direct where to look
• Allow the user to click a chart to explore further
“100 PowerPoint slides in a single view”

Better Data by Design
Visual BI The better way to present data
Visual BI Generic BI
(Tableau actual screenshots)

Better Data by Design
Visual BI Present a story & Engage the viewer
25
Visual BI
Generic BI
(Spotfire actual screenshots)

Better Data by Design
Unlimited Design Possibilities

Better Data by Design
Why are we still stuck on PowerPoint?

Better Data by Design
PPT is linear, tedious & iterative Countries
Regions Brands
Salesman Accounts
Demographics
Literally Hundreds of Slides
User “Unfriendly”
Updates consume man-weeks of time!
Never enough – ever expanding!

Better Data by Design
Choose
Template
There is a Better Way!
Demos Customer Product
Define Dashboard sections
Build 4-5
Key Pages
Country Region Brands Account Salesman Demos Define
Dynamic Filters
Handful of Key
Dynamic Slides User
Friendly Automatic
Updates Easy to
Modify Efficient to
Maintain
