visual attention and the acquisition of information in ... · visual attention and the acquisition...
TRANSCRIPT
Visual attention and the acquisition of information inhuman crowdsAndrew C. Gallupa,1,2, Joseph J. Haleb,2, David J. T. Sumpterc, Simon Garniera, Alex Kacelnikb, John R. Krebsb,and Iain D. Couzina,1
aDepartment of Ecology and Evolutionary Biology, Princeton University, Princeton, NJ 08544; bDepartment of Zoology, University of Oxford, Oxford OX1 3PS,United Kingdom; and cDepartment of Mathematics, University of Uppsala, 75106 Uppsala, Sweden
Edited by Simon A. Levin, Princeton University, Princeton, NJ, and approved March 20, 2012 (received for review September 30, 2011)
Pedestrian crowds can form the substrate of important sociallycontagious behaviors, including propagation of visual attention,violence, opinions, and emotional state. However, relating in-dividual to collective behavior is often difficult, and quantitativestudies have largely used laboratory experimentation. We presenttwo studies in which we tracked the motion and head directionof 3,325 pedestrians in natural crowds to quantify the extent,influence, and context dependence of socially transmitted visualattention. In our first study, we instructed stimulus groups ofconfederates within a crowd to gaze up to a single point atop ofa building. Analysis of passersby shows that visual attentionspreads unevenly in space and that the probability of pedestriansadopting this behavior increases as a function of stimulus groupsize before saturating for larger groups. We develop a model thatpredicts that this gaze response will lead to the transfer of visualattention between crowdmembers, but it is not sufficiently strongto produce a tipping point or critical mass of gaze-following thathas previously been predicted for crowd dynamics. A secondexperiment, in which passersby were presented with two stimulusconfederates performing suspicious/irregular activity, supportsthe predictions of our model. This experiment reveals that visualinteractions between pedestrians occur primarily within a 2-mrange and that gaze-copying, although relatively weak, canfacilitate response to relevant stimuli. Although the above aspectsof gaze-following response are reproduced robustly betweenexperimental setups, the overall tendency to respond to a stimulusis dependent on spatial features, social context, and sex ofthe passerby.
behavioral contagion | joint visual attention | social influence | vigilance
Among social organisms, the ability to perceive and interpretthe behavior of others can be critical to survival, whether it
provides clues to foraging sites (1) or an alert to an immediatepredation risk (2, 3). Close behavioral coupling, such as collec-tive movements of fish schools or bird flocks, leads to the am-plification of local perturbations and can create sensory rangesexceeding the range of individual perception (4, 5), ultimatelyimproving the ratio of responding to a stimulus per unit of ob-servation effort. One effective means by which individuals trackfeatures in the local environment is to monitor the visual at-tention of others through the assessment of gaze direction. Gaze-following, or the use of perceived gaze direction to shift visualattention, is a common and recognizable phenomenon in humansas well as a number of other vertebrate species (6). In particular,gaze-following has been a popular area of investigation amongpsychologists, often in the context of testing individuals’ percep-tions of others’ perspectives in dyadic interactions (7). Despitea growing literature in this subject area (8, 9), little is known ofhow gaze-following propagates in a natural and interactive setting,such as the setting experienced in crowded public environments,or what impact it has on collective visual attention. In one of theearliest studies of gaze-following in human crowds, the study byMilgram et al. (10) in 1969 instructed stimulus groups to stop andstare up into a building window on a crowded street in New York
City. They then measured the probability of passersby adoptingthis behavior over a 15-m cross-section of the street, showing anincrease in gaze-following response with the size of the stimulusgroup. Although informative to the effects of social influence inpublic settings, the findings from the work by Milgram et al. (10)raise several interesting questions.First, it is unclear as to whether there is a quorum-like re-
lationship in the proportion of pedestrians looking up as a func-tion of stimulus group size (11). The threshold at which one-halfof the passersby look up is very close to one stimulus individual,making it difficult to determine empirically whether the groupresponse is a steep threshold. Depending on the functional formby which behavior is transferred from one individual to another,various consequences can be seen at the level of the group. Theworks by Granovetter (12) and Shelling (13) first describeda model where individuals decide whether to engage in someform of action (such as rioting or voting for a particular party)when a threshold number of others has already engaged in theaction. In such models, a sigmoid or quorum-like response,where above a certain group size, an action becomes much moreprobable, results in rapid adoption of a common behavior bymembers of the group and a strong dependency on initial con-ditions (14, 15). A quorum response can result in tipping points(16) or crowd crystallization (17), where nearly all group mem-bers adopt the action irrespective of the size of the stimulusgroup that originally elicited a response. However, a responsewhere the probability of adopting a behavior increases at firstproportionally and then saturates with stimulus group size doesnot tend to result in crystallization of choices and also results in aslower collective response (15). Organisms as diverse as school-ing fish (18) and ant colonies (19) seem to adopt quorum-likeresponses in following conspecifics, whereas some species ofmonkeys show linear-like responses (20).Second, another question arising from the work by Milgram
et al. (10) concerns the functional reasons why individuals mayfollow the gaze of other pedestrians. One hypothesis is that gaze-following is a nonspecific expression of the tendency of individ-uals to socially conform to the behavior of others (21, 22), andtherefore, if passersby see a fellow pedestrian looking up, theyexhibit a propensity to look up as well, just as they would adoptposture or any other noninformative trait. This type of confor-mity can provide benefits to the individual by means of affiliation
Author contributions: J.J.H., A.K., J.R.K., and I.D.C. designed research; J.J.H., S.G., and I.D.C.performed research; A.C.G., J.J.H., D.J.T.S., and S.G. analyzed data; and A.C.G., J.J.H.,D.J.T.S., S.G., A.K., J.R.K., and I.D.C. wrote the paper.
The authors declare no conflict of interest.
This article is a PNAS Direct Submission.
Freely available online through the PNAS open access option.1To whom correspondence may be addressed. E-mail: [email protected] or [email protected].
2A.C.G. and J.J.H. contributed equally to this work.
This article contains supporting information online at www.pnas.org/lookup/suppl/doi:10.1073/pnas.1116141109/-/DCSupplemental.
www.pnas.org/cgi/doi/10.1073/pnas.1116141109 PNAS | May 8, 2012 | vol. 109 | no. 19 | 7245–7250
PSYC
HOLO
GICALAND
COGNITIVESC
IENCE
S

and social approval from others (23) or maintenance of a favor-able self-concept (24). A second information-specific hypothesisis that passersby tend to follow gaze direction because it mayprovide them with relevant information about either that per-son’s intentions or some aspect of the local environment (e.g.,a localized threat), which will allow them to react accordingly(23). To some degree, this question can be investigated bylooking at the spatial positioning of individuals when looking up:are passersby more or less likely to look up when they know theyare in the field of view of the stimulus group? In other words, ifstimulus members cannot see the individual, the first hypothesiswould predict that there should be no reason to adopt this norm.Third, it is interesting to question whether passersby can ac-
quire relevant information from the visual attention of others(e.g., can cues provided by the visual attention of others providevaluable information regarding the location and identificationof pertinent but weak or ambiguous stimuli?). Although socialconnections among pedestrians are often limited because of briefcontact and continuous movement, such interactions amongpassersby (25, 26) may create means by which social cues couldbe transmitted among pedestrians, and thus affect individuals’awareness of their environment. For example, when crossing theroad, pedestrians monitor and copy the movements of othersaround them, with decisions to cross being socially influenced(27). Furthermore, experimental studies of consensus movementdecisions have shown that people are capable of identifyingindividuals within crowds that possess information through sub-tle nonverbal social cues (28).Fourth, we question the degree to which such experiments are
context-dependent. The experiments in the work by Milgramet al. (10) were performed on a city street in New York City, butit remains unknown whether different pedestrian settings wouldproduce similar results. For example, fish modify their actions ina context-dependent way, relying more on social information inrisky situations (29, 30).To investigate these four questions, we performed two ma-
nipulative experiments where we tracked the motion and headorientation of pedestrians in public settings. The first experimentwas similar in design to the experiments in the work by Milgramet al. (10); in our case, we included a spatiotemporal analysis ofpedestrian movements. In the second experiment, we investi-gated whether visual orientation of other pedestrians can be usedas a means of acquiring relevant information about the localenvironment. By conducting this second experiment in two dif-ferent urban scenarios and presenting passersby with two dif-ferent kinds of weak stimuli, we also tested the importance ofcontext in gaze-following.
ResultsCollective Visual Attention in Crowds. In the first experiment, themovements and gaze-following behaviors of 2,822 pedestrianswere quantified in a busy shopping street in Oxford, UnitedKingdom. Individuals were filmed using an overhead camera asthey passed through a rectangular filming region of 10 (hori-zontal) × 8 (vertical) m. Each trial consisted of stimulus groupsof 1, 3, 5, 7, 9, 12, or 15 (6–14 replicates of each) confederates(comprised of both males and females) entering the scene andstanding in the center of the filming region for a period of 60 swhile looking up at the camera (Fig. S1). Whereas the work byMilgram et al. (10) reported the overall proportion of pedes-trians adopting the gaze direction of the stimulus groups (whilewalking or stopped), we were able, in addition, to track themotion of every pedestrian in our trials, recording (at a rate of 25frames/s) their speed, accelerations, and proximity to others andwhen, where, and for how long gaze was followed. We useda multiple analysis of covariance to explore how the proportionof time spent looking up and stopped while looking up differedamong individuals as a function of stimulus group size after
controlling for features such as crowd density and pedestrianwalking speed. Because the movement, position, and behavior ofpassersby clearly distinguished them from the stimulus groupmembers in our experiments, we did not investigate the self-catalytic effect of passersby potentially becoming a part of thestimulus group by copying gaze direction within our statisticalanalyses. Unlike passersby in the street, the stimulus groupmembers remained completely stationary with a central positionand fixed gaze direction, thus allowing us to investigate thespatial aspects of gaze-following around this stimulus. We do,however, incorporate this positive feedback response betweenthe passersby and the group level effect in a simulation model(see below).Across all replicates of this experiment, 26.9% (760/2,822) of
passersby adopted the gaze direction of the stimulus group, andof these passersby, 14.2% (108/760) stopped walking to look up.Of the passersby that copied this gaze direction, 46.6% (354/760)looked up multiple times. Only 3.7% (28/760) looked in thestimulus direction as many as five times, but gaze duration seemsstereotypical and not dependent on whether that individual hadpreviously looked up [F(4,1,332) = 0.596, P > 0.05]. Althoughboth sexes were equally likely to look up (male = 28.8%, female =26.2%), males spent a larger percentage of time copying thisgaze direction (SI Methods).We found that the mean speed of individual pedestrians fol-
lowed a Gaussian distribution with a mean of 1.24 ms−1 and SDof 0.37 ms−1, similar to previous data obtained from variouscities across the world (31, 32). The mean walking speed ofpedestrians (i.e., not when stopped or gaze-following) was neg-atively associated with the proportion of total time looking[F(1,2,821) = 22.755, P < 0.001] and stopped and looking[F(1,2,821) = 43.833, P < 0.001], indicating that slower walkingpedestrians were more influenced by the stimulus. Similarly,the proportion of time engaged in these behaviors was lower athigher crowd densities [looking: F(1,2,821) = 16.244, P < 0.001;stopped and looking: F(1,2,821) = 5.470, P < 0.05].The proportion of pedestrians copying the gaze direction in-
creased as a function of the stimulus group size (Fig. 1). Fur-thermore, the proportion of individual time spent looking andstopping to look up also increased as a function of stimulusgroup size [all looking: F(6,2,821) = 37.329, P < 0.001; stoppingand looking: F(6,2,821) = 8.835, P < 0.001] (Fig. S2). Posthoc
Fig. 1. The relationship between the proportion of passersby that will copythe gaze of the stimulus group as a function of stimulus group size fitted toEq. 1. The solid line represents the current experiments (m = 0.66, T = 7.0, andk = 1.38; mean ± SE shown). The dotted line is data from the work byMilgramet al. (10) (m = 0.92, T = 1.2, and k = 1.05; no error measures available).
7246 | www.pnas.org/cgi/doi/10.1073/pnas.1116141109 Gallup et al.
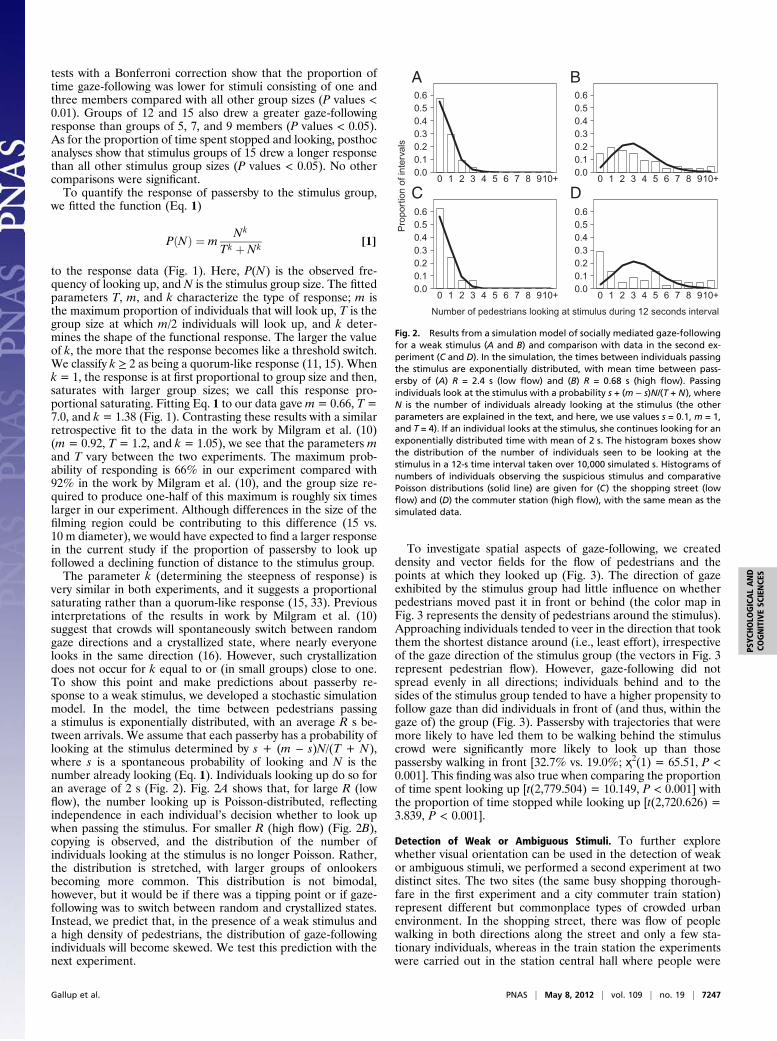
tests with a Bonferroni correction show that the proportion oftime gaze-following was lower for stimuli consisting of one andthree members compared with all other group sizes (P values <0.01). Groups of 12 and 15 also drew a greater gaze-followingresponse than groups of 5, 7, and 9 members (P values < 0.05).As for the proportion of time spent stopped and looking, posthocanalyses show that stimulus groups of 15 drew a longer responsethan all other stimulus group sizes (P values < 0.05). No othercomparisons were significant.To quantify the response of passersby to the stimulus group,
we fitted the function (Eq. 1)
PðNÞ ¼ mNk
Tk þ Nk [1]
to the response data (Fig. 1). Here, P(N) is the observed fre-quency of looking up, and N is the stimulus group size. The fittedparameters T, m, and k characterize the type of response; m isthe maximum proportion of individuals that will look up, T is thegroup size at which m/2 individuals will look up, and k deter-mines the shape of the functional response. The larger the valueof k, the more that the response becomes like a threshold switch.We classify k ≥ 2 as being a quorum-like response (11, 15). Whenk= 1, the response is at first proportional to group size and then,saturates with larger group sizes; we call this response pro-portional saturating. Fitting Eq. 1 to our data gavem= 0.66, T =7.0, and k = 1.38 (Fig. 1). Contrasting these results with a similarretrospective fit to the data in the work by Milgram et al. (10)(m = 0.92, T = 1.2, and k = 1.05), we see that the parameters mand T vary between the two experiments. The maximum prob-ability of responding is 66% in our experiment compared with92% in the work by Milgram et al. (10), and the group size re-quired to produce one-half of this maximum is roughly six timeslarger in our experiment. Although differences in the size of thefilming region could be contributing to this difference (15 vs.10 m diameter), we would have expected to find a larger responsein the current study if the proportion of passersby to look upfollowed a declining function of distance to the stimulus group.The parameter k (determining the steepness of response) is
very similar in both experiments, and it suggests a proportionalsaturating rather than a quorum-like response (15, 33). Previousinterpretations of the results in work by Milgram et al. (10)suggest that crowds will spontaneously switch between randomgaze directions and a crystallized state, where nearly everyonelooks in the same direction (16). However, such crystallizationdoes not occur for k equal to or (in small groups) close to one.To show this point and make predictions about passerby re-sponse to a weak stimulus, we developed a stochastic simulationmodel. In the model, the time between pedestrians passinga stimulus is exponentially distributed, with an average R s be-tween arrivals. We assume that each passerby has a probability oflooking at the stimulus determined by s + (m − s)N/(T + N),where s is a spontaneous probability of looking and N is thenumber already looking (Eq. 1). Individuals looking up do so foran average of 2 s (Fig. 2). Fig. 2A shows that, for large R (lowflow), the number looking up is Poisson-distributed, reflectingindependence in each individual’s decision whether to look upwhen passing the stimulus. For smaller R (high flow) (Fig. 2B),copying is observed, and the distribution of the number ofindividuals looking at the stimulus is no longer Poisson. Rather,the distribution is stretched, with larger groups of onlookersbecoming more common. This distribution is not bimodal,however, but it would be if there was a tipping point or if gaze-following was to switch between random and crystallized states.Instead, we predict that, in the presence of a weak stimulus anda high density of pedestrians, the distribution of gaze-followingindividuals will become skewed. We test this prediction with thenext experiment.
To investigate spatial aspects of gaze-following, we createddensity and vector fields for the flow of pedestrians and thepoints at which they looked up (Fig. 3). The direction of gazeexhibited by the stimulus group had little influence on whetherpedestrians moved past it in front or behind (the color map inFig. 3 represents the density of pedestrians around the stimulus).Approaching individuals tended to veer in the direction that tookthem the shortest distance around (i.e., least effort), irrespectiveof the gaze direction of the stimulus group (the vectors in Fig. 3represent pedestrian flow). However, gaze-following did notspread evenly in all directions; individuals behind and to thesides of the stimulus group tended to have a higher propensity tofollow gaze than did individuals in front of (and thus, within thegaze of) the group (Fig. 3). Passersby with trajectories that weremore likely to have led them to be walking behind the stimuluscrowd were significantly more likely to look up than thosepassersby walking in front [32.7% vs. 19.0%; ҳ2(1) = 65.51, P <0.001]. This finding was also true when comparing the proportionof time spent looking up [t(2,779.504) = 10.149, P < 0.001] withthe proportion of time stopped while looking up [t(2,720.626) =3.839, P < 0.001].
Detection of Weak or Ambiguous Stimuli. To further explorewhether visual orientation can be used in the detection of weakor ambiguous stimuli, we performed a second experiment at twodistinct sites. The two sites (the same busy shopping thorough-fare in the first experiment and a city commuter train station)represent different but commonplace types of crowded urbanenvironment. In the shopping street, there was flow of peoplewalking in both directions along the street and only a few sta-tionary individuals, whereas in the train station the experimentswere carried out in the station central hall where people were
Number of pedestrians looking at stimulus during 12 seconds interval
Pro
porti
on o
f int
erva
ls
0.00.10.20.30.40.50.6
0 1 2 3 4 5 6 7 8 910+0.00.10.20.30.40.50.6
0 1 2 3 4 5 6 7 8 910+
0.00.10.20.30.40.50.6
0 1 2 3 4 5 6 7 8 910+0.00.10.20.30.40.50.6
0 1 2 3 4 5 6 7 8 910+
A B
C D
Fig. 2. Results from a simulation model of socially mediated gaze-followingfor a weak stimulus (A and B) and comparison with data in the second ex-periment (C and D). In the simulation, the times between individuals passingthe stimulus are exponentially distributed, with mean time between pass-ersby of (A) R = 2.4 s (low flow) and (B) R = 0.68 s (high flow). Passingindividuals look at the stimulus with a probability s + (m − s)N/(T + N), whereN is the number of individuals already looking at the stimulus (the otherparameters are explained in the text, and here, we use values s = 0.1, m = 1,and T = 4). If an individual looks at the stimulus, she continues looking for anexponentially distributed time with mean of 2 s. The histogram boxes showthe distribution of the number of individuals seen to be looking at thestimulus in a 12-s time interval taken over 10,000 simulated s. Histograms ofnumbers of individuals observing the suspicious stimulus and comparativePoisson distributions (solid line) are given for (C) the shopping street (lowflow) and (D) the commuter station (high flow), with the same mean as thesimulated data.
Gallup et al. PNAS | May 8, 2012 | vol. 109 | no. 19 | 7247
PSYC
HOLO
GICALAND
COGNITIVESC
IENCE
S

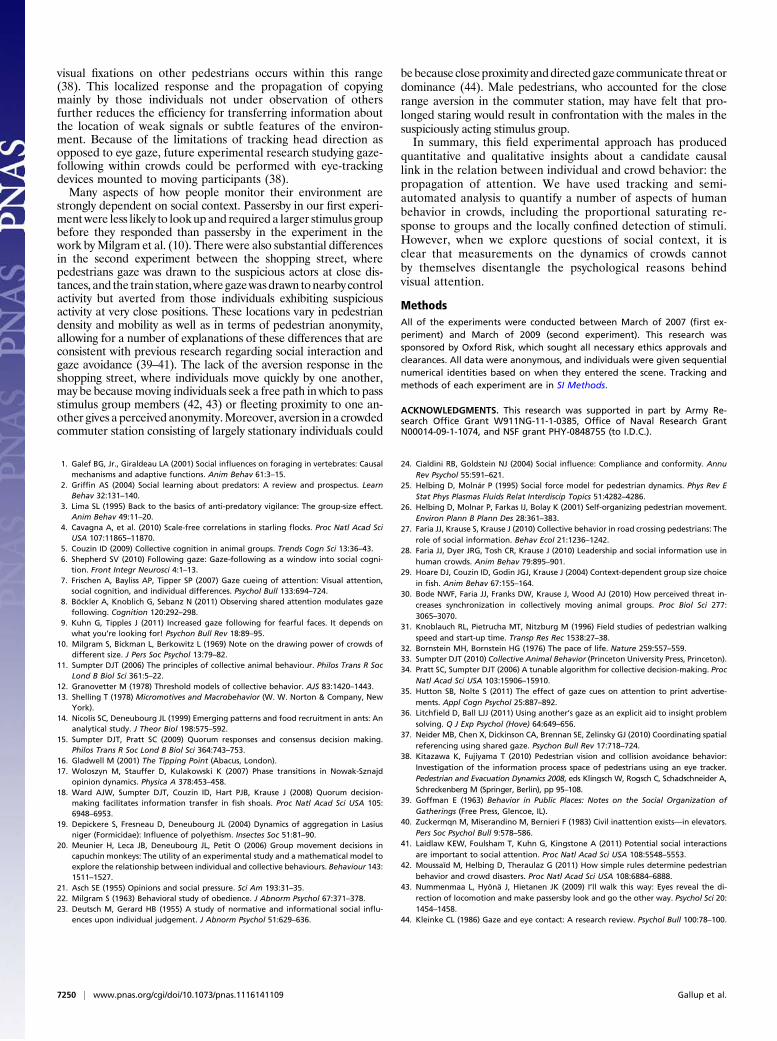
mostly stationary, waiting for information about train departures/arrivals. Two male confederates were asked to stand within thecrowd for 60 s and instructed to act either naturally (as if theywere waiting for somebody within the crowd; control) or in sus-picious/irregular manner (experimental; one member sketcheda map of the environment and took notes on a pad of paper, andthe other member held a video camera at waist level and engagedin apparent covert filming of the environment, although they werenot actually recording the scene). Therefore, unlike the previousstudy, members of the stimulus group were not facing in any onedirection, and here, we were interested in the pedestrians’ visualorientation in response to the location of these individuals. Ninereplicates of each condition were performed in the same spot ofboth locations, and the motion and head direction of surroundingpedestrians was tracked (Fig. 4 and Fig. S3).The stimulus used in these experiments was relatively in-
conspicuous compared with the first experiment, where individ-uals remained completely still and maintained a direct upwardgaze. As a result, visual orientation in response to the stimulusgroup was not detectable at distances exceeding ∼2 m from itscentroid (Fig. 5). Thus, in our analysis, we consider only thosepedestrians (moving and stationary) whose average positionthroughout the experiment was within a 2-m range (n = 503),and this group was broken down into three categories (<1.500,1.500–1.749, and 1.750–2.000 m), in which each group consistedof roughly one-third of all tracked pedestrians per location. Toconfirm the validity of this approach, we also compared theseeffects with the effects observed using the continuous data fordistance. Because of the relatively high pedestrian densities inthe commuter station compared with the shopping street (0.223 ±0.098 vs. 0.088 ± 0.031 m2), we needed to compensate for in-terpedestrian occlusion (Fig. S4) when calculating the proportionof time pedestrians spent directing their attention to either of thestimulus group members during the course of each experiment.Therefore, only frames where a particular pedestrian had a clearline of sight to at least one of the stimulus group members wereincluded in the analysis.A three-way analysis of variance was used to analyze differ-
ences in response by experimental condition, site location, andaverage distance from the centroid of the stimulus group. Crowd
density and the walking speed of pedestrians were initially in-cluded as covariates but were then removed after failing tosignificantly predict visual orientation to either control or sus-
Fig. 3. The spatial distribution of pedestrians’ locations (Upper) and gaze-following behavior (Lower) within the 10 (horizontal) × 8-m (vertical) filmingregion. For illustrative purposes, this area was subdivided into 50-cm2 boxes, where blues indicate low density, reds indicate high density, and vectors rep-resent the averaged course of pedestrian flow in each box. The white arrows represent the location of the stimulus group and direction of gaze. Datapresented are the mean for all replicates for each of three group sizes: (A) one, (B) five, and (C) nine.
Fig. 4. Still images from the video sequence of the second experimentshowing the tracking of pedestrians and their estimated gaze direction inthe shopping thoroughfare (Upper) and the commuter train station (Lower).The stimulus group members are shown in the center of each scene (as in-dicated by the white arrows).
7248 | www.pnas.org/cgi/doi/10.1073/pnas.1116141109 Gallup et al.

picious-acting stimulus group. Across trials, 24.2% (119/503) ofpassersby directed their head pose, and presumably their gaze,to the stimulus group during our experiments. This responsevaried by location, however, with a lower proportion of pedes-trians in the shopping street directing their visual orientation tothese members [14.9% vs. 37.6%; ҳ2(1) = 34.128, P < 0.001].This finding was also true when comparing the proportion oftime spent looking in this direction [F(1,503) = 24.418, P <0.001] (Fig. S5). We identified spatial effects in the train station,with individuals standing closer to the announcement boardbeing less likely to look at the stimulus group (SI Methods).There was a positive correlation between time spent in theviewing area and proportion of visual attention directed to sus-picious activity in both locations [shopping street: r(153) = 0.174,P = 0.034; train station: r(91) = 0.199, P = 0.05], but there wasno such relationship for the control trials (P values > 0.05). Asexpected, there was a main effect of distance across locations [F(1,503) = 18.534, P < 0.001], with pedestrians at average distancesof <1.500 m from the stimulus members showing greater ori-enting responses (P values < 0.001) (Fig. S6). There were alsointeractions between experimental condition and distance andbetween location and distance (Fig. S7).The visual response to suspicious activity in the commuter
station differed from the response in the other three setups,resulting in a significant interaction between location and treat-ment [F(1,503) = 4.130, P < 0.05]. Furthermore, pedestrians inthe commuter station in very close proximity to the suspiciousstimulus had a lower tendency to look in this direction (Fig. 5Band Fig. S8) [interaction between all three main effects: F(2,503) =3.495, P < 0.05]. A logistic regression using distance to predictlooking behavior confirms this result, showing that pedestrianswho spent more time looking in the direction of the stimulusgroup were closer to these members in both nonsuspiciousconditions and the suspicious condition in the shopping street(P values < 0.01); however, distance was not predictive oflooking behavior in the suspicious condition within the com-muter station (P > 0.05). An analysis of pedestrian sex shows thatmales spent less time directing their visual orientation to suspi-cious activity in the train station than females (SI Methods andFig. S9). When considering that, in other treatments, visual at-tention increased with decreasing distance to the stimulus, theseresults suggest that pedestrians, and particularly male pedes-trians, averted direct gaze from the suspicious-acting stimulusgroups in the commuter station.To quantify potential socially mediated gaze-following and
test against the model suggested by the first experiment, we
calculated for each pedestrian the number of surrounding indi-viduals in their field of view that also looked at the stimulusgroup during the experiment. Across locations, pedestrians wholooked at the stimulus group in the suspicious condition hada larger number of visible neighboring passersby that also re-cently looked in the direction of these individuals [t(248) =2.609, P = 0.01], whereas there was no significant influence inthe control trials [t(251) = 1.780, P > 0.05]. Furthermore, a runstest shows evidence of significant temporal clustering of directedgazes to the suspicious actors in the commuter station (2/9 Pvalues < 0.05) (SI Methods). The distribution of the number ofindividuals with directed gazes within 12-s intervals is non-Pois-son for this location (Fig. 2D), and it is skewed in a mannersimilar to the model when pedestrian flows are high (Fig. 2B). Inthe shopping street, pedestrian flows were one-third of the flowsat the commuter station, and consistent with the model, thedistribution of the number of individuals with directed gazes wasPoisson (Fig. 2C).
DiscussionPedestrians in public settings are both responsive and sensitive tothe gaze direction of others within the crowd, with responsestrength increasing with the number of people already gazing.Although previously characterized as a quorum response (11),our first experiment showed that gaze-following probability is,instead, a proportional saturating response. The form of thisresponse, determined by a value of k close to one, was robustacross both our experiments and the experiments in the work byMilgram et al. (10). This response has important consequencesfor how information about environmental stimuli is acquiredsocially. Many group-living animals use quorums (i.e., k > 1) inresponse to the presence or behavior of others (18, 34), allowingthem to make consensus decisions in which all (or the majorityof) individuals adopt the same choice (15). Conversely, theproportional saturating response established here did not gen-erate strong consensus. As a result we predicted, and in thesecond experiment observed, weak socially mediated gaze-following. Although pedestrians seemed to follow each other’sgazes to the stimulus (particularly in the case of the suspicious-acting condition), there was no tipping point at which largenumbers of individuals simultaneously gazed in that direction.Consequently, in applications such as advertising, where gaze-following is a proven technique for attracting attention to partic-ular features (35), we do not expect a contagion of gaze-followingunless the feature itself is very obvious to many or all passersby.Although a proportional saturating response fails to generate
crystallization within crowds, our results are suggestive that thevisual attention of passersby can facilitate response, althoughweakly, to relevant stimuli while also filtering out environmentalnoise. Furthermore, this response could perform effectively whenintegrating more subtle forms of social information. Interpretinganother person’s visual attention is important in collective tasks,such as insight problem solving (36) and coordination of spatialreferencing (37). Proportional responses prevent groups frombecoming locked into suboptimal patterns of behaviors (11, 14,15), and they could aid humans when trying to integrate infor-mation without verbal communication.In the first experiment, gaze-following did not spread evenly in
all directions. Individuals with trajectories leading them to walkbehind the visual orientation of the stimulus group exhibiteda higher propensity to follow the gaze of the stimulus group. Thisfinding suggests that gaze-following under these conditions is notcaused by social pressure (21) or some form of obedience (22).Instead, individuals followed gaze direction more often when theperson that they were copying could not observe their behavior.In the second experiment, directed visual attention to the stim-ulus group only occurred at distances less than 2 m away, which isconsistent with recent research showing that the vast majority of
Distance from the stimulus group
Pro
porti
on o
f tot
al lo
oks
0.0
0.1
0.2
0.3
0.4
0.5
<1.0m <1.5m <2.0m <2.5m <3.0m <3.5m
SuspiciousNon−suspicious
0.0
0.1
0.2
0.3
0.4
0.5
<1.0m <1.5m <2.0m <2.5m <3.0m <3.5m
SuspiciousNon−suspicious
A B
Fig. 5. The proportion of total frames in which the visual attention ofpedestrians was directed to the stimulus group as a function of decreasingdistance to these individuals in (A) the shopping street and (B) the trainstation (3.5-m radius). For every frame in which a pedestrian was within thisradius, a score of one or zero was input, indicating whether their head wasvisually oriented to either of the stimulus group members. Note that eachdistance is not representative of an independent measure, because theframes contributing to lower distances are included within the larger dis-tances (mean ± 95% confidence interval).
Gallup et al. PNAS | May 8, 2012 | vol. 109 | no. 19 | 7249
PSYC
HOLO
GICALAND
COGNITIVESC
IENCE
S
visual fixations on other pedestrians occurs within this range(38). This localized response and the propagation of copyingmainly by those individuals not under observation of othersfurther reduces the efficiency for transferring information aboutthe location of weak signals or subtle features of the environ-ment. Because of the limitations of tracking head direction asopposed to eye gaze, future experimental research studying gaze-following within crowds could be performed with eye-trackingdevices mounted to moving participants (38).Many aspects of how people monitor their environment are
strongly dependent on social context. Passersby in our first experi-mentwere less likely to lookupand required a larger stimulus groupbefore they responded than passersby in the experiment in thework byMilgram et al. (10). There were also substantial differencesin the second experiment between the shopping street, wherepedestrians gaze was drawn to the suspicious actors at close dis-tances, and the train station,wheregazewasdrawn tonearby controlactivity but averted from those individuals exhibiting suspiciousactivity at very close positions. These locations vary in pedestriandensity and mobility as well as in terms of pedestrian anonymity,allowing for a number of explanations of these differences that areconsistent with previous research regarding social interaction andgaze avoidance (39–41). The lack of the aversion response in theshopping street, where individuals move quickly by one another,may be becausemoving individuals seek a free path in which to passstimulus group members (42, 43) or fleeting proximity to one an-other gives a perceived anonymity.Moreover, aversion in a crowdedcommuter station consisting of largely stationary individuals could
bebecause closeproximity anddirected gazecommunicate threat ordominance (44). Male pedestrians, who accounted for the closerange aversion in the commuter station, may have felt that pro-longed staring would result in confrontation with the males in thesuspiciously acting stimulus group.In summary, this field experimental approach has produced
quantitative and qualitative insights about a candidate causallink in the relation between individual and crowd behavior: thepropagation of attention. We have used tracking and semi-automated analysis to quantify a number of aspects of humanbehavior in crowds, including the proportional saturating re-sponse to groups and the locally confined detection of stimuli.However, when we explore questions of social context, it isclear that measurements on the dynamics of crowds cannotby themselves disentangle the psychological reasons behindvisual attention.
MethodsAll of the experiments were conducted between March of 2007 (first ex-periment) and March of 2009 (second experiment). This research wassponsored by Oxford Risk, which sought all necessary ethics approvals andclearances. All data were anonymous, and individuals were given sequentialnumerical identities based on when they entered the scene. Tracking andmethods of each experiment are in SI Methods.
ACKNOWLEDGMENTS. This research was supported in part by Army Re-search Office Grant W911NG-11-1-0385, Office of Naval Research GrantN00014-09-1-1074, and NSF grant PHY-0848755 (to I.D.C.).
1. Galef BG, Jr., Giraldeau LA (2001) Social influences on foraging in vertebrates: Causalmechanisms and adaptive functions. Anim Behav 61:3–15.
2. Griffin AS (2004) Social learning about predators: A review and prospectus. LearnBehav 32:131–140.
3. Lima SL (1995) Back to the basics of anti-predatory vigilance: The group-size effect.Anim Behav 49:11–20.
4. Cavagna A, et al. (2010) Scale-free correlations in starling flocks. Proc Natl Acad SciUSA 107:11865–11870.
5. Couzin ID (2009) Collective cognition in animal groups. Trends Cogn Sci 13:36–43.6. Shepherd SV (2010) Following gaze: Gaze-following as a window into social cogni-
tion. Front Integr Neurosci 4:1–13.7. Frischen A, Bayliss AP, Tipper SP (2007) Gaze cueing of attention: Visual attention,
social cognition, and individual differences. Psychol Bull 133:694–724.8. Böckler A, Knoblich G, Sebanz N (2011) Observing shared attention modulates gaze
following. Cognition 120:292–298.9. Kuhn G, Tipples J (2011) Increased gaze following for fearful faces. It depends on
what you’re looking for! Psychon Bull Rev 18:89–95.10. Milgram S, Bickman L, Berkowitz L (1969) Note on the drawing power of crowds of
different size. J Pers Soc Psychol 13:79–82.11. Sumpter DJT (2006) The principles of collective animal behaviour. Philos Trans R Soc
Lond B Biol Sci 361:5–22.12. Granovetter M (1978) Threshold models of collective behavior. AJS 83:1420–1443.13. Shelling T (1978) Micromotives and Macrobehavior (W. W. Norton & Company, New
York).14. Nicolis SC, Deneubourg JL (1999) Emerging patterns and food recruitment in ants: An
analytical study. J Theor Biol 198:575–592.15. Sumpter DJT, Pratt SC (2009) Quorum responses and consensus decision making.
Philos Trans R Soc Lond B Biol Sci 364:743–753.16. Gladwell M (2001) The Tipping Point (Abacus, London).17. Woloszyn M, Stauffer D, Kulakowski K (2007) Phase transitions in Nowak-Sznajd
opinion dynamics. Physica A 378:453–458.18. Ward AJW, Sumpter DJT, Couzin ID, Hart PJB, Krause J (2008) Quorum decision-
making facilitates information transfer in fish shoals. Proc Natl Acad Sci USA 105:6948–6953.
19. Depickere S, Fresneau D, Deneubourg JL (2004) Dynamics of aggregation in Lasiusniger (Formicidae): Influence of polyethism. Insectes Soc 51:81–90.
20. Meunier H, Leca JB, Deneubourg JL, Petit O (2006) Group movement decisions incapuchin monkeys: The utility of an experimental study and a mathematical model toexplore the relationship between individual and collective behaviours. Behaviour 143:1511–1527.
21. Asch SE (1955) Opinions and social pressure. Sci Am 193:31–35.22. Milgram S (1963) Behavioral study of obedience. J Abnorm Psychol 67:371–378.23. Deutsch M, Gerard HB (1955) A study of normative and informational social influ-
ences upon individual judgement. J Abnorm Psychol 51:629–636.
24. Cialdini RB, Goldstein NJ (2004) Social influence: Compliance and conformity. AnnuRev Psychol 55:591–621.
25. Helbing D, Molnár P (1995) Social force model for pedestrian dynamics. Phys Rev EStat Phys Plasmas Fluids Relat Interdiscip Topics 51:4282–4286.
26. Helbing D, Molnar P, Farkas IJ, Bolay K (2001) Self-organizing pedestrian movement.Environ Plann B Plann Des 28:361–383.
27. Faria JJ, Krause S, Krause J (2010) Collective behavior in road crossing pedestrians: Therole of social information. Behav Ecol 21:1236–1242.
28. Faria JJ, Dyer JRG, Tosh CR, Krause J (2010) Leadership and social information use inhuman crowds. Anim Behav 79:895–901.
29. Hoare DJ, Couzin ID, Godin JGJ, Krause J (2004) Context-dependent group size choicein fish. Anim Behav 67:155–164.
30. Bode NWF, Faria JJ, Franks DW, Krause J, Wood AJ (2010) How perceived threat in-creases synchronization in collectively moving animal groups. Proc Biol Sci 277:3065–3070.
31. Knoblauch RL, Pietrucha MT, Nitzburg M (1996) Field studies of pedestrian walkingspeed and start-up time. Transp Res Rec 1538:27–38.
32. Bornstein MH, Bornstein HG (1976) The pace of life. Nature 259:557–559.33. Sumpter DJT (2010) Collective Animal Behavior (Princeton University Press, Princeton).34. Pratt SC, Sumpter DJT (2006) A tunable algorithm for collective decision-making. Proc
Natl Acad Sci USA 103:15906–15910.35. Hutton SB, Nolte S (2011) The effect of gaze cues on attention to print advertise-
ments. Appl Cogn Psychol 25:887–892.36. Litchfield D, Ball LJJ (2011) Using another’s gaze as an explicit aid to insight problem
solving. Q J Exp Psychol (Hove) 64:649–656.37. Neider MB, Chen X, Dickinson CA, Brennan SE, Zelinsky GJ (2010) Coordinating spatial
referencing using shared gaze. Psychon Bull Rev 17:718–724.38. Kitazawa K, Fujiyama T (2010) Pedestrian vision and collision avoidance behavior:
Investigation of the information process space of pedestrians using an eye tracker.Pedestrian and Evacuation Dynamics 2008, eds Klingsch W, Rogsch C, Schadschneider A,Schreckenberg M (Springer, Berlin), pp 95–108.
39. Goffman E (1963) Behavior in Public Places: Notes on the Social Organization ofGatherings (Free Press, Glencoe, IL).
40. Zuckermqn M, Miserandino M, Bernieri F (1983) Civil inattention exists—in elevators.Pers Soc Psychol Bull 9:578–586.
41. Laidlaw KEW, Foulsham T, Kuhn G, Kingstone A (2011) Potential social interactionsare important to social attention. Proc Natl Acad Sci USA 108:5548–5553.
42. Moussaïd M, Helbing D, Theraulaz G (2011) How simple rules determine pedestrianbehavior and crowd disasters. Proc Natl Acad Sci USA 108:6884–6888.
43. Nummenmaa L, Hyönä J, Hietanen JK (2009) I’ll walk this way: Eyes reveal the di-rection of locomotion and make passersby look and go the other way. Psychol Sci 20:1454–1458.
44. Kleinke CL (1986) Gaze and eye contact: A research review. Psychol Bull 100:78–100.
7250 | www.pnas.org/cgi/doi/10.1073/pnas.1116141109 Gallup et al.