visual analytics: definition, process and challenges analytics: definition, process, and challenges...
TRANSCRIPT
HAL Id: lirmm-00272779https://hal-lirmm.ccsd.cnrs.fr/lirmm-00272779
Submitted on 11 Apr 2008
HAL is a multi-disciplinary open accessarchive for the deposit and dissemination of sci-entific research documents, whether they are pub-lished or not. The documents may come fromteaching and research institutions in France orabroad, or from public or private research centers.
L’archive ouverte pluridisciplinaire HAL, estdestinée au dépôt et à la diffusion de documentsscientifiques de niveau recherche, publiés ou non,émanant des établissements d’enseignement et derecherche français ou étrangers, des laboratoirespublics ou privés.
Visual Analytics: Definition, Process and ChallengesDaniel Keim, Gennady Andrienko, Jean-Daniel Fekete, Carsten Görg, Jörn
Kohlhammer, Guy Melançon
To cite this version:Daniel Keim, Gennady Andrienko, Jean-Daniel Fekete, Carsten Görg, Jörn Kohlhammer, et al.. Vi-sual Analytics: Definition, Process and Challenges. Andreas Kerren and John T. Stasko and Jean-Daniel Fekete and Chris North. Information Visualization - Human-Centered Issues and Perspectives,Springer, pp.154-175, 2008, LNCS. <lirmm-00272779>

Visual Analytics:
Definition, Process, and Challenges
Daniel Keim1, Gennady Andrienko2, Jean-Daniel Fekete3, Carsten Gorg4,Jorn Kohlhammer5, and Guy Melancon6
1 Department of Computer and Information Science, University of Konstanz,78457 Konstanz, Germany,
[email protected] Fraunhofer Institute for Intelligent Analysis and Information Systems(IAIS),
Schloss Birlinghoven 53754 Sankt Augustin, Germany,[email protected] Universite Paris-Sud, INRIA, Bat 490,
F-91405 Orsay Cedex, France,[email protected]
4 School of Interactive Computing & GVU Center, Georgia Institute of Technology,85 5th St., NW, Atlanta, GA 30332-0760, USA,
[email protected] Fraunhofer Institute for Computer Graphics Research,
Fraunhoferstraße 5, D-64283 Darmstadt, Germany,[email protected]
6 INRIA Bordeaux – Sud-Ouest, CNRS UMR 5800 LaBRI,Campus Universite Bordeaux I,
351 Cours de la liberation, 33405 Talence Cedex, France,[email protected]
1 Introduction and Motivation
We are living in a world which faces a rapidly increasing amount of data to bedealt with on a daily basis. In the last decade, the steady improvement of datastorage devices and means to create and collect data along the way influenced ourway of dealing with information: Most of the time, data is stored without filteringand refinement for later use. Virtually every branch of industry or business,and any political or personal activity nowadays generate vast amounts of data.Making matters worse, the possibilities to collect and store data increase at afaster rate than our ability to use it for making decisions. However, in mostapplications, raw data has no value in itself; instead we want to extract theinformation contained in it.
The information overload problem refers to the danger of getting lost indata which may be
– irrelevant to the current task at hand– processed in an inappropriate way– presented in an inappropriate way
A. Kerren et al. (Eds.): Information Visualization, LNCS 4950, pp. 154–175, 2008.c© Springer-Verlag Berlin Heidelberg 2008
Visual Analytics: Definition, Process, and Challenges 155
Due to information overload, time and money are wasted, scientific and in-dustrial opportunities are lost because we still lack the ability to deal with theenormous data volumes properly. People in both their business and private lives,decision-makers, analysts, engineers, emergency response teams alike, are oftenconfronted with massive amounts of disparate, conflicting and dynamic infor-mation, which are available from multiple heterogeneous sources. We want tosimply and effectively exploit and use the hidden opportunities and knowledgeresting in unexplored data sources.
In many application areas success depends on the right information beingavailable at the right time. Nowadays, the acquisition of raw data is no longerthe driving problem: It is the ability to identify methods and models, which canturn the data into reliable and provable knowledge. Any technology, that claimsto overcome the information overload problem, has to provide answers for thefollowing problems:
– Who or what defines the “relevance of information” for a given task?– How can appropriate procedures in a complex decision making process be
identified?– How can the resulting information be presented in a decision- or task-oriented
way?– What kinds of interaction can facilitate problem solving and decision mak-
ing?
With every new “real-life” application, procedures are put to the test possiblyunder circumstances completely different from the ones under which they havebeen established. The awareness of the problem how to understand and analyseour data has been greatly increased in the last decade. Even as we implementmore powerful tools for automated data analysis, we still face the problem of un-derstanding and “analysing our analyses” in the future: Fully-automated search,filter and analysis only work reliably for well-defined and well-understood prob-lems. The path from data to decision is typically quite complex. Even as fully-automated data processing methods represent the knowledge of their creators,they lack the ability to communicate their knowledge. This ability is crucial: Ifdecisions that emerge from the results of these methods turn out to be wrong,it is especially important to examine the procedures.
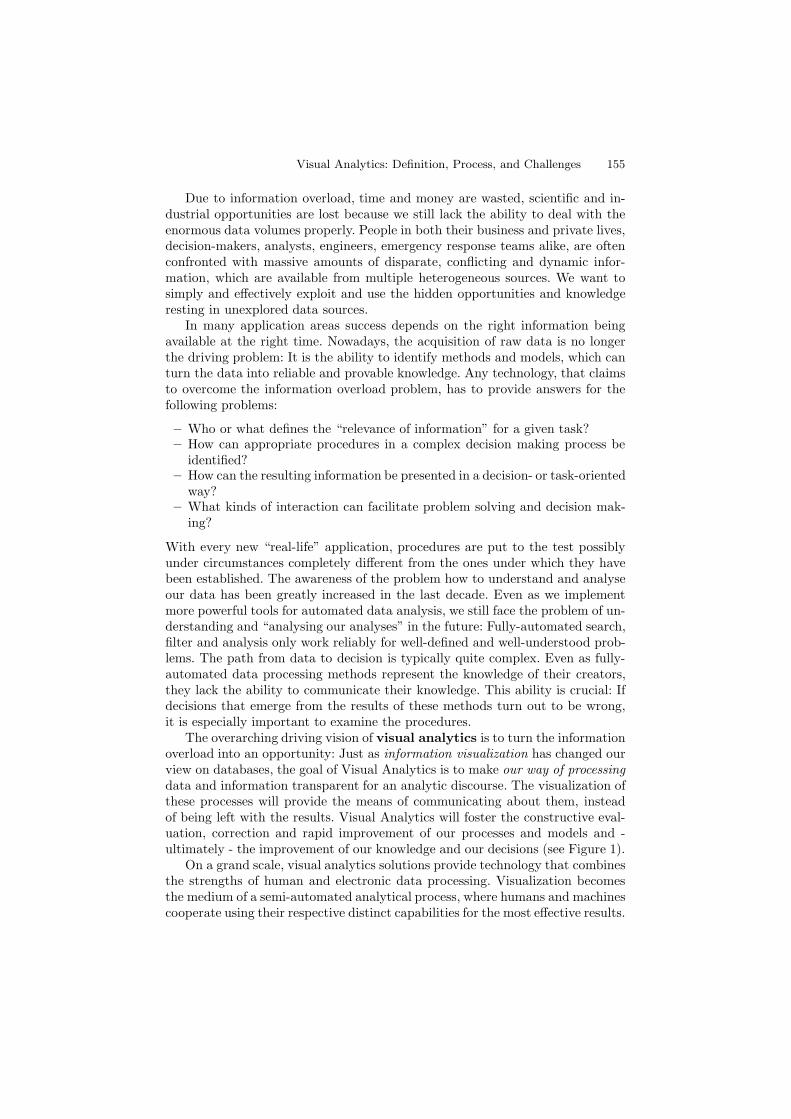
The overarching driving vision of visual analytics is to turn the informationoverload into an opportunity: Just as information visualization has changed ourview on databases, the goal of Visual Analytics is to make our way of processingdata and information transparent for an analytic discourse. The visualization ofthese processes will provide the means of communicating about them, insteadof being left with the results. Visual Analytics will foster the constructive eval-uation, correction and rapid improvement of our processes and models and -ultimately - the improvement of our knowledge and our decisions (see Figure 1).
On a grand scale, visual analytics solutions provide technology that combinesthe strengths of human and electronic data processing. Visualization becomesthe medium of a semi-automated analytical process, where humans and machinescooperate using their respective distinct capabilities for the most effective results.
156 D. Keim et al.
Fig. 1. Tight integration of visual and automatic data analysis methods with database
technology for a scalable interactive decision support.
The user has to be the ultimate authority in giving the direction of the analysisalong his or her specific task. At the same time, the system has to provideeffective means of interaction to concentrate on this specific task. On top ofthat, in many applications different people work along the path from data todecision. A visual representation will sketch this path and provide a referencefor their collaboration across different tasks and abstraction levels.
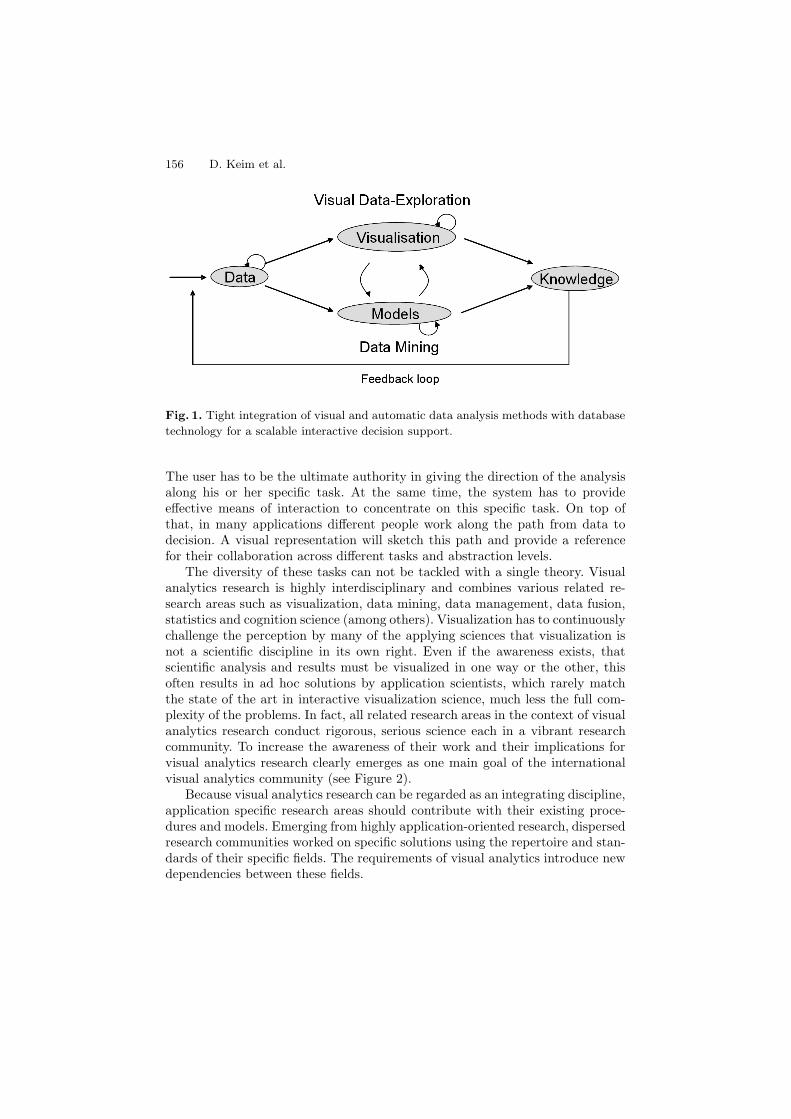
The diversity of these tasks can not be tackled with a single theory. Visualanalytics research is highly interdisciplinary and combines various related re-search areas such as visualization, data mining, data management, data fusion,statistics and cognition science (among others). Visualization has to continuouslychallenge the perception by many of the applying sciences that visualization isnot a scientific discipline in its own right. Even if the awareness exists, thatscientific analysis and results must be visualized in one way or the other, thisoften results in ad hoc solutions by application scientists, which rarely matchthe state of the art in interactive visualization science, much less the full com-plexity of the problems. In fact, all related research areas in the context of visualanalytics research conduct rigorous, serious science each in a vibrant researchcommunity. To increase the awareness of their work and their implications forvisual analytics research clearly emerges as one main goal of the internationalvisual analytics community (see Figure 2).
Because visual analytics research can be regarded as an integrating discipline,application specific research areas should contribute with their existing proce-dures and models. Emerging from highly application-oriented research, dispersedresearch communities worked on specific solutions using the repertoire and stan-dards of their specific fields. The requirements of visual analytics introduce newdependencies between these fields.
Visual Analytics: Definition, Process, and Challenges 157
Fig. 2. Visual analytics integrates scientific disciplines to improve the division of labor
between human and machine.
2 Definition of Visual Analytics
In “Illuminating the Path” [39], Thomas and Cook define visual analytics as thescience of analytical reasoning facilitated by interactive visual interfaces. In thischapter, however, we would like to give a more specific definition:
Visual analytics combines automated analysis techniques with interactivevisualizations for an effective understanding, reasoning and decision making onthe basis of very large and complex data sets.
The goal of visual analytics is the creation of tools and techniques to enablepeople to:
– Synthesize information and derive insight from massive, dynamic, ambigu-ous, and often conflicting data.
– Detect the expected and discover the unexpected.– Provide timely, defensible, and understandable assessments.– Communicate assessment effectively for action.
By integrating selected science and technology from the above discussed disci-plines and as illustrated in Figure 2, there is the promising opportunity to formthe unique and productive field of visual analytics. Work in each of the partici-pating areas focuses on different theoretical and practical aspects of users solvingreal-world problems using Information Technology in an effective and efficientway. These areas have in common similar scientific challenges and significant sci-entific added-value from establishing close collaboration can be identified. Benefitof collaboration between the fields is identified to be two-fold:
– Jointly tackling common problems will arrive at better results on the locallevel of each discipline, in a more efficient way.
– Integrating appropriate results from each of the disciplines will lay the fun-dament for significantly improved solutions in many important data analysisapplications.
158 D. Keim et al.
Visual Analytics versus Information Visualization
Many people are confused by the new term visual analytics and do not see a dif-ference between the two areas. While there is certainly some overlay and some ofthe information visualization work is certainly highly related to visual analytics,traditional visualization work does not necessarily deal with an analysis tasksnor does it always also use advanced data analysis algorithms.
Visual analytics is more than just visualization. It can rather be seen as anintegral approach to decision-making, combining visualization, human factorsand data analysis. The challenge is to identify the best automated algorithm forthe analysis task at hand, identify its limits which can not be further automated,and then develop a tightly integrated solution with adequately integrates the bestautomated analysis algorithms with appropriate visualization and interactiontechniques.
While some of such research has been done within the visualization commu-nity in the past, the degree to which advanced knowledge discovery algorithmshave been employed is quite limited. The idea of visual analytics is to funda-mentally change that. This will help to focus on the right part of the problem,i.e. the parts that can not be solved automatically, and will provide solutions toproblems that we were not able to solve before.
One important remark should be made here. Most research efforts in Infor-mation Visualization have concentrated on the process of producing views andcreating valuable interaction techniques for a given class of data (social network,multi-dimensional data, etc.). However, much less has been suggested as to howuser interactions on the data can be turned into intelligence to tune underlyinganalytical processes. A system might for instance observe that most of the user’sattention concern only a subpart of an ontology (through queries or by repeateddirect manipulations of the same graphical elements, for instance). Why not thenuse this knowledge about the user’s interest and update various parameters bythe system (trying to systematically place elements or components of interest incenter view, even taking this fact into account when driving a clustering algo-rithm with a modularity quality criteria, for instance).
This is one place where Visual Analytics maybe differs most from InformationVisualization, giving higher priority to data analytics from the start and throughall iterations of the sense making loop. Creativity is then needed to understandhow perception issues can help bring more intelligence into the analytical processby “learning” from users’ behavior and effective use of the visualization.
3 Areas Related to Visual Analytics
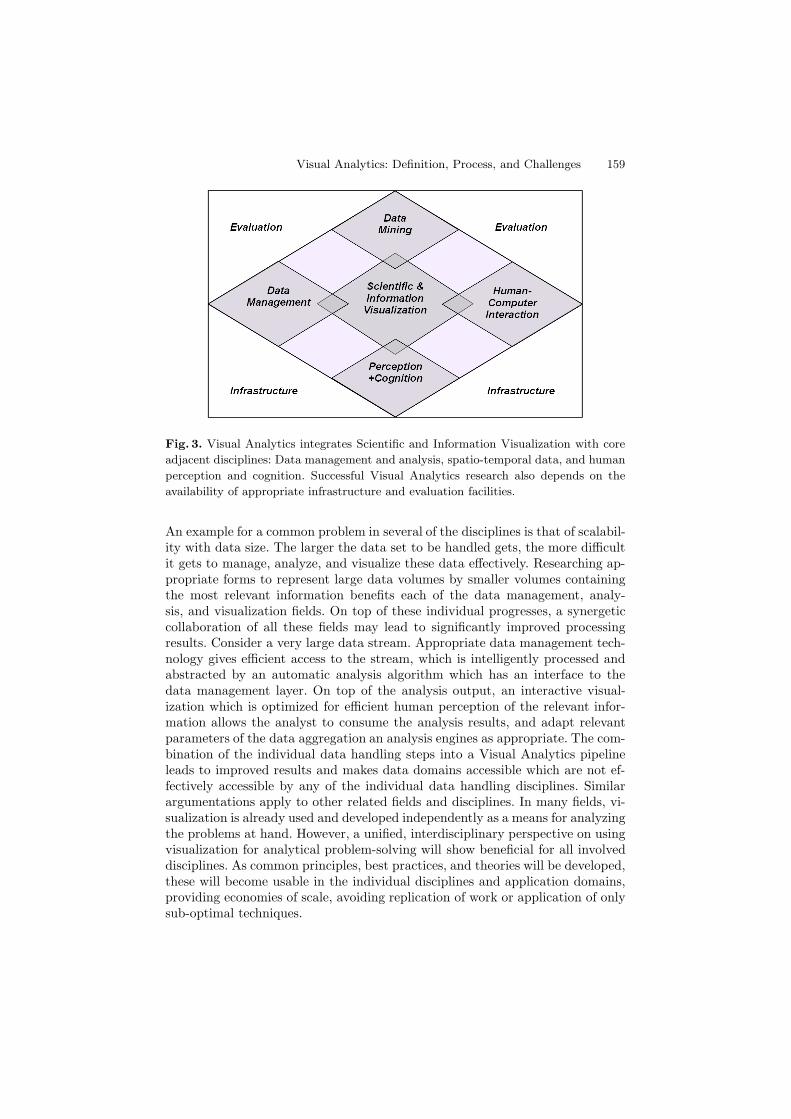
Visual analytics builds on a variety of related scientific fields. At its heart, VisualAnalytics integrates Information and Scientific Visualization with Data Manage-ment and Data Analysis Technology, as well as Human Perception and Cognitionresearch. For effective research, Visual Analytics also requires an appropriate In-frastructure in terms of software and data sets and related analytical problemsrepositories, and to develop reliable Evaluation methodology (see Figure 3).
Visual Analytics: Definition, Process, and Challenges 159
Fig. 3. Visual Analytics integrates Scientific and Information Visualization with core
adjacent disciplines: Data management and analysis, spatio-temporal data, and human
perception and cognition. Successful Visual Analytics research also depends on the
availability of appropriate infrastructure and evaluation facilities.
An example for a common problem in several of the disciplines is that of scalabil-ity with data size. The larger the data set to be handled gets, the more difficultit gets to manage, analyze, and visualize these data effectively. Researching ap-propriate forms to represent large data volumes by smaller volumes containingthe most relevant information benefits each of the data management, analy-sis, and visualization fields. On top of these individual progresses, a synergeticcollaboration of all these fields may lead to significantly improved processingresults. Consider a very large data stream. Appropriate data management tech-nology gives efficient access to the stream, which is intelligently processed andabstracted by an automatic analysis algorithm which has an interface to thedata management layer. On top of the analysis output, an interactive visual-ization which is optimized for efficient human perception of the relevant infor-mation allows the analyst to consume the analysis results, and adapt relevantparameters of the data aggregation an analysis engines as appropriate. The com-bination of the individual data handling steps into a Visual Analytics pipelineleads to improved results and makes data domains accessible which are not ef-fectively accessible by any of the individual data handling disciplines. Similarargumentations apply to other related fields and disciplines. In many fields, vi-sualization is already used and developed independently as a means for analyzingthe problems at hand. However, a unified, interdisciplinary perspective on usingvisualization for analytical problem-solving will show beneficial for all involveddisciplines. As common principles, best practices, and theories will be developed,these will become usable in the individual disciplines and application domains,providing economies of scale, avoiding replication of work or application of onlysub-optimal techniques.
160 D. Keim et al.
3.1 Visualization
Visualization has emerged as a new research discipline during the last two dec-ades. It can be broadly classified into Scientific and Information Visualization.
In Scientific Visualization, the data entities to be visualized are typically 3Dgeometries or can be understood as scalar, vectorial, or tensorial fields with ex-plicit references to time and space. A survey of current visualization techniquescan be found in [22,35,23]. Often, 3D scalar fields are visualized by isosurfaces orsemi-transparent point clouds (direct volume rendering) [15]. To this end, meth-ods based on optical emission- or absorption models are used which visualize thevolume by ray-tracing or projection. Also, in the recent years significant workfocused on the visualization of complex 3-dimensional flow data relevant e.g.,in aerospace engineering [40]. While current research has focused mainly on effi-ciency of the visualization techniques to enable interactive exploration, more andmore methods to automatically derive relevant visualization parameters comeinto focus of research. Also, interaction techniques such as focus&context [28]gain importance in scientific visualization.
Information Visualization during the last decade has developed methodsfor the visualization of abstract data where no explicit spatial references aregiven [38,8,24,41]. Typical examples include business data, demographics data,network graphs and scientific data from e.g., molecular biology. The data con-sidered often comprises hundreds of dimensions and does not have a naturalmapping to display space, and renders standard visualization techniques such as(x, y) plots, line- and bar-charts ineffective. Therefore, novel visualization tech-niques are being developed by employing e.g., Parallel Coordinates and theirnumerous extensions [20], Treemaps [36], and Glyph [17]- and Pixel-based [25]visual data representations. Data with inherent network structure may be visual-ized using graph-based approaches. In many Visualization application areas, thetypically huge volumes of data require the appropriate usage of automatic dataanalysis techniques such as clustering or classification as preprocessing prior tovisualization. Research in this direction is just emerging.
3.2 Data Management
An efficient management of data of various types and qualities is a key com-ponent of Visual Analytics as this technology typically provides the input ofthe data which are to be analyzed. Generally, a necessary precondition to per-form any kind of data analysis is an integrated and consistent data basis [18,19].Database research has until the last decade focused mainly on aspects of effi-ciency and scalability of exact queries on homogeneous, structured data. Withthe advent of the Internet and the easy access it provides to all kinds of hetero-geneous data sources, the database research focus has shifted toward integrationof heterogeneous data. Finding integrated representation of different data typessuch as numeric data, graphs, text, audio and video signals, semi-structureddata, semantic representations and so on is a key problem of modern database
Visual Analytics: Definition, Process, and Challenges 161
technology. But the availability of heterogeneous data not only requires the map-ping of database schemata but includes also the cleaning and harmonization ofuncertainty and missing data in the volumes of heterogeneous data. Modern ap-plications require such intelligent data fusion to be feasible in near real-time andas automatically as possible [32]. New forms of information sources such as datastreams [11], sensor networks [30] or automatic extraction of information fromlarge document collections (e.g., text, HTML) result in a difficult data analysisproblem which to support is currently in the focus of database research [43].The relationship between Data Management, Data Analysis and Visualizationis characterized such that Data Management techniques developed increasinglyrely on intelligent data analysis techniques, and also interaction and visualiza-tion to arrive at optimal results. On the other hand, modern database systemsprovide the input data sources which are to be visually analyzed.
3.3 Data Analysis
Data Analysis (also known as Data Mining or Knowledge Discovery) researchesmethods to automatically extract valuable information from raw data by meansof automatic analysis algorithms [29,16,31]. Approaches developed in this areacan be best described by the addressed analysis tasks. A prominent such taskis supervised learning from examples: Based on a set of training samples, deter-ministic or probabilistic algorithms are used to learn models for the classification(or prediction) of previously unseen data samples [13]. A huge number of algo-rithms have been developed to this end such as Decision Trees, Support VectorMachines, Neuronal Networks, and so on. A second prominent analysis task isthat of cluster analysis [18,19], which aims to extract structure from data with-out prior knowledge being available. Solutions in this class are employed to au-tomatically group data instances into classes based on mutual similarity, and toidentify outliers in noisy data during data preprocessing for subsequent analysissteps. Further data analysis tasks include tasks such as association rule mining(analysis of co-occurrence of data items) and dimensionality reduction. Whiledata analysis initially was developed for structured data, recent research aims atanalyzing also semi-structured and complex data types such as web documentsor multimedia data [34].
It has recently been recognized that visualization and interaction are highlybeneficial in arriving at optimal analysis results [9]. In almost all data analysisalgorithms a variety of parameters needs to be specified, a problem which isusually not trivial and often needs supervision by a human expert. Visualizationis also a suitable means for appropriately communicating the results of the au-tomatic analysis, which often is given in abstract representation, e.g., a decisiontree. Visual Data Mining methods [24] try to achieve exactly this.
3.4 Perception and Cognition
Effective utilization of the powerful human perception system for visual analysistasks requires the careful design of appropriate human-computer interfaces. Psy-chology, Sociology, Neurosciences and Design each contribute valuable results to
162 D. Keim et al.
the implementation of effective visual information systems. Research in this areafocuses on user-centered analysis and modeling (Requirement Engineering), thedevelopment of principles, methods and tools for design of perception-driven,multimodal interaction techniques for visualization and exploration of large in-formation spaces, as well as usability evaluation of such systems [21,12]. On thetechnical side, research in this area is influenced by two main factors: (1.) Theavailability of improved display resources (hardware), and (2.) Development ofnovel interaction algorithms incorporating machine recognition of the actual userintent and appropriate adaptation of main display parameters such as the levelof detail, data selection and aggregation, etc. by which the data is presented[44].Important problems addressed in this area include the research of perceptual,cognitive and graphical principles which in combination lead to improved visualcommunication of data and analysis results; The development of perception-theory-based solutions for the graphical representation of static and dynamicstructures; And development of visual representation of information at severallevels of abstraction, and optimization of existing focus-and-context techniques.
3.5 Human-Computer Interaction
Human-computer interaction is the research area that studies the interactionbetween people and computers. It involves the design, implementation and eval-uation of interactive systems in the context of the user’s task and work [12].Like visual analytics itself, human-computer interaction is a multi-disciplinaryresearch area that draws on many other disciplines: computer science, systemdesign, and behavioral science are some of them. The basic underlying researchgoal is to improve the interaction between users and computers: how to makecomputers more receptive to the users’ intentions and needs. Thus, the researchareas discussed in the previous section about perception and cognition are alsomuch related to human-computer interaction [21].
As pointed out in the introduction, visual analytics aims to combine andintegrate the strengths of computers and humans into an interactive process toextract knowledge from data. To effectively switch back and forth between tasksfor the computer and tasks for the human it is crucial to develop an effectiveuser interface that minimizes the barrier between the human’s cognitive modelof what they want to accomplish and the computer’s understanding of the hu-man’s task. The design of user interfaces focuses on human factors of interactivesoftware, methods to develop and assess interfaces, interaction styles, and designconsiderations such as effective messages and appropriate color choice [37].
3.6 Infrastructure and Evaluation
The above described research disciplines require cross-discipline support regard-ing the evaluation of the found solutions, and need certain infrastructure andstandardization grounding to build on effectively. In the field of information vi-sualization, standardization and evaluation came into the focus of research onlyrecently. It has been realized that a general understanding of the taxonomies
Visual Analytics: Definition, Process, and Challenges 163
regarding the main data types and user tasks [2] to be supported are highly de-sirable for shaping visual analytics research. A common understanding of dataand problem dimensions and structure, and acceptance of evaluation standardswill make research results better comparable, optimizing research productivity.Also, there is an obvious need to build repositories of available analysis and vi-sualization algorithms, which researchers can build upon in their work, withouthaving to re-implement already proven solutions.
How to assess the value of visualization is a topic of lively debate [42,33]. Acommon ground that can be used to position and compare future developmentsin the field of data analysis is needed. The current diversification and dispersionof visual analytics research and development resulted from its focus onto specificapplication areas. While this approach may suit the requirements of each ofthese applications, a more rigorous and overall scientific perspective will lead toa better understanding of the field and a more effective and efficient developmentof innovative methods and techniques.
3.7 Sub-communities
Spatio-Temporal Data: While many different data types exist, one of themost prominent and ubiquitous data types is data with references to time andspace. The importance of this data type has been recognized by a researchcommunity which formed around spatio-temporal data management and anal-ysis [14]. In geospatial data research, data with references in the real worldcoming from e.g., geographic measurements, GPS position data, remote sensingapplications, and so on is considered. Finding spatial relationships and patternsamong this data is of special interest, requiring the development of appropriatemanagement, representation and analysis functions. E.g., developing efficientdata structures or defining distance and similarity functions is in the focus of re-search. Visualization often plays a key role in the successful analysis of geospatialdata [6,26].
In temporal data, the data elements can be regarded as a function of time.Important analysis tasks here include the identification of patterns (either lin-ear or periodical), trends and correlations of the data elements over time, andapplication-dependent analysis functions and similarity metrics have been pro-posed in fields such as finance, science, engineering, etc. Again, visualization oftime-related data is important to arrive at good analysis results [1].
The analysis of data with references both in space and in time is a chal-lenging research topic. Major research challenges include [4]: scale, as it is oftennecessary to consider spatio-temporal data at different spatio-temporal scales;the uncertainty of the data as data are often incomplete, interpolated, collectedat different times, or based upon different assumptions; complexity of geograph-ical space and time, since in addition to metric properties of space and timeand topological/temporal relations between objects, it is necessary to take intoaccount the heterogeneity of the space and structure of time; and complexity ofspatial decision making processes, because a decision process may involve hetero-
164 D. Keim et al.
geneous actors with different roles, interests, levels of knowledge of the problemdomain and the territory.
Network and Graph Data: Graphs appear as flexible and powerful math-ematical tools to model real-life situations. They naturally map to transporta-tion networks, electric power grids, and they are also used as artifacts to studycomplex data such as observed interactions between people, or induced interac-tions between various biological entities. Graphs are successful at turning seman-tic proximity into topological connectivity, making it possible to address issuesbased on algorithmics and combinatorial analysis.
Graphs appear as essential modeling and analytical objects, and as effectivevisual analytics paradigms. Major research challenges are to produce scalableanalytical methods to identify key components both structurally and visually.Efforts are needed to design process capable of dealing with large datasets whileproducing readable and usable graphical representations, allowing proper userinteraction. Special efforts are required to deal with dynamically changing net-works, in order to assess of structural changes at various scales.
4 The Visual Analytics Process
A number of systems for information visualization, as well as specific visual-ization techniques, motivate their design choice from Shneiderman’s celebratedmantra “Overview first, Filter and zoom, Details on demand”. As is, the mantraclearly emphasizes the role of visualization in the knowledge discovery process.Recently, Keim adjusted the mantra to bring its focus toward Visual Analytics:“Analyze first, Show the Important, Zoom, filter and analyze further, Detailson demand”. In other words, this mantra is calling for astute combinations ofanalytical approaches together with advanced visualization techniques.
The computation of any visual representation and/or geometrical embeddingof large and complex datasets requires some analysis to start with. Many scalablegraph drawing algorithms try to take advantage of any knowledge on topologyto optimize the drawing in terms of readability. Other approaches offer repre-sentations composed of visual abstractions of clusters to improve readability.The challenge then is to try to come up with a representation that is as faithfulas possible to avoid introducing uncertainty. We must not fall into the naıveassumption that visualization can offer a virgin view on the data: any represen-tation will inevitably favor an interpretation over all possible ones. The solutionoffered by Visual Analytics is then to let the user enter into a loop where datacan be interactively manipulated to help gain insight both on the data and therepresentation itself.
The sense-making loop structures the whole knowledge discovery processsupported through Visual Analytics. A generic scenario can be given following aschema developed by van Wijk [42], which furthermore admits to be evaluatedand measured in terms of efficiency or knowledge gained. A choice for an initialrepresentation and adequate interactions can be made after applying different
Visual Analytics: Definition, Process, and Challenges 165
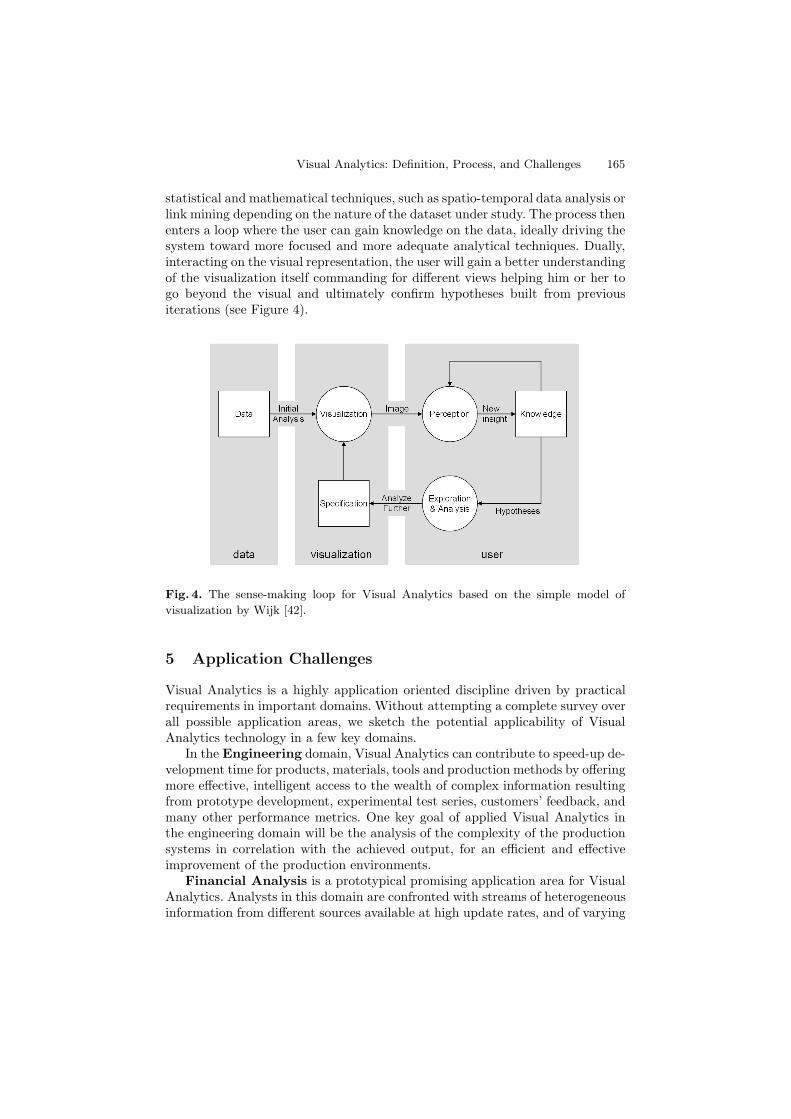
statistical and mathematical techniques, such as spatio-temporal data analysis orlink mining depending on the nature of the dataset under study. The process thenenters a loop where the user can gain knowledge on the data, ideally driving thesystem toward more focused and more adequate analytical techniques. Dually,interacting on the visual representation, the user will gain a better understandingof the visualization itself commanding for different views helping him or her togo beyond the visual and ultimately confirm hypotheses built from previousiterations (see Figure 4).
Fig. 4. The sense-making loop for Visual Analytics based on the simple model of
visualization by Wijk [42].
5 Application Challenges
Visual Analytics is a highly application oriented discipline driven by practicalrequirements in important domains. Without attempting a complete survey overall possible application areas, we sketch the potential applicability of VisualAnalytics technology in a few key domains.
In the Engineering domain, Visual Analytics can contribute to speed-up de-velopment time for products, materials, tools and production methods by offeringmore effective, intelligent access to the wealth of complex information resultingfrom prototype development, experimental test series, customers’ feedback, andmany other performance metrics. One key goal of applied Visual Analytics inthe engineering domain will be the analysis of the complexity of the productionsystems in correlation with the achieved output, for an efficient and effectiveimprovement of the production environments.
Financial Analysis is a prototypical promising application area for VisualAnalytics. Analysts in this domain are confronted with streams of heterogeneousinformation from different sources available at high update rates, and of varying
166 D. Keim et al.
reliability. Arriving at a unifying, task-centered view on diverse streams of datais a central goal in financial information systems. Integrated analysis and visu-alization of heterogeneous data types such as news feeds, real-time trading data,and fundamental economic indicators poses a challenge for developing advancedanalysis solutions in this area. Research based on results from Information Vi-sualization is regarded as promising in this case.
Socio-economic considerations often form the basis of political decisionprocesses. A modern society can be regarded as a complex system of interre-lationships between political decisions and economic, cultural and demographiceffects. Analysis and Visualization of these interrelationships is promising in de-veloping a better understanding of these phenomena, and to arrive at betterdecisions. Successful Visual Analytics applications in this domain could startbeing developed based on currently existing Geo-Spatial analysis frameworks.
Public Safety & Security is another important application area where Vi-sual Analytics may contribute with advanced solutions. Analysts need to con-stantly monitor huge amounts of heterogeneous information streams, correlatinginformation of varying degrees of abstraction and reliability, assessing the cur-rent level of public safety, triggering alert in case of alarming situations beingdetected. Data integration and correlation combined with appropriate analysisand interactive visualization is promising to develop more efficient tools for theanalysis in this area.
The study of Environment and Climate change often requires the ex-amination of long term weather records and logs of various sensors, in a searchfor patterns that can be related to observations such as changes in animal pop-ulations, or in meteorological and climatic processes for instance. These require-ments call for the development of systems allowing visual and graphical accessto historical monitoring data and predictions from various models in search foror in order to validate patterns building over time.
These diverse fields of applications share many problems on an abstract level,most of which are addressed by Visual Analytics. The actual (software) solutionmust be adapted to the specific needs and terminologies of the application areaand consequently, many researchers currently focus on a specific customer seg-ment. Much can be achieved, if the European research infrastructure in this fieldbecomes strong enough to encourage the exchange of ideas on a broad scale, tofoster development of solutions applicable to multiple domains, achieving syn-ergy effects.
6 Technical Challenges
The primary goal of Visual Analytics is the analysis of vast amounts of data toidentify and visually distill the most valuable and relevant information content.The visual representation should reveal structural patterns and relevant dataproperties for easy perception by the analyst. A number of key requirementsneed to be addressed by advanced Visual Analytics solutions. We next outlineimportant scientific challenges in this context.
Visual Analytics: Definition, Process, and Challenges 167
Scalability with Data Volumes and Data Dimensionality: Visual Ana-lytics techniques need to be able to scale with the size and dimensionality ofthe input data space. Techniques need to accommodate and graphically repre-sent high-resolution input data as well as continuous input data streams of highbandwidth. In many applications, data from multiple, heterogeneous sourcesneed to be integrated and processed jointly. In these cases, the methods needto be able to scale with a range of different data types, data sources, and levelsof quality. The visual representation algorithms need to be efficient enough forimplementation in interactive systems.
Quality of Data and Graphical Representation: A central issue in VisualAnalytics is the avoidance of misinterpretations by the analyst. This may resultdue to uncertainty and errors in the input data, or limitations of the chosenanalysis algorithm, and may produce misleading analysis results. To face thisproblem, the notion of data quality, and the confidence of the analysis algorithmneeds to be appropriately represented in the Visual Analytics solutions. The userneeds to be aware of these data and analysis quality properties at any stage inthe data analysis process.
Visual Representation and Level of Detail: To accommodate vast streamsof data, appropriate solutions need to intelligently combine visualizations ofselected analysis details on the one hand, and a global overview on the otherhand. The relevant data patterns and relationships need to be visualized onseveral levels of detail, and with appropriate levels of data and visual abstraction.
User Interfaces, and Interaction Styles and Metaphors: Visual Analyticssystems need to be easily used and interacted with by the analyst. The analystneeds to be able to fully focus on the task at hand, not on overly technical orcomplex user interfaces, which potentially distract. To this end, novel interactiontechniques need to be developed which fully support the seamless, intuitive visualcommunication with the system. User feedback should be taken as intelligentlyas possible, requiring as little manual user input as possible, which guaranteesthe full support of the user in navigating and analyzing the data, memorizinginsights and making informed decisions.
Display Devices: In addition to high-resolution desktop displays, advanceddisplay devices such as large-scale power walls and small portable personal assis-tant, graphically-enabled devices need to be supported. Visual Analytics systemsshould adapt to the characteristics of the available output devices, supportingthe Visual Analytics workflow on all levels of operation.
Evaluation: Due to the complex and heterogeneous problem domains addressedby Visual Analytics, so far it has been difficult to perform encompassing evalua-tion work. A theoretically founded evaluation framework needs to be developedwhich allows assessing the contribution of any Visual Analytics system towardthe level of effectiveness and efficiency achieved regarding their requirements.
168 D. Keim et al.
Infrastructure: Managing large amounts of data for visualization or analysisrequires special data structures and mechanisms, both in memory and disks.Achieving interactivity means refreshing the display in 100ms at worst whereasanalyzing data with standard techniques such as clustering can take hours tocomplete. Achieving the smooth interaction required by the analysts to performtheir tasks while providing high-quality analytical algorithms need the combi-nation of asynchronous computation with hybrid analytical algorithms that cantrade time with quality. Moreover, to fully support the analytical process, thehistory of the analysis should also be recorded and interactively edited and an-notated. Altogether, these requirements call for a novel software infrastructure,built upon well understood technologies such as databases, software componentsand visualization but augmented with asynchronous processing, history manage-ments and annotations.
7 Examples for Visual Analytics Applications
7.1 Visual Analytics Tools for Analysis of Movement Data
With widespread availability of low cost GPS devices, it is becoming possible torecord data about the movement of people and objects at a large scale. Whilethese data hide important knowledge for the optimization of location and mobil-ity oriented infrastructures and services, by themselves they lack the necessarysemantic embedding which would make fully automatic algorithmic analysis pos-sible. At the same time, making the semantic link is easy for humans who howevercannot deal well with massive amounts of data. In [5] we argue that by usingthe right visual analytics tools for the analysis of massive collections of move-ment data, it is possible to effectively support human analysts in understandingmovement behaviors and mobility patterns.
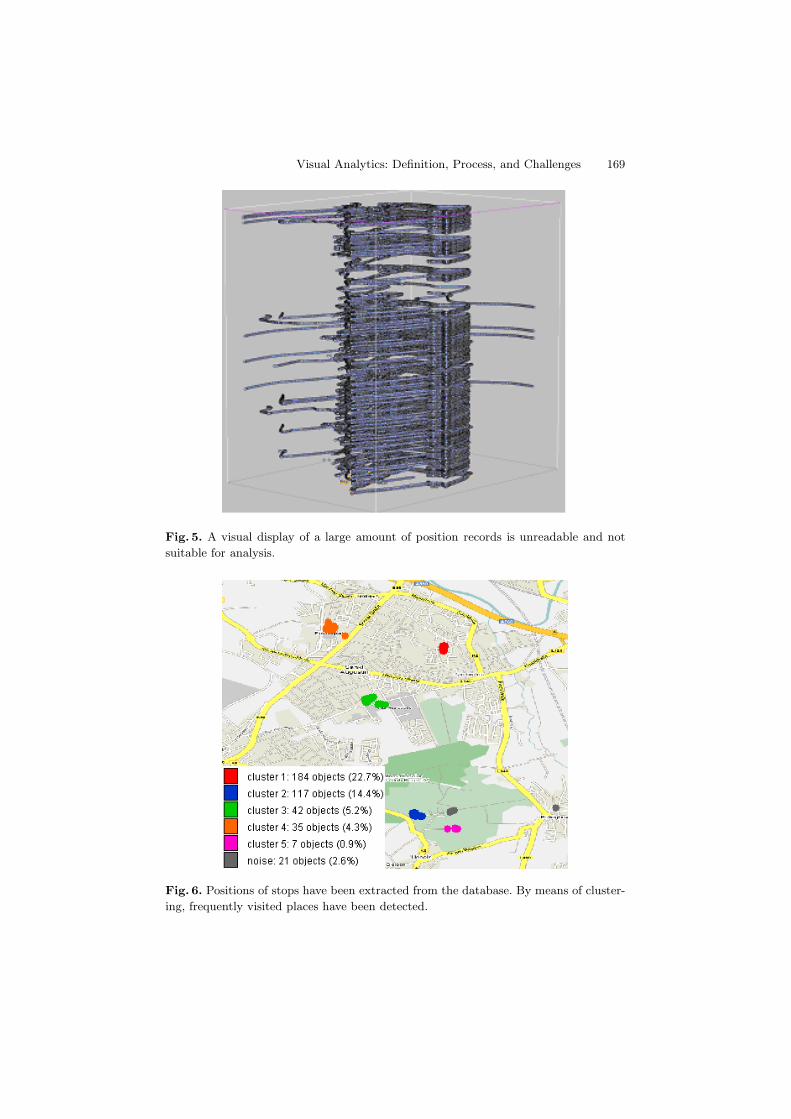
Figure 5 shows a subset of raw GPS measurements presented in so-calledspace-time cube. The large amount of position records referring to the sameterritory over a long time period makes it virtually impossible to do the analysisby purely visual methods.
The paper [5] proposes a framework where interactive visual interfaces aresynergistically combined with database operations and computational process-ing. The generic database techniques are used for basic data processing and ex-traction of relevant objects and features. The computational techniques, whichare specially devised for movement data, aggregate and summarize these objectsand features and thereby enable the visualization of large amounts of informa-tion. The visualization enables human cognition and reasoning, which, in turn,direct and control the further analysis by means of the database, computational,and visual techniques. Interactive visual interfaces embrace all the tools.
Thus, in order to detect and interpret significant places visited by the mov-ing entities, the positions of stops are extracted from the data by means ofappropriate database queries. Then, clustering methods are applied to detectfrequently visited places. Interactive visual displays put the results in the spa-tial and temporal contexts. The spatial positions of the stops can be observed on
Visual Analytics: Definition, Process, and Challenges 169
Fig. 5. A visual display of a large amount of position records is unreadable and not
suitable for analysis.
Fig. 6. Positions of stops have been extracted from the database. By means of cluster-
ing, frequently visited places have been detected.
170 D. Keim et al.
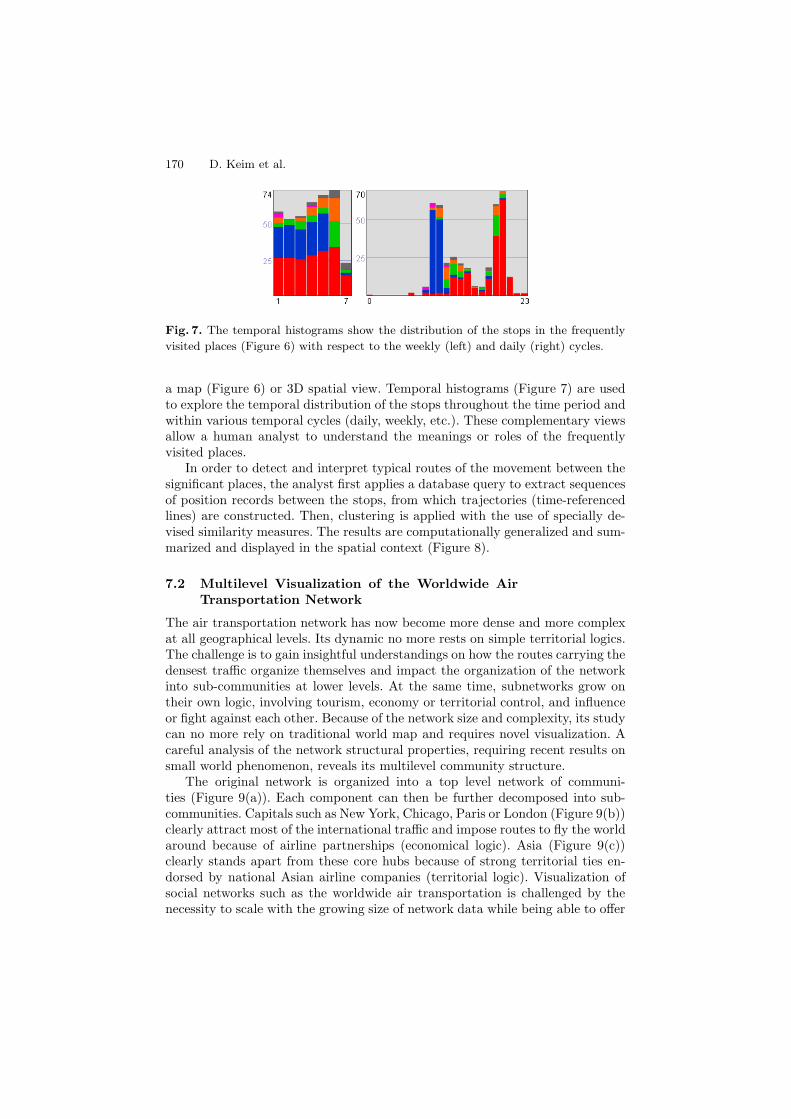
Fig. 7. The temporal histograms show the distribution of the stops in the frequently
visited places (Figure 6) with respect to the weekly (left) and daily (right) cycles.
a map (Figure 6) or 3D spatial view. Temporal histograms (Figure 7) are usedto explore the temporal distribution of the stops throughout the time period andwithin various temporal cycles (daily, weekly, etc.). These complementary viewsallow a human analyst to understand the meanings or roles of the frequentlyvisited places.
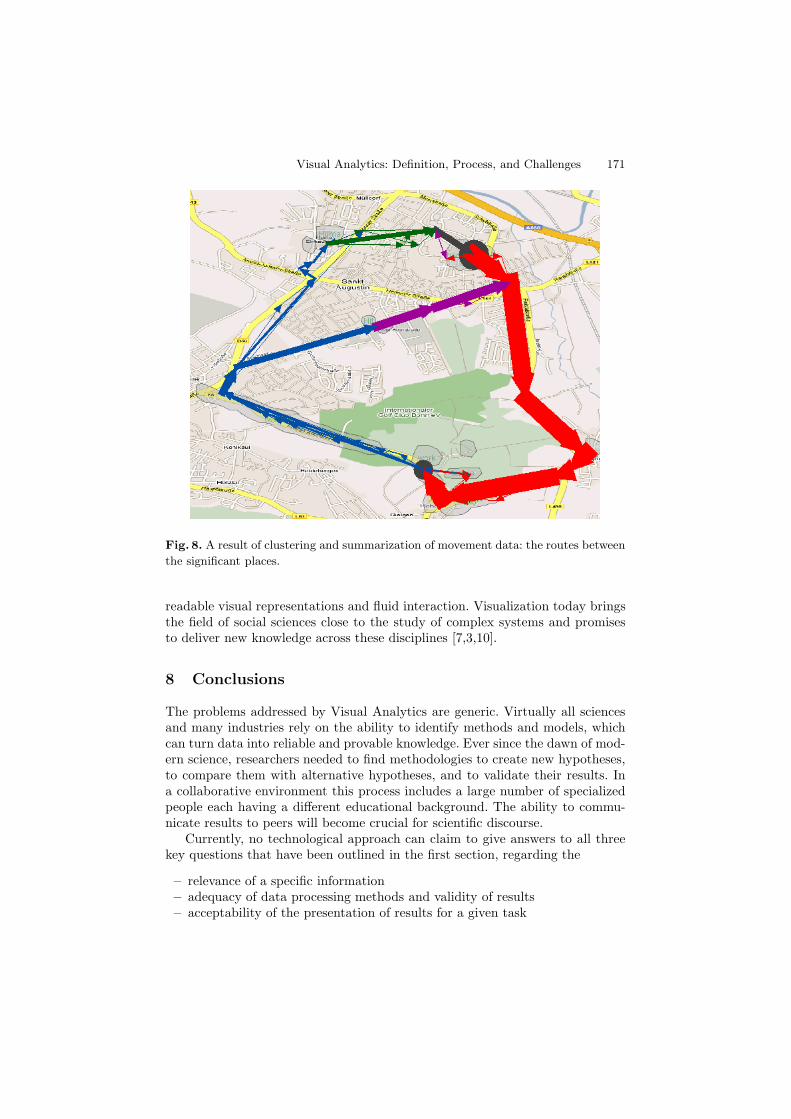
In order to detect and interpret typical routes of the movement between thesignificant places, the analyst first applies a database query to extract sequencesof position records between the stops, from which trajectories (time-referencedlines) are constructed. Then, clustering is applied with the use of specially de-vised similarity measures. The results are computationally generalized and sum-marized and displayed in the spatial context (Figure 8).
7.2 Multilevel Visualization of the Worldwide AirTransportation Network
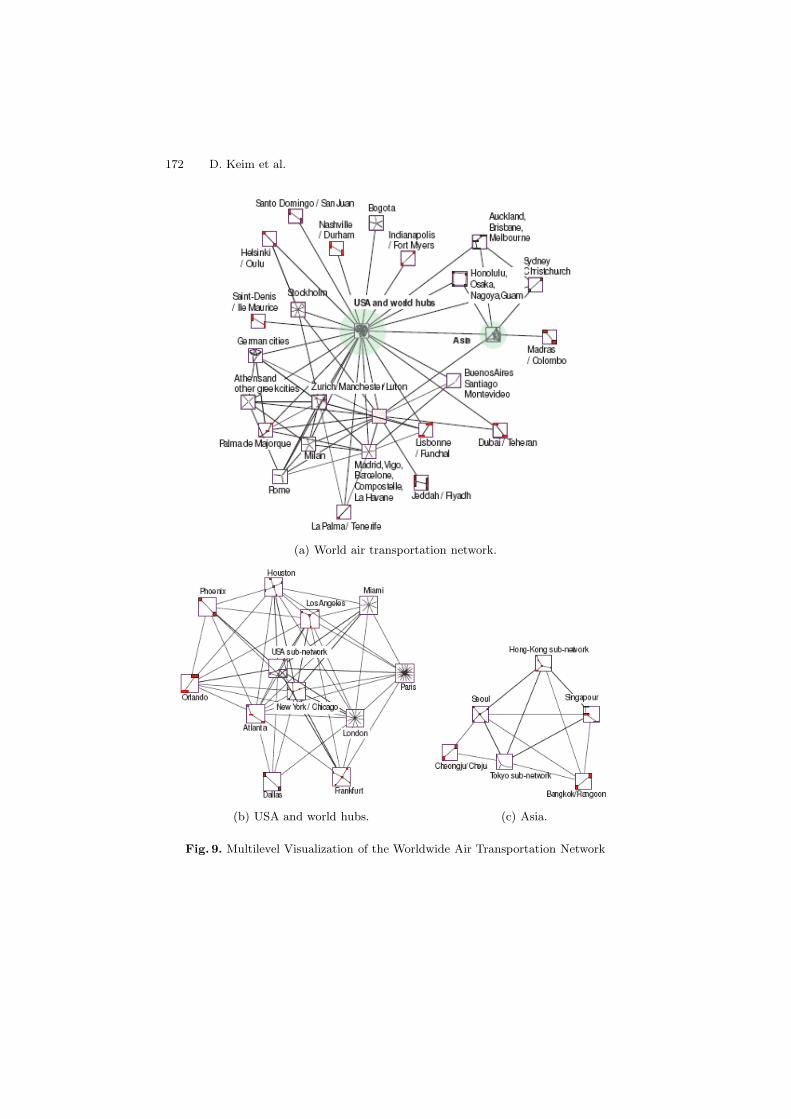
The air transportation network has now become more dense and more complexat all geographical levels. Its dynamic no more rests on simple territorial logics.The challenge is to gain insightful understandings on how the routes carrying thedensest traffic organize themselves and impact the organization of the networkinto sub-communities at lower levels. At the same time, subnetworks grow ontheir own logic, involving tourism, economy or territorial control, and influenceor fight against each other. Because of the network size and complexity, its studycan no more rely on traditional world map and requires novel visualization. Acareful analysis of the network structural properties, requiring recent results onsmall world phenomenon, reveals its multilevel community structure.
The original network is organized into a top level network of communi-ties (Figure 9(a)). Each component can then be further decomposed into sub-communities. Capitals such as New York, Chicago, Paris or London (Figure 9(b))clearly attract most of the international traffic and impose routes to fly the worldaround because of airline partnerships (economical logic). Asia (Figure 9(c))clearly stands apart from these core hubs because of strong territorial ties en-dorsed by national Asian airline companies (territorial logic). Visualization ofsocial networks such as the worldwide air transportation is challenged by thenecessity to scale with the growing size of network data while being able to offer
Visual Analytics: Definition, Process, and Challenges 171
Fig. 8. A result of clustering and summarization of movement data: the routes between
the significant places.
readable visual representations and fluid interaction. Visualization today bringsthe field of social sciences close to the study of complex systems and promisesto deliver new knowledge across these disciplines [7,3,10].
8 Conclusions
The problems addressed by Visual Analytics are generic. Virtually all sciencesand many industries rely on the ability to identify methods and models, whichcan turn data into reliable and provable knowledge. Ever since the dawn of mod-ern science, researchers needed to find methodologies to create new hypotheses,to compare them with alternative hypotheses, and to validate their results. Ina collaborative environment this process includes a large number of specializedpeople each having a different educational background. The ability to commu-nicate results to peers will become crucial for scientific discourse.
Currently, no technological approach can claim to give answers to all threekey questions that have been outlined in the first section, regarding the
– relevance of a specific information– adequacy of data processing methods and validity of results– acceptability of the presentation of results for a given task
172 D. Keim et al.
(a) World air transportation network.
(b) USA and world hubs. (c) Asia.
Fig. 9. Multilevel Visualization of the Worldwide Air Transportation Network
Visual Analytics: Definition, Process, and Challenges 173
Visual Analytics research does not focus on specific methods to address thesequestions in a single “best-practice”. Each specific domain contributes a reper-toire of approaches to initiate an interdisciplinary creation of solutions.
Visual Analytics literally maps the connection between different alternativesolutions, leaving the opportunity for the human user to view these options inthe context of the complete knowledge generation process and to discuss theseoptions with peers on common ground.
References
1. Aigner, W., Miksch, S., Muller, W., Schumann, H., Tominski, C.: Visual meth-ods for analyzing time-oriented data. IEEE Transactions on Visualization andComputer Graphics 14(1), 47–60 (2008)
2. Amar, R.A., Eagan, J., Stasko, J.T.: Low-level components of analytic activity ininformation visualization. In: INFOVIS, p. 15 (2005)
3. Amiel, M., Melancon, G., Rozenblat, C.: Reseaux multi-niveaux: l’exemple desechanges aeriens mondiaux. M@ppemonde 79(3) (2005)
4. Andrienko, G., Andrienko, N., Jankowski, P., Keim, D., Kraak, M.-J.,MacEachren, A., Wrobel, S.: Geovisual analytics for spatial decision support:Setting the research agenda. Special issue of the International Journal of Geo-graphical Information Science 21(8), 839–857 (2007)
5. Andrienko, G., Andrienko, N., Wrobel, S.: Visual analytics tools for analysis ofmovement data. ACM SIGKDD Explorations 9(2) (2007)
6. Andrienko, N., Andrienko, G.: Exploratory Analysis of Spatial and TemporalData. Springer, Heidelberg (2005)
7. Auber, D., Chiricota, Y., Jourdan, F., Melancon, G.: Multiscale visualization ofsmall world networks. In: INFOVIS (2003)
8. Card, S.K., Mackinlay, J., Shneiderman, B.: Readings in Information Visualiza-tion: Using Vision to Think. Morgan Kaufmann, San Francisco (1999)
9. Ceglar, A., Roddick, J.F., Calder, P.: Guiding knowledge discovery through in-teractive data mining, pp. 45–87. IGI Publishing, Hershey (2003)
10. Chiricota, Y., Melancon, G.: Visually mining relational data. International Reviewon Computers and Software (2005)
11. Das, A.: Semantic approximation of data stream joins. IEEE Transactions onKnowledge and Data Engineering 17(1), 44–59 (2005), Member-Johannes Gehrkeand Member-Mirek Riedewald
12. Dix, A., Finlay, J.E., Abowd, G.D., Beale, R.: Human-Computer Interaction (.),3rd edn. Prentice-Hall, Inc., Upper Saddle River (2003)
13. Duda, R., Hart, P., Stock, D.: Pattern Classification. John Wiley and Sons Inc,Chichester (2000)
14. Dykes, J., MacEachren, A., Kraak, M.-J.: Exploring geovisualization. ElsevierScience, Amsterdam (2005)
15. Engel, K., Hadwiger, M., Kniss, J.M., Rezk-salama, C., Weiskopf, D.: Real-timeVolume Graphics. A. K. Peters, Ltd., Natick (2006)
16. Ester, M., Sander, J.: Knowledge Discovery in Databases - Techniken und An-wendungen. Springer, Heidelberg (2000)
17. Forsell, C., Seipel, S., Lind, M.: Simple 3d glyphs for spatial multivariate data.In: INFOVIS, p. 16 (2005)
174 D. Keim et al.
18. Han, J., Kamber, M. (eds.): Data Mining: Concepts and Techniques. MorganKaufmann, San Francisco (2000)
19. Hand, D., Mannila, H., Smyth, P. (eds.): Principles of Data Mining. MIT Press,Cambridge (2001)
20. Inselberg, A., Dimsdale, B.: Parallel Coordinates: A Tool for Visualizing Multi-variate Relations (chapter 9), pp. 199–233. Plenum Publishing Corporation, NewYork (1991)
21. Jacko, J.A., Sears, A.: The Handbook for Human Computer Interaction. LawrenceErlbaum & Associates, Mahwah (2003)
22. Johnson, C., Hanson, C. (eds.): Visualization Handbook. Kolam Publishing (2004)23. Keim, D., Ertl, T.: Scientific visualization (in german). Information Technol-
ogy 46(3), 148–153 (2004)24. Keim, D., Ward, M.: Visual Data Mining Techniques (chapter 11). Springer, New
York (2003)25. Keim, D.A., Ankerst, M., Kriegel, H.-P.: Recursive pattern: A technique for visu-
alizing very large amounts of data. In: VIS ’95: Proceedings of the 6th conferenceon Visualization ’95, Washington, DC, USA, p. 279. IEEE Computer SocietyPress, Los Alamitos (1995)
26. Keim, D.A., Panse, C., Sips, M., North, S.C.: Pixel based visual data mining ofgeo-spatial data. Computers &Graphics 28(3), 327–344 (2004)
27. Kerren, A., Stasko, J.T., Fekete, J.-D., North, C.J. (eds.): Information Visualiza-tion. LNCS, vol. 4950. Springer, Heidelberg (2008)
28. Kruger, J., Schneider, J., Westermann, R.: Clearview: An interactive context pre-serving hotspot visualization technique. IEEE Transactions on Visualization andComputer Graphics 12(5), 941–948 (2006)
29. Maimon, O., Rokach, L. (eds.): The Data Mining and Knowledge Discovery Hand-book. Springer, Heidelberg (2005)
30. Meliou, A., Chu, D., Guestrin, C., Hellerstein, J., Hong, W.: Data gathering toursin sensor networks. In: IPSN (2006)
31. Mitchell, T.M.: Machine Learning. McGraw-Hill, Berkeley (1997)32. Naumann, F., Bilke, A., Bleiholder, J., Weis, M.: Data fusion in three steps:
Resolving schema, tuple, and value inconsistencies. IEEE Data Eng. Bull. 29(2),21–31 (2006)
33. North, C.: Toward measuring visualization insight. IEEE Comput. Graph.Appl. 26(3), 6–9 (2006)
34. Perner, P. (ed.): Data Mining on Multimedia Data. LNCS, vol. 2558. Springer,Heidelberg (2002)
35. Schumann, H., Muller, W.: Visualisierung - Grundlagen und allgemeine Metho-den. Springer, Heidelberg (2000)
36. Shneiderman, B.: Tree visualization with tree-maps: 2-d space-filling approach.ACM Trans. Graph. 11(1), 92–99 (1992)
37. Shneiderman, B., Plaisant, C.: Designing the User Interface. Addison-Wesley,Reading (2004)
38. Spence, R.: Information Visualization. ACM Press, New York (2001)39. Thomas, J.J., Cook, K.A.: Illuminating the Path. IEEE Computer Society Press,
Los Alamitos (2005)40. Tricoche, X., Scheuermann, G., Hagen, H.: Tensor topology tracking: A visual-
ization method for time-dependent 2d symmetric tensor fields. Comput. Graph.Forum 20(3) (2001)
41. Unwin, A., Theus, M., Hofmann, H.: Graphics of Large Datasets: Visualizing aMillion (Statistics and Computing). Springer, New York (2006)

Visual Analytics: Definition, Process, and Challenges 175
42. van Wijk, J.J.: The value of visualization. In: IEEE Visualization, p. 11 (2005)43. Widom, J.: Trio: A system for integrated management of data, accuracy, and
lineage. In: CIDR, pp. 262–276 (2005)44. Yi, J.S., Kang, Y.a., Stasko, J.T., Jacko, J.A.: Toward a deeper understanding
of the role of interaction in information visualization. IEEE Trans. Vis. Comput.Graph. 13(6), 1224–1231 (2007)