visual analysis of set relations in a graph
TRANSCRIPT

Eurographics Conference on Visualization (EuroVis) 2013B. Preim, P. Rheingans, and H. Theisel(Guest Editors)
Volume 32 (2013), Number 3
Visual Analysis of Set Relations in a Graph
Panpan Xu1, Fan Du2, Nan Cao3, Conglei Shi1, Hong Zhou4and Huamin Qu1
1Hong Kong University of Science and Technology, Hong Kong, China2Zhejiang University, China
3 IBM T. J. Watson Research Center, USA4Shenzhen University, China
Abstract
Many applications can be modeled as a graph with additional attributes attached to the nodes. For example, agraph can be used to model the relationship of people in a social media website or a bibliographical dataset.Meanwhile, additional information is often available, such as the topics people are interested in and the musicthey listen to. Based on this additional information, different set relationships may exist among people. Revealingthe set relationships in a network can help people gain social insight and better understand their roles within acommunity. In this paper, we present a visualization system for exploring set relations in a graph. Our system is de-signed to reveal three different relationships simultaneously: the social relationship of people, the set relationshipamong people’s items of interest, and the similarity relationship of the items. We propose two novel visualizationdesigns: a) a glyph-based visualization to reveal people’s set relationships in the context of their social networks;b) an integration of visual links and a contour map to show people and their items of interest which are clusteredinto different groups. The effectiveness of the designs has been demonstrated by the case studies on two repre-sentative datasets including one from a social music service website and another from an academic collaborationnetwork.
Categories and Subject Descriptors (according to ACM CCS): H.5.2 [Information Interfaces and Presentations]:User Interfaces—Graphical user interfaces (GUI)
1. Introduction
Set relations appear in various contexts in data analysis. Inthis paper, we focus on the visual representation of set rela-tions in a social network where each person (node) is relatedto a set of items. This study is motivated by the increasingpopularity of social websites such as Twitter and Facebookwhere people take an interest in different topics and sharetheir favorite readings or music. Meanwhile, other datasetssuch as bibliographic database can also be described in thesame way as it contains academic collaboration networksand researchers have different ranges of research interests.
This kind of data poses many interesting problems for vi-sualization. In particular, we intend to develop effective vi-sual means for 1) studying the correlation between set re-lations and topological distances in the social network; and2) observing the distribution and overlaps of the sets with re-spect to the clusters of the items. The methods can be used to
observe the effect of homophily, i.e., “similarity breeds con-nection” or “birds of a feather flock together” [MSLC01].Meanwhile, visualizing the set relations over the item clus-ters can reveal the “traces” of individuals or groups of peo-ple in the information context where the items (such as top-ics or music) are organized according to their semantic re-lations (i.e. similarity). In summary, the set relations can beobserved from two complementary perspectives, in the con-text of a social network and in the context of item clusters.
Many visualization techniques for set relations have beendeveloped. Existing set visualizations can be roughly di-vided into two categories depending on the most impor-tant relation it intends to depict: (1) those that utilize spa-tial positioning to encode some primary dimension (suchas geographical location) of the items, where the set re-lations are sketched on top of the visualization with en-closing contours or continuous lines. This includes Bub-
c⃝ 2013 The Author(s)Computer Graphics Forum c⃝ 2013 The Eurographics Association and Blackwell Publish-ing Ltd. Published by Blackwell Publishing, 9600 Garsington Road, Oxford OX4 2DQ,UK and 350 Main Street, Malden, MA 02148, USA.
DOI: 10.1111/cgf.12093
Panpan Xu et al. / Visual Analysis of Set Relations in a Graph
ble Sets [CPC09], LineSets [ARRC11] and most recentlyKelp diagrams [DvKSW12]; (2) those that emphasize setrelations such as overlappings and subset/superset relationswhile other semantic relations between the items are nottaken into account. This category of visualizations includesVenn diagram and Euler diagram [SAA09] [RD10]. To thebest of our knowledge, there have been no previous visualmeans for visualizing set relations in the context of a socialnetwork.
In this paper, we propose visual designs depicting the setrelations in a social network from two perspectives: 1) anode-link view with nodes represented by glyphs showingcorrelations between the social distances and the set rela-tions (subset / superset / overlap); and 2) a visual design de-lineating sets on a substrate visualization (e.g. contour map)which shows the clusters of all the items given their simi-larities, and allows viewers to observe the distribution of theitems in the sets. We apply the above techniques to two realdatasets. These include one from a social music service web-site and another from an academic collaboration network.
In summary, the major contributions of this paper are:
• a glyph design that facilitates the analysis of homophilyin social networks where each node corresponds to a setof items;
• a visual design and layout method for set relation visual-ization with respect to clusters of items;
• two case studies based on real datasets that demonstratehow the use of the above two visualizations can lead to in-teresting findings in some application domains includingonline social networks and academic collaboration net-works.
The rest of the paper is organized as follows. We first in-troduce the related work in Section 2. The overview of oursystem is provided in Section 3, followed by the details ofthe visualization design in Section 4 and the implementationin Section 5. We then present the experiment results on twodatasets and discuss the limitations of our method in Section6. Finally, in Section 7, we conclude the paper and suggestsome future research directions.
2. Related Work
Our work draws on research in several categories. In this sec-tion, we first review the current existing visualization tech-niques for set relations. Then we discuss some recent re-search works on the visual analysis of graphs.
2.1. Set Relationship Visualization
The representations of set relationships have been studiedfrom the very early days. Euler diagram and Venn diagramhave been used extensively. This problem has also receivedattentions from visualization researchers.
Collins et al. [CPC09] presented Bubble Sets which
uses bubble-like shapes to connect items belonging to thesame set. The Bubble Sets approach is especially effec-tive to reveal set relations over items which have fixed lay-outs like maps. Similar to the Bubble Sets, the LineSetsmethod [ARRC11] uses smooth lines to connect items inthe same set where the items also have fixed layouts. Din-kla et al. [DvKSW12] developed the Kelp diagram, whichis a most recent algorithm for set visualization over preallo-cated items. The algorithm employs edge routing in order toavoid misleading crossovers or wrong set item inclusions.
Another line of set visualization techniques does not as-sume a fixed layout of the items. The items are spatiallygrouped such that the relations between sets are more rec-ognizable. Simonetto et al. [SAA09] and Stapleton et al.[SRHZ11] developed fully automatic methods to generateEuler-like diagrams for the visualization of overlapping sets.Riche and Dwyer [RD10] hierarchically organized the inter-secting sets such that the Euler diagrams can be more easilydrawn.
Moreover, sets can be interpreted as hyperedges in a hy-pergraph, where the items are the vertices and each hyper-edge could consist of multiple vertices. Methods for drawinghypergraphs have been studied in the graph drawing commu-nity [JP87] [Mäk90] [BE01]. Researchers have also investi-gated the existence of various types of support that wouldbe applied in the drawing of hypergraphs. These includeplanar [KKS09], path-based [BCPS12], and cactus support[BCPS11].
In this paper, we propose a composited visual design forvisualizing set relations with respect to the clusters of itemsin the data. We also propose methods to address the trade-off between the geometrical simplicity of the visual linksdenoting each set and the preservation of the item locationswith respect to their corresponding clusters.
2.2. Visual Analysis of Social Networks
Many of the current visual analysis systems focus on de-picting the topologies of the graph structures [vLKS∗11]through node-link diagrams, adjacency matrices, or com-binations of the two. Some integrate statistic informationto enable more effective visual detection [WFC∗06] [PS08][BCD∗10] [KMSH12]. Many of the statistics are node met-rics derived from either local topological properties (e.g.node degree, clustering coefficient) or global structures (e.g.betweenness centrality). The metrics are directly encoded asvisual attributes such as spatial position or color.
One of the future directions for graph visualization asnoted in a recent survey [vLKS∗11] is the integration of var-ious data types in the visual analysis of graphs. Researchefforts have focused on the visualization of heterogeneousrelations (graph involving multiple types of nodes and rela-tions) [CSL∗10] [DRRD12], and graphs with node attributes[SA06] [Wat06]. We identify that in real social network data,
c⃝ 2013 The Author(s)c⃝ 2013 The Eurographics Association and Blackwell Publishing Ltd.
62

Panpan Xu et al. / Visual Analysis of Set Relations in a Graph
each person could be associated with a set of items. For ex-ample, in academic collaboration networks, each researcheris interested in different topics, and in online social net-works, each user could be affiliated to a wide range of itemssuch as the music he listens to and the movies he watches. Inthis kind of social network, it would be of interest to studythe effect of homophily [MSLC01], which means that sociallinks tend to exist among persons with similar characteris-tics. In this paper, we propose a novel glyph based visualrepresentation for studying the correlation between the setrelations and social distances.
3. Overview
In this section we present our research problems, and give anoverview of the visual designs in our system.
3.1. Research Problems
We design the visualization such that they can be used tovisually analyze the set relations in a social network. In par-ticular, we identify the following research questions:
• Does the distribution of people’s interests tend to be lo-calized in a social network? Can we observe the effectof homophily? For example, in an academic collaborationnetwork, Do researchers who never collaborate have dif-ferent research interests? In an online social network, dofriendship links correlate to similar interests?
• For several persons (or groups), can we observe the dis-tributions and overlaps of their interests with respect tothe clusters of items? Combining the set relations withthe cluster information could be beneficial since the itemclusters could provide contextual information for analyz-ing set relations. For example, we can get some sense ofwhich clusters contain a lot of set intersections and inwhich clusters the items belong uniquely to some sets.Moreover, when there is little overlap between the inter-ests of two persons, it is possible that items from differentsets could belong to the same clusters, thus suggesting animplicit relation between the sets of interests of two per-sons?
3.2. Basic Idea
We propose two visual designs to address the research ques-tions mentioned above. These include a glyph design, which,when combined with the node-link diagram, can reveal peo-ple’s set relationship in the context of the social network(Fig.1 left), and an integration of visual links and a contourmap to show the items of interest for several people withrespect to the clusters of items (See Fig.1 right).
The glyph design can be integrated to a node-link view ofthe social network, and this can provide an overview of theset relations in the social network. Each glyph encodes theset relations of a person with all others, together with their
distances in the graph. The glyph design shows the correla-tion between social distances and set relations and enablesvisual identification of communities with localized interests.The design is explained in detail in Section 4.1.
From the overview, several persons can be selected to fur-ther examine the items of interest of each person and theirintersections with respect to the clusters of items. Here a vi-sual design with two layers is employed. In the backgroundlayer, a contour map is used to show the clusters of the items.Visual links connecting items in the same sets are drawn ontop of the contour map. Based on this design, it is possibleto visually correlate the set relations depicted on the fore-ground to the item clusters as revealed by the contour map.
social graph set items
co-authorship
researcher
keywords
Figure 1: An overview of the framework for analyzing setrelations. Left: glyphs integrated with a node-link diagram.Right: set visualization over item clusters. The example ofpublication dataset is used for illustration. Three nodes areselected on the left, and the items in the sets are depicted byvisual links on the left.
4. Visual Design
In this section, we describe our visual designs in detail andthe reasons that we choose these designs.
4.1. Glyph Design
For each node i, we draw a glyph encoding the informationof its item set overlap and social distances to all the othernodes. We use an asymmetric measure to compute the over-lap of Si to S j by |Si ∩ S j|/|Si|, while other measures suchas the Jaccard coefficient can also be used. The social dis-tances from node i to the other nodes are the shortest pathdistances on the graph in our implementation, while otherdistance metrics can also be applied.
There are several approaches to design the glyph that canintegrate the overlap and distance information. They are dif-ferent in their visual clutterness and information loss. Scat-terplot (Fig. 2(a)), for example, incurs no loss in informa-tion but will become harder to read when the scatterplotsfor different nodes are drawn on the same screen. On theother hand, the correlation between the overlap and the dis-tance can be computed and encoded with node size or colorintensity. This introduces less visual clutter, though details
c⃝ 2013 The Author(s)c⃝ 2013 The Eurographics Association and Blackwell Publishing Ltd.
63

Panpan Xu et al. / Visual Analysis of Set Relations in a Graph
could be lost. Fig. 2(b) illustrates an alternative design. Itis a gray-scale stacked histogram. The depth of the shadeencodes the amount of overlap. The deeper the shade themore the overlap. In the histogram, each bar is composed ofseveral segments. Each segment corresponds to the group ofnodes which are at the same distance from node i and have asimilar amount of set overlap with node i. The segments arevertically arranged by their shade. The height of each seg-ment is proportional to the percentage of members in thisgroup to all members with the same distance from i. Theheight can be scaled by Si, the number of items in the set, asillustrated in the case study figures in Section 6. The stackedhistogram can be further replaced with a stacked graph suchthat the shapes would have simpler geometry, as illustratedin Fig. 2(c).
Color hue as another visual channel is utilized to indicatewhether a person’s item set is larger than most of its neigh-bors in the graph. Diverging hues are assigned to each ofthe nodes, to encode the information as a binary value: redcolor represents that the size of the corresponding item set islarger than half of the neighbor nodes, and blue color repre-sents the opposite. With this color encoding, the nodes withfewer items and are potentially subsets of the others can beeasily identified. These nodes have blue hues and are moredarkly shaded.
Overall, the resulting glyph features a composition ofvisual channels including intensity of color, hue, size andshape. After integrating the glyph to the node-link diagram,the visualization could reveal interesting patterns concerninggroups of nodes and outliers. Some of our findings after ap-plying the glyph view to real social network datasets include:1) densely connected communities with highly localized dis-tribution of interests; 2) subgroups in the social networkwhere the existence of social links are highly correlated totheir interest overlaps, demonstrating the phenomenon ofhomophily; 3) persons having interest overlap with distantnodes. These will be discussed in detail in Section 6.
distancedistance
overla
p
distance
overlap
(a) (b) (c)
Figure 2: Design choices for glyphs encoding set relationsand social distances for each node to all the other nodes inthe social graph. (a)scatterplot; (b) grayscale stacked his-togram; (c) stacked graph.
4.2. Set Visualization
Contour map, which is a density based visualization, canbe used to summarize the overall distributions of the items,
and recently it has been employed in many visualization sys-tems [CSL∗10] [ZBDS12]. Contour map gives a global con-text on top of which the sets will be overlaid. The advantageof using the density based visualization is that it can main-tain scalability when there is a large number of items and ingeneral it would be easier to detect the correlation betweenset relations and the global distributions of items given thatthe overall distribution is summarized in a concise way.
How to visually group the items in the same set is an-other design choice to make. There are several user tasks tobe supported, including basic set relation reading tasks: (T1)find the items in a set; (T2) identify the sets that an item be-longs to; and (T3) identify the set intersections. Moreover,combining the set relations with the item cluster informationcould enable the user tasks inculding: (T4) identify the dis-tribution of items in a set with respect to the item clusters;and (T5) find implicit overlap between the sets.
Several options to visually group the items and to sup-port the above tasks have been considered. Color (hue) andshape are some visual channels that can be utilized to visu-ally group items, although they could be less effective thandirect visual linking [SWS∗11]. For visually linking items,one choice is to use enclosing contours, such as Bubble-Sets [CPC09]. This method would interfere with the under-lying density based visualization though. We choose to usespanning tree like shapes to visually connect the items in thesame sets, which is a generalization of the denotation usedin Lineset [ARRC11] and similar to the ones in the Kelpdiagram [DvKSW12]. Color-coded concentric circles as inLineset and Kelp diagram are also used to indicate the setmembership for each item (T2).
Using visual links to connect related items faces the chal-lenge of scalability with respect to the numbers and distri-butions of items in the sets. Branchings and zig-zags of thevisual links could make it harder to read the items in thesets (i.e., task T1 and T4) and could incur visual clutter forthe detection of meaningful relations between the sets (i.e.,task T3 and T5). For the visualization to be effective, it istherefore desirable to have smooth visual links with a smallnumber of branches such that it takes less effort to visuallyfollow the paths connecting the items [War00]. Moving theitems slightly away from their original positions is a strategythat can be applied to simplify the geometry of the visuallinks. Meanwhile, for users to effectively perform task T4and T5, the positions of the items in the original MDS lay-out should be preserved as much as possible. Therefore atrade-off should be made between two general aesthetic cri-teria in the visual link layout algorithm: (A1) the simplicityof the visual links; (A2) the preservation of original item lo-cations. The details of the layout algorithm will be explainedin Section 5.
c⃝ 2013 The Author(s)c⃝ 2013 The Eurographics Association and Blackwell Publishing Ltd.
64

Panpan Xu et al. / Visual Analysis of Set Relations in a Graph
5. Implementation
In this section, we describe the implementation of the viewdepicting set relations over item clusters.
5.1. Contour Map Construction
The input to this step is the entire set of items and the simi-larity between pairs. Multidimensional scaling (MDS) is em-ployed to assign each item a position in the plane. MDS ar-ranges items with a higher degree of similarity between eachother in close proximity, and groups of similar items formvisual clusters. Based on this initial layout, kernel densityestimation (KDE) can be used to derive a smooth represen-tation of the item distribution on the plane. Isocontours aretraced by following points of the same density. The contoursare then filled with transparent color and the additive blend-ing effect creates regions that are more shaded indicatingclusters of items. The resulting contour map is a visual ab-straction of the discrete distribution of the items in the MDSlayout.
5.2. Visual Link Layout
The contour map derived from the previous step serves as areference map, based on which the visual links representingthe sets are drawn. As discussed in Section 4, we intend toutilize the flexibility to move the items slightly away fromtheir initial positions in the MDS layout, such that less vi-sual clutter is introduced when drawing the links. The itemsshould not move too drastically such that one could still in-fer the cluster that the item belongs to from the underlyingcontour map.
The following layout algorithm is implemented to drawvisual links corresponding to several selected sets Si, i ∈{1, ...,m}. The algorithm consists of two phases:
1. Formation and simplification of a spanning tree connect-ing all the items in
∪i∈{1,...,m} Si, illustrated in Fig. 3;
2. Generation of visual links for individual sets based onthe “backbone” spanning tree obtained in the first step,illustrated in Fig 4.
The motivation of the first phase is to derive a referencebackbone to draw the visual links for the individual sets. Thefollowing are desirable properties for the backbone span-ning tree: small number of branches, smoothness in eachsegment, and small distortion to the item positions in theinitial layout. The rationale is that the backbone should besimple in its geometry such that the visual links generated inthe second phase are not cluttered (i.e., criterion A1). Mean-while, the items should not be moved too drastically in casethe contour map becomes invalid for showing the cluster thatthe items belong to (i.e., criterion A2). Our implementationapplies the following steps to form and simplify the spanningtree:
(a) cut
(b) fold
(c) smooth
1 2
45
6
78
9
10
113
1 2
45
6
78
9
10
113
αβ
γ
Figure 3: Formation and simplification of a backbone span-ning tree: (a) hierarchical agglomerative clustering of theitems based on their euclidean distances in the initial MDSlayout; (b) the nodes are grouped based on a cut on thehierarchy, the spanning tree are simplified (by reducingbranches) based on the grouping, where the dashed linesare new edges; (c) the resulting branches on the spanningtree are straightened by moving the items, where the dashedlines indicate an approximate shape of the backbone span-ning tree.
1. Perform hierarchical agglomerative clustering (HAC) forall the items in the selected sets based on their Euclideandistance after MDS layout. A dendrogram showing theresult of the clustering is visualized in Fig. 3(a).
2. Construct a spanning tree for the items based on the hier-archical cluster. An edge will be included in the spanningtree if it is the shortest link connecting two sibling clus-ters. A resulting spanning tree is shown in Fig. 3(b).
3. Perform a cut on the dendrogram at a given height. Con-sequently, the items will be partitioned into groups bytheir spatial closeness (see Fig. 3(a) and (b)).
4. Fold branches on the spanning tree (see Fig. 3(b)) basedon the grouping of the items. Some edges are not on thepath for connecting different groups of items and could beremoved from the spanning tree. As in the figure, e(5,7)is on the path for connecting group α and γ while e(6,7)is not on any path connecting different groups. There-fore e(6,7) could be deleted from the spanning tree. Af-ter deleting e(6,7), n(6) is left unconnected. The strategywe have taken is to merge n(6) to the nearest edge, whichis e(5,7). This is accomplished by deleting e(5,7) andadding e(5,6), e(6,7) to the tree. The result of this step is
c⃝ 2013 The Author(s)c⃝ 2013 The Eurographics Association and Blackwell Publishing Ltd.
65

Panpan Xu et al. / Visual Analysis of Set Relations in a Graph
a spanning tree which has less branches but still approxi-mates the original shape of it.
5. Smooth the segments on the spanning tree (Fig. 3(c)). Inthis step, the items are moved from their original posi-tions such that there would be less zigzags in the shape ofeach segment. A force-directed method could be appliedin this case, with items both drawn towards their origi-nal positions and by the spring force exerted by nearbyedges.
Based on the backbone spanning tree, we draw the visuallinks connecting individual sets in the second phase. Ourmethod first divides the tree into segments, and routes linksfor each set on the segments. For each set, links from differ-ent segments are connected to form continuous visual linksfor each set. On each segment, there are items from differentsets. To depict the item membership effectively (i.e., task T1)and to better reveal set intersections (i.e., task T3), we applya strategy for drawing the visual links on each segment. Asillustrated in Fig. 4, each set is assigned a lane parallel to thesegment. To draw the visual link for a set, we scan throughall the items one-by-one in the segment, and route the link topass through: 1) the central lane if the item on the segmentis common to multiple sets; 2) the lane assigned to the set ifthe item does not belong to the set; 3) the lane assigned tothe set if the item belongs exclusively to the set. In the 3rdcase, the item is also moved to the lane corresponding to theset.
Fig. 5 illustrates the intermediate results of our algorithm,and the final output, for the visualization of three sets.
set A
set B
set C
items only in set C
items shared by set A, B and C
Figure 4: The simplified and smoothed spanning tree aredivided into segments (where there are no branches). In eachsegment, continuous lines are used to connect the items inthe same sets.
6. Results and Discussions
We select two real datasets from different application do-mains for case study. One is an online social network(Last.fm) where each person is interested in a set of musicartists, and another is a professional social network (bibli-ographical databases) where each person is related to a setof research topic related keywords. The visualizations in the
(b)(a)
Figure 5: The intermediate and the final results of the layoutalgorithm: (a) the initial spanning tree connecting all theitems and the backbone spanning tree after the first phase ofthe algorithm is performed; (b) the visual links for individualsets drawn based on the backbone spanning tree.
case study are implemented in Java with the Prefuse† infor-mation visualization toolkit.
A
922922922
370370370370370370370370370370370370
161416141614161416141614161416141614161416141614161416141614
417521
114611461146114611461146114611461146114611461146114611461146114611461146
17041704170417041704170417041704170417041704170417041704170417041704
1998
8
133
136136
149
150150
207207207207207207207207207
253
256256256329329
385385385385385385
414414414414414414414414
464
555
749749749749749749749
779
831831831831831831831831831831831831831831831831831831831831831831831831831831831
924924924924924924924924924924924924924
1020
1072
11131113
11801180
118311831183118311831183118311831183118311831183
12591259
12631263
14781478147814781478147814781478147814781478147814781478147814781478147814781517151715171517151715171517151715171517151715171517151715171517
15321532
1535153515351535
1581
16061606160616061606160616061606
181818181818
1832
1918
2061206120612061206120611543154315431543154315431543154315431543154315431543154315431543154315431543154315431543
30
301301301
545545
688
693 911911911911911911911
958
976
117911791179117911791179
1450 159715971597159715971597
1741
1842
636636636
655655655
847847847
1002
1027102710271027102710271027
133
136136
149253
256329
414414
1020
1072
12631263
1478147814781478147814781517151715171517
1532
1606
1832
11791179
16141614
521
11461146
1998
150150
207207207207
464
555
118311831183
1535
1581
693
958
1450 15971597
1842
688688
B
Figure 6: Subgraphs from the last.fm social network withglyphs. There are two observations: 1) in general, a largerdistance in the social network implies less overlap in inter-ests; and 2) two groups of persons marked by the rectanglesexhibit different properties on the amount of interest over-laps. The effect of homophily is more noticeable in group B.
6.1. Last.fm
Last.fm [las12] is a social music service website whichmaintains a catalog of artists, albums, and tracks. Users ofthe website can listen to music, setup personal profiles of theartists they like, and add other users as friends. Last.fm alsoprovides a web-service API, which can be used for queryinginformation of the users and the artists. The available infor-mation includes the tags, the number of listeners per artist,and the similarity between two given artists.
In the case study, we used the last.fm data released in
† http://prefuse.org/
c⃝ 2013 The Author(s)c⃝ 2013 The Eurographics Association and Blackwell Publishing Ltd.
66
Panpan Xu et al. / Visual Analysis of Set Relations in a Graph
11831183118311831183
181818
198198198198198198198198198198198198198198198198198
370370370
401
490490490490490490
521
831831831831831831831831
846846846
8811088
11461146
1450
14781478
200120012001
298298298
308
13021302
142414241424
1465
22222222
5757
101101
451
814814814862862102010201020
106710671067106710671067106710671067
11201120
1130113011301130
1196119611961196
14711471
1473147314731473
152715271527152715271527
15531553
15971597
16701670167016701670
1682168216821682
A
BC
Daft PunkDaft PunkDaft Punk
ColdplayColdpColdpColdplayColdplayDidDidoDidoDido
Depeche ModeDepeche ModeDepeche ModeDepeche ModeDepeche ModeDepeche ModeDepeche Mode
GorillazGorillaz
Pink FloydPink FloydPink Floyd
MuseMuseMuseMuseMuse
Arctic MonkeysArctic Monkeys
Red Hot Chili PeppersRed Hot Chili PeppersRed Hot Chili PeppersRed Hot Chili PeppersRed Hot Chili PeppersRed Hot Chili PeppersRed Hot Chili PeppersRed Hot Chili PeppersRed Hot Chili PeppersRed Hot Chili PeppersRed Hot Chili PeppersRed Hot Chili PeppersRed Hot Chili PeppersRed Hot Chili PeppersRed Hot Chili PeppersRed Hot Chili Peppers
The BeatlesThe The The The
Green DayGreen DayGreen Day
NirvanaNirvana
nescenceEvanescenceEvanescenceEvanescenceEvaEvanescence
Enya
The All-American RejectsThe All-American RejectsThe All-American RejectsThe All-American RejectsThe All-American RejectsThe All-American RejectsThe All-American RejectsThe All-American RejectsThe All-American RejectsThe All-American RejectsThe All-American Rejects
MuseMuseMuseMuseMuseMuse30 Seconds to Mars30 Seconds to Mars30 Seconds to Mars30 Seconds to Mars30 Seconds to Mars30 Seconds to Mars30 Seconds to Mars30 Seconds to Mars30 Seconds to Mars30 Seconds to Mars30 Seconds to Mars30 Seconds to Mars30 Seconds to Mars30 Seconds to Mars30 Seconds to Mars30 Seconds to Mars30 Seconds to Mars30 Seconds to Mars30 Seconds to Mars30 Seconds to Mars30 Seconds to Mars30 Seconds to Mars
Green DayGreen Dayeral for a Frienderal for a Frienderal for a FriendFuneral for a Frienderal for a Friend
ParamoreParamoreParamoreParamoreParamoreParamoreParamore
eral for a FriendAngels & AirwavesAngels & AirwavesAngels & AirwavesAngels & AirwavesAngels & AirwavesAngels & Airwaves
eral for a Frienderal for a Frienderal for a Frienderal for a Friendblinkblink
In FlamesIn Flames
U2
Deftones
OasisOasOasOasisOasis
eral for a FriendFuneral for a FriendAngels & AirwavesAngels & AirwavesAngels & AirwavesAngels & AirwavesAngels & AirwavesAngels & AirwavesAngels & AirwavesAngels & Airwaves
eral for a Frienderal for a Frienderal for a Frienderal for a Frienderal for a Frienderal for a Frienderal for a Frienderal for a Frienderal for a Frienderal for a Frienderal for a Frienderal for a FriendblinkblinkGood CharlotteGood CharlotteGood CharlotteGood CharlotteGood CharlotteGood Charlotteeral for a Frienderal for a FriendFuneral for a FriendFuneral for a FriendFunFunFuneral for a FriendFuneral for a Frienderal for a Frienderal for a Frienderal for a Frienderal for a Frienderal for a Frienderal for a FriendGood CharlotteGood CharlotteGood CharlotteGood CharlotteGood CharlotteFuneral for a FriendFuneral for a FriendFuneral for a FriendFunFuneral for a FriendFuneral for a Frienderal for a Frienderal for a Frienderal for a Frienderal for a Friend
Angels & AirwavesAngels & AirwavesAngels & AirwavesAngels & AirwavesAngels & AirwavesAngels & AirwavesAngels & AirwavesAngels & AirwavesAngels & AirwavesAngels & AirwavesAngels & AirwavesAngels & AirwavesAngels & AirwavesAngels & AirwavesFuneral for a FriendFuneral for a FriendFuneral for a FriendFuneral for a FriendFuneral for a FriendFuneral for a FriendFuneral for a FriendFuneral for a FriendFuneral for a FriendFuneral for a FriendFuneral for a FriendFuneral for a Frienderal for a Frienderal for a Frienderal for a Frienderal for a Friend
blinkblinkblinkFuneral for a FriendFuneral for a FriendFuneral for a FriendGood CharlotteGood CharlotteGood CharlotteFuneral for a FriendFuneral for a FriendFuneral for a FriendFuneral for a Friend
The UsedTheThe UsedThe UsedTheThe UsedThe UsedFuneral for a FriendFuneral for a FriendFun
The UsedThe UsedThe UsedFuneral for a FriendFuneral for a FriendFun
Red Hot Chili PeppersRed Hot Chili PeppersRed Hot Chili PeppersRed Hot Chili PeppersRed Hot Chili PeppersRed Hot Chili PeppersPearl JamPearl JamPearl JamPearl Jam
Red Hot Chili PeppersRed Hot Chili PeppersRed Hot Chili PeppersRed Hot Chili PeppersRed Hot Chili PeppersColdpColdpColdplayColdplay
MuseMuseMuseMuseEngenheiros do HawaiiEngenheiros do HawaiiEngenheiros do HawaiiEngenheiros do HawaiiEngenheiros do HawaiiEngenheiros do HawaiiEngenheiros do HawaiiEngenheiros do HawaiiEngenheiros do HawaiiEngenheiros do HawaiiEngenheiros do HawaiiEngenheiros do HawaiiEngenheiros do HawaiiEngenheiros do HawaiiEngenheiros do HawaiiEngenheiros do HawaiiEngenheiros do HawaiiEngenheiros do HawaiiEngenheiros do HawaiiEngenheiros do HawaiiColdpColdpColdpColdpColdplayColdplayColdplayColdplayEngenheiros do HawaiiEngenheiros do HawaiiEngenheiros do HawaiiEngenheiros do HawaiiEngenheiros do HawaiiEngenheiros do HawaiiEngenheiros do Hawaii
MuseMuseMuseMuseMuse
AC/DCAC/DCAC/DC
MetallicaMetallicMetallicaMetallicMetallicaMetallicaMetallicMetallicMetallicaMetallicaallica
White StripesThe White StripesThe White StripesThe White StripesThe White StripesThe White Stripes
Black Label SocietyBlack Label SocietyBlack Label SocietyBlack Label SocietyBlack Label SocietyBlack Label SocietyBlack Label SocietyBlack Label SocietyBlack Label SocietyBlack Label SocietyBlack Label Society
Dire StraitsDire StraitsDire Straits
AC/DCAC/DCião Urbanaião Urbanaião Urbanaião Urbanaião UrbanaLegião UrbanaLegião UrbanaLegião Urbanaião Urbanaião Urbana
R.E.M.R.E.M.R.E.M.R.E.M.
tic Monkeystic MonkeysArctic MonkeysArctic Monkeystic Monkeystic MonkeysKaiser ChiefsKaiser ChiefsKaiser ChiefsKaiser ChiefsKaiser ChiefsKaiser ChiefsKaiser ChiefsKaiser Chiefstic Monkeystic Monkeystic Monkeystic MonkeysArctic MonkeysArctic MonkeysArctic MonkeysArctic Monkeystic Monkeystic Monkeystic Monkeystic Monkeystic Monkeys
Johnny CashJohnny Cash
Pearl JamPearl JamPearl JamPearl JamOzzy OsbourneOzzy OsbourneOzzy OsbourneOzzy OsbournePearl JamPearl JamPearl JamPearl Jam
Green DayGreen DayGreen DayApocalypticaApocalypticaApocalypticaApocalypticaApocalypticaApocalypticaApocalypticaApocalypticaApocalypticaApocalypticaApocalypticaApocalypticaApocalypticaGreen DayGreen DayGreen DayGreen DayGreen DayGreen DayGreen DayGreen Day
Eric ClaptonEric ClaptonEric ClaptonEric ClaptonEric ClaptonEric ClaptonEric Clapton
EaglesEaglesEaglesEagles
Alice CooperAlice CooperAlice CooperAlice Cooper
Eric ClaptonEric ClaptonEric ClaptonEric ClaptonEric ClaptonEric ClaptonJohn LennonJohn LennonJohn LennonJohn LennonJohn LennonJohn LennonJohn LennonJohn Lennon
Bruce SpringsteenBruce SpringsteenBruce Springsteen
John LennonJohn LennonJohn LennonJohn LennonRolling StonesRolling StonesThe Rolling StonesThe Rolling StonesThe Rolling StonesRolling StonesRolling StonesRolling StonesRolling StonesThe Rolling StonesThe Rolling StonesRolling StonesRolling StonesRolling StonesJohn LennonJohn LennonJohn LennonJohn LennonJohn LennonJohn LennonJohn LennonJohn LennonJohn LennonJohn LennonJohn LennonJohn Lennon
Green DayGreen DayGreen Dayeral for a Frienderal for a Frienderal for a Frienderal for a Frienderal for a Frienderal for a Frienderal for a Frienderal for a Frienderal for a Friend
blink
Green DayRise Against
Green DayGreen DayRise Against
Green DayGreen Dayeral for a Frienderal for a Friend
Green DayGreen DayGreen DayGreen Dayeral for a Frienderal for a Friend
Green DayGreen DayGreen DayGreen Dayeral for a Frienderal for a Frienderal for a Frienderal for a Friend
blink-182blink-182blink-182eral for a Frienderal for a Frienderal for a Frienderal for a Frienderal for a Frienderal for a Friend
blink-182blink-182eral for a Frienderal for a Frienderal for a Frienderal for a Frienderal for a Frienderal for a Friend
blink-182blink-182blinkblinkblinkblink-182blink-182blink-182
Red Hot Chili PeppersRed Hot Chili PeppersRed Hot Chili PeppersRed Hot Chili PeppersRed Hot Chili PeppersRed Hot Chili PeppersRed Hot Chili PeppersRed Hot Chili PeppersRed Hot Chili PeppersPanteraPanteraPanteraPanteraPanteraPanteraPanteraPanteraPanteraPanteraPanteraPanteraPanteraPantera
Red Hot Chili PeppersRed Hot Chili PeppersRed Hot Chili PeppersRed Hot Chili PeppersRed Hot Chili PeppersRed Hot Chili PeppersRed Hot Chili Peppers
DeftonesDeftonesLamb of GodLamb of GodLamb of GodLamb of GodLamb of GodLamb of GodLamb of GodLamb of GodLamb of God of GodDeftonesDeftonesDeftonesDeftonesDeftonesDeftonesDeftonesDeftonesDeftonesDeftonesDeftonesDeftonesDeftones
MetallicMetallicMetallic
Lamb of GodLamb of GodSlipknotLambSlipknotSlipknotSlipknotSlipknotSlipknotLambLambLambLamb
Pearl JamOzzy OsbourneOzzy OsbourneOzzy OsbournePearl JamPearl JamA Perfect CircleA Perfect CircleA Perfect CircleA Perfect CircleOzzy OsbourneOzzy OsbourneOzzy OsbourneOzzy OsbourneOzzy OsbourneOzzy OsbournePearl JamPearl JamPearl JamPearl Jam
blinkblinkblinkblinkblinkblinkblinkAngels & AirwavesAngels & AirwavesAngels & AirwavesAngels & AirwavesAngels & AirwavesAngels & AirwavesblinkblinkblinkAngels & AirwavesAngels & AirwavesAngels & AirwavesAngels & AirwavesAngels & AirwavesAngels & Airwavesblinkblinkblinkblinkeral for a Frienderal for a FriendFuneral for a Frienderal for a FriendFuneral for a Frienderal for a Frienderal for a Frienderal for a Frienderal for a Frienderal for a Frienderal for a Frienderal for a Friend
blinkblinkblinkblinkblinkblink-182blink-182blink-182blink-182blink-182blink-182blinkblinkblinkblinkblink-182blink-182blinkblinkblink-182blink-182blink-182blink-182blink-182blink-182blink-182blink-182blink-182blink-182blink-182blink-182blink-182blink-182blink-182blinkblinkblinkblinkblink-182blink-182blink-182blink-182blink-182blink-182blink-182blink-182blinkblinkblinkblinkblink-182blink-182blink-182blink-182blink-182SilversteinSilversteinSilversteinblink-182blink-182SilversteinSilversteinSilversteinSilversteinSilversteinSilversteinSilversteinSilversteinSilversteinSilversteinAngels & AirwavesAngels & AirwavesAngels & Airwavesblink-182blink-182blink-182blink-182Angels & AirwavesAngels & AirwavesAngels & AirwavesAngels & AirwavesAngels & AirwavesAngels & AirwavesAngels & AirwavesAngels & AirwavesAngels & AirwavesAngels & AirwavesAngels & AirwavesAngels & AirwavesAngels & AirwavesAngels & AirwavesAngels & AirwavesAngels & Airwavesblink-182blink-182blink-182blink-182blink-182blink-182blink-182blink-182blinkblinkblink-182blink-182blinkblinkblinkblinkblinkblinkblinkblinkblinkblinkblinkblinkblinkblinkblinkblinkAngels & AirwavesAngels & AirwavesAngels & AirwavesAngels & AirwavesAngels & AirwavesblinkblinkblinkblinkblinkblinkblinkblinkAngels & AirwavesAngels & AirwavesAngels & AirwavesAngels & AirwavesblinkblinkblinkblinkblinkblinkblinkblinkblinkblinkblinkblinkblinkblinkAngels & AirwavesAngels & AirwavesAngels & AirwavesAngels & AirwavesAngels & AirwavesAngels & Airwavesblinkblinkblinkblinkblinkblinkblink-182blink-182blink-182blink-182blink-182blink-182blink-182blink-182blink-182blink-182blink-182blink-182blink-182blink-182blink-182blink-182blink-182blink-182blink-182blink-182blink-182blink-182blink-182blink-182blink-182blink-182blinkblinkblinkblinkblinkblinkblinkblink-182blink-182blink-182blink-182blink-182blink-182blink-182blink-182blinkblinkblinkblinkblinkblinkblinkblinkblink-182blink-182blink-182blink-182eral for a Frienderal for a Frienderal for a Frienderal for a Frienderal for a Frienderal for a Frienderal for a Frienderal for a Frienderal for a FriendRise AgainstRise Againsteral for a Frienderal for a Frienderal for a Frienderal for a Frienderal for a Frienderal for a Friend
Sum 41Sum 41Sum 41Sum 41eral for a Frienderal for a Friend
Sum 41eral for a Frienderal for a FriendRise AgainstRise Againsteral for a Frienderal for a Frienderal for a Friend
Black Label SocietyBlack Label SocietyBlack Label SocietyMisfitsMisMisfits
MastodonMastodonMas
DeftonesDeftones
PanteraPanteraPanteraPanteraPantera
DeftonesDeftonesDeftonesDeftonesDeftonesDeftonesDeftonesDeftonesDeftonesDeftonesDeftonesDeftonesDeftonesDeftonesDeftonesSepulturaSepulturaSepulturaSepulturaSepulturaSepulturaSepulturaSepulturaSepulturaSepultura
DeftonesDeftonesDeftonesDeftonesDeftonesDeftonesDeftonesSepulturaSepulturaSepulturaSepulturaSepulturaSepultura
DeftonesDeftonesDeftonesDeftonesDeftonesDeftonesDeftones
Rise Againsteral for a Frienderal for a Frienderal for a Frienderal for a Friend-182-182-182blink-182-182blink-182blink-182
eral for a Frienderal for a Friendblink-182blink-182blink-182blink-182blink-182blink-182blink-182blink-182blink-182blink-182blink-182blink-182Silversteinblink-182blink-182blink-182blink-182blink-182blink-182blink-182blink-182
eral for a Frienderal for a Frienderal for a Frienderal for a FriendAvenged SevenfoldAvenged SevenfoldAvenged SevenfoldAvenged SevenfoldAvenged SevenfoldAvenged SevenfoldAvenged SevenfoldAvenged SevenfoldAvenged SevenfoldAvenged SevenfoldAvenged SevenfoldAvenged SevenfoldAvenged SevenfoldAvenged SevenfoldAvenged SevenfoldAvenged SevenfoldAvenged SevenfoldAvenged SevenfoldAvenged SevenfoldAvenged Sevenfold-182-182-182-182Avenged SevenfoldAvenged SevenfoldAvenged SevenfoldAvenged SevenfoldAvenged SevenfoldAvenged SevenfoldAvenged SevenfoldAvenged SevenfoldAvenged SevenfoldAvenged SevenfoldAvenged SevenfoldAvenged Sevenfold-182-182Avenged SevenfoldAvenged SevenfoldAvenged SevenfoldAvenged Sevenfold-182-182-182-182
Rise AgainstRise AgainstRise AgainstRise AgainstRise AgainstRise AgainstRise AgainstRise AgainstRise AgainstRise Against-182-182
eral for a Frienderal for a Frienderal for a Frienderal for a Frienderal for a Frienderal for a Frienderal for a Frienderal for a Frienderal for a Frienderal for a Frienderal for a Frienderal for a Frienderal for a Frienderal for a Frienderal for a Frienderal for a Frienderal for a Frienderal for a Frienderal for a Friend-182-182
eral for a Frienderal for a Frienderal for a Frienderal for a Friend
NX ZeroNX ZeroNX Ze
Pink FloydPink Floyd
Classic Rock
Depeche ModeAlternative Rock
hard rock, etc.
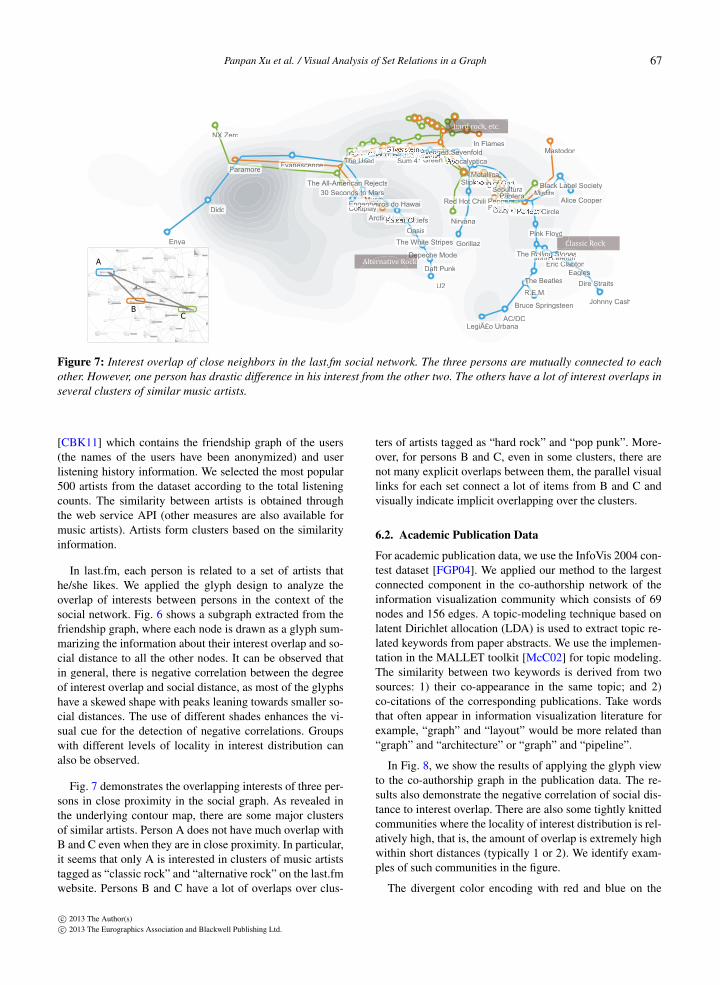
Figure 7: Interest overlap of close neighbors in the last.fm social network. The three persons are mutually connected to eachother. However, one person has drastic difference in his interest from the other two. The others have a lot of interest overlaps inseveral clusters of similar music artists.
[CBK11] which contains the friendship graph of the users(the names of the users have been anonymized) and userlistening history information. We selected the most popular500 artists from the dataset according to the total listeningcounts. The similarity between artists is obtained throughthe web service API (other measures are also available formusic artists). Artists form clusters based on the similarityinformation.
In last.fm, each person is related to a set of artists thathe/she likes. We applied the glyph design to analyze theoverlap of interests between persons in the context of thesocial network. Fig. 6 shows a subgraph extracted from thefriendship graph, where each node is drawn as a glyph sum-marizing the information about their interest overlap and so-cial distance to all the other nodes. It can be observed thatin general, there is negative correlation between the degreeof interest overlap and social distance, as most of the glyphshave a skewed shape with peaks leaning towards smaller so-cial distances. The use of different shades enhances the vi-sual cue for the detection of negative correlations. Groupswith different levels of locality in interest distribution canalso be observed.
Fig. 7 demonstrates the overlapping interests of three per-sons in close proximity in the social graph. As revealed inthe underlying contour map, there are some major clustersof similar artists. Person A does not have much overlap withB and C even when they are in close proximity. In particular,it seems that only A is interested in clusters of music artiststagged as “classic rock” and “alternative rock” on the last.fmwebsite. Persons B and C have a lot of overlaps over clus-
ters of artists tagged as “hard rock” and “pop punk”. More-over, for persons B and C, even in some clusters, there arenot many explicit overlaps between them, the parallel visuallinks for each set connect a lot of items from B and C andvisually indicate implicit overlapping over the clusters.
6.2. Academic Publication Data
For academic publication data, we use the InfoVis 2004 con-test dataset [FGP04]. We applied our method to the largestconnected component in the co-authorship network of theinformation visualization community which consists of 69nodes and 156 edges. A topic-modeling technique based onlatent Dirichlet allocation (LDA) is used to extract topic re-lated keywords from paper abstracts. We use the implemen-tation in the MALLET toolkit [McC02] for topic modeling.The similarity between two keywords is derived from twosources: 1) their co-appearance in the same topic; and 2)co-citations of the corresponding publications. Take wordsthat often appear in information visualization literature forexample, “graph” and “layout” would be more related than“graph” and “architecture” or “graph” and “pipeline”.
In Fig. 8, we show the results of applying the glyph viewto the co-authorship graph in the publication data. The re-sults also demonstrate the negative correlation of social dis-tance to interest overlap. There are also some tightly knittedcommunities where the locality of interest distribution is rel-atively high, that is, the amount of overlap is extremely highwithin short distances (typically 1 or 2). We identify exam-ples of such communities in the figure.
The divergent color encoding with red and blue on the
c⃝ 2013 The Author(s)c⃝ 2013 The Eurographics Association and Blackwell Publishing Ltd.
67

Panpan Xu et al. / Visual Analysis of Set Relations in a Graph
Rich Gossweiler GossweilerRich Gossweiler GossweilerRich Gossweiler
Robert DeLine
Mark J. StefikMark J. Stefik
Jean-Daniel Fekete
Ron R. HightowerRon R. HightowerRon R. Hightower
Peter PirolliPeter PirolliPeter Pirolli
Martin WattenbergMartin WattenbergMartin Wattenberg
Dave Wroblewski
Tim McCandless
Bay-Wei Chang
Lance Good
John LampingJohn LampingJohn Lamping
James Landay
Takeo Igarashi
Jesse Grosjean
Varun SainiVarun Saini
James D. HollanJames D. Hollan
James PitkowJames PitkowJames PitkowJames PitkowJames Pitkow
David TuroDavid Turo
Danyel Fisher
George C. Robertson
George G. RobertsonGeorge G. RobertsonGeorge G. RobertsonGeorge G. Robertson
Ehud RivlinEhud RivlinEhud RivlinEhud Rivlin
Ka-Ping YeeKa-Ping Yee
Sandeep Prabhakar
David CarrDavid CarrDavid CarrDavid Carr
Rodrigo A. BotafogoRodrigo A. Botafogo
Ed H. ChiEd H. Chi
Jock MackinlayJock Mackinlay
Jock D. MackinlayJock D. MackinlayJock D. MackinlayJock D. MackinlayJock D. Mackinlay
Xiaolong Zhang
William C. Hillm C. HillWilliam C. Hill
Per-Kristian HalvorsenPer-Kristian HalvorsenPer-Kristian Halvorsen
Laura T. RingLaura T. RingLaura T. RingLaura T. Ring
Stuart K. CardStuart K. CardStuart K. CardStuart K. CardStuart K. Card
Allan KuchinskyAllan Kuchinsky
Nathan Conklin
Vinit Jain
Egemen Tanin
Richard Beigel
Mark LinMark LinMark LinMark Lin
Chris NorthChris North
Chris Olston
Christopher Williamson
Angela Boltman
Ramana RaoRamana RaoRamana Rao
Susanne Jul
Michelle Q. Wang Baldonado
Catherine Plaisant
Alexander AikenAlexander AikenAlexander AikenAlexander AikenAlexander AikenAlexander AikenAlexander Aiken
George W. FurnasGeorge W. FurnasGeorge W. Furnas
Ben ShneidermanBen ShneidermanBen ShneidermanBen Shneiderman
Marti A. HearstMarti A. HearstMarti A. HearstMarti A. HearstMarti A. HearstMarti A. HearstMarti A. HearstMarti A. HearstMarti A. Hearst
Marti Hearst
Mybrid SpaldingMybrid SpaldingMybrid SpaldingMybrid SpaldingMybrid SpaldingMybrid SpaldingMybrid SpaldingMybrid SpaldingMybrid SpaldingMybrid SpaldingMybrid SpaldingMybrid SpaldingMybrid SpaldingMybrid Spalding
Benjamin B. BedersonBenjamin B. BedersonBenjamin B. BedersonBenjamin B. BedersonBenjamin B. Bederson
Vuk ErcegovacVuk ErcegovacVuk ErcegovacVuk ErcegovacVuk ErcegovacVuk ErcegovacVuk ErcegovacVuk ErcegovacVuk Ercegovac
Larry MasinterLarry MasinterLarry MasinterLarry MasinterLarry MasinterLarry MasinterLarry MasinterLarry MasinterLarry MasinterLarry MasinterLarry MasinterLarry Masinter
Daniel M. Russell
Khoa DoanKhoa Doan
Brian Johnson
Rachna DhamijaRachna Dhamija
Jonathan I. Helfman
Polle T. ZellwegerPolle T. ZellwegerPolle T. ZellwegerPolle T. ZellwegerPolle T. Zellweger
Allison WoodruffAllison Woodruff
Jon MeyerJon MeyerJon Meyer
Michael StonebrakerMichael Stonebraker
Michael ChuMichael Chu
Jan O. PedersenJan O. Pedersen
Benjamin B. Bederson
Mark Lin
Alexander AikenAlexander AikenAlexander AikenAlexander Aiken
Mybrid SpaldingMybrid SpaldingMybrid SpaldingMybrid SpaldingMybrid SpaldingMybrid SpaldingMybrid SpaldingMybrid SpaldingMybrid Spalding
Vuk ErcegovacVuk ErcegovacVuk ErcegovacVuk ErcegovacVuk ErcegovacVuk Ercegovac
Michael Chu
Figure 8: Interest overlap on the academic collaborationnetwork. Two observations are: 1) there are strongly con-nected communities with a higher level of locality of keyworddistribution and 2) there are some outlier nodes having manykeyword overlaps even with distant nodes.
nodes assists the detection of potential subset/superset re-lations. The keywords of the nodes in the tight-knit com-munity in Fig. 8, are likely to be covered by many of theirnearby nodes, as they are blue-colored (thus their interest issmaller than many of the neighborhoods) and more shadedat smaller distances (thus the degree of overlap is high in theneighborhood). The pattern is more evident in the academiccollaboration networks in comparison with the last.fm socialnetwork (Fig. 6).
Fig. 9(a) shows the set of keywords for three authors onthe contour map. The three authors are Peter Pirolli, GeorgeW. Furnas and Marti Hearst. From the figure, we can see thatthere are keywords in same clusters that belongs uniquelyto Peter Pirolli, including “retrieve”, “web” in one topiccluster, and “spreadsheet”,“multivariate”, “mining” in theother. Marti Hearst has overlap with Peter Pirolli on the key-words “dynamic”, “tree”, “support”, “interact” while GeorgeW. Furnas has overlap with Peter Pirolli on the keywords“graphic”, “interface”, “design”. The three persons are atdifferent locations in the social network, with Marti Hearsthaving direct collaboration links to Peter Pirolli and GeorgeW. Furnas being farther away from both. Our method ap-plies MDS to assign each item a position in the plane. Asthere are different MDS algorithms and different parametersmight lead to different layouts, to test the stability of ourmethod with regard to different MDS layouts, we adjust theparameters used in our MDS method and generate anotherresult (see Fig. 9(b)). From the figure, we can clearly seethat the visualizations from our method are stable.
6.3. Discussions
Our methods have some drawbacks. Our method can wellreveal the relationship of a small number of sets in a graph.When there are more sets, the chance of the lines crossingeach other even when there is no set intersection is likelyto increase and the relations among these sets might be toocomplicated for users to understand. It is possible to developa more intelligent layout algorithm which makes better as-signment of the lanes to the sets to minimize the crossingsand further reduce visual clutter. A more plausible way isto adopt the visualization mantra, "overview first, zoom andfilter, and then details on demand", in our system. An aggre-gation view of all the relationships is displayed first. Userscan then zoom into a subset and identify a few interestingnodes, and our method can be applied to reveal the set rela-tionships of the selected nodes. After that, users can zoomout again and select another subset of the nodes and repeatthe whole process. With this iterative exploration approach,the relations among multiple nodes can be revealed. Anotherdrawback of our method is that adding glyphs to node-linkdiagrams could cause visual clutter, especially when the so-cial network is very dense. We believe rich user interactionsand intelligent layout algorithms can alleviate this problem.For the visual link layout algorithm, one limitation of thecurrent method is that since the items belonging to differ-ent sets are juxtaposed on the segments, the resulting visuallinks would contain a lot of zig-zags. This problem can bepartially resolved by changing the order of the items on thesegments.
7. Conclusions and Future Work
In this paper, we proposed two visual designs for the visualanalysis of set relations in a graph. The visual designs can beapplied to analyze the set relation in the context of the socialgraph and the set relations in the context of item clusters.We applied our designs to two real datasets and discussedthe findings. In the future, we intend to apply our designs toother kinds of datasets and also conduct more studies to eval-uate their effectiveness. For the layout algorithm, various im-provements could be made. For example, the branches of thespanning tree could be folded to further reduce visual clut-ter. When there are more sets, an algorithm different fromour current approach for assigning and drawing the visuallinks on different lanes could be considered.
Acknowledgements We would like to thank Shauna Dal-ton for proofreading and the anonymous reviewers for theirvaluable and constructive comments. Hong Zhou is sup-ported by Foundation for Distinguished Young Talents inHigher Education of Guangdong, China (No. LYM11113)and NSF of China Project (No. 61103055). Huamin Qu issupported by a grant from MSRA. Fan Du contributed tothis paper during his visit to the Hong Kong University ofScience and Technology.
c⃝ 2013 The Author(s)c⃝ 2013 The Eurographics Association and Blackwell Publishing Ltd.
68

Panpan Xu et al. / Visual Analysis of Set Relations in a Graph
Rich GossweilerRich GossweilerRich GossweilerRich GossweilerRich GossweilerRich GossweilerRich GossweilerRich GossweilerRich Gossweiler
Robert DeLineRobert DeLine
Mark J. StefikMark J. Stefik
Jean-Daniel Fekete
Ron R. HightowerRon R. Hightower
Peter PirolliPeter Pirolli
Martin WattenbergMartin WattenbergMartin Wattenberg
Dave WroblewskiDave Wroblewski
Tim McCandless
Bay-Wei ChangBay-Wei ChangBay-Wei Chang
Lance Good
John LampingJohn LampingJohn LampingJohn LampingJohn Lamping
Takeo Igarashi
Jesse GrosjeanVarun Saini
James D. HollanJames D. HollanJames D. HollanJames D. Hollan
James PitkowJames PitkowJames PitkowJames PitkowJames PitkowJames PitkowJames Pitkow
David Turo
Danyel FisherDanyel Fisher
George C. RobertsonGeorge C. RobertsonGeorge C. RobertsonGeorge C. RobertsonGeorge C. RobertsonGeorge C. RobertsonGeorge C. RobertsonGeorge C. Robertson
George G. RobertsonGeorge G. RobertsonRobert DeLineRobert DeLine
Ehud Rivlin
Ka-Ping Yee
Sandeep Prabhakar
David CarrDavid Carr
Rodrigo A. BotafogoRodrigo A. BotafogoRodrigo A. BotafogoRodrigo A. BotafogoRodrigo A. BotafogoRodrigo A. Botafogo
Ed H. ChiEd H. ChiEd H. ChiEd H. Chi
Jock MackinlayJock MackinlayJock MackinlayJock Mackinlay
Jock D. Mackinlay
Xiaolong Zhang
William C. HillWilliam C. Hill
Per-Kristian HalvorsenPer-Kristian HalvorsenPer-Kristian HalvorsenPer-Kristian HalvorsenPer-Kristian HalvorsenPer-Kristian HalvorsenPer-Kristian HalvorsenPer-Kristian HalvorsenPer-Kristian HalvorsenPer-Kristian HalvorsenPer-Kristian Halvorsen
Laura T. RingLaura T. Ring
Stuart K. CardStuart K. CardStuart K. CardStuart K. Card
Nathan ConklinNathan ConklinNathan Conklin
Vinit JainVinit Jain
Egemen TaninEgemen TaninEgemen Tanin
Richard Beigel
Chris NorthChris NorthChris North
Christopher WilliamsonChristopher Williamson
Angela Boltman
Ramana RaoRamana RaoRamana RaoRamana RaoRamana RaoRamana RaoRamana RaoRamana Rao
Susanne Jul
Catherine PlaisantCatherine Plaisant
George W. FurnasGeorge W. Furnas
Ben ShneidermanBen ShneidermanBen ShneidermanBen ShneidermanBen Shneiderman
Marti A. Hearst
Marti HearstMarti Hearst
Benjamin B. BedersonBenjamin B. BedersonBenjamin B. BedersonBenjamin B. BedersonBenjamin B. BedersonBenjamin B. Bederson
Larry MasinterLarry MasinterLarry MasinterLarry MasinterLarry MasinterLarry MasinterLarry MasinterLarry MasinterGeorge C. RobertsonGeorge C. RobertsonGeorge C. RobertsonGeorge C. RobertsonDaniel M. Russell
Khoa Doan
Brian Johnson
Rachna DhamijaRachna DhamijaRachna DhamijaRachna Dhamija
Jonathan I. HelfmanJonathan I. HelfmanJonathan I. HelfmanJonathan I. HelfmanJonathan I. HelfmanJonathan I. HelfmanJonathan I. HelfmanJonathan I. Helfman
Polle T. ZellwegerPolle T. Zellweger
Jon MeyerJon Meyer
Jan O. PedersenJan O. PedersenJan O. PedersenJan O. PedersenJan O. PedersenJan O. PedersenJan O. PedersenJan O. PedersenJan O. PedersenJan O. PedersenJan O. Pedersen
George W. Furnas
Marti Hearst
Peter Pirolli
Search
animateanimateanimateanimateanimate
zoomzoomzoomzoomzoomzoomzoomzoomzoomzoomzoomzoomzoomzoom
DataData
time
treetreetreetreetreetree
FocusFocusFocusFocus
describedescribedescribedescribedescribedescribedescribedescribedescribedescribedescribedescribe
supportsupportsupportsupportsupportsupportsupportsupportsupportsupport
WideWideWideWide
LayoutLayoutLayoutLayout
OrientedOrientedOrientedOrientedOrientedOrientedOrientedOrientedOrientedDataDataDataDatavisualvisualvisualvisualvisualvisualvisual
discussdiscussdiscussdiscussdiscussdiscussdiscussdiscussdiscussdiscussdiscuss
AccessAccessAccessAccessAccessAccessAccess
EnvironmentEnvironmentEnvironmentEnvironmentEnvironmentEnvironment
dynamicdynamicdynamic
graphicgraphicgraphicgraphicgraphic
dynamicdynamicspacespacespacespacespacespacespacespacespacespace
dynamicdynamic
directdirectdirectdirectdirect
site
spatialspatialspatialspatialspatialspatialspatial
navigatenavigatenavigatenavigatenavigatenavigate
processprocessprocessprocessprocess
analyzeanalyzeanalyzeanalyzeanalyzeanalyzeanalyzeanalyze
DataDatapatternpatternDataDataDataData
supportsupport
discussdiscuss
dynamicdynamicdynamicinteractinteractinteractinteractsupportsupportsupportsupport
interactinteractinteractinteractdynamicdynamicdynamicdynamic
designdesign
applyapplyapplyapplyapplyapplyapplyapplyapplyapply
describe
graphicprovideprovideprovideprovideprovideprovideprovideprovideprovideprovideprovideprovideprovideprovide
OrientedOrientedOriented
AccessAccessAccessAccessAccessAccessAccessAccessAccessAccessToolToolToolToolToolToolToolToolToolToolToolToolToolAccessAccessAccessAccessAccessAccessAccessAccessAccessAccessAccess
browsebrowsebrowsebrowsebrowsebrowse
DecisionDecisionDecisionDecisionDecisionDecisionDecisionDecisionDecisionDecisionDecisionDecisionDecisionDecision
SearchOrientedOrientedOrientedOrientedMetricMetricMetricMetricSearchSearchSearchSearchSearchSearchMetricMetricMetricMetricSearchSearchSearchSearchOrientedOrientedOrientedOriented
selectselectselectselect
SpreadsheetSpreadsheetSpreadsheetSpreadsheet
MultivariateMultivariateMultivariateMultivariateMultivariateMultivariateMultivariateMultivariateMultivariate
InterfaceInterfaceInterfaceInterfaceInterface
nodenodenodenodenodenode
WebWebWebWebWebWeb
NetworkNetwork
AnalysisAnalysisAnalysisAnalysisAnalysisAnalysis
representationrepresentationrepresentationrepresentationrepresentationrepresentationrepresentationrepresentationrepresentationrepresentationrepresentation
makemakemake
collectcollectcollect
scalescalescalescalescale
DatapatternDataDataminingminingminingminingminingminingminingminingminingmining
DataDatapatternData
modelmodelmodelmodelmodel
setsetsetsetsetsetsetsetset
DatabaseDatabaseDatabaseDatabaseDatabaseDatabaseDatabaseDatabaseDatabase
selectselectselectselectmanipulatemanipulatemanipulatemanipulatemanipulatemanipulatemanipulatemanipulateselectselectselectselectselect
ViewViewViewViewViewViewView
DetailDetailDetailDetailDetail
patternpatternpatternpatternpatternpatternminingminingminingminingminingminingmining
patternpatternpatternpatternpatternpatternpatternpatternpatternpatternpatternpatternpatternpatternpatternpatternpatternminingminingmining
patternpatternpatternpatternpatternpattern
graphgraphgraphgraphgraphgraph
orderorderorder
discussdiscussdiscussdiscussdiscussdiscussdiscussdiscussdiscussimplementimplementimplementimplementimplementimplementimplementimplementimplementimplementimplementimplementimplementimplementimplementimplementimplementimplementimplementimplementimplementimplementimplementimplementimplementimplementimplementimplement
discussdiscussdiscussdiscussdiscussdiscussdiscussdiscussdiscussdiscussdiscussdiscussdiscussdiscussdiscussdiscussdiscussdiscussdiscussMultivariateMultivariateMultivariateDocumentDocumentDocumentDocument
sitesiteretrieveretrieveretrieveretrieveretrieveretrieveretrieveretrieve
(a)
Rich GossweilerRich GossweilerRich GossweilerRich GossweilerRich GossweilerRich GossweilerRich Rich GossweilerRich Gossweiler
Robert DeLineRobert
Mark J. StefikJ. Stefik
Jean-Daniel Fekete
Ron R. HightowerRon R. Hightower
Peter PirolliPeter Pirolli
Martin WattenbergMartMartin
Dave WroblewskiDave Wroblewski
Tim McCandless
Bay-Wei ChangBay-Wei Bay-Wei
Lance Good
John LampingJohn LampingJohn LampingJohn John Lamping
Takeo Igarashi
Jesse GrosjeanVarun Saini
James D. HollanD. HollanJames D. HollanJames
James PitkowJames James PitPitkowJames James James
David Turo
Danyel FisherDanyel Fisher
George C. RobertsonC. RobertsonGeorge C. RobertsonGeorge C. RobertsonGeorge George C. RobertsonGeorge C. Robertson
George G. RobertsonGeorge G. RobertsonRobertRobert
Ehud Rivlin
Ka-Ping Yee
Sandeep Prabhakar
David CarrDavid Carr
Rodrigo A. BotafogoRodrigo A. BotafogoRodrigo A. BotafogoRodrigo A. BotafogoA. Botafogo
Ed H. ChiEd H. ChiEd H. ChiEd H. Chi
Jock MackinlayMackinlayJock MackinlayJock Mackinlay
Jock D. Mackinlay
Xiaolong Zhang
William C. HillWilliam C. Hill
HalvorsenHalvorsenHalvorsenHalvorsenHalvorsenHalvorsenPer-Kristian Halvorsenian HalvorsenPer-Kristian HalvorsenHalvorsenHalvorsen
Laura T. RingLaura T. Ring
Stuart K. CardStuart K. CardStuart K. CardStuart K. Card
Nathan ConklinConklinConklin
Vinit JainVinit Jain
Egemen TaninEgemen Egemen Tanin
Richard Beigel
Chris NorthChris NorthChris North
Christopher WilliamsonChrist
Angela Boltman
Ramana RaoRamana RaoRamana RaoRamana RaoRamana RaoRamana Ramana Ramana Rao
Susanne Jul
Catherine Plaisantherine Plaisant
George W. FurnasGeorge
Ben ShneidermanShneidermanShneidermanBen Ben Shneiderman
Marti A. Hearst
Marti Hearsti Hearst
Benjamin B. BedersonBenjamin B. BedersonBenjamin Benjamin Benjamin
Larry MasinterLarry MasintMasinterLarry MasintMasinterLarry MasintMasinterLarry George George George George Daniel M. Russell
Khoa Doan
Brian Johnson
Rachna DhamijaRachna Rachna DhamijaRachna Dhamija
Jonathan I. HelfmanI. Helfmanhan I. Helfmanhan I. HelfmanJonathan Jonathan I. Helfmanhan I. Helfman
Polle T. ZellwegerPolle
Jon MeyerJon
Jan O. PedersenJan O. PedersenO. PedersenO. PedersenO. PedersenJan O. PedersenJan O. PedersenJan O. PedersenJan Jan O. PedersenJan O. Pedersen
George W. Furnas
Marti Hearst
Peter Pirolli
SearchSearchSearchSearchSearchSearch
animateanimateanimate
zoomzoomzoomzoomzoomzoomzoomzoomzoomDataDataDataDataDataDataData
timetime
treetreetreetreetreetree
FocusFocusFocusFocusFocusFocusFocusFocusFocusFocusFocusFocusFocusdescribedescribedescribedescribedescribedescribedescribe
supportsupportsupportsupport
WideWide
LayoutLayoutLayoutLayout
OrientedOrientedOrientedOrientedOrientedOriented
visualvisualvisual
discussdiscussdiscussdiscussdiscuss
AcceAccessAccessAccess
EnvironmentEnvironmentEnvironmentEnvironmentEnvironmentEnvironmentEnvironmentEnvironmentEnvironmentEnvironmentEnvironmentEnvironment
dynamicdynamicdynamic
graphic
dynamicdynamic
directdirect
sitesitesitesitesite
spatialspatialspatialspatial
WideWidenavigatenavigatenavigatenavigatenavigatenavigatenavigatenavigatenavigate
WideWideWide
processprocessprocessprocessprocessprocessprocess
analyzeanalyzeanalyzeanalyzeanalyze
patternpatternpatternpatternpatternpattern
discussdiscuss dynamicdynamicinteractinteractinteractinteractinteractinteractdiscussdiscussdiscussdiscussinteractinteractinteractdynamicdynamicdynamicdynamicdynamicdynamic
designdesigndesign
applyapplyapplyapplyapply
graphicgraphicprovideprovideprovideprovideprovideprovideprovideprovideprovideprovideprovideprovidegraphicgraphicgraphicgraphic
ToolToolToolTool
browsebrowsebrowsebrowsebrowsebrowsebrowse
DecisionDecisionDecisionDecisionDecision
MetricMetricMetricMetricMetric
dynamicdynamicdynamicdynamicdynamicdynamicdynamicselectselectselectdynamicdynamicdynamicdynamicdynamicdynamicdynamicdynamicdynamicdynamicdynamic
SpreadsheetSpreadsheetSpreadsheetSpreadsheetMultivariateMultivariateMultivariateMultivariate
graphicgraphic
designdesignInterfaceInterfaceInterfaceInterfaceInterface
nodenode
processprocessprocessprocessWebWebWebWebWebWeb
processprocessprocessprocessprocessprocessprocessprocess
NetworkNetworkNetworkNetworkNetwork
AnalysisAnalysisAnalysisAnalysisAnalysisAnalysisAnalysisAnalysis
representationrepresentationrepresentationrepresentationrepresentationrepresentationrepresentationrepresentationrepresentationrepresentationrepresentation
makemakemakemakemake
collectcollectcollectcollectcollectcollectcollectcollect
Datascalescalescalesca
miningminingminingminingmining
modelmodelmodelmodelmodel
setsetset
EnvironmentEnvironmentEnvironmentEnvironmentDatabaseDatabaseDatabaseDatabaseDatabaseDatabaseDatabaseDatabaseDatabaseEnvironmentEnvironmentEnvironmentEnvironment
dynamicdynamicspacedynamicdynamicdynamicdynamicselectselectdynamicdynamicdynamicdynamicspacespacedynamicdynamicdynamicdynamicdynamicdynamicdynamicdynamic setsetsetmanipulatemanipulatemanipulatemanipulatemanipulatespacespacespacespacespaceselectselectselectselectspacespacespacespacespacespacespacespacespacespacespacespacespacespacemanipulatemanipulatemanipulatemanipulatesetsetsetsetsetsetset
ViewViewViewViewViewViewDetailDetailDetailDetailDetailDetailDetailDetail
patternpatternLogLogLogLogLogpatternpattern
graphgraphgraphgraphgraphgraphgraphgraphgraph
orderorderorderorderorderorder
supportsupportsupportdynamicinteractinteractinteractinteractinteractdynamicdynamic
implementimplementimplementimplementimplementimplementimplementimplementsupportsupportsupportsupportimplementimplementimplementimplement
visualvisualscaDocumentDocumentDocumentDocumentDocumentDocumentDocumentDocumentDocumentDocumentDocumentDocument
retrieveretrieve
(b)
Figure 9: Interest overlap of three authors in an academic collaboration network. Three authors (i.e., Peter Pirolli, George W.Furnas and Marti Hearst) are selected from the social network. They are at different social distances from each other. (a) and(b) show the results with two different MDS layouts respectively.
c⃝ 2013 The Author(s)c⃝ 2013 The Eurographics Association and Blackwell Publishing Ltd.
69

Panpan Xu et al. / Visual Analysis of Set Relations in a Graph
References
[ARRC11] ALPER B., RICHE N. H., RAMOS G., CZERWINSKIM.: Design study of LineSets, a novel set visualization tech-nique. IEEE Transactions on Visualization and Computer Graph-ics 17, 12 (Dec. 2011), 2259–67. 2, 4
[BCD∗10] BEZERIANOS A., CHEVALIER F., DRAGICEVIC P.,ELMQVIST N., FEKETE J.-D.: Graphdice: A system for explor-ing multivariate social networks. Computer Graphic Forum 29,3 (2010), 863–872. 2
[BCPS11] BRANDES U., CORNELSEN S., PAMPEL B., SAL-LABERRY A.: Blocks of hypergraphs. In Combinatorial Al-gorithms, Iliopoulos C., Smyth W., (Eds.), vol. 6460 of LectureNotes in Computer Science. Springer Berlin Heidelberg, 2011,pp. 201–211. 2
[BCPS12] BRANDES U., CORNELSEN S., PAMPEL B., SAL-LABERRY A.: Path-based supports for hypergraphs. Journal ofDiscrete Algorithms 14 (2012), 248–261. 2
[BE01] BERTAULT F., EADES P.: Drawing hypergraphs in thesubset standard (short demo paper). In Graph Drawing, Marks J.,(Ed.), vol. 1984 of Lecture Notes in Computer Science. SpringerBerlin Heidelberg, 2001, pp. 164–169. 2
[CBK11] CANTADOR I., BRUSILOVSKY P., KUFLIK T.: 2ndworkshop on information heterogeneity and fusion in recom-mender systems (hetrec 2011). In Proceedings of the 5th ACMconference on Recommender systems (New York, NY, USA,2011), RecSys 2011, ACM, pp. 387–388. 7
[CPC09] COLLINS C., PENN G., CARPENDALE M. S. T.: Bub-ble sets: Revealing set relations with isocontours over existing vi-sualizations. IEEE Transactions on Visualization and ComputerGraphics 15, 6 (2009), 1009–1016. 2, 4
[CSL∗10] CAO N., SUN J., LIN Y.-R., GOTZ D., LIU S., QUH.: Facetatlas: Multifaceted visualization for rich text corpora.IEEE Transactions on Visualization and Computer Graphics 16,6 (nov.-dec. 2010), 1172 –1181. 2, 4
[DRRD12] DÖRK M., RICHE N. H., RAMOS G., DUMAIS S. T.:Pivotpaths: Strolling through faceted information spaces. IEEETransactions on Visualization and Computer Graphics 18, 12(2012), 2709–2718. 2
[DvKSW12] DINKLA K., VAN KREVELD M. J., SPECKMANNB., WESTENBERG M. A.: Kelp diagrams: Point set membershipvisualization. Computer Graphics Forum 31, 3pt1 (2012), 875–884. 2, 4
[FGP04] FEKETE J.-D., GRINSTEIN G., PLAISANT C.:Ieee infovis 2004 contest, the history of infovis. Inwww.cs.umd.edu/hcil/iv04contest (2004). 7
[JP87] JOHNSON D. S., POLLAK H. O.: Hypergraph planarityand the complexity of drawing venn diagrams. Journal of GraphTheory 11, 3 (1987), 309–325. 2
[KKS09] KAUFMANN M., KREVELD M., SPECKMANN B.:Graph drawing. Springer-Verlag, Berlin, Heidelberg, 2009,ch. Subdivision Drawings of Hypergraphs, pp. 396–407. 2
[KMSH12] KAIRAM S., MACLEAN D., SAVVA M., HEER J.:Graphprism: compact visualization of network structure. In AVI(2012), pp. 498–505. 2
[las12] Last.fm, Dec. 2012. 6
[Mäk90] MÄKINEN E.: How to draw a hypergraph. InternationalJournal of Computer Mathematics 34, 3-4 (1990), 177–185. 2
[McC02] MCCALLUM A. K.: Mallet: A machine learning forlanguage toolkit. http://mallet.cs.umass.edu, 2002. 7
[MSLC01] MCPHERSON M., SMITH-LOVIN L., COOK J. M.:Birds of a feather: Homophily in social networks. Annual Reviewof Sociology 27, 1 (2001), 415–444. 1, 3
[PS08] PERER A., SHNEIDERMAN B.: Integrating statistics andvisualization: case studies of gaining clarity during exploratorydata analysis. In Proceedings of the SIGCHI conference on Hu-man Factors in computing systems (2008), ACM, pp. 265–274.2
[RD10] RICHE N., DWYER T.: Untangling euler diagrams. IEEETransactions on Visualization and Computer Graphics 16, 6(Nov. 2010), 1090 –1099. 2
[SA06] SHNEIDERMAN B., ARIS A.: Network visualization bysemantic substrates. IEEE Transactions on Visualization andComputer Graphics 12, 5 (sept.-oct. 2006), 733 –740. 2
[SAA09] SIMONETTO P., AUBER D., ARCHAMBAULT D.: Fullyautomatic visualisation of overlapping sets. Computer GraphicsForum 28, 3 (2009), 967–974. 2
[SRHZ11] STAPLETON G., RODGERS P., HOWSE J., ZHANG L.:Inductively generating euler diagrams. IEEE Transactions on Vi-sualization and Computer Graphics 17, 1 (2011), 88–100. 2
[SWS∗11] STEINBERGER M., WALDNER M., STREIT M., LEXA., SCHMALSTIEG D.: Context-preserving visual links. IEEETransactions on Visualization and Computer Graphics 17, 12(2011), 2249–2258. 4
[vLKS∗11] VON LANDESBERGER T., KUIJPER A., SCHRECKT., KOHLHAMMER J., VAN WIJK J., FEKETE J.-D., FELLNERD.: Visual analysis of large graphs: State-of-the-art and futureresearch challenges. Computer Graphics Forum 30, 6 (2011),1719–1749. 2
[War00] WARE C.: Information Visualization: Perception for De-sign (Interactive Technologies), 1st ed. Morgan Kaufmann, Feb.2000. 4
[Wat06] WATTENBERG M.: Visual exploration of multivariategraphs. In CHI (2006), pp. 811–819. 2
[WFC∗06] WONG P. C., FOOTE H., CHIN G., MACKEY P.,PERRINE K.: Graph signatures for visual analytics. IEEE Trans-actions on Visualization and Computer Graphics 12, 6 (2006),1399–413. 2
[ZBDS12] ZINSMAIER M., BRANDES U., DEUSSEN O., STRO-BELT H.: Interactive level-of-detail rendering of large graphs.IEEE Transaction on Visualization and Computer Graphics 18,12 (2012), 2486–2495. 4
c⃝ 2013 The Author(s)c⃝ 2013 The Eurographics Association and Blackwell Publishing Ltd.
70