vistin pharma third quarter and ytd 2021 results
TRANSCRIPT

1
Vistin Pharma – Third quarter and YTD 2021 results
Kjell-Erik Nordby (CEO)Alexander Karlsen (CFO)
28 October 2021

2
Agenda
Highlights
Operational review
Financial review
Summary
Appendix

3
Third quarter 2021 results
HIGHLIGHTS
▪ MNOK 63 in revenue vs. MNOK 55 in Q3 2020, a 14% increase
- Revenue increase driven by higher sales volume and sales prices, partly offset by a significant stronger NOK vs EUR
- MNOK 201 in revenue YTD 2021 compared to MNOK 189 YTD last year, a 6% growth despite a strong NOK throughout
the year
- Sales volume YTD up by 6% compared to 2020
▪ MNOK 4.6 in EBITDA vs. MNOK 9.5 in Q3 2020, a 52% decrease
- EBITDA unfavourably affected by FX, increased raw material costs following the Covid-19 pandemic, record high
international freight costs (>600%) and significantly higher electricity prices in the quarter compared to last year
- EBITDA of MNOK 36.5 YTD 2021 versus MNOK 44.3 YTD 2020
▪ On track for an all-time high production volume in 2021
- The Fikkjebakke plant has been running at full capacity, except for a 10 days stop due to lack of raw materials
(DCDA)
- Low predictability and significant interruptions in freight lead time from Asia to Europe. Vistin has been pro-
actively building security stocks of key raw materials
▪ Metformin capacity expansion Project (MEP) is progressing according to time and costs
- First commercial batch from the 2nd production line expected in Q2 2022
- Approximately 55% of the investment paid as of end September
▪ Other financials
- Cash balance of MNOK 52 as of 30 September and no interest-bearing debt

4
2019-2021 Strong revenue and EBITDA development
HIGHLIGHTS
406%
*EBITDA
*Only pharmaceuticals
*EBITDA YTD
171
189201
0
50
100
150
200
250
1-3Q 2019 1-3Q 2020 1-3Q 2021
*Revenues YTD
17%
24
44
36
0
5
10
15
20
25
30
35
40
45
50
1-3Q 2019 1-3Q 2020 1-3Q 2021
50%
MNOK
MNOK

5
Agenda
Highlights
Operational review
Financial review
Summary
Appendix

6
Vistin Pharma a dedicated metformin producer with a bright outlook
OPERATIONAL REVIEW - PHARMACEUTICALS
DIABETES
-
ONE OF THE
LARGEST HEALTH
EMERGENCIES IN THE
21ST CENTURY
METFORMIN
-
THE GOLD STANDARD
TREATMENT OF TYPE
2 DIABETES
A BRIGHT OUTLOOK
FOR VISTIN PHARMA
-
A LEADING GLOBAL
PRODUCER OF
PREMIUM METFORMIN
+ =

7
Metformin will remain 1st-line treatment for type 2 diabetes in the
foreseeable future
OPERATIONAL REVIEW - PHARMACEUTICALS
Used to lower glucose (blood sugar) levels
- Reduces the liver’s production of glucose
- Delays and reduces absorption of glucose from the intestine
- Increases insulin sensitivity, leading to increased uptake of glucose in the body
Most cost-efficient treatment with limited side effects and long-term safety profile
Comes in tablet form and can be combined with insulin or other glucose-reducing medicines
- Plain metformin is standard first-line treatment (~75% of volume)
- Extended release formulations are growing and expected to cover ~35% of volume by 2026
Metformin in combination with other APIs are second- and third-line treatments, often as higher
priced patent-protected fixed dose combination products (~25% of volume)
- Metformin + DDP4-inhibitors – increased insulin production
- Metformin + SGLT2-inhibitors – increased excretion of sugar in urine
- Metformin + DDP4 + SGLT2 – launch 2018 (MSD) and 2019/2020 (BI)

8
Diabetes – A global emergency
OPERATIONAL REVIEW - PHARMACEUTICALS
Number of people living with diabetes
Source International Diabetes Federation, IDF Diabetes Atlas, seventh edition, 2019

9
Vistin Pharma is a metformin player with a world wide sales
coverage
OPERATIONAL REVIEW - PHARMACEUTICALS

10
Record high sales volume YTD compared to 2020 (+6%)
OPERATIONAL REVIEW - PHARMACEUTICALS
▪ Sales volume for the third quarter was 861MT, up by
12% vs Q3 2020 (770MT)
▪ YTD sales volume of 2 717 MT compared to 2 558 MT
in 1-3Q of 2020, an increase of 6%
▪ 3% increase in production volume in quarter
compared to similar quarter last year, even with 10 days
production stop due to lack of raw materials (DCDA)
▪ Vistin is taking actions to secure future supply and
delivery performance of raw materials from Asia
930
815873
915
770 802
900956
861
0
200
400
600
800
1000
1200
Q3'19 Q4'19 Q1'20 Q2'20 Q3'20 Q4'20 Q1'21 Q2'21 Q3'21
Quarterly sales volume metformin (HCl & DC)
27842961
3137 32193360
2717
0
500
1000
1500
2000
2500
3000
3500
4000
2016 2017 2018 2019 2020 1-3Q 2021
Annual sales volume metformin (HCl & DC)
905855
904873
829 854922 918
857
0
100
200
300
400
500
600
700
800
900
1000
Q3'19 Q4'19 Q1'20 Q2'20 Q3'20 Q4'20 Q1'21 Q2'21 Q3'21
Production volume metformin in metric tons

11
Corona pandemic status
OPERATION UPDATE
▪ The Fikkjebakke plant has been running at full capacity throughout the Covid-19
pandemic, except for a short stop in Q3 due to delayed supply of raw material
- Actions are taken to secure the supply of critical raw materials and to build security stocks
▪ Lack of available containers in Asia has significantly increased the global freight costs
from China and India (across all international businesses and for all goods). The
international container freight index is currently approx. 600% higher than last year
▪ There are no reported corona infected employees in Vistin Pharma as of today
- The company are strictly following the guideliens from the authorities and have taken active
measures to reduce the risk of virus spread in the factory
▪ The demand in the market for metformin from Vistin is high and is not affected by the
corona epidemic
▪ Vistin is strategically well positioned to benefit from the expected increase in local
supply demands following the pandemic

12
Agenda
Highlights
Operational review
Financial review
Summary
Appendix

13
Key quarterly figures for Vistin PharmaRevenue
FINANCIAL REVIEW
NOK million
▪ MNOK 8 and 14% increase in revenue YoY – driven by
increased sales volume and increased ASP, partly offset
by significantly stronger NOK vs EURO
▪ Record high inbound transportation cost, higher raw
material prices and FX negatively affected gross margin
compared to previous year
▪ Vistin is working closely with its customers to get
price compensation for the increased cost of goods.
68
5761
73
55
64
7167
63
0
10
20
30
40
50
60
70
80
Q3'19 Q4'19 Q1'20 Q2'20 Q3'20 Q4'20 Q1'21 Q2'21 Q3'21
Revenues
60%66% 67% 66% 67%
75%
65% 65%
57%
0%
10%
20%
30%
40%
50%
60%
70%
80%
Q3'19 Q4'19 Q1'20 Q2'20 Q3'20 Q4'20 Q1'21 Q2'21 Q3'21
Gross margin %
Gross margin include outbound transportation costs

14
Key quarterly figures for Vistin PharmaResults (pharmaceuticals)
FINANCIAL REVIEW
NOK million
▪ EBITDA of MNOK 4.6 vs MNOK 9.5 in Q3 2020, a
decrease of 52%
▪ EBITDA negatively affected by significant stronger
NOK versus EURO
▪ Increase in key raw material cost due to general
higher demand and increasing global raw material prices
▪ Record high transportation cost due to lack of
containers in Asia and significantly higher raw material
demands (Global Freight Index approx. +600% compared
to last year)
▪ Energy costs increase of approx. MNOK 1.5 compared
to last year. The prices in the Norwegian energy market
has been significantly higher in 2021 compared to last
year
▪ The cost of water to Kragerø municipality has been
20% higher in 2021 compared to 2020
▪ Depreciation of MNOK 2.4 in the quarter, compared to
MNOK 2.3 in Q3’20
10
4
-1
24
6
12 12 12
2
-5
0
5
10
15
20
25
Q3'19 Q4'19 Q1'20 Q2'20 Q3'20 Q4'20 Q1'21 Q2'21 Q3'21
EBT
12
7
14
21
10
14
16 16
5
0
5
10
15
20
25
Q3'19 Q4'19 Q1'20 Q2'20 Q3'20 Q4'20 Q1'21 Q2'21 Q3'21
EBITDA
15
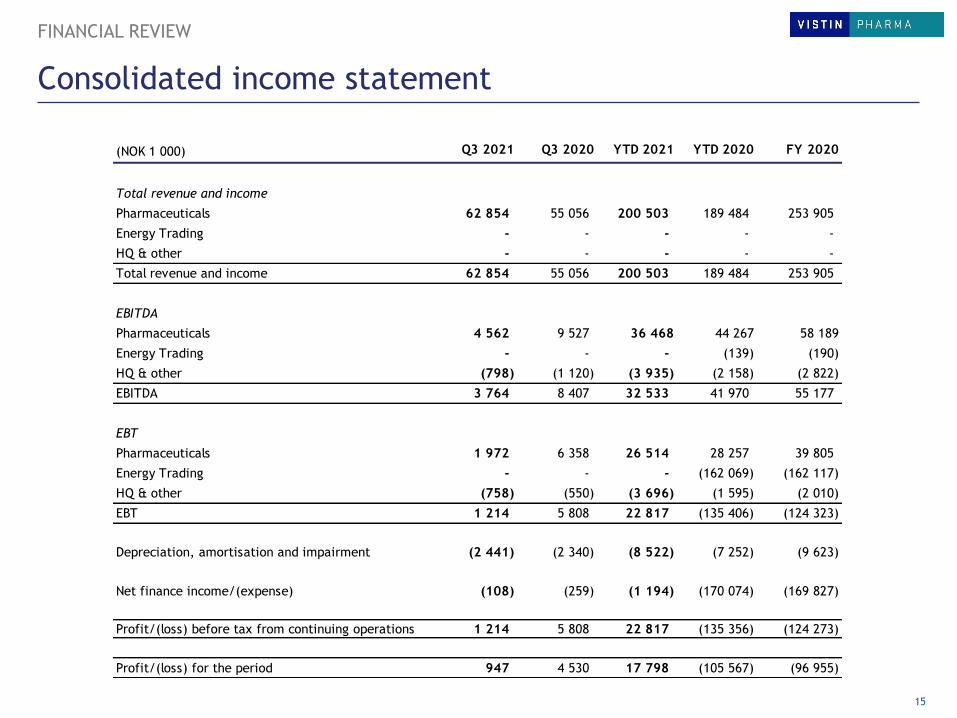
Consolidated income statement
FINANCIAL REVIEW
(NOK 1 000) Q3 2021 Q3 2020 YTD 2021 YTD 2020 FY 2020
Total revenue and income
Pharmaceuticals 62 854 55 056 200 503 189 484 253 905
Energy Trading - - - - -
HQ & other - - - - -
Total revenue and income 62 854 55 056 200 503 189 484 253 905
EBITDA
Pharmaceuticals 4 562 9 527 36 468 44 267 58 189
Energy Trading - - - (139) (190)
HQ & other (798) (1 120) (3 935) (2 158) (2 822)
EBITDA 3 764 8 407 32 533 41 970 55 177
EBT
Pharmaceuticals 1 972 6 358 26 514 28 257 39 805
Energy Trading - - - (162 069) (162 117)
HQ & other (758) (550) (3 696) (1 595) (2 010)
EBT 1 214 5 808 22 817 (135 406) (124 323)
Depreciation, amortisation and impairment (2 441) (2 340) (8 522) (7 252) (9 623)
Net finance income/(expense) (108) (259) (1 194) (170 074) (169 827)
Profit/(loss) before tax from continuing operations 1 214 5 808 22 817 (135 356) (124 273)
Profit/(loss) for the period 947 4 530 17 798 (105 567) (96 955)

16
Balance sheet Vistin PharmAssets
FINANCIAL REVIEW
▪ Increase in fixed asset balance driven by MEP
▪ Deferred tax asset in relation to realized loss for Energy Trading in Q1 2020
▪ Decrease in cash balance mainly driven by dividend pay-out of MNOK 22.3 in June and approx. MNOK 40 in payments
for MEP.
NOK 1000
30.09.2021 30.09.2020 31.12.2020
ASSETS
Non-current assets
Fixed assets 162 607 117 925 145 261
Deferred tax assets 30 080 33 726 35 128
Total non-current assets 192 687 151 651 180 389
Current assets
Inventory 27 184 27 970 31 788
Trade receivables 31 637 30 081 30 400
Other receivables 13 075 8 934 2 302
Cash & cash equivalents 52 072 97 543 77 036
Total current assets 123 968 164 528 141 526
Total Assets 316 656 316 179 321 915
-
50 000
100 000
150 000
200 000
250 000
300 000
350 000
Q3'20 Q4'20 Q1'21 Q2'21 Q3'21
PP&E Other non-current assets
Inventory Receivables
Cash & cash equivalents

17
Balance sheet Vistin PharmEquity and liabilities
FINANCIAL REVIEW
▪ No interest-bearing debt, MNOK 1.8 in obligations related to lease contracts that are recognized in the balance sheet
according to IFRS 16 (MNOK 1.9)
▪ Share premium reduction due to dividend pay-out in June of approx. MNOK 22
▪ Strong balance sheet with 85 % equity ratio
NOK 100030.09.2021 30.09.2020 31.12.2020
EQUITY AND LIABILITIES
Equity
Share capital 44 345 44 345 44 345
Share premium 206 885 229 056 229 056
Retained earnings 16 894 (9 918) (996)
Total equity 268 124 263 484 272 405
Non-current liabilities
Other non-current liablites 1 110 2 277 976
Pension liabilites 16 330 16 309 16 330
Total non-current liabilities 17 440 18 586 17 306
Current liabilities
Trade payables 19 377 21 306 17 893
Other current liabilities 11 714 12 803 14 311
Total current liabilities 31 091 34 109 32 204
Total liabilities 48 531 52 695 49 509
Total Equity and Liabilities 316 655 316 179 321 915
-50 000
-
50 000
100 000
150 000
200 000
250 000
300 000
350 000
Q3'20 Q4'20 Q1'21 Q2'21 Q3'21
Share capital Share premiumRetained earnings Long term liabilitiesOther current liabilities

18
Agenda
Highlights
Operational review
Financial review
Summary
Appendix
19
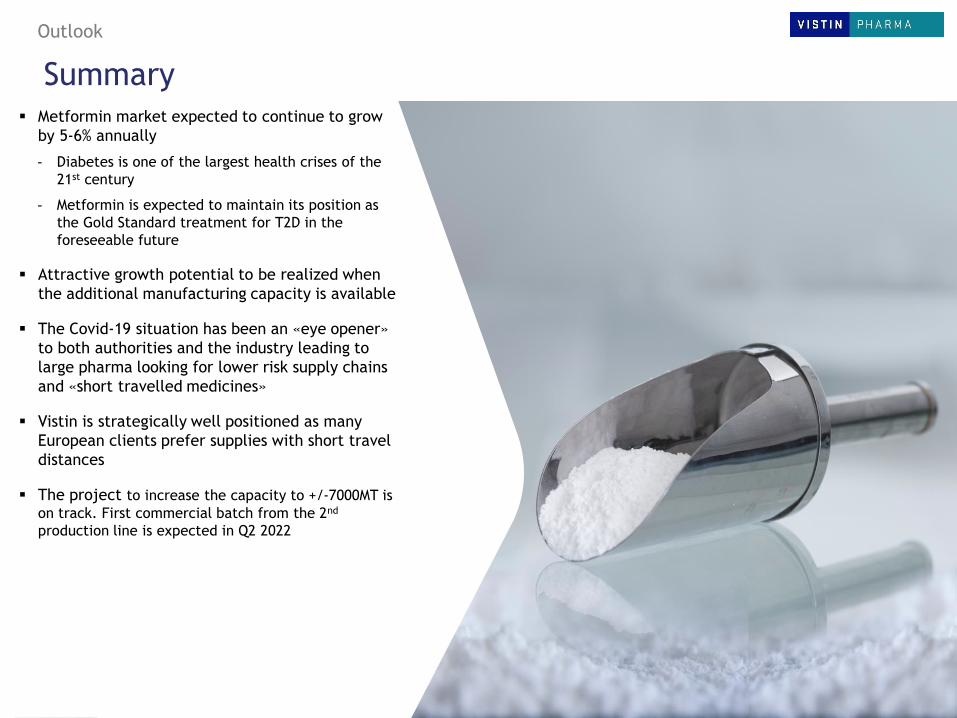
Outlook
▪ Metformin market expected to continue to grow
by 5-6% annually
- Diabetes is one of the largest health crises of the
21st century
- Metformin is expected to maintain its position as
the Gold Standard treatment for T2D in the
foreseeable future
▪ Attractive growth potential to be realized when
the additional manufacturing capacity is available
▪ The Covid-19 situation has been an «eye opener»
to both authorities and the industry leading to
large pharma looking for lower risk supply chains
and «short travelled medicines»
▪ Vistin is strategically well positioned as many
European clients prefer supplies with short travel
distances
▪ The project to increase the capacity to +/-7000MT is
on track. First commercial batch from the 2nd
production line is expected in Q2 2022
Summary

20
Agenda
Highlights
Operational review
Financial review
Summary
Appendix

21
Top 20 shareholders as of 30 September 2021
APPENDIX
NAME SHAREHOLDING % SHARE
INTERTRADE SHIPPING AS* 12 575 000 28,4 %
PACTUM AS* 3 519 733 7,9 %
HOLMEN SPESIALFOND 3 250 000 7,3 %
MP PENSJON PK 1 669 848 3,8 %
FERNCLIFF LISTED DAI AS* 784 280 1,8 %
AUGUST RINGVOLD AGENTUR AS 750 315 1,7 %
STORKLEIVEN AS 721 137 1,6 %
SPAREBANK 1 MARKETS AS 650 000 1,5 %
MIKLA INVEST AS 620 874 1,4 %
IVAR LØGES STIFTELSE 600 000 1,4 %
NORDNET LIVSFORSIKRING AS 591 500 1,3 %
LUCELLUM AS 590 000 1,3 %
TOM RAGNAR PRESTEGÅRD STAAVIE 512 324 1,2 %
WEM INVEST AS 500 000 1,1 %
TIGERSTADEN AS 500 000 1,1 %
SANDEN AS 467 147 1,1 %
CORTEX AS 464 525 1,0 %
HENRIK MIDTTUN HAAVIE 388 085 0,9 %
DELTA AS 370 000 0,8 %
DYVI INVEST AS 355 500 0,8 %
Total 20 largest shareholders 29 880 268 67,4 %
Other shareholders 14 464 324 32,6 %
Total number of shares 44 344 592 100,00 %
*Board members of Vistin Pharma, or companies controlled by Board members