vissim-einleger 2004 e v02 - data.ptvamerica.comdata.ptvamerica.com/docs/vissim_flyer_2005_e.pdf ·...
TRANSCRIPT

VISSIMState-of-the-Art Multi-Modal Simulation
Microscopic Simulation
VISSIM is a microscopic simulation modeland a component of the ptv vision® suite.It is the most powerful tool available forsimulating multi-modal traffic flows,including cars, trucks, buses, heavy rail,trams, LRT, bicyclists and pedestrians. Itsflexible network structure provides theuser with the confidence to know theycan model any type of geometricconfiguration or unique operational/driverbehavior encountered within thetransportation system.
What are typical VISSIM applications?VISSIM is used for a host of traffic andtransit (public transport) simulation needs.Common applications include:
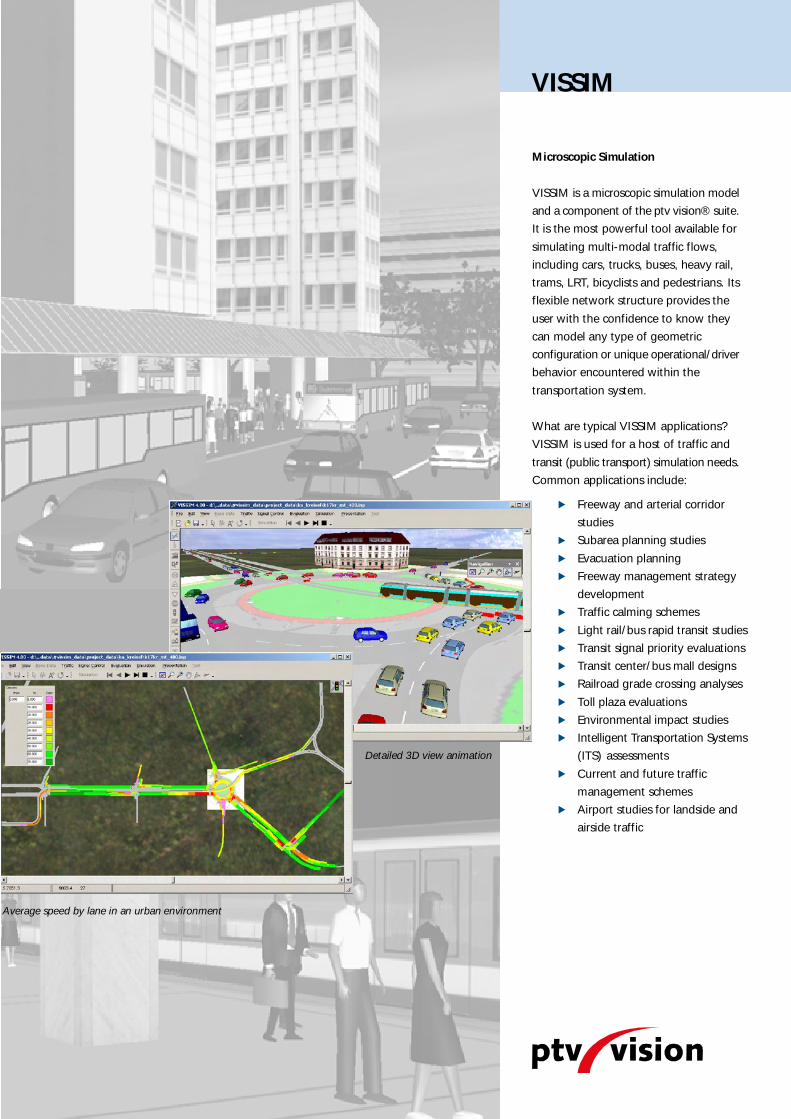
Average speed by lane in an urban environment
Detailed 3D view animation
VISSIM
Freeway and arterial corridor studiesSubarea planning studiesEvacuation planningFreeway management strategy developmentTraffic calming schemesLight rail/bus rapid transit studiesTransit signal priority evaluationsTransit center/bus mall designsRailroad grade crossing analysesToll plaza evaluationsEnvironmental impact studiesIntelligent Transportation Systems(ITS) assessmentsCurrent and future traffic management schemesAirport studies for landside and airside traffic

Complex freeway interchange, Concord, CA
Multi-lane roundabout, Edinburgh, UK
Diagonal parking, New York, NY
Toll plaza, Camden, NJ
VISSIM Features - A Close Up View
What Makes VISSIM Special?
VISSIM is based on decades of intensiveresearch at various academic institutions.Core algorithms are well documented.Open interfaces provide compatibility withexternal software. Its link-connectortopology allows the highest versatilitycombined with vehicle movements in adetailed 1/10s resolution. Being on themarket since 1992 VISSIM is setting thestandard for simulation software; intensiveresearch and a large user communityworldwide guarantee VISSIM to be theleading edge software of its kind.Furthermore, the ptv vision suite has beenthe first of its kind to integrate microscopicsimulation with strategic transportplanning/travel demand modeling.
Network
VISSIM has been used to analyze networksof all sizes ranging from individualintersections to entire metropolitan areas.Within these transportation networks,VISSIM is able to model all roadwayfunctional classifications from freeways(motorways) to driveways. VISSIM’sbreadth of network applications alsoincludes transit, bicycle and pedestrianfacilities. Many common, as well as unique,geometric and operational conditions existthroughout the transportation system thatVISSIM can simulate.Some examples include:
Multi-lane freeways, interchanges, roadway gradesHOV (High Occupancy Vehicles) andHOT (High Occupancy Toll) lanesMerging and weaving areasComplex signalized and unsignalizedintersectionsU-turns, exclusive lanes, mixed flow lanes2-way left turn lanesBike lanesMulti-modal lane sharing and passing(e.g., bikes and autos)
Angle and parallel parkingRoundabouts, continuous flow intersectionsAirport curbside drop-off areasExclusive lanes, mixed-flow lanes, queue jumps, queue-bypass lanesTransit stops, terminalsCenter and side-running LRT alignmentsPedestrian queuingRailroad lines

Traffic Volumes
An unlimited number of vehicle types existin VISSIM allowing the user to model afull range of multi-modal operations.These vehicle types include cars, trucks,vehicles equipped with route guidancesystems, buses, heavy rail and light railvehicles, bicyclists, wheelchairs, pedestriansand even aircraft.
VISSIM also offers the unprecedentedability to assign these vehicles to thenetwork using one or a combination ofthree methods. The basic method assumesthat traffic is stochastically distributed overFixed Routes from user-definable start toend points. For coding intersection turningmovement counts, these start and endpoints cover a single intersection, but theycan also continue through multiple inter-sections (e.g., freeway interchange) oreven the entire study area. DynamicRoutes allow traffic to be dynamicallyassigned to user-specified paths whenspecific events occur. One example ofDynamic Routes is the assignment ofvehicles to a railroad underpass only whenthe railroad grade crossing is occupied onthe more commonly traveled path.
Shortest Path Search in Dallas, TX
Dynamic Traffic Assignment (DTA) allowsVISSIM to assign traffic to the networkusing origin/destination matrices (time-and vehicle class-dependent) and travelcost stochastic assignment techniques.Origin/destination matrices can begenerated using the integrated demandmodel of VISUM with its advanced matrixestimation and calibration functionality.
Bus terminal (route/time dependent bayusage/dwell time distribution),Vancouver,BC
Analysis
When, where and how data is reportedin VISSIM is up to the user. Data can bereported for any time period and intervalwithin that time period. Data can bereported for any point-location in thenetwork, for an intersection, along anypath and/or for the entire network. Datacan be aggregated by mode or by vehicleclass. It can also be reported for an indi-vidual vehicle. Numerous measures ofeffectiveness (MOEs) can be reportedfrom VISSIM. Typical ones include delay,speed, density, travel time, stops andqueues. The decision on which data toreport and when, where and how the datais reported, is based on the needs of theproject. For graphical representation ofsimulation output, VISSIM uses its ptvvision suite’s sister product VISUM.VISUM provides an extensive graphicslibrary for effectively visualizing trans-portation modeling results.
Transit (Public Transport)
VISSIM has long been the software ofchoice for transit related studies includingbus rapid transit, light rail transit and multi-modal transit terminals. Besides being ableto analyze the transit related network andsignal control aspects listed in the previoussections, VISSIM models transit routes,various transit vehicle types, schedules,stops, stop types and dwell times.
The user has three choices for modelingdwell times in VISSIM. The first is a normaldistribution where an average dwell timeand standard deviation are specified. Thesecond is an empirical curve where theuser defines the probability of variousdwell times. The last is a passenger flowmodel that computes the dwell time basedon the number of passengers boardingand alighting at a particular stop.

NEMA controller interface (standard format)
Ramp meteringAdaptive signal controlLRT and bus signal priorityRailroad preemptionEmergency vehicle preemptionDynamic speed controlLane control signalsDynamic lane assignment signalsChangeable message signs
NEMA controller interface (simple format)
The C-like traffic control macro language,VAP, is supplemented with a flow charteditor VisVAP for easy data entry, errorchecking and debugging. In addition, theNEMA GUI used to enter actuated signaltimings in VISSIM also has custom menusto allow users to model bus and LRT priorityand railroad preemption. Some examplesof signal control and related ITS applicationsof VISSIM include:
Traffic Control
VISSIM can model intersections thatcontrol traffic using yield signs, stop signs(all-way, 2-way stop control), signals, andany combination thereof. What setsVISSIM apart from other simulationsoftware packages is its flexibility inmodeling all forms of signal control. Thereare several ways to model signal controlin VISSIM:
Fixed-time / pre-timed signal plansActuated (via a NEMA graphical userinterface)User definable signal control logic through VISSIM’s VAP macro language logicInterfaces to signal controller firmware(virtual controllers) such as Siemens NextPhase and Traffic Language, D4,VS-PLUS and VialisInterfaces to adaptive algorithms suchas Peek’s Spot/Utopia, SCATS and SCOOTRS485 serial communication to external controllersInterfaces to the McCain CID II allowing users to connect signal controllers directly to VISSIM
Transit signal priority and dynamic signal settings
VisVAP flow chart editor to definecomplex actuated control strategies

Graphics
VISSIM features 4D animation. 4D refersto the combination of a 3D network andvehicles combined with the fourth dimen-sion of time. This feature allows users tocreate realistic video clips in AVI format,an excellent tool for communicating aproject’s vision. VISSIM also offers usersbackground mapping capabilities withaerial photographs and CAD drawings.
4D animation of multi-modal transit terminal visualizingsynchronized feeder bus schedule (including transfer walk),
Munich, Germany4D animation of Golden Gate Bridge,San Francisco, CA
Interfaces Increase Efficiency
One of VISSIM’s strengths is its ability tointerface with a number of programs thatare common to the transportationengineering and planning professionincluding:
Signal optimization tools – Synchro™,TEAPAC*Travel demand models - emme/2, TranPlan, etc.Geographic information systems (GIS)and navigation data - ArcGIS* and NAVTEQ
PTV pioneered the integration of simu-lation and travel demand software. Thiseffort has led to the first truly integratedsimulation software, VISSIM, and traveldemand software, VISUM, on the marketas explained in further detail below. Simplyput, the benefit to the transportationcommunity is efficiency.
* Synchro™ is a registered trademark of the Trafficware CorporationTEAPAC is a product of Strong Concepts, ArcGIS is a product of ESRI
VISSIM-SYNCHRO Interface
per vehicle class:Link volumesTravel timesDelay, etc.
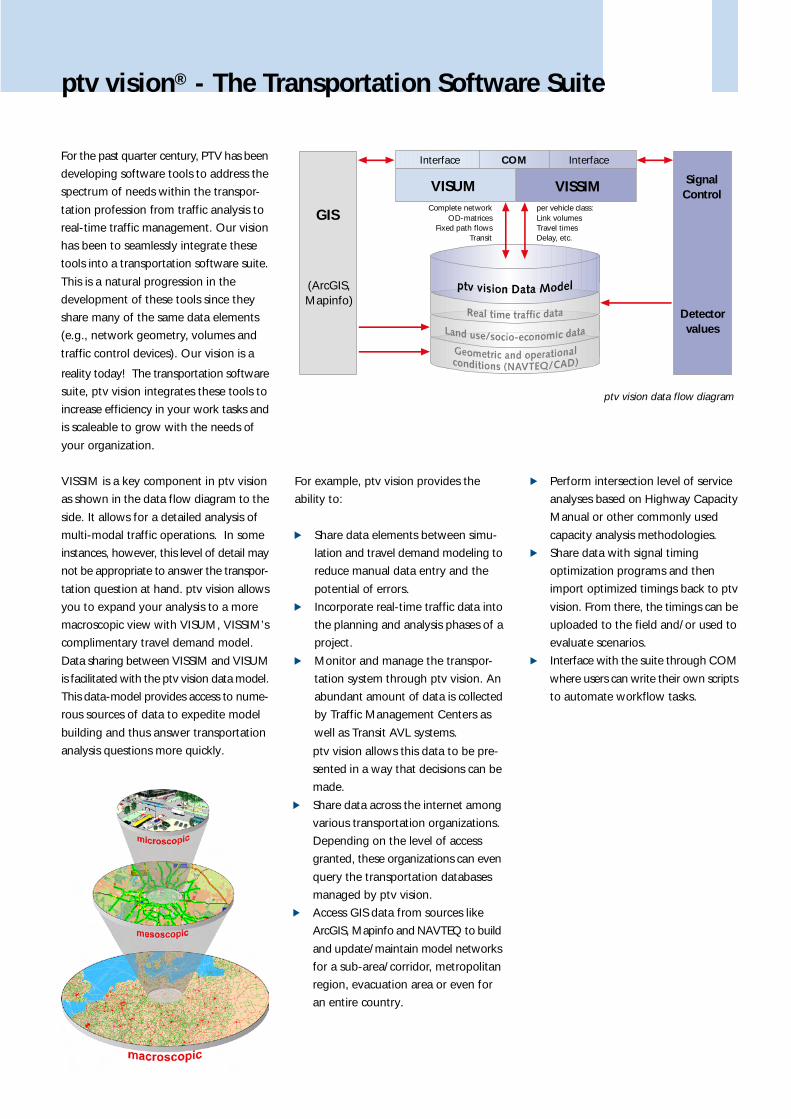
VISUM VISSIMComplete network
OD-matricesFixed path flows
Transit
Interface COM Interface
SignalControl
GIS
Detectorvalues
(ArcGIS,Mapinfo)
ptv vision® - The Transportation Software Suite
For the past quarter century, PTV has beendeveloping software tools to address thespectrum of needs within the transpor-tation profession from traffic analysis toreal-time traffic management. Our visionhas been to seamlessly integrate thesetools into a transportation software suite.This is a natural progression in thedevelopment of these tools since theyshare many of the same data elements(e.g., network geometry, volumes andtraffic control devices). Our vision is a
reality today! The transportation softwaresuite, ptv vision integrates these tools toincrease efficiency in your work tasks andis scaleable to grow with the needs ofyour organization.
VISSIM is a key component in ptv visionas shown in the data flow diagram to theside. It allows for a detailed analysis ofmulti-modal traffic operations. In someinstances, however, this level of detail maynot be appropriate to answer the transpor-tation question at hand. ptv vision allowsyou to expand your analysis to a moremacroscopic view with VISUM, VISSIM’scomplimentary travel demand model.Data sharing between VISSIM and VISUMis facilitated with the ptv vision data model.This data-model provides access to nume-rous sources of data to expedite modelbuilding and thus answer transportationanalysis questions more quickly.
For example, ptv vision provides theability to:
Share data elements between simu-lation and travel demand modeling toreduce manual data entry and the potential of errors.Incorporate real-time traffic data intothe planning and analysis phases of aproject.Monitor and manage the transpor-tation system through ptv vision. Anabundant amount of data is collectedby Traffic Management Centers as well as Transit AVL systems.
ptv vision allows this data to be pre-sented in a way that decisions can bemade.Share data across the internet amongvarious transportation organizations.
Depending on the level of access granted, these organizations can evenquery the transportation databases managed by ptv vision.Access GIS data from sources like ArcGIS, Mapinfo and NAVTEQ to buildand update/maintain model networksfor a sub-area/corridor, metropolitanregion, evacuation area or even for an entire country.
Perform intersection level of service analyses based on Highway CapacityManual or other commonly used capacity analysis methodologies.Share data with signal timing optimization programs and then import optimized timings back to ptvvision. From there, the timings can beuploaded to the field and/or used toevaluate scenarios.Interface with the suite through COMwhere users can write their own scriptsto automate workflow tasks.
ptv vision data flow diagram

Business PartnershipsPTV is partnering with many companiesthat develop software for the transpor-tation markets. These partnerships extendPTV’s products as well as those of ourpartners. It also builds on PTV’s vision ofa transportation analysis suite, ptv vision. The suite concept is designed to efficientlyanswer questions at varying degrees ofdetail by seamlessly sharing data amongcommonly used software packages like
PTV’s Focus on the UsersFore more than 15 years, the ptv visiondevelopment team has been setting newstandards that our clients value and ourcompetitors aspire to. Today, ptv vision ishelping increase the productivity oftransportation professionals and the valuethey provide to their communities in morethan 70 countries. This level of successwill only expand in the future as we
travel demand software, GIS, simulationand signal optimization and analysisprograms.PTV is an ESRI Business Partner. Thispartnership has led to software enhance-ments that share and maintain networkconsistency between ESRI GIS databasesand ptv vision. PTV has formed a partner-ship with NAVTEQ, the world leader inpremium quality digital map data.
continue to focus on the needs of ourclients. We draw on our experience astransportation planners, engineers andsoftware developers to answer any andall questions asked by users. Ourdevelopment team of more than 50transportation professionals draws onseveral resources for ideas to enhance ptvvision. We view our clients as a pivotalresource for ideas. These resources also
include knowledge gained throughconsulting projects; research conductedwithin PTV as well as inside and outsideof our profession; and partnership withother software developers that share ourvalues. Our industry leading productscombined with our desire and motivationto continue setting new standardsguarantees a sound investment for yearsto come.
Application Development PlatformVISSIM 4 offers a COM interface allowingadvanced users and researchers toprogram large applications using VisualBasic, Visual C++ or other applicationsmacro languages (e.g., MS EXCEL). TheCOM interface provides access to thenetwork topology, signal control, pathflows, vehicle behavior and evaluationdata. Typical applications of this powerfulfeature include automation of customizedwork flow processes, modification ofsimulation parameters during run time,and customized display options (e.g., side-by-side simulation of different scenarios).Important is that COM allows full flexi-bility and thus empowers the user touse his or her own creativity to the fullestextent.
Hardware and Operating EnvironmentVISSIM, and the other components of theptv vision suite, operate in a MicrosoftWindows® environment.
Parallel Computing was recently introdu-ced to distribute simulation on multipro-cessor computers or across a Windows®network.For current technical details please visit:www.ptv-vision.com
North and South AmericaPTV America, Inc.1128 NE Second StreetCorvallis OR 97330U.S.A.Tel. +1-541-754-6836Fax +1-541-754-6837E-Mail: [email protected]
Worldwide (except America)PTV AGBusiness field TrafficStumpfstr. 1, 76131 KarlsruheGermanyTel. +49-721-9651-300Fax +49-721-9651-299E-Mail: [email protected]
VISSIM - State-of-the-Art Multi-Modal Simulation