vision-realistic rendering: simulation of the scanned ...barsky/papers/visigrapp.2010...in computer...
TRANSCRIPT
Vision-realistic Rendering: Simulation of the ScannedFoveal Image with Elimination of Artifacts due to
Occlusion and Discretization
Brian A. Barsky
Computer Science Division and School of OptometryUniversity of California, Berkeley, California, 94720-1776, U.S.A.
[email protected]://www.cs.berkeley.edu/∼barsky
Abstract. We introduce the concept ofvision-realistic rendering – the com-puter generation of synthetic images that incorporate the characteristics of a par-ticular individual’s entire optical system. Specifically,this paper develops a methodfor simulating the scanned foveal image from wavefront dataof actual humansubjects, and demonstrates those methods on sample images.First, a subject’s optical system is measured by a Shack-Hartmann wavefrontaberrometry device. This device outputs a measured wavefront which is sampledto calculate an object space point spread function (OSPSF).The OSPSF is thenused to blur input images. This blurring is accomplished by creating a set ofdepth images, convolving them with the OSPSF, and finally compositing to forma vision-realistic rendered image.Although processing in image space allows an increase in speed, the images mayhave artifacts introduced due toocclusion or discretization. Two approaches forobject identification to properly blur the scene are discussed.Applications of vision-realistic rendering in computer graphics as well as in op-tometry and ophthalmology are discussed.keywords vision-realistic rendering, optics, ray tracing, image synthesis, humanvisual system, blur, optometry, ophthalmology, LASIK, pupil, Point Spread Func-tion (PSF),
1 Introduction
After the development of the fundamentals of raster graphics in the 1970’s, advancesin computer graphics in the 1980’s were dominated by the quest for photorealistic ren-dering, and attention turned tonon-photorealistic rendering in the 1990’s. For the firstdecade of the the 21st century, we propose to extend this tovision-realistic rendering(VRR). VRR is the simulation of the actual human vision of a particular subject – notmerely a model of vision, but the generation of images that incorporate characteristicsof a particular individual’s optical system.
Such an ambitious undertaking will require the integrationof many fields of study,beyond the traditional ones for computer graphics, such as physiological optics, humanvisual perception, psychophysics of vision, visual neurophysiology,human color vision,binocular vision, visual sensory mechanisms, etc.

Fig. 1. Vision-realistic rendered image simulating vision based on actual wavefront data from apatient with keratoconus.
To embark upon this endeavor, we begin with the problem of simulating the retinalimage formed by the optics of the eye. Since the goal is to simulate vision of an actualhuman subject, not just to use a model, we need data about the optics of the subject’seye.
Ideally, we would like to have data about the aberrations of these optics for eachphotoreceptor across the retina. That is, given a gaze direction, we would like to trace aray from each photoreceptor, through the optical structures of the eye such as the inter-nal crystalline lens and cornea, out into the environment, and measure the aberrationsfor that ray, including whatever would arise given the current accommodative state ofthe crystalline lens of the eye.
Unfortunately, such capability does not exist at the present time. That deficiencynotwithstanding, it is exciting to note that we can achieve an approximation to suchmeasurements using recently-developed technology motivated by the goal of improv-ing laser corneal photoreactive vision correction surgeries such as LASIK (laser in-situ keratomileusis). This technology iswavefront aberrometry, that is, instruments thatmeasure the wavefront emerging from the eye and quantify theamount of each differentkind of optical aberration present. The limitation is that the instrument does so at onlyone point in the retina.
However, that limitation is not nearly as much of a problem asit may seem at “firstglance”. The reason is that the arrangement of photoreceptors on the retina is not at allthe uniform structure that we are used to in raster graphics where pixels are arrangedin neat, rectangular arrays. Rather, the cones are densely packed in a small area in themiddle of the cornea, called the fovea, and are much more sparsely arranged towards theperiphery. The fovea is approximately 600 microns wide and subtends an angle of viewof about two degrees. When one looks at an object, the eye is oriented such that lightcomes to a focus in this foveal region of the retina. Consequently, if we use wavefront
aberrometry to measure the aberrations present for vision at a point in this foveal region,we will have a reasonable first approximation to the image perceived by the subject.
The reason that this approximation works so well is that whenlooking at a scene, aviewer naturally and involuntarily quickly scans around the scene at different objects. Atany instant, the viewer is focused at only one object, using high resolution foveal vision.However, by scanning around the scene, the viewer gains the misleading impressionthat the entire scene has been viewed in this high resolutionvision. But at any instant,in fact, it is only the object in the center of visual field thatis seen in high resolution.The periphery of the scene is really being viewed in much lower resolution vision, eventhough that is not evident.
Ergo, our approach is to obtain the wavefront aberrometry from a point in the fovea,and then to simulate the vision as if the aberrations were constant across the visual field.
This paper describes a pipeline to simulate the scanned foveal image from wave-front data of actual human subjects, and shows some example images. These are thefirst images in computer graphics that are generated on the basis of the specific opticalcharacteristics of actual individuals.
2 Optometry and Ophthalmology Motivation
In practice poor visual performance is often attributed to simple blur; however, ourtechnique enables the generation of vision-realistic rendered images and animationsthat demonstrate specific defects in how a person sees. Such images of simulated vi-sion could be shown to an individual’s eye care clinician to convey the specific visualanomalies of the patient. Doctors and patients could be educated about particular visiondisorders by viewing images that are generated using the optics of various ophthalmicconditions such askeratoconus (Figure 1) andmonocular diplopia.
One of the most compelling applications is in the context of vision correction usinglaser corneal refractive eye surgeries such as PRK (photorefractive keratectomy) andLASIK (laser in-situ keratomileusis). Currently, in the United States alone, a millionpeople per year choose to undergo this elective surgery. By measuring subjects pre-operatively and post-operatively, our technique could be used to convey to doctors whatthe vision of a patient is like before and after surgery (Figures 20 and 21). In addition,accurate and revealing medical visualizations of predicted visual acuity and of simu-lated vision could be provided by using modeled or adjusted wavefront measurements.Potential candidates for such surgery could view these images to enable them to makemore educated decisions regarding the procedure. Still another application would beto show such candidates some of the possible visual anomalies that could arise fromthe surgery, such as glare at night. With the increasing popularity of these surgeries,perhaps the current procedure which has patients sign a consent form that can be dif-ficult for a layperson to understand fully could be supplemented by the viewing of acomputer-generated animation of simulated vision showingthe possible visual prob-lems that could be engendered by the surgery.

3 Previous and Related Work
For a discussion of camera models and optical systems used incomputer graphics, thereader is referred to a pair of papers by Barsky et al. where the techniques have beenseparated into object space [1] and image space [2] techniques.
The first synthetic images with depth of field were computed byPotmesil andChakravarty [3] who convolved images with depth-based blurfilters. However, theyignored issues relating to occlusion, which Shinya [4] subsequently addressed using aray distribution buffer. Rokita [5] achieved depth of field at rates suitable for virtual re-ality applications by repeated convolution with 3×3 filters and also provided a surveyof depth of field techniques [6]. Although we are also convolving images with blur fil-ters that vary with depth, our filters encode the effects of the entire optical system, notjust depth of field. Furthermore, since our input consists oftwo-dimensional images,we do not have the luxury of a ray distribution buffer. Consequently, we handle the oc-clusion problem by the techniques described in Section 6 andin more detail by Barskyet al. [7] [8].
Stochastic sampling techniques were used to generate images with depth of field aswell as motion blur by Cook et al. [9], Dippe and Wold [10], andLee et al. [11]. Morerecently, Kolb et al. [12] described a more complete camera lens model that addressesboth the geometry and radiometry of image formation. We alsouse stochastic samplingtechniques for the construction of our OSPSF.
Loos et al. [13] used wavefront tracing to solve an optimization problem in theconstruction of progressive lenses. They also generated images of three dimensionalscenes as viewed through a simple model eye both with and without progressive lenses.However, while we render our images with one point of focus, they chose to changethe accommodation of the virtual eye for each pixel to “visualize the effect of the lensover the full field of view” [13]. Furthermore, our work does not rely on a model of thehuman optical system, but instead uses actual patient data in the rendering process.
Light field rendering [14] and lumigraph systems [15] were introduced in 1996.These techniques represent light rays as a pair of interactions of two parallel planes.This representation is a reduction of the plenoptic function, introduced by Adelson andBergen [16]. The algorithms take a series of input images andconstruct the scene as a4D light field. New images are generated by projecting the light field to the image plane.Although realistic object space techniques consume a largeamount of time, Heidrich etal. [17] used light fields to describe an image-based model for realistic lens systems thatcould attain interactive rates by performing a series of hardware accelerated perspectiveprojections. Isaksen et al. [18] modeled depth of field effects using dynamically re-parameterized light fields. We also use an image-based technique, but do not use lightfields in our formulation.
There is a significant and somewhat untapped potential for research that addressesthe role of the human visual system in computer graphics. Oneof the earliest con-tributions, Upstill’s Ph.D. dissertation [19], considered the problem of viewing syn-thetic images on a CRT and derived post-processing techniques for improved display.Spencer et al. [20] investigated image-based techniques ofadding simple ocular andcamera effects such as glare, bloom, and lenticular halo. Bolin and Meyer [21] useda perceptually-based sampling algorithm to monitor imagesas they are being rendered

for artifacts that require a change in rendering technique.[22–26] and others have stud-ied the problem of mapping radiance values to the tiny fixed range supported by displaydevices. They have described a variety of tone reproductionoperators, from entirely adhoc to perceptually based. For a further comparison of tone mapping techniques, thereader is referred to [27]. Meyer and Greenberg [28] presented a color space definedby the fundamental spectral sensitivity functions of the human visual system. Theyused this color space to modify a full color image to represent a color-deficient view ofthe scene. Meyer [29] discusses the first two stages (fundamental spectral sensitivitiesand opponent processing) of the human color vision system from a signal processingpoint of view and shows how to improve the synthesis of realistic images by exploitingthese portions of the visual pathway. Pellacini et al. [30] developed a psychophysically-based light reflection model through experimental studies of surface gloss perception.Much of this work has focused on human visual perception and perceived phenomena;however, our work focuses exclusively on the human optical system and attempts tocreate images like those produced on the retina. Perceptualconsiderations are beyondthe scope of this paper.
In human vision research, most simulations of vision [31, 32] have been done byartist renditions and physical means, not by computer graphics. For example, Fine andRubin [33, 34] simulated a cataract using frosted acetate toreduce image contrast. Withthe advent of instruments to measure corneal topography andcompute accurate cornealreconstruction, several vision science researchers have produced computer-generatedimages simulating what a patient would see. Principally, they modify 2D test imagesusing retinal light distributions generated with ray tracing techniques. Camp et al. [35,36] created a ray tracing algorithm and computer model for evaluation of optical per-formance. Maguire et al. [37, 38] employed these techniquesto analyze post-surgicalcorneas using their optical bench software. Greivenkamp [39] created a sophisticatedmodel which included the Stiles-Crawford effect [40], diffraction, and contrast sensi-tivity. A shortcoming of all these approaches is that they overlook the contribution ofinternal optical elements, such as the crystalline lens of the eye.
Garcia, Barsky, and Klein [41–43] developed theCWhatUC system, which blurs2D images to produce an approximation of how the image would appear to a particularindividual. The system uses a reconstructed corneal shape based on corneal topographymeasurements of the individual. Since the blur filter is computed in 2D image space,depth effects are not modeled.
The latter technique, like all those that rely on ray casting, also suffers from alias-ing problems and from a computation time that increases withscene complexity. Theseproblems are exacerbated by the need to integrate over a finite aperture as well as overthe image plane, driving computation times higher to avoid substantial image noise.Since our algorithms are based in image space, they obviate these issues. That notwith-standing, the source of our input images would still need to address these issues. How-ever, since our input images are in sharp focus, the renderercould save some computa-tion by assuming a pinhole camera and avoiding integration over the aperture.
Vision-Realistic Rendering was introduced to the computergraphics community bythe author in [44] and [45], and is presented in more detail here.
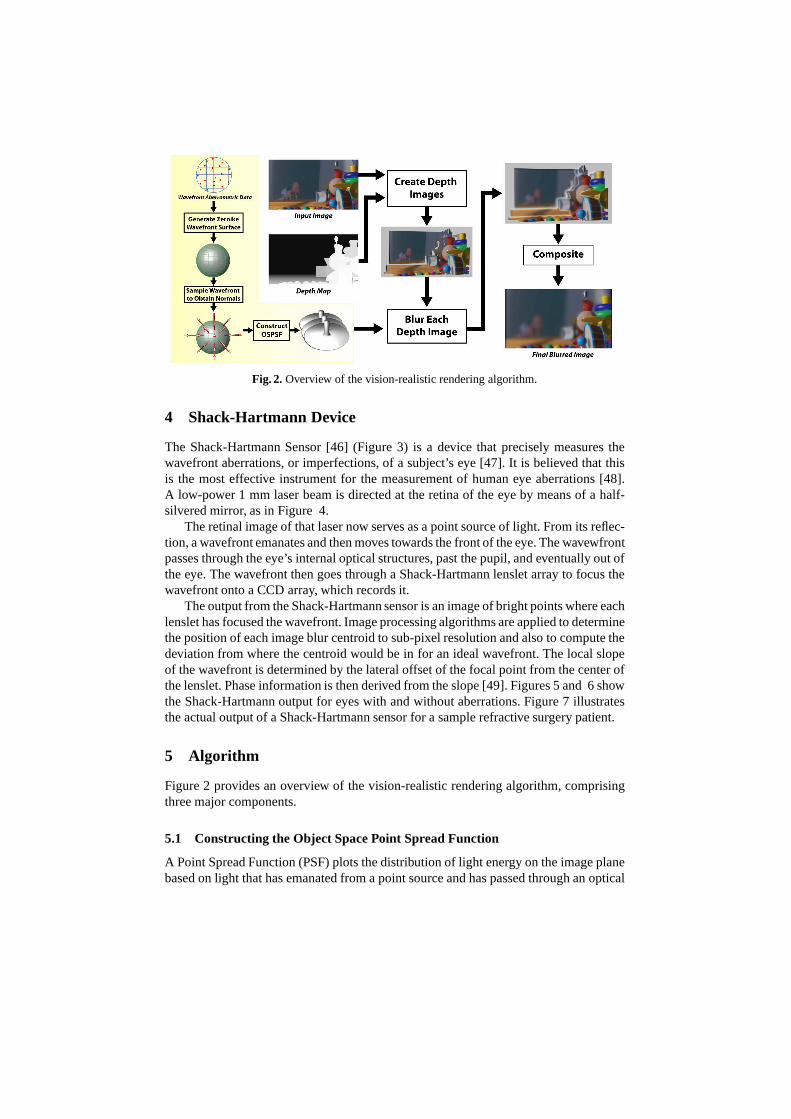
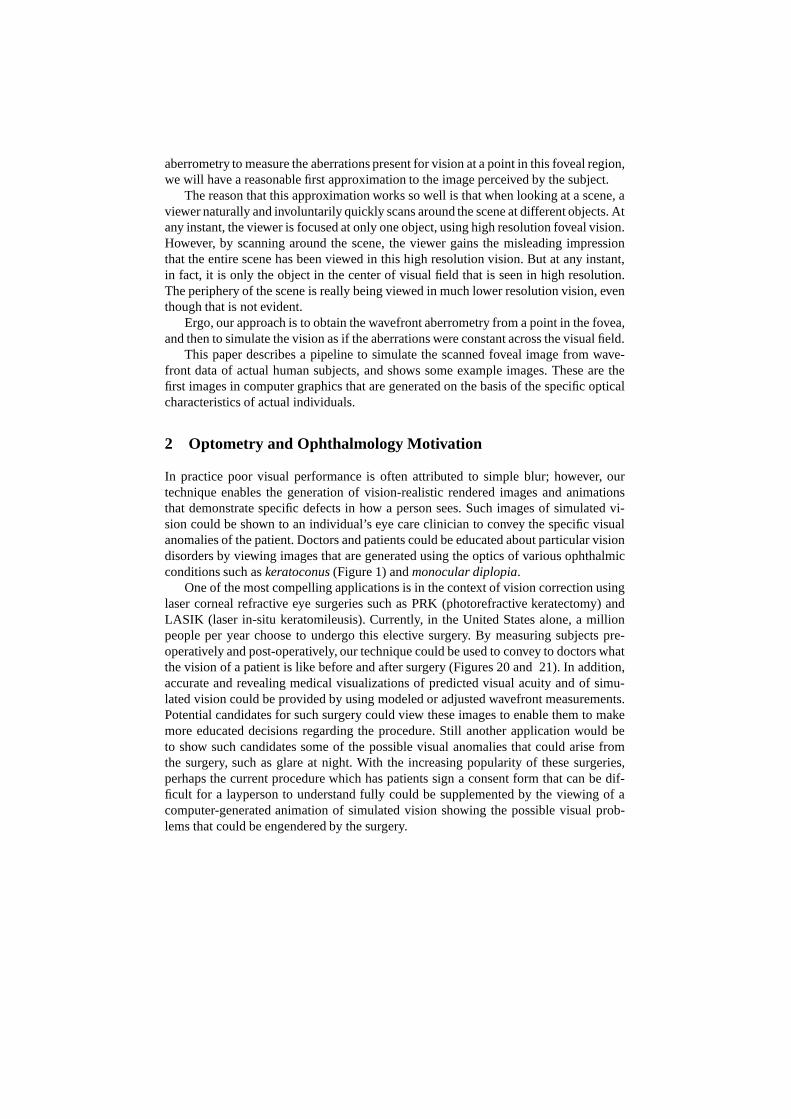
Fig. 2. Overview of the vision-realistic rendering algorithm.
4 Shack-Hartmann Device
The Shack-Hartmann Sensor [46] (Figure 3) is a device that precisely measures thewavefront aberrations, or imperfections, of a subject’s eye [47]. It is believed that thisis the most effective instrument for the measurement of human eye aberrations [48].A low-power 1 mm laser beam is directed at the retina of the eyeby means of a half-silvered mirror, as in Figure 4.
The retinal image of that laser now serves as a point source oflight. From its reflec-tion, a wavefront emanates and then moves towards the front of the eye. The wavewfrontpasses through the eye’s internal optical structures, pastthe pupil, and eventually out ofthe eye. The wavefront then goes through a Shack-Hartmann lenslet array to focus thewavefront onto a CCD array, which records it.
The output from the Shack-Hartmann sensor is an image of bright points where eachlenslet has focused the wavefront. Image processing algorithms are applied to determinethe position of each image blur centroid to sub-pixel resolution and also to compute thedeviation from where the centroid would be in for an ideal wavefront. The local slopeof the wavefront is determined by the lateral offset of the focal point from the center ofthe lenslet. Phase information is then derived from the slope [49]. Figures 5 and 6 showthe Shack-Hartmann output for eyes with and without aberrations. Figure 7 illustratesthe actual output of a Shack-Hartmann sensor for a sample refractive surgery patient.
5 Algorithm
Figure 2 provides an overview of the vision-realistic rendering algorithm, comprisingthree major components.
5.1 Constructing the Object Space Point Spread Function
A Point Spread Function (PSF) plots the distribution of light energy on the image planebased on light that has emanated from a point source and has passed through an optical

Fig. 3. Measuring the specific vision characteristics of a subject using a Shack-Hartmann wave-front aberrometry device.
system. Thus it can be used as an image space convolution kernel.We introduce the object space point spread function (OSPSF), which is similar to
the usual image space point spread function, as described above, except that it is definedin object space and thus it varies with depth. The OSPSF is a continuous function ofdepth; however, we discretize it, thereby defining a sequence of depth point spreadfunctions (DPSF) at some chosen depths.
Since human blur discrimination is nonlinear in distance but approximately linearin diopters (a unit measured in inverse meters), the depths are chosen with a constantdioptric spacing∆D and they range from the nearest depth of interest to the farthest.A theoretical value of∆D can be obtained from the relationθ = p∆D, whereθ is theminimum subtended angle of resolution andp is the pupil size in meters. For a humanwith 20/20 visual acuity,θ is 1 min of arc; that is,θ = 2.91×10⁻⁴ [50, 51].
The DPSFs are histograms of rays cast normal to the wavefront(Figure 8). To com-pute these functions (Figure 9), we first place a grid with constant angular spacing ateach of the chosen depths and initialize counters in each grid cell to zero. Then we iter-atively choose a point on the wavefront, calculate the normal direction, and cast a ray inthis direction. As the ray passes through each grid, the cellit intersects has its counterincremented. This entire process is quite fast and millionsof rays may be cast in a fewminutes. Finally, we normalize the histogram so that its sumis unity.
In general, wavefront aberrations are measured with the subject’s eye focused at

Fig. 4.A side view of a Hartmann-Shack device. A laser projects a spot on the back of the cornea.This spot serves as a point light source, originating a wavefront out of the eye. This wavefrontpasses through a lattice of small lenslets which focus the wavefront onto a CCD sensor.
infinity. However, it is important to be able to shift focus for vision-realistic rendering.Recent research results in optometry [52] showed that aberrations change significantlywith accommodation. When aberrometric data is available for the eye focused at thedepth that will be used in the final image, our algorithm exploits that wavefront mea-surement.
In the situation where such data is not available, then we aassume that the aberra-tions are independent of accommodation. We can then re-index the DPSFs, which isequivalent to shifting the OSPSF in the depth dimension. Note that this may require thecomputation of DPSFs at negative distances.
We further assume the OSPSF is independent of the image planelocation. In optics,this is called the “isoplanatic” assumption and is the basisfor being able to performconvolutions across the visual field. For human vision, thisassumption is valid for atleast several degrees around the fixation direction.
5.2 Fitting a Wavefront Surface to Aberrometry Data
The output of the Shack-Hartmann device comprises a ray orientation (normal vector) ateach lenslet. Current devices yield only 50 to 200 such vectors. To generate the millionsof samples necessary to calculate the OSPSF (see Section 5.1above), we first generatea smooth mathematical surface representation of the wavefront from this sparse data.Our wavefront surface is a fifth degree polynomial bivariatesurface defined as a heightfield whose domain is the pupil plane. This surface is determined by a least squares fitto the Shack-Hartmann data.
We use a particular polynomial form which was developed in 1934 [54] by theDutch mathematician and physicist Frits Zernike who was awarded the Nobel Prize

Fig. 5. Hartmann-Shack sensors measuring a perfect eye with no aberrations. Image courtesy ofLarry Thibos [53].
Fig. 6. Hartmann-Shack sensors measuring a normal eye with some aberrations. Image courtesyof Larry Thibos [53].
in Physics 1953 for discovering the phase contrast phenomenon; for a discussion ofZernkie polynomials realted to the optical aberrations of eyes, the reader is referred to[53]. Zernike polynomials are derived from the orthogonalization of the Taylor series.The resulting polynomial basis corresponds to orthogonal wavefront aberrations. ThecoefficientsZm,n weighting each polynomial have easily derived relations with mean-ingful parameters in optics. The indexm refers to the aberration type, whilen distin-
Fig. 7. Hartmann-Shack output for a sample eye. The green overlay lattice is registered to corre-spond to each lenslet in the array. Image courtesy of David Williams.
guishes between individual aberrations within a harmonic.For a given indexm, n rangesfrom−m to m in steps of two. Specifically,Z0,0 is displacement,Z1,1 is horizontal tilt,Z1,−1 is vertical tilt,Z2,0 is average power,Z2,2 is horizontal cylinder,Z2,−2 is obliquecylinder,Z3,n are four terms (n = −3,−1,1,3) related to coma, andZ4,n are five terms(n = −4,−2,0,2,4) related to spherical aberration.
5.3 Rendering Steps
Given the input image and its associated depth map, and the OSPSF, the vision-realisticrendering algorithm comprises three steps: (1) create a setof depth images, (2) blureach depth image, and (3) composite the blurred depth imagesto form a single vision-realistic rendered image.
Create Depth Images.Using the depth information, the image is separated into a set ofdisjoint images, one at each of the depths chosen in the preceding section. Ideally, theimage at depthd would be rendered with the near clipping plane set tod + ∆D/2 andthe far clipping plane set tod −∆D/2. Unfortunately, this is not possible because weare using previously rendered images and depth maps. Complicated texture synthesisalgorithms would be overkill here, since the results will beblurred anyway. The follow-ing technique is simple, fast, and works well in practice: For each depth,d, those pixels

Fig. 8. Each depth point spread function (DPSF) is a histogram of rays cast normal to the wave-front.
Fig. 9. A simplified view: Rays are cast from a point light source on the retina and pass througha virtual lens, thereby creating the measured wavefront. This wavefront is sampled and rays arecast normal to it. The DPSFs are determined by intersecting these rays at a sequence of depths.
from the original image that are within∆D/2 diopters ofd are copied to the depth im-age. We handle partial occlusion by the techniques described in Section 6 and in moredetail by Barsky et al. [7] [8].

Blur each Depth Image.Once we have the depth images, we do a pairwise convolu-tion: Each depth image is convolved with its corresponding DPSF, thereby producing aset of blurred depth images.
Composite.Finally, we composite these blurred depth images into a single, vision-realistic rendered image. This step is performed from far tonear, using alpha-blendingfollowing alpha channel compositing rules.
6 Elimination of Artifacts due to Occlusion and Discretization
Although processing in image space allows an increase in speed, the images may haveartifacts introduced. This can occur in two ways, which we refer to asocclusion anddiscretization [7] [8]. The occlusion problem arises because there is scenegeometrythat is missing. This results from the finite aperture of the lens, which allows more of thescene to be visible than would be seen through an infinitesimal pinhole. Thus, withoutadditional input, the colors from parts of the scene that arebehind objects would haveto be approximately reconstructed using the border colors of visible objects.
The discretization problem occurs from separating the image by depth. At adja-cent pixels in different sub-images, the calculation of depth of field is complicated.This arises because these adjacent pixels may or may not correspond to the same ob-ject. An artifacts can be introduced into the image when a single object straddles twosub-images and the sub-images are blurred. The artifact arises when the far pixel is av-eraged with neighboring colors behind the near pixel that donot match the far pixel’scolor. The neighboring colors are often black, which is the default background color.Consequently, a black blurred band occurs at the intersection of the object with theseparation of the sub-images that it spans, as can be seen in Figure 10.
7 Object Identification as a Solution for Image Space Artifacts
To eliminate these band artifacts that arise when an object is separated into multiplediscrete sub-images, the algorithm attempts to identify entire objects within the image.This eliminates the artifact by avoiding the separation of objects across sub-images.Instead, when a large object straddles several sub-images,each sub-image will includethe entire object instead of only a part of that object. Consequently, the object will haveminimal artifacts due to blurring.
We will now consider two approaches for object identification to properly blur thescene; these techniques are described in more detail by Barsky et al. [7] [8]. Our firstapproach uses the depth difference of adjacent pixels to identify objects. In our secondapproach, the Canny Edge Detection [55] algorithm is applied to draw borders betweenobjects and hence identify them.
7.1 Edge Detection Technique for Object Identification
Our first method for identifying objects begins by using a variant of the Canny EdgeDetection algorithm [55]. The Canny algorithm takes as input an intensity map for the
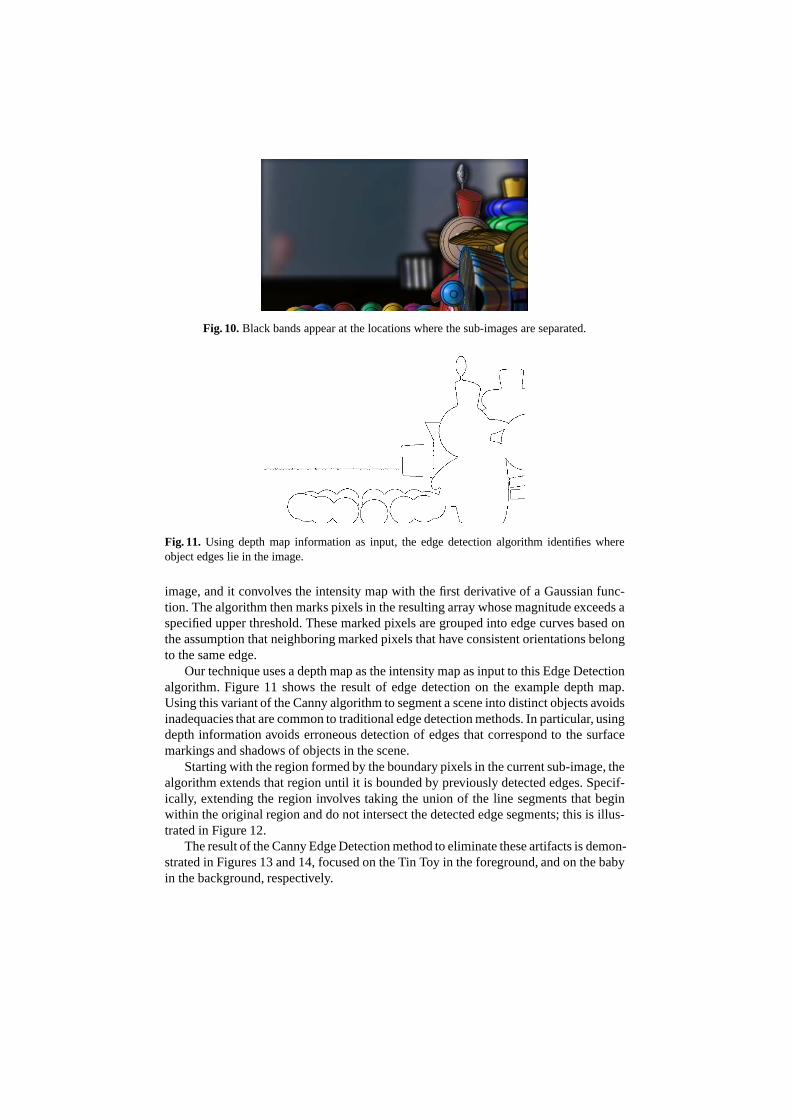
Fig. 10.Black bands appear at the locations where the sub-images areseparated.
Fig. 11. Using depth map information as input, the edge detection algorithm identifies whereobject edges lie in the image.
image, and it convolves the intensity map with the first derivative of a Gaussian func-tion. The algorithm then marks pixels in the resulting arraywhose magnitude exceeds aspecified upper threshold. These marked pixels are grouped into edge curves based onthe assumption that neighboring marked pixels that have consistent orientations belongto the same edge.
Our technique uses a depth map as the intensity map as input tothis Edge Detectionalgorithm. Figure 11 shows the result of edge detection on the example depth map.Using this variant of the Canny algorithm to segment a scene into distinct objects avoidsinadequacies that are common to traditional edge detectionmethods. In particular, usingdepth information avoids erroneous detection of edges thatcorrespond to the surfacemarkings and shadows of objects in the scene.
Starting with the region formed by the boundary pixels in thecurrent sub-image, thealgorithm extends that region until it is bounded by previously detected edges. Specif-ically, extending the region involves taking the union of the line segments that beginwithin the original region and do not intersect the detectededge segments; this is illus-trated in Figure 12.
The result of the Canny Edge Detection method to eliminate these artifacts is demon-strated in Figures 13 and 14, focused on the Tin Toy in the foreground, and on the babyin the background, respectively.
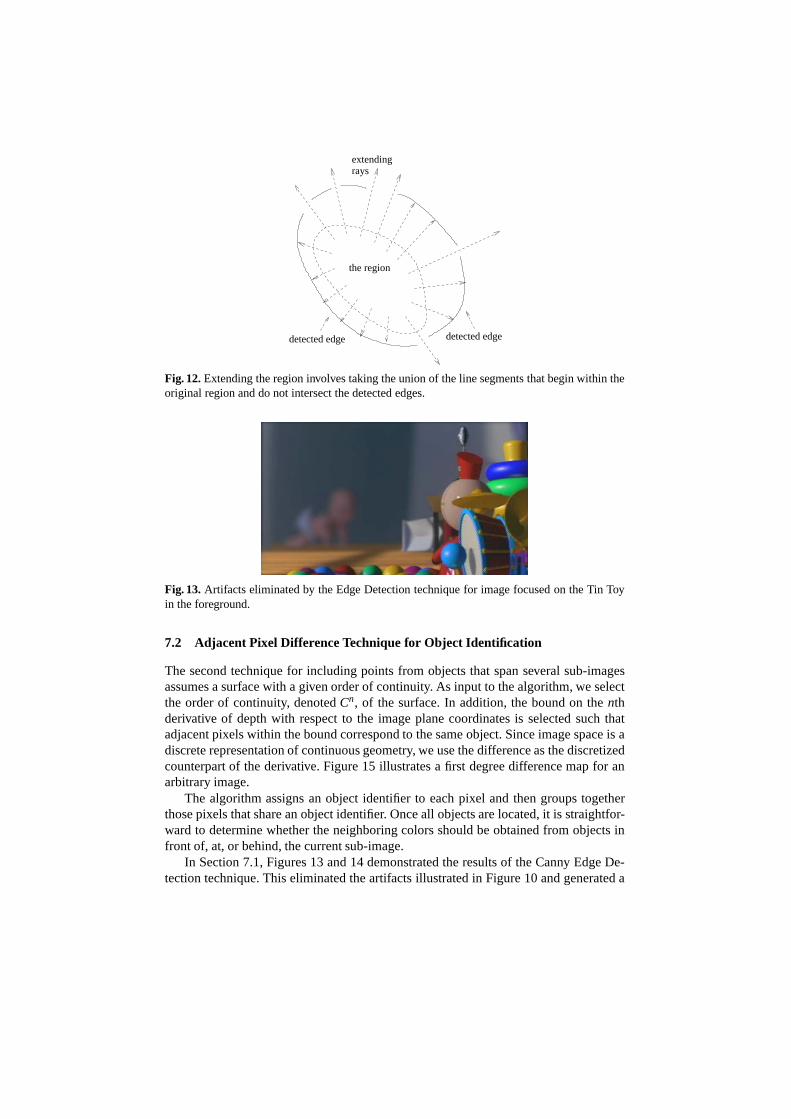
detected edge
raysextending
the region
detected edge
Fig. 12.Extending the region involves taking the union of the line segments that begin within theoriginal region and do not intersect the detected edges.
Fig. 13.Artifacts eliminated by the Edge Detection technique for image focused on the Tin Toyin the foreground.
7.2 Adjacent Pixel Difference Technique for Object Identification
The second technique for including points from objects thatspan several sub-imagesassumes a surface with a given order of continuity. As input to the algorithm, we selectthe order of continuity, denotedCn, of the surface. In addition, the bound on thenthderivative of depth with respect to the image plane coordinates is selected such thatadjacent pixels within the bound correspond to the same object. Since image space is adiscrete representation of continuous geometry, we use thedifference as the discretizedcounterpart of the derivative. Figure 15 illustrates a firstdegree difference map for anarbitrary image.
The algorithm assigns an object identifier to each pixel and then groups togetherthose pixels that share an object identifier. Once all objects are located, it is straightfor-ward to determine whether the neighboring colors should be obtained from objects infront of, at, or behind, the current sub-image.
In Section 7.1, Figures 13 and 14 demonstrated the results ofthe Canny Edge De-tection technique. This eliminated the artifacts illustrated in Figure 10 and generated a

Fig. 14.Artifacts eliminated by the Edge Detection technique for image focused on the baby inthe background.
33 1 4 1
5 9 2 6
5 3 5 8
9 7 9 3
2
−4
2
2
−3
7
−2
−2
−3
−4
6
Fig. 15.An example of a first degree difference map (right) resultingfrom applying a horizontaldifference to the first 16 digits ofπ (left).
correctly blurred image. We will now use the Adjacent Pixel Difference technique togenerate a similar artifact-free blurred image, which are shown in Figures 16 and 17,focused on the Tin Toy in the foreground, and on the baby in thebackground, respec-tively.
8 Sample Images
Figures 1, 19, 20, and 21 are vision-realistic renderings ofa room scene. Figure 18 isa simulation that models ideal vision and Figures 1, 19, 20, and 21 are simulations ofthe vision of actual individuals based on their measured data. Notice that the nature ofthe blur is different in each image. The field of view of the image is approximately 46◦
and the pupil size is rather large at 5.7 mm.For Figure 18, we constructed an OSPSF from a planar wavefront to yield a simu-
lation of vision for an aberration-free model eye.The simulation of vision shown in Figure 19 is based on the data from the left eye
of male patient GG who has astigmatism. Note how the blur is most pronounced in onedirection (in this case horizontal), which is symptomatic of astigmatism.
Next, we show vision-realistic rendered images based on pre- and post-operativedata of patients who have undergone LASIK vision correctionsurgery. Specifically, thevision for the right eye of male patient DB is simulated in Figure 20, and then Figure

Fig. 16.Artifacts eliminated by the Adjacent Pixel Difference technique for image focused on theTin Toy in the foreground.
Fig. 17. Artifacts eliminated by the Adjacent Pixel Difference technique for image focused onbaby in the background.
Fig. 18.Simulation of vision of an aberration-free model eye.
21 simulates the vision of the left eye of male patient DR. Foreach patient, the pre-operative vision is simulated in the top image while the lower image simulates the post-

Fig. 19.Simulation of vision of astigmatic patient GG.
operative vision. The images demonstrating pre-operativevision show the characteristicextreme blur pattern of the highly myopic (near-sighted) patients who tend to be theprime candidates for this surgery. Although, in both cases,the vision has been improvedby the surgery, it is still not as good as the aberration-freemodel eye. Furthermore, thesimulated result of the surgery for patient DB is slightly inferior to that depicted forpatient DR. However, note that the patient (DB) with the inferior surgical result hadsignificantly inferior pre-operative vision compared to that of patient DR.
Figure 1 is computed based on data measured from the left eye of female patientKS who has the eye condition known askeratoconus. This image shows the distortionof objects that is caused by the complex, irregular shape of the keratoconic cornea.Note how the nature of these visual artifacts is distinct from what would generally bea smooth blur that occurs in more pedestrian vision problemssuch as myopia (see Fig-ure 21(a)). This distinction is often not understood by clinicians when it is articulatedby keratoconic patients. We hope our techniques could be used in optometry and oph-thalmology for the education of students and residents as well as for the continuingeducation of clinicians.
Our approach can also be applied to photographs (with associated depth maps) ofreal scenes, not only to synthetic images. For example, in Figure 22, the top image isa photograph showing the Campanille at U.C. Berkeley with San Francicsco’s GoldenGate Bridge in the background, with both the tower and bridgeare in sharp focus.Constructing an OSPSF with the point of focus at the Campanille and then applyingour algorithm yields an image with the background blurred, as shown in bottom image.
To consider the computational requirements of our technique, note that it comprisesthree parts: fitting the wavefront surface, construction ofthe OSPSF and the renderingstep. The computation time for the surface fitting is negligible. The time to computethe OSPSF depends on the number of wavefront samples. For theimages in this paper,the computation of the OSPSF, using one million samples, wasless than half a minute.The rendering step is dominated by the FFTs performed for convolution (our kernels
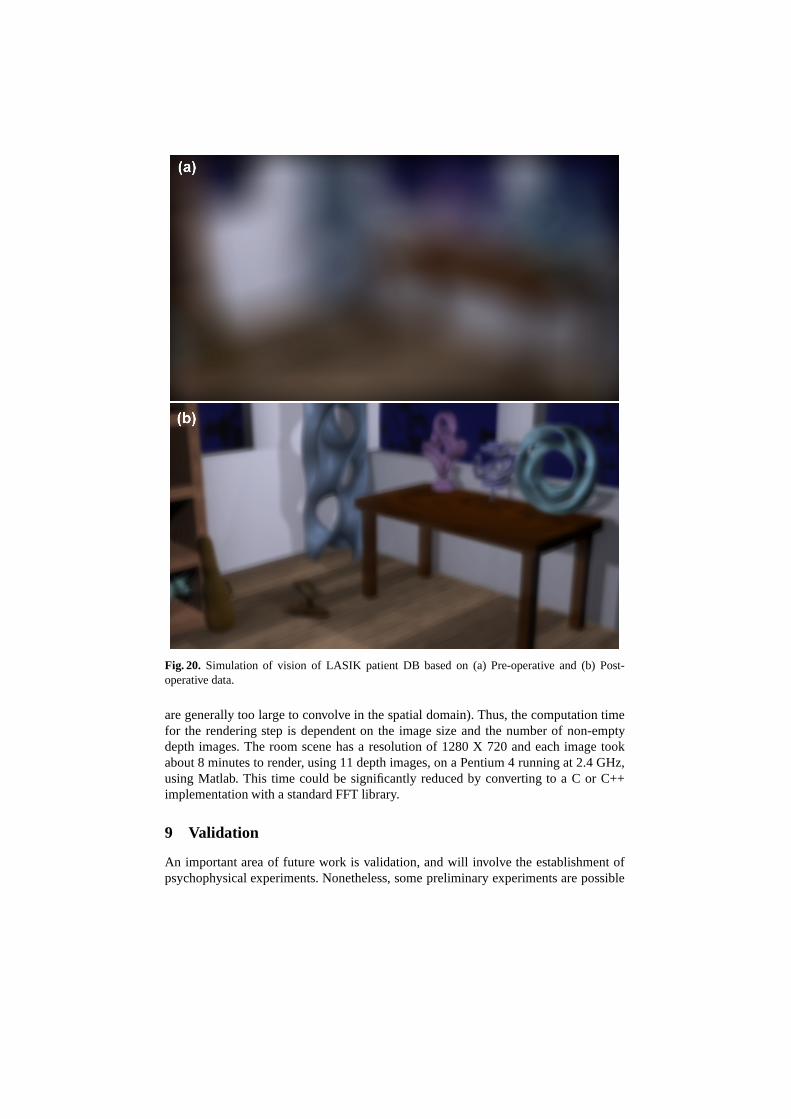
Fig. 20. Simulation of vision of LASIK patient DB based on (a) Pre-operative and (b) Post-operative data.
are generally too large to convolve in the spatial domain). Thus, the computation timefor the rendering step is dependent on the image size and the number of non-emptydepth images. The room scene has a resolution of 1280 X 720 andeach image tookabout 8 minutes to render, using 11 depth images, on a Pentium4 running at 2.4 GHz,using Matlab. This time could be significantly reduced by converting to a C or C++implementation with a standard FFT library.
9 Validation
An important area of future work is validation, and will involve the establishment ofpsychophysical experiments. Nonetheless, some preliminary experiments are possible
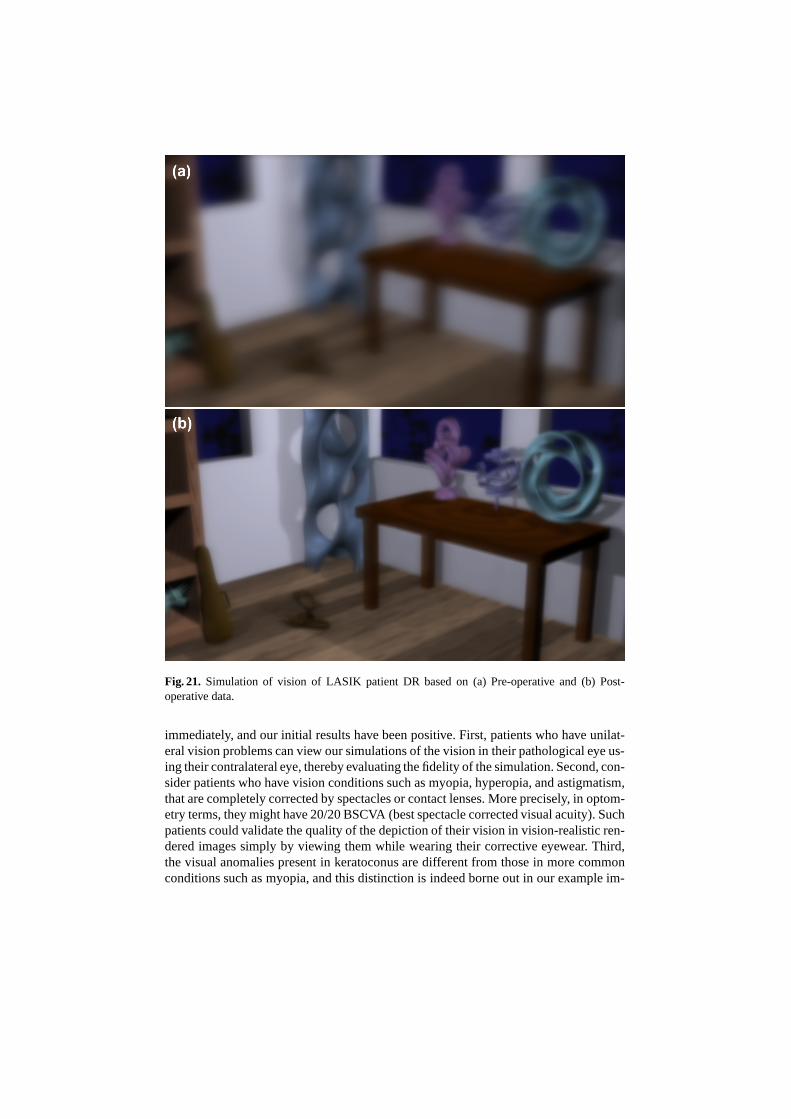
Fig. 21. Simulation of vision of LASIK patient DR based on (a) Pre-operative and (b) Post-operative data.
immediately, and our initial results have been positive. First, patients who have unilat-eral vision problems can view our simulations of the vision in their pathological eye us-ing their contralateral eye, thereby evaluating the fidelity of the simulation. Second, con-sider patients who have vision conditions such as myopia, hyperopia, and astigmatism,that are completely corrected by spectacles or contact lenses. More precisely, in optom-etry terms, they might have 20/20 BSCVA (best spectacle corrected visual acuity). Suchpatients could validate the quality of the depiction of their vision in vision-realistic ren-dered images simply by viewing them while wearing their corrective eyewear. Third,the visual anomalies present in keratoconus are different from those in more commonconditions such as myopia, and this distinction is indeed borne out in our example im-
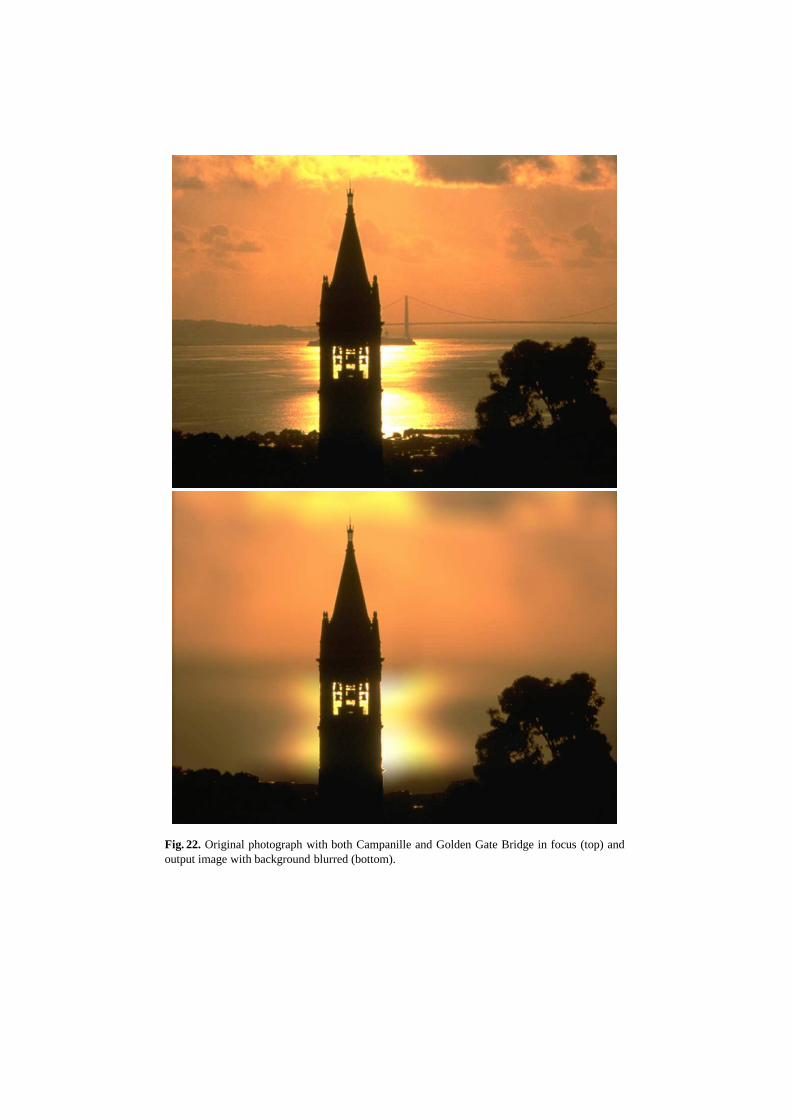
Fig. 22. Original photograph with both Campanille and Golden Gate Bridge in focus (top) andoutput image with background blurred (bottom).

ages. Specifically, keratoconus can cause the appearance ofdiplopia (double-vision)whereas myopia usually engenders a smooth blur around edges. Indeed, exactly thisdistinction can be observed upon close examination of our sample images. Fourth, se-vere astigmatism causes more blur in one direction than in the orthogonal direction, andthis is exactly what is depicted in our sample image of astigmatism. Fifth, our simula-tions of the vision of patients with more myopia are more blurred than those of patientswith less myopia.
10 Conclusions and Future Work
We introduced the concept ofvision-realistic rendering – the computer generation ofsynthetic images that incorporate the characteristics of aparticular individual’s entireoptical system. This paper took the first steps toward this goal, by developing a methodfor simulating the scanned foveal image from wavefront dataof actual human subjects,and demonstrated those methods on sample images. First, a subject’s optical system ismeasured by a Shack-Hartmann wavefront aberrometry device. This device outputs ameasured wavefront which is sampled to calculate an object space point spread func-tion (OSPSF). The OSPSF is then used to blur input images. This blurring is accom-plished by creating a set of depth images, convolving them with the OSPSF, and finallycompositing to form a vision-realistic rendered image. Applications of vision-realisticrendering in computer graphics as well as in optometry and ophthalmology were dis-cussed.
The problem of vision-realistic rendering is by no means solved. Like early workon photo-realistic rendering, our method contains severalsimplifying assumptions andother limitations. There is much interesting research ahead.
The first limitations are those stemming from the method of measurement. TheShack-Hartmann device, although capable of measuring a wide variety of aberrations,does not take into account light scattering due to such conditions as cataracts. Thewavefront measurements can have some error, and fitting the Zernike polynomial sur-face to the wavefront data can introduce more. However, since the wavefronts from evenpathological eyes tend to be continuous, smooth interpolation of the Shack-Hartmanndata should not produce any significant errors. Consequently, any errors that are intro-duced should be small and, furthermore, such small errors would imperceptible in finalimages that have been discretized into pixels.
Strictly speaking, the pupil size used for vision-realistic rendering should be thesame as the pupil size when the measurements are taken. However, the error introducedin using only part of the wavefront (smaller pupil) or extrapolating the wavefront (largerpupil) should be quite small. We have made use of three assumptions commonly usedin the study of human physiological optics: isoplanarity, independence of accommo-dation, and off-axis aberrations being dominated by on-axis aberrations. Although wehave argued that these assumptions are reasonable and provide a good first-order ap-proximation, a more complete model would remove at least thefirst two.
As discussed in Section 5.1, we have assumed ”independence of accommodation”since aberrometric measurements with the eye focused at thedepth is not usually avail-able. However, this is not a limitation of our algorithm. Ouralgorithm can exploit wave-
front data where the eye is focused at the depth that will be used in the final image, whensuch a measurement is made.
We currently do not take chromatic aberration into account,but again that is not alimitation of our algorithm. Since the data we acquire is from a laser, it is monochro-matic. However, some research optometric colleagues have acquired polychromaticdata and will be sharing it with us. It is again interesting that recent research in op-tometry by Marcos [56] has shown that except for the low orderaberrations, mostaberrations are fairly constant over a range of wavelengths.
We only compute the aberrations for one point in the fovea, and not for other pointsin the visual field. However, it is important to note that for computer graphics, theon-axis aberrations are critically important because viewers move their eyes aroundwhen viewing a scene. If we had actually included the off-axis aberrations of the eye,then the off-axis parts of the scene would have been improperly blurred for a personwho is scanning the scene. The off-axis aberrations are of minor concern even withouteye movements since the retinal sampling of cones is sparse in peripheral vision. Theimage that we are simulating is formed by viewing the entire scene using the on-axisaberrations because we assume that the viewer is scanning the scene.
However, since peripheral vision does makes important contributions to visual ap-pearance, viewers are affected by optical distortions of peripheral vision. Thus, it is ofinterest to extend this method to properly address the off-axis effects.
Acknowledgements. The author would like to thank Stanley A. Klein of the VisionScience Graduate Group and Adam W. Bargteil, Daniel D. Garcia, Michael J. Tobias,Daniel R. Horn, and Derrick P. Chu of the Computer Science Division at the Univer-sity of California, Berkeley for their numerous contributions to this work. This workwas supported in part by the National Science Foundation under grant number CCR-0209574 ”Vision-Realistic Rendering”.
References
1. Barsky, B.A., Horn, D.R., Klein, S.A., Pang, J.A., Yu, M.:Camera models and opti-cal systems used in computer graphics: Part I, object based techniques. In: Proceed-ings of the 2003 International Conference on ComputationalScience and its Applications(ICCSA’03), Montreal,Second International Workshop on Computer Graphics and Geomet-ric Modeling (CGGM’2003), Springer-Verlag Lecture Notes in Computer Science (LNCS),Berlin/Heidelberg (2003) 246–255
2. Barsky, B.A., Horn, D.R., Klein, S.A., Pang, J.A., Yu, M.:Camera models and opti-cal systems used in computer graphics: Part II, image based techniques. In: Proceed-ings of the 2003 International Conference on ComputationalScience and its Applications(ICCSA’03), Montreal,Second International Workshop on Computer Graphics and Geomet-ric Modeling (CGGM’2003), Springer-Verlag Lecture Notes in Computer Science (LNCS),Berlin/Heidelberg (2003) 256–265
3. Potmesil, M., Chakravarty, I.: Synthetic image generation with a lens and aperture cameramodel. ACM Transactions on Graphics 1 (1982) 85–108 (Original version in ACM SIG-GRAPH 1981 Conference Proceedings, Aug. 1981, pp. 297-305.).

4. Shinya, M.: Post-filtering for depth of field simulation with ray distribution buffer. In: Pro-ceedings of Graphics Interface ’94, Banff, Alberta, Canadian Information Processing Society(1994) 59–66
5. Rokita, P.: Fast generation of depth-of-field effects in computer graphics. Computers &Graphics 17 (1993) 593–595
6. Rokita, P.: Generating depth-of-field effects in virtualreality applications. IEEE ComputerGraphics and Applications 16 (1996) 18–21
7. Barsky, B.A., Tobias, M.J., Horn, D.R., Chu, D.P.: Investigating occlusion and discretizationproblems in image space blurring techniques. In: First International Conference on Vision,Video, and Graphics, Bath, Peter Hall and Philip Willis (editors). (2003) 97–102
8. Barsky, B.A., Tobias, M.J., Chu, D.P., Horn, D.R.: Elimination of artifacts due to occlusionand discretization problems in image space blurring techniques. Graphical Models (2005)
9. Cook, R.L., Porter, T., Carpenter, L.: Distributed ray tracing. In: ACM SIGGRAPH 1984Conference Proceedings, Minneapolis, SIGGRAPH, ACM (1984) 137–145
10. Dippe, M.A.Z., Wold, E.H.: Antialiasing through stochastic sampling. In: ACM SIGGRAPH1985 Conference Proceedings, San Francisco, SIGGRAPH, ACM(1985) 69–78
11. Lee, M.E., Redner, R.A., Uselton, S.P.: Statistically optimized sampling for distributed raytracing. In: ACM SIGGRAPH 1985 Conference Proceedings, SanFrancisco, SIGGRAPH,ACM (1985) 61–67
12. Kolb, C., Mitchell, D., Hanrahan, P.: A realistic cameramodel for computer graphics. In:ACM SIGGRAPH 1995 Conference Proceedings, SIGGRAPH, ACM (1995) 317–324
13. Loos, J., Slusallek, P., Seidel, H.P.: Using wavefront tracing for the visualization and opti-mization of progressive lenses. In: Computer Graphics Forum (Eurographics ’98 ConferenceProceedings, Eurographics (1998) 255–266 held in Lisbon, Portugal, 02-04 September 1998.
14. Levoy, M., Hanrahan, P.: Light field rendering. In: ACM SIGGRAPH 1996 ConferenceProceedings, New Orleans, SIGGRAPH, ACM (1996) 31–42
15. Gortler, S.J., Grzeszczuk, R., Szeliski, R., Cohen, M.F.: The lumigraph. In: ACM SIG-GRAPH 1996 Conference Proceedings, SIGGRAPH, ACM (1996) 43–54
16. Adelson, E., Bergen, J.: Computational Models of VisualProcessing. The MIT Press, Cam-bridge, Mass. (1991)
17. Heidrich, W., Slusallek, P., Seidel, H.P.: An image-based model for realistic lens systemsin interactive computer graphics. In: Graphics Interface,Canadian Information ProcessingSociety (1997) 68–75
18. Isaksen, A., McMillan, L., Gortler, S.J.: Dynamically reparameterized light fields. In: Pro-ceedings of ACM SIGGRAPH 2000, New Orleans, SIGGRAPH, ACM (2000) 297–306
19. Upstill, S.D.: The Realistic Presentation of SyntheticImages: Image Processing in ComputerGraphics. PhD thesis, Computer Science Division, University of California (1985)
20. Spencer, G., Shirley, P., Zimmerman, K., Greenberg, D.P.: Physically-based glare effectsfor digital images. In: ACM SIGGRAPH 1995 Conference Proceedings, SIGGRAPH, ACM(1995) 325–334
21. Bolin, M.R., Meyer, G.W.: A perceptually based adaptivesampling algorithm. In: ACMSIGGRAPH 1998 Conference Proceedings, Orlando, SIGGRAPH,ACM (1998) 299–309
22. Tumblin, J., Rushmeier, H.E.: Tone reproduction for realistic images. IEEE ComputerGraphics and Applications 13 (1993) 42–48
23. Chiu, K., Herf, M., Shirley, P., Swamy, S., Wang, C., Zimmerman, K.: Spatially non-uniform scaling functions for high contrast images. In: Proceedings of Graphics Interface’93, Toronto, Canadian Information Processing Society (1993) 245–254
24. Ferwerda, J.A., Pattanaik, S.N., Shirley, P., Greenberg, D.P.: A model of visual adaptationfor realistic image synthesis. In: ACM SIGGRAPH 1996 Conference Proceedings, NewOrleans, SIGGRAPH, ACM (1996) 249–258

25. Ward-Larson, G., Rushmeier, H., Piatko, C.D.: A visibility matching tone reproduction op-erator for high dynamic range scenes. IEEE Transactions on Visualization and ComputerGraphics 3 (1997) 291–306
26. Pattanaik, S.N., Ferwerda, J.A., Fairchild, M.D., Greenberg, D.P.: A multiscale model ofadaptation and spatial vision for realistic image display.In: ACM SIGGRAPH 1998 Con-ference Proceedings, SIGGRAPH, ACM (1998) 287–298
27. Reinhard, E., Stark, M., Shirley, P., Ferwerda, J.: Photographic tone reproduction for digitalimages. In: ACM SIGGRAPH 2002 Conference Proceedings, SIGGRAPH, ACM (2002)267–276
28. Meyer, G.W., Greenberg, D.P.: Color-defective vision and computer graphics displays. IEEEComputer Graphics and Applications 8 (1988) 28–40
29. Meyer, G.W.: Image synthesis and color vision. In Rogers, D.F., Earnshaw, R.A., eds.:Computer Graphics Techniques. Springer Verlag, New York (1990) 45–77
30. Pellacini, F., Greenberg, D.P.: Toward a psychophysically-based light reflection model forimage synthesis. In: ACM SIGGRAPH 2000 Conference Proceedings, New Orleans, SIG-GRAPH, ACM (2000) 55–64
31. Lubin, J.: A visual discrimination model for imaging system design and evaluation. In Peli,E., ed.: Vision Models for Target Detection and Recognition. Volume 2. World ScientificPublishing Co., Inc., Washington, DC (1995) 245–357
32. Peli, E.: Test of a model of foveal vision by using simulations. Journal of Optical Society ofAmerica 13 (1996) 1131–1138
33. Fine, E.M., Rubin, G.S.: Effects of cataract and scotomaon visual acuity: A simulationstudy. Optometry and Vision Science 76 (1999) 468–473
34. Fine, E.M., Rubin, G.S.: The effects of simulated cataract on reading with normal vision andsimulated central scotoma. Vision Research 39 (1999) 4274–4285
35. Camp, J.J., Maguire, L.J., Cameron, B.M., Robb, R.A.: A computer model for the evaluationof the effect of corneal topography on optical performance.Am. J. Ophthalmol. 109 (1990)379–386
36. Camp, J.J., Maguire, L.J., Robb, R.A.: An efficient ray tracing algorithm for modeling visualperformance from corneal topography. In: First Conferenceon Visualization in BiomedicalComputing, The Institute of Electrical and Electronics Engineers, Inc., IEEE Computer So-ciety Press (1990) 279–285
37. Maguire, L.J., Zabel, R.W., Parker, P., Lindstrom, R.L.: Topography and raytracing analysisof patients with excellent visual acuity 3 months after excimer laser photorefractive keratec-tomy for myopia. Refract. Corneal Surg. 8 (1991) 122–128
38. Maguire, L.J., Camp, J.J., Robb, R.A.: Informing interested parties of changes in the opticalperformance of the cornea caused by keratorefractive surgery — a ray tracing model thattailors presentation of results to fit the level of sophistication of the audience. In: SPIEVol. 1808 Visualization in Biomedical Computing, The International Society for OpticalEngineering, SPIE (1992) 601 – 609
39. Greivenkamp, J.E., Schweigerling, J., Miller, J.M., Mellinger, M.D.: Visual acuity modelingusing optical raytracing of schematic eyes. Am. J. Ophthalmol. 120 (1995) 227–240
40. Moon, P., Spencer, D.E.: On the Stiles-Crawford effect.J. Opt. Soc. Am. 34 (1944) 319–32941. Garcia, D.D., Barsky, B.A., Klein, S.A.: CWhatUC: A visual acuity simulator. In: Pro-
ceedings of Ophthalmic Technologies VIII, SPIE International Symposium on BiomedicalOptics, SPIE (1998) 290–298
42. Garcia, D.D., Barsky, B.A., Klein, S.A.: The OPTICAL project at UC Berkeley: Simulat-ing visual acuity. Medicine Meets Virtual Reality: 6 (Art, Science, Technology: Healthcare(r)Evolution) (1998)

43. Garcia, D.D.: CWhatUC : Software Tools for Predicting, Visualizing and Simulating CornealVisual Acuity. PhD thesis, Computer Science Division, University of California, Berkeley,California (2000)
44. Barsky, B.A., Bargteil, A.W., Garcia, D.D., Klein, S.A.: Introducing vision-realistic render-ing. In: Eurographics 2002 Poster Proceedings, Eurographics (2002) 1–7 Held in Pisa, Italy26-28 June 2002.
45. Barsky, B.A.: Vision-realistic rendering: Simulationof the scanned foveal image from wave-front data of human subjects. In: First Symposium on AppliedPerception in Graphics andVisualization, co-located with ACM SIGGRAPH, Los Angeles (2004) 73–81
46. Platt, B.C., Shack, R.V.: Lenticular Hartmann-screen.Newsletter 5, 15, Optical ScienceCenter, University of Arizona (1971)
47. Thibos, L.N.: Principles of Hartmann-Shack aberrometry. In: Vision Science and its Appli-cations. Volume 15. Optical Society of America – Trends in Optics and Photonics (2000)163–169
48. Liang, J.: A New Method to Precisely Measure the Wave Aberrations of the Human Eye witha Hartmann-Shack Wavefront Sensor. PhD thesis, Departmentof Mathematics, UniversitatHeidelberg (1991)
49. Klein, S.A.: Optimal corneal ablation for eyes with arbitrary Hartmann-Shack aberrations.J. Opt. Soc. Am. A 15 (1998) 2580–2588
50. Keating, M.P.: Geometric, Physical, and Visual Optics,second edition. Butterworth-Heinemann Ltd. (2002)
51. Bennett, A.G., Rabbetts, R.B.: Clinical Visual Optics.Butterworth-Heinemann Ltd. (1998)52. He, J.C., Burns, S.A., Marcos, S.: Monochromatic aberrations in the accommodated human
eye. Vision Research 40 (2000) 41–4853. Thibos, L.N., Applegate, R., Schwiegerling, J.T., Webb, R., Members, V.S.T.: Standards for
reporting the optical aberrations of eyes. In Lakshminarayanan, V., ed.: Vision Science andits Applications. Volume 35. Optical Society of America – Trends in Optics and Photonics(2000) 232–244
54. Zernike, F.: Beugungstheorie des schneidenverfahrensund seiner verbesserten form, derphasenkontrastmethode. Physica 1 (1934) 689–704
55. Canny, J.F.: A computational approach to edge detection. IEEE Transaction on PatternAnalysis and Machine Intelligence 8 (1986) 679–698
56. Marcos, S., Burns, S.A., Moreno-Barriuso, E., Navarro,R.: A new approach to the study ofocular chromatic aberrations. Vision Research 39 (1999) 4309–4323