vision-based method for detecting driver drowsiness and distraction …web.yonsei.ac.kr/hgjung/ho gi...
TRANSCRIPT
Optical Engineering 50(12) 127202 (December 2011)
Vision-based method for detecting driver drowsinessand distraction in driver monitoring system
Jaeik JoSung Joo LeeYonsei UniversitySchool of Electrical and Electronic Engineering134 Sinchon-dong Seodaemun-guSeoul Seoul 120-749 Republic of Korea
Ho Gi JungHanyang UniversitySchool of Mechanical Engineering222 Wangsimni-ro Seongdong-guSeoul Seoul 133-791 Republic of Korea
Kang Ryoung ParkDongguk UniversityDivision of Electronics and Electrical Engineering26 Pil-dong 3-ga Jung-guSeoul Seoul 100-715 Republic of Korea
Jaihie KimYonsei UniversitySchool of Electrical and Electronic Engineering134 Sinchon-dong Seodaemun-guSeoul Seoul 120-749 Republic of KoreaE-mail jhkimyonseiackr
Abstract Most driver-monitoring systems have attempted to detect ei-ther driver drowsiness or distraction although both factors should beconsidered for accident prevention Therefore we propose a new driver-monitoring method considering both factors We make the followingcontributions First if the driver is looking ahead drowsiness detectionis performed otherwise distraction detection is performed Thus thecomputational cost and eye-detection error can be reduced Second wepropose a new eye-detection algorithm that combines adaptive boost-ing adaptive template matching and blob detection with eye validationthereby reducing the eye-detection error and processing time significantlywhich is hardly achievable using a single method Third to enhance eye-detection accuracy eye validation is applied after initial eye detectionusing a support vector machine based on appearance features obtainedby principal component analysis (PCA) and linear discriminant analysis(LDA) Fourth we propose a novel eye statendashdetection algorithm thatcombines appearance features obtained using PCA and LDA with sta-tistical features such as the sparseness and kurtosis of the histogramfrom the horizontal edge image of the eye Experimental results showedthat the detection accuracies of the eye region and eye states were 99and 97 respectively Both driver drowsiness and distraction were de-tected with a success rate of 98 Ccopy2011 Society of Photo-Optical InstrumentationEngineers (SPIE) [DOI 10111713657506]
Subject terms driver monitoring systems drowsy driver detection drowsinessdistractions inattention blink detection machine learning computer vision featureselection
Paper 110469RR received May 2 2011 revised manuscript received Oct 12 2011accepted for publication Oct 12 2011 published online Dec 2 2011
1 IntroductionDriver inattention is one of the major causes of highway caraccidents According to the US National Highway TrafficSafety Administration (NHTSA) in the US in 2007 sim6100fatalities occurred as a result of car accidents related to driverinattention such as distraction fatigue and lack of sleep1ndash3
Consequently safe-driving assistant systems which measurethe level of driver inattention and provide a warning whena potential hazard exists have received a great deal of at-tention as a measure to prevent accidents caused by driverinattention
Generally driver inattention relates to the degree of non-concentration when driving it is usually a result of drowsi-ness and distraction4 Drowsiness involves a driver closinghis eyes because of fatigue and distraction involves a drivernot paying sufficient attention to the road despite the presenceof obstacles or people Previous driver-inattention monitor-ing systems (DIMSs) have detected driver drowsiness or dis-traction but not both5ndash23 Although these systems can detectdrowsiness or distraction a car accident can occur if it cannotdetect both Because driver distraction and drowsiness are themain factors in vehicle crashes both should be consideredwhen measuring driver-inattention level24 In this contextwe propose a new DIMS that can detect both drowsiness anddistraction By measuring both causes of inattention the pro-
0091-32862011$2500 Ccopy 2011 SPIE
posed system can improve the security level of the previousDIMSs which detected either drowsiness or distraction
Many inattention-monitoring systems have been devel-oped to prevent highway car accidents These systems canbe divided into two categories as shown in Tables 1 and 2The first is to detect driving behavior by monitoring vehi-cle speed steering movements lane keeping accelerationbraking and gear changing25 The other is to detect driverbehavior which includes two approaches such as a visualfeaturendashbased approach26 and a physiological featurendashbasedapproach27 The former is based on tracking the driverrsquos headand eye movements and recognizing the torso and armlegmotion The latter measures the heart and pulse rate as wellas the brain activity
Driving-behavior informationndashbased methods are af-fected by the vehicle type and the individual variation in driv-ing behavior Physiological featurendashbased approaches are in-trusive because the measuring equipment must be attachedto the driver Thus visual featurendashbased approaches have re-cently become preferred because they are nonintrusive to thedriver In this work we also focus on the visual featurendashbasedapproach to monitor driver inattention
A great deal of previous visual featurendashbased researchhas been studied to monitor driver inattention These can bedivided into two systems drowsiness detection systems anddistraction detection systems The drowsiness detection sys-tem detects drowsiness using features such as eyelid move-ment facial expression yawning nodding etc Many at-tempts to develop a drowsiness detection system have been
Optical Engineering December 2011Vol 50(12)127202-1
Jo et al Vision-based method for detecting driver drowsiness and distraction
Table 1 Summary of previous research for detecting driver inattention
Category Method Strength Weakness
Driving behavior informationa Monitoring vehicle speedsteering movement lanekeeping accelerationbraking and gearchanging
It does not require anadditional camera orbiosensors
It is affected by vehicletype and the individualvariation in driver drivingbehavior
Physiologicalfeaturendashbasedapproachesb
Measuring the heart andpulse rate and brainactivity
It is possible to accuratelymeasure the inattentionlevel
It is intrusive becausemeasurement equipmentmust be attached to thedriver
Driver behaviorinformation
Visualfeaturendashbasedapproachesc
Tracking head and eyemovements recognizingthe facial expression aswell as torso arm and legmotion
It is nonintrusive to thedriver
It requires an additionalcamera device
aReference 25bReference 26cReference 27
reported in the literature5ndash17 28ndash31 For example Ueno et aldescribed a system for drowsiness detection that recognizeswhether a driverrsquos eyes are open or closed if open the de-gree of openness is measured6 DrsquoOrazio et al introduceda system to detect driver fatigue using eyelid movement in-formation including new drowsiness parameters [frequencyof eye closure (FEC) and eye-closure duration (ECD)]17
The main contribution of their work was the introductionof a reliable eye-detection approach that does not imposeany constraints on the driver and does not require any pre-processing to segment eye regions They demonstrated thatthe performance of their system is comparable to thosethat utilize physiological signals Vural et al introduceda system to characterize a driverrsquos state from hisher fa-cial expression information28 Saradadevi and Bajaj pro-
posed a method for monitoring driver fatigue using yawninginformation29
Some studies detect more than one of these pieces ofinformation and combine them to improve robustness30 31
However because the aforementioned methods only detectdriver drowsiness they cannot prevent car accidents causedby distraction This is because car accidents that result fromdriver distraction can occur when a driver does not lookstraight ahead That is even though the driverrsquos eyes are notclosed because of fatigue a car accident can still occur ifhe or she is distracted To develop a safer driver-monitoringsystem these two risks should be monitored simultaneously
The distraction-detection system uses head pose or gazeinformation to detect if a driver is paying sufficient attentionto the road when obstacles or people on the road are detected
Table 2 Summary of previous ldquovisual feature based approachesrdquo to monitor driver inattention
Category Method Strength Weakness
Drowsinessdetection system
Eyelid movementa
facial expressionb yawningc
noddingd more than one of theabovee
Nonintrusive to the driver Cannot detect the distraction ofthe driver
Distractiondetection system
Head orientationf
eye orientationg
head and eye orientationh
Nonintrusive to the driver Cannot detect the drowsiness ofthe driver
Hybrid method(proposed method)
This method detects both thedistraction and drowsiness of thedriver
Able to detect both thedrowsiness and distractionof the driver
Processing time increases slightlycompared to the drowsinessdetection system or thedistraction detection system
aReferences 6 and 17bReference 28cReference 29dReference 64eReferences 30 and 31fReferences 18 20 21 and 65ndash68gReferences 22 61 and 69hReference 23
Optical Engineering December 2011Vol 50(12)127202-2
Jo et al Vision-based method for detecting driver drowsiness and distraction
Recent surveys on head orientation and gaze from imagesequences can be found in Refs 18 and 19
Among various methods we focused on the previousdriverrsquos gaze and head orientation methods developed forvehicular environments For example Hattori et al intro-duced a forward warning system that employs driver behav-ioral information20 Their system determines driver distrac-tion when it detects that the driver is not looking straightahead Trivedi et al recognized driver awareness using headpose information obtained by a localized gradient orientationhistogram and support vector regressors (SVRs)21 Smithet al analyzed global motion and color statistics to robustlytrack a driverrsquos facial features22 Using these features theyestimated continuous gaze direction However this methodcannot always localize facial features when the driver wearseyeglasses makes conversation closes his eyes or rotateshis head It also failed to work at night Kaminski et al in-troduced a system to compute both head orientation basedon a geometrical model of the human face and eye-gaze de-tection based on a geometrical model of the human eye23
They estimated continuous head orientation and gaze direc-tion However the above-mentioned systems for automotiveapplications did not deal with the problem of driver drowsi-ness That is although the driver is looking ahead he orshe can drive while drowsy Therefore a method that moni-tors both visual distractions and drowsiness is needed for thedriver-monitoring system
Although a technical study32 has reported an intelligentvehicle safety system that detects distraction and drowsinessin real road test conditions such a system differs from oursystem in the following aspects
First it independently detects driver drowsiness and dis-traction using commercialized products Smart Eye Pro and3D head model respectively These two products are simul-taneously operated in all cases On the other hand our systemdivides the driverrsquos state into two cases and then if the driveris looking ahead the system operates the drowsiness detectorHowever if the driver is not looking ahead the system op-erates the distraction detector Therefore the computationalcost of the system can be decreased The other advantage ofthe proposed method is that the eye-detection errors and theconsequent false alarms for drowsiness are decreased in thecase of large head rotation In general eye detection duringlarge head rotation is difficult because the texture and shape ofthe eyes change markedly as a result of head rotation There-fore in the proposed method eye detection is performed onlyin the case of drowsiness detection (when the driver is lookingahead) Both facial border lines and nose center lines are usedin the case of distraction detection (when the driver is notlooking ahead) without eye detection Thus eye-detectionerrors and the consequent false alarms for drowsiness can bedecreased
Second experimental results for blink detection have notbeen provided in the technical study whereas they have beenincluded in our paper Third the study reports that Smart EyePro does not work well when the driver wears eyeglasses orsunglasses the drivers who were tested did not wear glassesIn contrast our system exhibits good performance regardlessof the use of glasses
Fourth Sec 333 of the technical study32 states that3-D head model estimation requires initial calibrationwhich causes inconvenience to the driver and requires alonger processing time On the other hand the proposed
method does not require initial calibration Fifth becausetwo 8-mm IDS uEye USB-cameras were used in thatstudy32 the system was bulky and economically infeasi-ble In contrast only one camera is used in the proposedsystem
In order to measure both drowsiness and distraction in theproposed method we first detect the face region and estimatethe driverrsquos head orientation to determine the gaze direc-tion of driver Accordingly the proposed system determineswhether the driver is looking ahead If the estimated head ori-entation indicates that the driver is not looking ahead thenthe system monitors the driver-distraction level and soundsan alarm when the level is dangerously high If the esti-mated head orientation indicates that the driver is lookingahead then the system detects the driverrsquos eyes to determinethe drowsiness level In this case the system focuses solelyon driver drowsiness The driver-drowsiness level is mea-sured as PERCLOS which is the percentage of eye closuretime during a certain time interval12 Similarly the distrac-tion level is measured as PERLOOK which is the percent-age of time spent not looking ahead during a certain timeinterval
The contributions of the proposed composite method areas follows First the computational cost of system can bedecreased Second eye-detection errors and the consequentfalse alarms for drowsiness are decreased in the case oflarge head rotation Third we developed a hardware unitcapable of eliminating specular reflection due to sunlightreflected by a driverrsquos glasses This unit is essential tothe system because the specular reflection makes it diffi-cult to detect the eyes The unit comprises near-infrared(NIR) illuminators a camera and a narrow bandpass fil-ter whose pass band matches the wavelength of the illu-minator The detailed configuration of the unit is describedin Sec 22 Fourth we propose an eye-detection algorithmthat combines adaptive boosting (adaboost) adaptive tem-plate matching and blob detection with eye validation Thisfacilitates accurate eye detection even when the driverrsquoshead is slightly rotated or the eyes are closed Fifth weintroduce a novel eye-statendashdetection algorithm that com-bines appearance features obtained using PCA and LDAwith statistical features such as the sparseness and kurto-sis of the histogram from the horizontal edge image of theeye
The remainder of the paper is organized as follows InSec 2 we describe the proposed DIMS which comprises eyedetection eye-state detection and inattention determinationIn Sec 3 we present experimental results with a databasecollected from a vehicle under various conditions Finallythe conclusion is provided in Sec 4
2 Proposed Driver-Monitoring Method
21 Overview of Proposed MethodThe proposed method consists of face-detection head-orientationndashestimation eye-detection eye-statendashdetectiondrowsiness-detection and distraction-detection steps asshown in Fig 1 In this work we used the methodsfor face detection and head-pose estimation proposed inRef 33 In the face-detection step the face region is foundwithin the driverrsquos entire facial image to remove unnecessarybackground and to set the regions of interest (ROIs) used in
Optical Engineering December 2011Vol 50(12)127202-3
Jo et al Vision-based method for detecting driver drowsiness and distraction
Fig 1 Flowchart of the proposed driver-monitoring system
the yaw anglendashestimation step In the yaw anglendashestimationstep the left and right borders and center of the driverrsquosface are extracted to estimate the driverrsquos yaw In additionthe normalized mean and standard deviation of the horizon-tal edge-projection histogram are extracted to estimate thedriverrsquos pitch In the estimation step of the driverrsquos head ori-entation using the extracted features the driverrsquos yaw andpitch angles are determined by the ellipsoidal face model andSVR respectively33
The distraction and drowsiness are determined from thehead pose of a driver First the proposed system monitorswhether the driver is paying adequate attention to the roadahead based on the estimated head pose If the frequencyof time in which the driver does not see the road aheadover a certain period of time is greater than a predeterminedthreshold then a warning signal is produced by the distractiondetection Even if the driver is looking straight ahead if thepercentage of time that the driver closes hisher eyes duringa certain period of time exceeds a predetermined threshold awarning signal is also generated by the drowsiness-detection
system A detailed description of each stage can be found inSec 23
22 Image Acquisition MethodThe proposed system consists of two 850-nm illuminators(LED 850-66-60)34 a camera (EC650) (Ref 35) having alens (ML 0614) of 6-mm focal length36 a laboratory-madedevice for controlling the illuminators and a narrow band-pass filter (NT43-148) (Ref 37) placed in front of the cameraExcept for the device that controls the illuminators all theother components are commercially available In our experi-ments we also used two types of vehicles a sedan (GrandeurHyundai Motors) (Ref 38) and a sport-utility vehicle [(SUV)Sportage KIA motors]39
To test the applicability of the system images were ac-quired for the two types of vehicles these images were nearlysimilar When the driver wears eyeglasses glint may be gen-erated by NIR light which may hide the entire eye region Toresolve this issue in the proposed system the camera tiltingangle is constrained to sim45 deg below the driverrsquos face In
Optical Engineering December 2011Vol 50(12)127202-4
Jo et al Vision-based method for detecting driver drowsiness and distraction
Fig 2 Images obtained in various wavelengths using sunglasses(a) 700 nm (b) 750 nm (c) 850 nm and (d) 950 nm
addition the installation height of the proposed device is setto sim70 cm from the driverrsquos feet
A system that can operate in various vehicle environmentsshould satisfy the following three conditions
1 The system should work during both daytime andnighttime Because there is no sunlight at night weprovide additional NIR illumination to capture thedriverrsquos facial image Because visible lights can daz-zle drivers when driving NIR illuminators were usedto capture images We also adjusted the shutter speedof the camera automatically to prevent image satura-tion
2 The system should be operative for drivers who wearsunglasses We performed experiments to identify theproper wavelength of NIR illumination To observethe transmittance of various colors of sunglasses ac-cording to various wavelengths of NIR illuminatorswe conducted tests with black brown blue yellowand pink semitransparent sunglasses As an experi-ment we used an electronically tunable liquid-crystalfilter that has 10-nm bandwidth and a pass-band rangefrom 650 to 1100 nm to capture the images of userswearing sunglasses in the range of 700ndash950 nmFigure 2 depicts the captured face images of a userwearing black sunglasses at 700- 850- and 950-nmwavelengths From this it is evident that the blacksunglasses can be transmitted by the NIR illumina-tion which has a longer wavelength than 750 nmIn the experiments with various wavelengths wefound that the transmission increased from 700 tosim850 nm and then decreased after sim900 nm Wecan confirm in Fig 2 that the light in 700 nm isnot transmitted but that the light in 850 nm is welltransmitted into the sunglasses In Fig 2(d) we canconfirm that the brightness in 950 nm is decreasedbecause the sensor response of the camera is de-creased in accordance with the increase in wave-length Thus we selected 850 nm as the wavelength ofthe NIR illuminator considering the good transmis-sion camera-sensor response and lack of dazzlingeffect
3 The system should be operative when drivers weareyeglasses on which reflected sunlight is generatedThis problem is often encountered in a real automotiveenvironment as shown in Fig 3 A method was reportthat utilized a polarizing filter to remove the reflectedsunlight40 However because sunlight includes vari-ous directional lights it is unknown which direction ofthese lights caused the reflection Thus a polarizingfilter which eliminates the reflection by only pene-
Fig 3 Images of reflected sunlight on eyeglasses
trating specific directional light has limits In the ex-periment with a polarizing filter the reflection couldbe removed only when the directions of the polarizingfilter and the light causing the reflection matched Be-cause the directions of light that causes the reflectionscan be changed but the direction of the polarizingfilter cannot be changed in real time when drivingthe polarizing filter is unsuitable for vehicle appli-cation Moreover because only specific light passesthrough the polarizing filter the image brightness wasdecreased
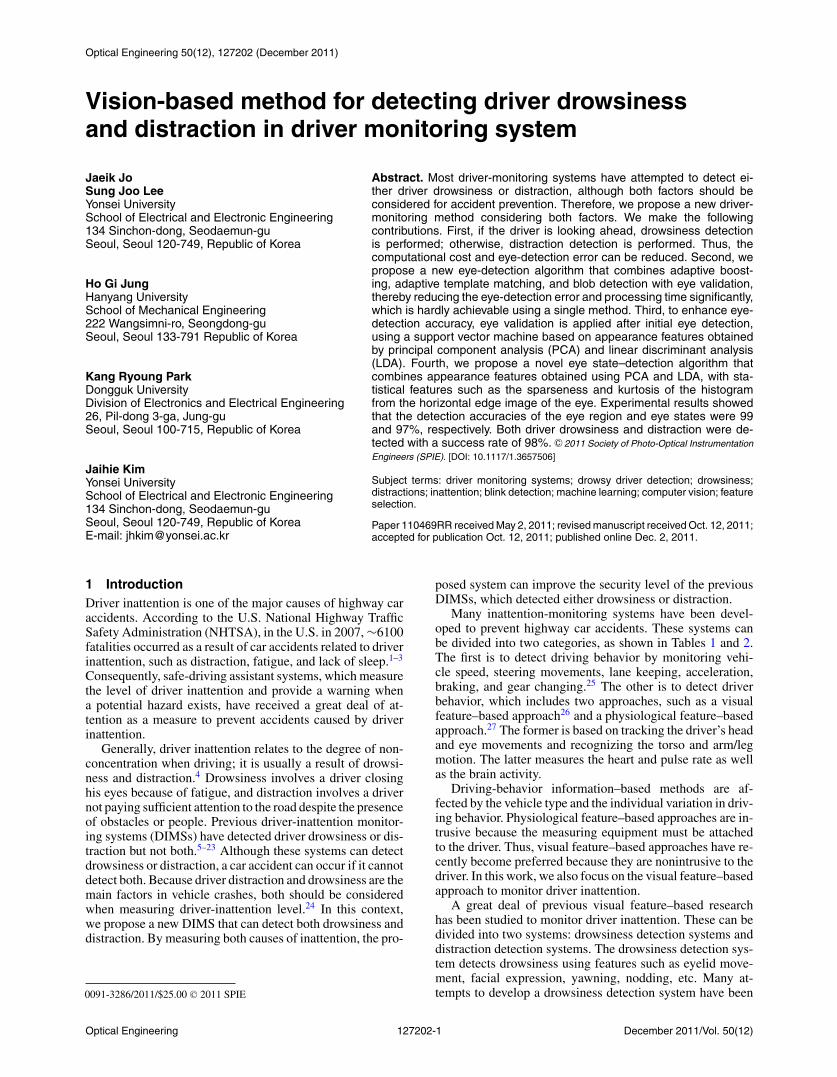
To overcome these problems and remove the reflected sun-light we use a NIR illuminator and a narrow bandpass filterwhose pass band matches the illuminator First the narrowbandpass filter is installed in front of the camera and restrictsthe incoming wavelength of light to 850 nm with a centralwavelength tolerance of 2 nm37 In the various wavelengthsof sunlight only sunlight with a wavelength of 850 nm passesthrough the narrow bandpass filter and lights of most wave-lengths that caused the reflection are diminished Two high-power light-emitting diode (LED) illuminators34 cast a lightwith 850 nm on the driverrsquos face Because the driver sits in-side a car in which the amount of sunlight is not greater thanthat on the outside we can make the effect of the high-powerLED illuminators greater than the sunlight Consequentlythe reflections on glasses can be eliminated A configurationof our system is shown in Fig 4 and the experimental resultsfor removing reflected sunlight using a NIR illuminator anda narrow bandpass filter are shown in Fig 5
The VTI report32 for driver monitoring briefly mentionsthe use of NIR illuminators and a bandpass filter commercialproducts are used and details such as the wavelengths of NIRilluminators and the filter are not provided Although NIRilluminators and a bandpass filter have been used previouslyfor eye detection in our study we experimentally determinedthe optimal wavelengths of these components To the bestof our knowledge the details of the NIR illuminators andbandpass filter have been reported for the first time in ourstudy
Optical Engineering December 2011Vol 50(12)127202-5
Jo et al Vision-based method for detecting driver drowsiness and distraction
Fig 4 Developed driver-monitoring device (Ref 33)
23 Eye-Detection Method Considering DriverrsquosHead Pose
231 Determination of the range of eye detectionconsidering head pose
The face-detection and head-pose estimation process is per-formed before detecting the driverrsquos eyes33 Through the esti-mated head pose if it is determined that the driver is lookingahead the system detects the eyes to determine drowsinessOtherwise the system does not detect the eyes but does mon-itor the driverrsquos distraction level which is the percentage ofareas viewed other than the front for a certain time intervalThe reasons why the proposed system does not detect theeyes when the driver is not looking ahead are as followsFor driver monitoring the information regarding eye blink-ing is required to detect driver drowsiness However an earlysymptom of drowsy driving is that drivers begin to fall asleepwhen looking ahead but not to the side In light of this phe-nomenon the proposed system does not detect the eyes whenthe driver is not looking ahead This can also solve the prob-lem of high computational cost and low accuracy of driver-monitoring systems for detecting rotated eyes Moreover ifdrivers look at a nonfrontal area when driving this is as haz-
Fig 5 Experimental results for removing a reflected sunlightwithwithout NIR illuminators and a narrow bandpass filter (a) withouta filter and illuminators (b) with a filter and illuminators
ardous as drowsy driving Thus it should be detected by thedistraction-detection method and an alarm signal should beset off Therefore we propose a driver-monitoring systemthat detects the eyes only when the driver looks ahead andmonitors driver distraction when the driver does not lookahead
Before the system detects the eyes it is necessary to de-termine whether the driver is facing the front of the vehicleIn normal straight-road driving when drivers are paying at-tention to the road ahead their facial direction is withinapproximately plusmn15 deg from the straight normal From thisfact the range of facial directions spanning plusmn15 deg is desig-nated ldquofrontrdquo and facial directions greater than plusmn15 deg aredesignated ldquononfrontrdquo The validity of this figure has beenproven in our real-driving test and also in the experimentsconducted by Toyota41 In the experiments by Toyota theysuggested plusmn15 deg as the yaw-angle condition for the frontangle of a driver The same result is obtained in our real-driving experiments In order to measure the ground-truthdata for a head orientation we used an electromagnetic sen-sor called Patriot as shown in Fig 642 The experimentalresult is shown in Fig 7
From the above real-driving test we can confirm that theyaw angle of a driver facing the front of a vehicle is withinplusmn15 deg In the graph the angles are greater or less than thisyaw-angle range when the driver views the side mirror orside windows Except for these cases the head-pose rangeof driver is included in the above-mentioned range of frontviewing within plusmn15 deg
Fig 6 Patriot sensor attached behind the driverrsquos head (Ref 33)
Optical Engineering December 2011Vol 50(12)127202-6
Jo et al Vision-based method for detecting driver drowsiness and distraction
Fig 7 Facial yaw angle distribution in a real driving test (a) driver 1(b) driver 2 and (c) driver 3
The proposed system only detects eyes within this yawangle range If the estimated facial yaw angle is withinplusmn15 deg then the eye ROI is set by using the left and rightborder line centerline and statistical position of the eye inthe face The system then detects the eyes only in this re-
gion The proposed eye-detection algorithm is presented inSec 232
232 Eye-detection methodIn a previous study Scheirer et al43 proposed two dif-ferent approachesmdasha machine learning approach and acorrelation filter approachmdashfor eye detection under un-favorable acquisition circumstances such as low illumi-nation distance variation pose variation and blur Thiseye-detection method is inconvenient because visible lightis required at nighttime which distracts the driver or causespupil contraction In another study Whitelam et al44 an-alyzed eye detection across three different bands (iethe visible multispectral and short-wavendashinfrared (SWIR)bands) in order to illustrate the advantages and limitationsof multiband eye localization However they did not usea narrow bandpass filter for the NIR camera hence thecaptured eye image may contain a large amount of sunlightwhich can make it difficult to locate the eye region More-over eye validation is not conducted which may result infalse eye detection Our system adopts a narrow bandpassfilter and eye validation in order to improve eye-detectionperformance
Our eye-detection algorithm is developed by combin-ing eye adaboost45 adaptive template matching46 blobdetection47 and eye validation The adaboost method hasbeen widely adopted for detecting various facial compo-nents such as the face nose mouth and eyes where weakclassifiers are combined in a cascade this yields a strongerclassifier45 In our system we used the standard OpenCVHaar cascade to detect the face and eyes
The adaptive template-matching method is a digitalimage-processing technique for identifying the correspond-ing parts that match a template in an input image The tem-plate and eye candidate images are compared to determinewhether the two images have a matching region One methodfor template is given by
R(x y) =sum
xprime yprime [T (x prime yprime) minus I (x + x prime y + yprime)]2radicsumx primeyprime T (x prime yprime)2middotsumx primeyprime I (x + x prime y + yprime)2
(1)
where I denotes the input image T denotes the template andR(x y) denotes the matching result at position (x y) Theranges of xprime and yprime are [0 w ndash 1] and [0 h ndash 1] respectivelyw and h are the width and height of the template imagerespectively If the matching value R(x y) is small then itindicates higher similarity if it is large then it indicates lowersimilarity Among all the calculated R(x y) the position(x y) where R(x y) is minimized is selected as the finalmatching position The shape of the eye slightly changes inevery frame hence it is impossible to detect all possible eyeshapes with one fixed template Thus the template is updatedin every frame by the eye image that is successfully detectedin the previous frame
Blob detection is explained as follows From the origi-nal eye image a binary image is obtained on the basis of theadaptive threshold that is set with the mean value of the blockthen it is subjected to the morphology step In the morphol-ogy step there are two phases erosion and dilation48 Firstthe white pixels are expanded and the black pixels are dimin-
Optical Engineering December 2011Vol 50(12)127202-7
Jo et al Vision-based method for detecting driver drowsiness and distraction
Fig 8 Flowchart of proposed eye-detection algorithm
ished by an erosion operator Because the remaining blobs ofthe eyeglass frame may be wrongly detected as eyes the eye-glass frame should be removed by an erosion operator Nextthe black pixels of the eye region diminished by the erosionoperator are expanded by a dilation operator This processof sequentially erosion and dilation is defined as the openingprocess and it has the effect of noise elimination48 After theopening process is applied twice a large blob is generatedfor an eye and small blobs are generated for noise The label-ing process is performed with all the remaining blobs Thusthe remaining blobs are grouped with neighboring blobs andlabeled according to their connectivity48 Therefore all theblobs are represented as being isolated After that all thepixel ldquopositionsrdquo of each isolated blob can be obtained Ac-cordingly the ldquosizerdquo of the blob is calculated as the numberof the pixels of the blob In addition the width and heightof the outermost rectangular box including the blob can beobtained Then the ratio of the height to the width can becalculated as the ldquoshaperdquo of the blob The position size andshape are finally used to determine the location of the eyeOpen source is used for blob detection47
These methods are combined to detect the eyes quicklyand accurately If adaboost alone is used for eye detectionthen it has a great deal of computational cost and cannot de-tect closed eyes To resolve these problems in the first frameeye adaboost is used in the eye-detection step and after theeye verifier checks that the eyes are correctly detected thedetected eye image is saved as a template In the next framethe eyes are detected by adaptive template matching using thepreviously saved template and the template is then updatedby the newly detected eye image This is better than onlyusing eye adaboost in every frame in terms of computationalcost and performance of closed-eye detection However eyeshapes are changeable from an open shape to a closed shapeIf the shape of an opened eye is saved as the template and the
closed eye appears at the next frame then the eyes cannot bedetected by the adaptive template-matching method Thuswhen the adaptive template-matching method fails to detecteyes adaboost is used again to detect the eyes If adaboostalso fails to detect the eyes then the blob-detection method isapplied to do so When the eyes cannot be detected by thesethree eye detectors the previous position of the eye is keptFigure 8 depicts a flowchart of the eye-detection algorithm(a detailed explanation for eye detection will be provided)
The system attempts to realize eye detection using theadaboost eye detector45 The eye adaboost has good per-formance for detecting eyes when the driverrsquos head pose isfrontward However as shown in Fig 9 it has the disadvan-tage of missing eyes when the driverrsquos head pose is rotated orwhen the driverrsquos eyes are closed It also takes a long time todetect the eyes if the eye adaboost is applied in every frame
To resolve these problems with adaboost the adaptivetemplate-matching method was combined with adaboost Inthe first frame the system detects eyes by using adaboostand then saves the detected eye images to a template Inthe next frame adaptive template matching is applied tolocate the eyes As such even the rotated or closed eyesthat were not detected by adaboost can be detected Theadvantage of adaptive template matching is that it requiresless computational cost than adaboost The adaboost needs30 times more computational cost than the adaptive templatemethod As such the eye-detection method combined withadaboost and adaptive template matching is more efficientthan using adaboost alone This combination is robust tohead-pose variation and can detect a closed eye as shown inFig 10
However because the eye detector using these combina-tions may still fail to find eyes the blob-detection methodis additionally supplemented to the combination to improvethe performance of eye detection In particular blob detection
Optical Engineering December 2011Vol 50(12)127202-8
Jo et al Vision-based method for detecting driver drowsiness and distraction
Fig 9 Eye-detection results obtained using adaboost (a) Frontal face (success) (b) rotated face (fail) and (c) closed eye (fail)
improves the detection rate of closed eyes that are not de-tected by adaboost and template matching and saves process-ing time Figure 11 shows a flowchart of the blob-detectionmethod
From the original eye image a binary image is obtainedby the adaptive threshold that is set with the mean value of theblock and then passes through the morphology step In themorphology step there are two phases erosion and dilationFirst the white pixels are expanded and the black pixels arediminished by an erosion operator Because the remainingblobs of the eyeglass frame can be misrecognized as eyesthe eyeglass frame should be removed by an erosion operatorto prevent this from happening Next the diminished blackpixels of the eye region by the erosion operator are expandedby a dilation operator This process of sequentially passingthrough erosion and dilation is defined as the opening processand has an effect of noise elimination48 After the openingprocess is applied twice a large blob for an eye and smallblobs for noise are finally generated All remaining blobsare grouped with neighbor blobs into individual groups anda labeling process ensues To apply the labeling processwe used an open source of blob detection (this source codeis available in Ref 47) The location of the eye is finallydetermined by considering the size shape and position ofblobs
In the eye-detection step the eye-validation process playsan important role in checking whether the detected eyeregion actually contains eyes As shown in Fig 12 this isan eye-validation process that validates the eye detected byadaboost adaptive template matching and blob detectionIf a noneye region is falsely found by the eye detector andsaved in the template without any further validation pro-cess the region containing no eye will be continuously de-tected by the adaptive template matching in the next frameThus an eye-validation process is needed to prevent errorpropagation
In the eye-validation process we used two classicalfeature-extraction methods namely principal component(PC) analysis49ndash52 (PCA) and linear discriminant analysis(LDA)49ndash51 which were used in a different application in(Refs 51 and 53) In this paper we use the PCA + LDAmethods to extract features for eye validation
PCA is a well-known unsupervised algorithm for linearfeature extraction it is a linear mapping that uses the eigen-vectors with the largest eigenvalues In the PCA methodthe pixels of an eye image are ranked as a column vectorxi = (x1i x2i xni)T isin Rn and then by the l matrix X= x1 x2 xl denotes the training sample set that con-sists of l eye images After the mean vector of X is calculatedcentered data are obtained by subtracting the mean from allsamples The PCA can be used to find a linear transformationorthonormal matrix WPCA[m times n(m n)] mapping the orig-inal n-dimensional feature space into m-dimensional featuresubspaces The reduced feature vector yi is defined by
yi = W TPCAxi (i = 1 2 l) (2)
The columns of WPCA are the m eigenvectors associatedwith the m largest eigenvalues of the scatter matrix S whichis defined as
S =lsum
i=1
(xi minus μ)(xi minus μ)T (3)
where μ is the mean of all images in the training setLDA is a supervised learning method that utilizes the cat-
egory information associated with each sample The goal ofLDA is to maximize the between-class scatter while minimiz-ing the within-class scatter The within-class scatter matrixSW and between-class scatter matrix SB are defined as
SB =csum
j=1
(μ j minus μ)(μ j minus μ)T (4)
Fig 10 Eye-detection results obtained by combining with adaptive template matching and adaboost (a) Frontal face (success) (b) rotated face(success) and (c) closed eye (success)
Optical Engineering December 2011Vol 50(12)127202-9
Jo et al Vision-based method for detecting driver drowsiness and distraction
Fig 11 Flowchart of the blob-detection method (a) open eye and (b) closed eye
SW =csum
j=1
N jsumi=1
(x j
i minus μ j)(
x ji minus μ j
)T (5)
where x ji is the irsquoth sample of class j μj is the mean of class
j μ is the mean image of all classes Nj is the number ofsamples of class j and c is the number of classes
In order to guarantee that SW does not become singular werequire at least n + c samples In practice it is difficult to ob-tain so many samples when the dimension of feature n is veryhigh PCA + LDA is proposed to solve this problem51 52
Let the output of PCA be the input of LDA and finally thefeature vectors of eye images are given by
zi = W TLDAW T
PCAxi (i = 1 2 l) (6)
Now let us return to our eye-validation process Eye val-idation is composed of a training and testing process asshown in Fig 12 In the training step the eye-template im-age of 40times26 pixels in the training database is defined asthe column vector of 1040times1 pixels The column vector isthen reduced to an eigenvector with 13 dimensions by us-ing PCA which seeks a projection that best represents theoriginal data in a least-squares sense The eigenvector is re-duced to 11 dimensional spaces (features) by using LDAwhich seeks a projection that best separates the data in aleast-squares sense After the features that best separate eyeand noneye are normalized they are entered into a supportvector machine (SVM) and trained to classify eye and non-eye well An SVM is a classifier that finds the maximum
Fig 12 Eye-validation process
Optical Engineering December 2011Vol 50(12)127202-10
Jo et al Vision-based method for detecting driver drowsiness and distraction
margin hyperplane that optimally separates the data into twocategories for the given training set In general an SVM canbe represented by54
f (x) = sgn
(ksum
i=1
αi yi K (x xi ) + b
) (7)
where k is the number of data points and yi isin ndash1 1 isthe class label of training point xi The coefficients αi arefound by solving a quadratic programming problem with lin-ear constraints and b is a bias To obtain a good classificationperformance a SVM needs to choose a ldquogoodrdquo kernel func-tion K(x xi) In this paper we used a radial basis function(RBF) kernel as shown in Eq (8) because it generally hasfewer numerical difficulties55
KRBF(x x prime) = exp(minusγ ||x minus x prime||2) (8)
In the testing step after features are extracted from theeye image in the testing set by PCA + LDA in the same wayas the training step the extracted features are entered into theSVM to learn the classification of eye and noneye Figure 12depicts this eye-validation process for training and testingWhen the eye validation was added to the eye-detection al-gorithm the accuracy of eye detection was improved Thisresult will be shown in the Sec 3 experiment
24 Eye-State Detection (Determination of Openor Closed Eye)
Drivers that are sleepy exhibit several visual behaviors thatare easily observable from the changes in their facial fea-tures such as the eyes head and face There are many pa-rameters of drowsiness that reflect the vigilance level of adriver such as eye-closure duration (ECD) frequency of eyeclosure (FEC) average eye-closure speed (AECS) and per-centage of eye closure over time (PERCLOS)56 57 For all ofthem the determination of eye state open or closed eye isa necessary step In this section we introduce the novel fea-tures for eye-state analysis The performance of determiningeye status (opening and closing) is enhanced by combiningthe appearance features by PCA and LDA and the statisticalfeatures such as the sparseness and kurtosis of the histogramfrom the eye-edge image
241 Feature extractionPrincipal component and linear discriminant analyses Thefeatures used to determine open or closed eye are 12 dimen-sional features obtained by PCA + LDA This method isthe same as the eye-validation process explained in Fig 12PCA + LDA exhibits better performance than PCA alonewhen there are few samples in each class51
Sparseness and kurtosis Other features for determiningopen or closed eyes are the sparseness and kurtosis of thehistogram from the eye-edge image These features are ex-tracted to classify open and closed eyes by using horizontaledge image processing Here we briefly explain how thesefeatures are extracted The Sobel operator performs a 2-Dspatial gradient measurement on the detected eye imageTypically this is calculated by the absolute gradient mag-nitude at each point in an input gray-scale image The Sobeledge detector uses a pair of 3times3 convolution masks one es-timating the gradient in the horizontal direction (columns)and the other estimating the gradient in the vertical direction
(rows) A horizontal edge image is obtained using a horizon-tal Sobel convolution mask By applying a p-tile thresholdmethod to the horizontal edge image it is transformed intoa binary image58 From the training data we experimen-tally obtained 7 by the p-tile method The p-tile thresholdmethod uses the size and area of eye to obtain a binary im-age For example if eye occupy p of total area gray-valuehistogram of input image is divided by the percentage andthen a threshold is selected considering the p pixel for eyeThe binarized image is projected onto the horizontal axis(x-axis) and a vertical projection histogram is then acquiredas shown in Fig 13 The histogram of the open eye exhibitsa peak that is concentrated into vertical lines This peak iscaused by the brightness difference of the pupil specularreflection and iris In contrast the histogram of the closedeye exhibits a flat distribution on the x-axis Sparseness isa parameter that measures how much energy of a vector isconcentrated on a few components59 This implies that mostvalues are close to zero and that only a few take significantlynonzero values Kurtosis is a measure of whether the dataare peaked or flat relative to a normal distribution60 That isdata sets with high kurtosis tend to have a distinct peak nearthe mean decline rather rapidly and have heavy tails Datasets with low kurtosis tend to have a flat top near the meanrather than a sharp peak A uniform distribution would be anextreme case Therefore there is similarity between the twoparameters The equations of sparseness and kurtosis are asfollows
Sparseness(x) =radic
d minus (sum |x j |)radicsum |x j |2radic
d minus 1 (9)
where d represents the dimensionality of the vector x whosejrsquoth component is xj
Kurtosis = (1N )sumNminus1
n=0 (xn minus μ)4
σ 4 (10)
where μ is the mean of x and σ is the standard deviation ofx
Figure 13 shows that openclosed eye can be classified bythe sparseness and kurtosis of the histogram As shown inFig 13 it can easily be predicted that an open eye has largervalues of sparseness and kurtosis than a closed eye becausethe open eye has greater bulginess than a closed eye Wecan confirm that the distribution of the open-eye histogram isconcentrated in the center of the x-axis when the histogram ofthe closed eye exhibits a relatively flat distribution Thereforeopen and closed eyes are classified in terms of whether thesparseness and kurtosis of the projected histogram exceed acertain threshold value
242 Combination of featuresThe features that are used to classify open or closed eyeswere first extracted from the appearance features of 12dimensions by PCA + LDA and were then extracted fromthe statistical features of two dimensions by sparseness andkurtosis These extracted features were applied to the SVMclassifier We used a SVM with RBF kernels because theclassification ability of the SVM with radial basis functionkernels was superior to that of the SVM with polynomial andlinear kernels Figure 14 shows these processes that combinefeatures and classify open or closed eyes
Optical Engineering December 2011Vol 50(12)127202-11
Jo et al Vision-based method for detecting driver drowsiness and distraction
Fig 13 Horizontal edge-image process for classification of open and closed eye
25 Detection of Drowsiness and DistractionAfter classifying open or closed eyes and estimating the headpose of a driver the inattention of the driver is determinedby PECLOS which represents the drowsiness level andPERLOOK which represents the distraction level PERC-LOS is a parameter of drowsiness that is widely used tomonitor the drowsiness of a driver It is defined as the por-tion of time that the driverrsquos eyes are closed over a certainperiod57 61ndash63 This parameter can be obtained from
PERCLOS[k] =sumk
i=kminusn+1 Blink[i]
ntimes100 () (11)
where PERCLOS[k] means PERCLOS figure in the krsquothframe and n is a period measuring PERCLOS Blink[i] rep-resents that the eye is opened or closed in the irsquoth frame Ithas ldquo0rdquo if the eye is opened and ldquo1rdquo if the eye is closed Thehigher the PERCLOS is the higher the level of driver fatigueWhen PERCLOS exceeds the predetermined threshold the
proposed system generates a warning of inattention The pre-determined threshold was experimentally determined as 02by our experiments with training data
When a driver cannot look at the road ahead because thehead is rotated it causes the same accident hazard as whena driver cannot look ahead because their eyes are closed Assuch we propose a parameter PERLOOK which measuresthe driver-distraction level in the same way as PERCLOSPERLOOK is defined as the proportion of time that a driverrsquoshead is rotated and the driver does not look at the road aheadThis parameter can be obtained from
PERLOOK[k] =sumk
i=kminusn+1 Nonfront[i]
ntimes100 () (12)
where PERLOOK[k] indicates the PERLOOK figure in thekrsquoth frame and n is a period measuring PERLOOK Non-front[i] indicates that the driver is looking at the frontal ornonfrontal area in the irsquoth frame It is 1 if the driver is look-
Fig 14 Process of combining features and classifying open or closed eyes using an SVM
Optical Engineering December 2011Vol 50(12)127202-12
Jo et al Vision-based method for detecting driver drowsiness and distraction
Table 3 Specification of Database 1 for training
Daytime No subjects 12 persons (Male 9 Female 3 without glasses 2 with glasses 10)
No images 44197 images from 216 image sequences (12 personstimes18 gaze zones)
Nighttime No subjects 11 persons (Male 8 Female 3 without glasses 3 with glass 8)
No images 41155 images from 198 image sequences (11 personstimes18 gaze zones)
ing at the non-frontal area and 0 if the driver is looking atthe frontal area The higher the PERLOOK is the higherthe driver-distraction level is When PERLOOK is greaterthan a predetermined threshold the proposed system gener-ates a warning of inattention The predetermined thresholdwas experimentally determined as 035 by our experimentswith training data From Sec 231 if the yaw angle of adriver is greater than +15 deg or less than ndash15 deg (based onthe frontal direction) and if the corresponding accumulativetime is longer than 35 s during the unit interval of 10 s oursystem determines it as a ldquodistractionrdquo For example if theyaw angle and accumulative time when a driver looks at aGPS device or changes a CD is satisfied by this condition itis determined as a distraction
3 Experiments
31 DatabaseIn order to evaluate the proposed method we attached thedeveloped system in front of a dashboard as shown in Fig 4and we collected 162772 frames from 22 subjects Severalexperiments were carried out using images of subjects of bothsexes some of whom wore sunglasses and eyeglasses duringboth daytime and nighttime The databases were acquired ina car using an NIR camera with a resolution of 640 times 480pixels and a frame rate of 25 fps
In our databases there are two data sets for training andtesting 12 subjects were categorized into a training groupand the remaining 10 subjects were categorized into a test-ing group The images from the training group were storedin database 1 whereas those from the testing group wererecorded in database 2 Database 1 which is shown inTable 3 has also been used in a previous study33 It con-tains 85352 images (6700ndash7500 images per subject) 1090images from database 1 were used to train the eye validationprocess as shown in Fig 12 and Table 4 703 images wereused for the classification process for open and closed eyesas shown in Fig 14 and Table 5 The 85352 training imagesinclude numerous overlapped data which can cause overfit-ting of the classification hyperplane of the SVM In order tosolve this problem 1090 samples from 12 subjects were ran-domly selected and used in SVM training for eye validationThe training set for the SVM classifier in the eye-validationprocess contains 860 positive samples (eye images) and 230negative samples (noneye images) as shown in Figs 15(a)and 15(b) In addition 703 samples from 12 subjects wererandomly selected and used in SVM training for eye-statedetection The training set for the SVM classifier in the eye-statendashdetection process contains 530 positive samples (open-eye images) and 173 negative samples (closed-eye images)as shown in Figs 15(c) and 15(d)
The remaining images in database 1 were heuristicallyused for parameter optimization in eye detection (Sec 232)In conclusion the training data were only used for parameteroptimization and SVM training
Database 2 contains 77420 images (7500ndash8000 imagesper subject) from the testing group In database 2 longerimage sequences were captured for each subject in orderto test the proposed inattention-detection method The sub-jects were requested to look frontally for 5 s and to thendrive normally drowsily or distractedly for the remainingperiod Thus for each subject we obtained three types ofsequences a normal driving video a drowsy driving videoand a distracted driving video In addition the subjects whodid not wear glasses were asked to wear sunglasses in orderto capture a new sequence Similarly the subjects who woreglasses were asked to remove their glasses or wear sunglassesin order to capture a new sequence
As compared to the number of drowsy driving videos thenumber of distracted driving videos is relatively large Thereason is as follows A driver can gaze at the 12 differentpositions (1ndash5 8 11 14ndash18) described in Fig 16 hence weneed to test the performance of distraction detection for thevarious gaze directions Thus for each subject we obtainedmultiple distracted videos in which the subject gazed at the12 different positions
Table 4 Train database for eye validation
Number of eye images used
as training data in eye validation
Glass type Left eyes Right eyes
Eye(positivesamples)
Not wearingglasses
627 473
Eyeglasses 128 208
Sunglasses 105 189
Subtotal 860 870
Noneye(negativesamples)
Not wearingglasses
78 123
Eyeglasses 103 108
Sunglasses 49 79
Subtotal 230 310
Total 1090 1180
Optical Engineering December 2011Vol 50(12)127202-13
Jo et al Vision-based method for detecting driver drowsiness and distraction
Table 5 Train database for eye state detection
Number of eye images used as trainingdata for blink detection
Glass type Left eyes Right eyes
Open eye(positivesamples)
Not wearingglasses
420 440
Eyeglasses 50 70
Sunglasses 60 50
Subtotal 530 560
Closedeye(negativesamples)
Not wearingglasses
102 105
Eyeglasses 33 40
Sunglasses 38 40
Subtotal 173 185
Total 703 745
In the case of distraction a driver is not looking aheadThus the videos in which a driver gazed at 12 different posi-tions among the 18 positions shown in Fig 16 were used forthe performance evaluation of distraction detection Unlikedistraction detection only two states [ie drowsy and normal(awake)] can be considered in the case of drowsiness detec-tion Hence the number of drowsy videos obtained from each
Fig 16 Discrete gaze zones in a vehicle
subject is less than that of distracted videos The duration ofeach distracted video is sim1 min whereas that of each drowsyvideo is around 5ndash10 min Table 6 shows database 2 in detail
32 Experimental ResultsThe experimental phase consists of three parts First theeye-detection algorithm was tested using image sequencesof different people obtained in a vehicle under differenttimes and light conditions Then the algorithm for eye-state detection was tested The features used to classifyeye states were extracted from a long image sequence Fi-nally the algorithm measuring the inattention level of adriver was tested The inattention level is composed of thedrowsiness and distraction levels Drowsiness level was mea-sured by PERCLOS and distraction level was calculated byPERLOOK
321 Eye-detection resultsIn order to evaluate the performance of our eye-detectionalgorithm three experiments were carried out and comparedto each other The first was performed using only the eyeadaboost with our database 2 When it is applied to every
Fig 15 Positive and negative samples provided to the SVM classifier in the training phase (a) Eye images (b) noneye images (c) open-eyeimages and (d) closed-eye images
Optical Engineering December 2011Vol 50(12)127202-14
Jo et al Vision-based method for detecting driver drowsiness and distraction
Table 6 Specification of Database 2 for testing
No subjects 9 persons (Male 6 Female 3 without glasses 9 with glasses 4with sunglasses 5)
No images for eye detection and eye state detection 40256 images from 36 image sequences
No images used for eye detection evaluation 32365 images from 36 image sequences (7891 images wereexcluded because the subject was looking away from the roadahead)
Daytime No images used for eye state detection evaluation 30483 images from 36 image sequences (9773 images wereexcluded because the subject was looking away from the roadahead (7891) or because the eyes could not be classified as openor closed (eg narrow eyes) (1882)
No sequences used to measure inattention level 189 video sequences driving normally
36 video sequences driving drowsily
189 video sequences driving distractedly (Total number of imagesabout 239200 images from 414 image sequences)
No subjects 10 persons (Male 7 Female 3 without glasses 5 with glasses 5)
No images for eye detection and eye state detection 37164 images from 20 image sequences
No images used for eye detection evaluation 28608 images from 20 image sequences (8556 images wereexcluded because the subject was looking away from the roadahead)
Nighttime No images used for eye state detection evaluation 26672 images from 20 image sequences (10492 images wereexcluded because the subject was looking away from the roadahead (8556) and because the eyes could not be classified as beingopen or closed (eg narrow eyes) (1936))
No sequences used to measure inattention level 120 video sequences driving normally
20 video sequences driving drowsily
120 video sequences driving distractedly (Total number of imagesabout 105800 images from 260 image sequences)
sequence frame it requires a long processing time and failsto detect eyes when the head is rotated or the eyes are closedThus it resulted in unsatisfactory eye-detection performanceand a slow processing time as shown in Table 7 In the secondexperiment we combined eye-detecting methods includingadaboost adaptive template matching and blob detectionand this improved both the detection accuracy of the closed-eye and the computational performance The third experi-ment was performed by adding the eye validation to thoseused in the second experiment When the eye validation wasadded to the eye-detection algorithm the accuracy of eyedetection was improved Without any eye verifier to checkwhether the detected eye region truly contains an eye thefalsely detected noneye image may be stored in the template
and the falsely detected eye could be repeatedly detected bythe adaptive template matching from the next frame Con-sequently in the second experiment propagation error wasgenerated and the error rate was 756 in eye detectionHowever after applying the eye-validation process the errorrate was decreased from 756 to 104
The eye-detection rate is calculated as follows First im-ages looking at the frontal area are extracted from totalimages in database 2 (Table 6) and then manually dividedinto eye images [as in Fig 15(a)] and noneye images [as inFig 15(b)] Then the eye-detection rate is calculated by thenumber of images that successfully detect eyes over the totalnumber of images Table 7 presents the eye-detection rateresults and also shows that the eyes can be sim989 success-
Fig 17 Excluded narrow eye samples
Optical Engineering December 2011Vol 50(12)127202-15
Jo et al Vision-based method for detecting driver drowsiness and distraction
Table 7 Results obtained after eye detection algorithms on images in Database 2
Conditions Eye-detection rate
Time Glass type Sequences Frames Adaboost
Proposed method(without the eye
validation process)
Proposed method(with the eye
validation process)
Notwearingglasses
18 19994 7652 9254 9855
Day Eyeglasses 8 8012 6735 9235 9888
Sunglasses 10 4359 6353 9202 9891
Subtotal 36 32365 7250 9242 9868
Notwearingglasses
10 16860 7398 9258 9885
Night Eyeglasses 10 11748 7012 9205 9789
subtotal 20 28608 7239 9236 9846
Total 68 60973 7245 9239 9858
Processing time 231 ms 115 ms 145 ms
fully detected by the proposed eye-detection method regard-less of time gender and glass type Detection error is causedby misrecognition of eyeglass frames eyebrows and eyesthat are partially visible in Fig 15(b) as true eyes Howeverthis detection error is not continuous in the video sequencesbecause the eye template is reset by the eye-validation pro-cess in the next frame when the eye detector detected anoneye
322 Eye-statesndashdetection resultsIn order to evaluate the performance of determining eye sta-tus eye images from database 2 in Table 6 were manuallydivided into two classes open and closed eyes and they wereused as ground-truth data Two experiments were then per-formed The first experiment is designed to test the effectof PCA + LDA features compared to PCA features Thesecond experiment is designed to compare and analyze theclassification performance of multiple features combiningPCA + LDA sparseness and kurtosis
It is of note that narrow eyes such as those in Fig 17 wereexcluded from the performance measurement in the testingdata Because human eyes change smoothly from an open eyeto a narrow eye and then a closed eye it is difficult to classifycrisply whether a narrow eye is an open eye or a closed eye inthe middle of the change However although a narrow eye isjudged as either an open or a closed eye it does not affect thetotal performance of determining drowsy behavior becauseit is a temporary and transitional state between an open andclosed eye Therefore narrow eyes were excluded from thetesting data
The performance in eye-states detection is measured byconsidering two errors For convenience when an open eye isfalsely accepted as a closed eye we define it as a type I errorIn addition when a closed eye is falsely rejected as an openeye we define it as a type II error Thus the performance of
eye-states detection was measured by type I error and type IIerror
In the first experiment in order to detect eye states fea-tures are extracted by PCA or PCA + LDA and the featuresare then entered into SVM and finally classified into open andclosed eyes This process is the same as the eye-validationprocess explained in Fig 12 As shown in Table 8 530 framesof open eyes and 173 frames of closed eyes were used in thetraining and some of the eye images in database 2 were testedThen 12 dimensional features for the best performance wereselected The method using the PCA + LDA exhibits betterperformance in classifying eye states than the method usingonly PCA in our experiment In particular the PCA + LDAfeature is more effective than the PCA or LDA feature whenthere are fewer training samples in each class The combinedfeatures of PCA + LDA are less sensitive to different illu-minations whereas the PCA feature is sensitive to changingillumination51 53
Table 9 shows the eye-statesndashdetection results by PCA+ LDA for each dimension First in order to find the properfeature dimension yielding the best recognition rate whenfeatures were extracted solely by PCA we tested for eachdimension and obtained the 15 dimensions as the best number
Table 8 Training and testing data sets for eye states detection
Eye states included
Data set Open eye Closed eye
Train 530 173
Test 7250 800
Optical Engineering December 2011Vol 50(12)127202-16
Jo et al Vision-based method for detecting driver drowsiness and distraction
Table 9 Recognition error rates by eliminating the first one to six principal components
No eliminated principal components
1 (14 dim) 2 (13 dim) 3 (12 dim) 4 (11 dim) 5 (10 dim) 6 (9 dim)
Inputfeature
Type Ierror
Type IIerror
Type Ierror
Type IIerror
Type Ierror
Type IIerror
Type Ierror
Type IIerror
Type Ierror
Type IIerror
Type Ierror
Type IIerror
PCA +LDA
352 350 343 338 326 325 348 350 339 338 415 413
(2557250
) (28
800
) (249
7250
) (27800
) (236
7250
) (26
800
) (2527250
) (28
800
) (2467250
) (27800
) (301
7250
) (33
800
)
of feature dimensions The recognition rates of PCA featuresare 9612 and 9615 for open and closed states respectively
Previous works in face recognition50ndash52 reported that elim-inating the first one to three PCs improved performance Be-cause these PCs are sensitive to various illuminations theyshould be removed In this study we eliminate the first oneto six PCs to analyze the recognition effect for eye-statesdetection The experiment results are presented in Table 9
Table 9 demonstrates that eliminating the first one to threePCs will achieve the best performance rates in our data Thebest performances for the PCA + LDA feature 326 and325 were obtained by eliminating the first three PCsWhen removing more than four PCs the results grew worse
In the second experiment in order to evaluate the clas-sification performances of several features features areextracted by feature extraction methods their combined fea-tures are entered into an SVM and their classification perfor-mances are then measured There are two kinds of featuresused in the second experiment First appearance features areextracted by PCA + LDA and statistical features are alsoextracted by sparseness and kurtosis The classification per-formances resulted from combining these features are shownin Table 10 We can confirm that the performance was im-proved by combining the appearance features by PCA +
LDA and the statistical features such as the sparseness andkurtosis of the histogram from the eye-edge image
Table 11 shows the total performance of the proposedeye-statesndashdetection method with database 2 the total test-ing data As shown in Table 11 our proposed eye-statesndashdetection method works well in both daytime and nighttimeand also for drivers wearing eyeglasses or sunglasses Fi-nally we obtained results that are 145 and 291 for type Iand type II errors respectively
Some qualitative results of the proposed eye-detectionand eye-statesndashdetection method are shown in Figs 18 and19 The proposed method was robust to image variationscaused by sunlight eyeglasses sunglasses blinking mouthmovement and specular reflection on glasses Here the openeye was marked as a circle and the closed eye was marked asa rectangle The eye region is set in proportion to the detectedface region and the average size of the eye region is 40times26pixels
323 Results of measuring the inattention levelIn the driver-monitoring system it is very important to ensurethat a driver is paying adequate attention to the road ahead amust-see position when driving We can consider two situa-
Table 10 Accuracy of the eye states detection method when using each feature or combining multiple features
Input features
Type I error (Error rate forwhen an open eye is falselyaccepted as a closed eye)
Type II error (Error rate for when aclosed eye is falsely rejected as
an open eye)
Kurtosis 874 (6347250) 875 (70800)
Sparseness 786 (5707250) 788 (63800)
Sparsenesskurtosis
697 (5057250) 700 (56800)
PCA 393 (2857250) 400 (32800)
PCA + LDA 326 (2367250) 325 (26800)
PCA + LDAsparseness
280 (2037250) 275 (22800)
PCA + LDAkurtosis
297 (2157250) 300 (24800)
PCA + LDAsparsenesskurtosis
223 (1627250) 225 (18800)
Optical Engineering December 2011Vol 50(12)127202-17
Jo et al Vision-based method for detecting driver drowsiness and distraction
Table 11 Performance of our proposed method for eye states detection in Database 2
Time Glass type
Type I error (Error rate forwhen an open eye isfalsely accepted as a
closed eye)
Type II error (Error rate forwhen a closed eye is
falsely rejected as an openeye)
Not wearing glasses 120 (19816451) 354 (722032)
Eyeglasses 305 (2046699) 156 (161024)
Day Sunglasses 073 (283830) 112 (5447)
Subtotal 159 (43026980) 265 (933503)
Not wearing glasses 049 (6413185) 315 (621967)
Night Eyeglasses 230 (24110465) 332 (351055)
Subtotal 129 (30523650) 321 (973022)
Total 145 (73550630) 291 (1906525)
tions when a driver does not see the road ahead when drivingFirst it is a situation when the driver closes his or her eyesduring driving while drowsy The second situation is whenthe driverrsquos head is rotated when driving distractedly Bothof these situations are dangerous because the driver does notpay adequate attention to the road ahead In this paper weproposed a system to monitor these hazards simultaneouslyTwo measures PERCLOS and PERLOOK are used to detectthe drowsiness and distraction level respectively
Figure 20 shows the result of PERCLOS measurementfor drowsy sequences the state of a driver is alert for thefirst 100 s and during the remaining time the driver exhibitsdrowsy driving behavior In Fig 20 we were able to confirmthat the driver drowsiness was well detected by PERCLOSHowever if the driver exhibits distracted driving behaviorthe distracted behavior cannot be detected using the PERC-LOS measurement In Fig 21 the driver was requested to
Fig 18 Results of the proposed eye-detection and eye-statesndashdetection method on images captured during the daytime for a driverwho (a) did not wear any glasses and (b) wore sunglasses (Threevertical lines refer to the left right and center of the face)
drive normally for the first 160 s and then distractedly forthe remaining time Figure 21(a) shows the result of PER-CLOS measurement for distracted sequences In Figs 21(a)and 21(b) it is evident that distracted behaviors cannot bedetected using the PERCLOS measure alone Figure 21(a)measured by PERCLOS shows the false determination of adistracted behavior as a normal behavior Figure 21(b) mea-sured by PERLOOK shows that the driver distraction waswell detected at sim160 s
The experiments to measure the drowsiness and distrac-tion levels were executed on the image sequences in database2 For each of the subjects 36 drowsy video sequences and189 distracted video sequences were recorded during the day-time and 20 drowsy video sequences and 120 distracted videosequences were recorded during the nighttime For each ofthe drowsy video sequences about 5ndash10 min of observationwas recorded The subjects were requested to look frontally
Fig 19 Results of the proposed eye-detection and eye-statesndashdetection method on images captured during the nighttime for a driverwho (a) did not wear any glasses and (b) wore eyeglasses
Optical Engineering December 2011Vol 50(12)127202-18
Jo et al Vision-based method for detecting driver drowsiness and distraction
Fig 20 PERCLOS measurement for drowsy sequences
for 5 s and then drive normally or to drowsily drive for theremaining period For each of the distracted video sequencessim1 min of observation was recorded The subjects were re-quested to look frontally for 5 s and then drive normallyor to distractively drive for the remaining period Thus foreach subject we obtained three kinds of sequences normaldrowsy and distracted driving video sequences The experi-mental results using these video sequences are presented in
Table 13 In this experiment we achieved satisfying resultsAs shown in Table 13 the error rate of falsely recognizinga drowsy state or a distracted state as a normal state is 0while the error rate (false alarm) of falsely recognizing anormal state as a drowsy state or a distracted state is sim2That is there was no error in detecting drowsiness or dis-traction when the driver was actually drowsy or distractedOn the other hand six cases of a false alarm occurred in nor-
Fig 21 PERCLOS and PERLOOK measurements for a distracted video sequence (a) PERCLOS and (b) PERLOOK
Optical Engineering December 2011Vol 50(12)127202-19
Jo et al Vision-based method for detecting driver drowsiness and distraction
Fig 22 ROC curves for drowsiness and distraction detection accuracy (a) drowsiness detection and (b) distraction detection
mal driving videos of sim4 h which corresponds to 1ndash2 falsealarms per hour these can be regarded as small errors Failureanalysis revealed that a normal state was falsely recognizedas a drowsy state because the eyes were recognized as closedeyes when the driver laughed for a certain amount of timeErrors related to the driverrsquos habit of blinking hisher eyesoccur frequently Thus the measured PERCLOS was largerthan that for normal drivers Because a false alarm can annoythe driver we focused on the detection of dangerous inatten-tion By changing the decision threshold value the number
of false alarms can be reduced at the expense of increasingthe error of missing true detections
Also the false alarm can be reduced using the othermethods such as facial expression recognition user-specificdriver monitoring or driving behavior information such asmonitoring vehicle speed steering movement lane keepingacceleration braking and gear changing These works wouldbe considered in the future
Figure 22 shows the ROC curve for drowsiness and dis-traction detection accuracy by thresholds PERCLOS and
Optical Engineering December 2011Vol 50(12)127202-20
Jo et al Vision-based method for detecting driver drowsiness and distraction
Fig 23 One screen shot of actual drowsy video
PERLOOK ROC curve is a graphical plot of the sensitivityor true acceptance rate versus false acceptance rate for abinary classifier system because its discrimination thresholdis varied70 For convenience when the inattentive state isfalsely accepted as the normal state we define it as false-acceptance rate (FAR) in this paper In addition when thenormal state is falsely accepted as the inattentive state we de-fine it as false-rejection rate (FRR) When the FAR and FRRare equal the common value is referred to as the equal-errorrate The true-acceptance rate indicates a value subtractingFRR from 100
We describe a comparative experiment for measuringdrowsy parameters in each actual and virtual drowsinessvideo In our test the drowsy driverndashdetection performancewas measured using the virtual drowsiness video that wasobtained when 10 people simulated drowsy driving behaviorWe used a virtual drowsiness video because it is dangerousand difficult to obtain an actual drowsiness video moreoveran open database of actual drowsiness videos is not availableThus it was necessary to compare the values of PERCLOS inthe virtual drowsiness video with those in the actual drowsi-
Table 12 Testing data to detect the drowsiness and distraction of adriver in a vehicle
Time Driver state No test videos
Normal state 189
Day Drowsy state 36
Distracted state 189
Normal state 120
Night Drowsy state 20
Distracted state 120
Total 674
ness video The actual drowsiness video shown in Fig 23was obtained when a subject was actually drowsy at dawn (ataround 400 or 500 AM) Although this video was obtainedin the laboratory the acquisition environment (the positionsof a user and the proposed device the viewing angle of thecamera etc) was similar to that in a car Figure 24 showsgraphs for PERCLOS in the actual and virtual drowsinessvideos It is easy to identify that these features of PERC-LOS are similar In the actual drowsiness video the driverbegins to falls asleep after 300 frames and the average valueof PERCLOS is sim05254 In the virtual drowsiness videothe driver begins to falls asleep after 400 frames and theaverage value of PERCLOS is sim05024 Therefore we canpredict that the drowsy driverndashdetection performance in thevirtual drowsiness video will be similar to that in the actualdrowsiness video
Because it is difficult and dangerous to obtain drowsyor distracted videos in real conditions they were not ob-tained However the 189 videos [in (daytime) normal state ofTable 12] include five videos that were obtained when userswere actually driving on an expressway In the future webelieve that it would be possible to obtain a greater number
Fig 24 Comparison between the PERCLOS values in the actual and virtual drowsiness video (a) actual drowsiness and (b) virtual drowsiness
Optical Engineering December 2011Vol 50(12)127202-21
Jo et al Vision-based method for detecting driver drowsiness and distraction
Table 13 Drowsiness and distraction detection results measured from video sequences in a vehicle
Error rates ()
Misrecognizing adrowsy state asa normal state
Misrecognizing anormal state asa drowsy state
Misrecognizing adistracted state
as a normalstate
Misrecognizing anormal state as
a distractedstate
Misrecognizing adrowsy state as
a distractedstate
Misrecognizing adistracted state
as a drowsystate
0 (056) 162 (5309) 0 (0309) 064 (2309) 179 (156) 0 (0309)
of drowsy or distracted videos in real conditions with thesupport of car manufacturers
324 Processing timeThe proposed driver-monitoring system was efficient andworked in real time The software was implemented usingVisual C + + on an Intel Pentium M processor 160 GHz500 MB RAM Although not all the code optimizationswere completed the processing times are encouraging fora real-time implementation The total processing time was31 msframe and the processing times of each step are shownin Table 14
4 ConclusionIn this study we proposed a driver-monitoring system thatcan be used for warning against driver inattention includ-ing drowsiness and distraction We proposed an algorithmthat automatically localizes the eyes determines whetherthey are opened or closed and finally judges whether thedriver is driving drowsily or distractedly This constitutes anonintrusive approach to detecting driver inattention withoutannoyance or interference in both daytime and nighttime
The framework consists of three steps The first stepinvolves eye detection and tracking In driving sequenceimages adaboost adaptive template-matching and blob-detection methods are combined to detect the eyes automat-ically Eye detection is verified using an eye-validation tech-nique based on PCA + LDA and SVM The proposed eyedetector works well when the driver closes his or her eyes orwears eyeglasses and sunglasses High detection rates wereachieved in tests carried out on 12 people in the database
Table 14 Processing time of proposed driver monitoring system
Process Processing time (msframe)
Eye adaboost 231
Adaptive template matching 07
Blob detector 12
Eye validation by using SVM 22
Total eye detection 145
Eye states detection 24
Head pose estimationa 141
Total processing time 31
aReference 39
during both daytime and nighttime as well as when wearingsunglasses or eyeglasses
The second step is a process for classifying eyes as openedor closed For this purpose appearance-based features are ex-tracted from the detected eye image by PCA + LDA andedge-based features are obtained on the basis of sparsenessand kurtosis The detected eyes are then classified as openor closed by an SVM using the combined features We con-firmed that performance of the combined system is betterthan that of a single system Experimental results revealedthat the classification error rate in the databases was lt3during both daytime and nighttime as well as when wearingsunglasses or eyeglasses
The third step is a process for measuring the drowsinessand distraction levels of the driver In this process we pro-posed a method for checking these two conditions simultane-ously Two measures PERCLOS and PERLOOK are used tocalculate the drowsiness and distraction levels respectivelyand they yield satisfactory results
In the future we plan to conduct tests with a greater num-ber of users and over longer periods of time in order to obtainactual drowsy and distracted behaviors From the viewpointof gaze estimation we need to develop a precise gaze-estimation method using both head-pose and eye-movementinformation In the drowsy driverndashdetection method facialexpression recognition must be employed to distinguisheyes closed due to fatigue from those closed due to vigorouslaughter Moreover because eye size eye blinking frequencyand driving habits vary among drivers we need to developa driver-specific monitoring system using an online trainingmethod This system will exhibit better performance if it isintegrated with other sensors such as the accelerator steeringwheel and lane-position sensor Finally an integrated driv-ing safety system will be more effective when combined witha pedestrian-recognition system and a lane-keeping supportsystem
AcknowledgmentsThis work was supported in part by Mando Corporation LtdAnd in part by the National Research Foundation of Korea(NRF) grant funded by the Korea government (MEST) (GrantNo 2011-0015321)
References1 M R Rosekind E L Co K B Gregory and D L Miller ldquoCrew
factors in flight operations XIII a survey of fatigue factors incorporateexecutive aviation operationsrdquo NASA Ames Research Cen-ter NASATM-2000-209 610 (2000)
2 Awake Consortium (IST 2000-28062) ldquoSystem for effective assess-ment of driver vigilance and warning according to traffic risk estima-
Optical Engineering December 2011Vol 50(12)127202-22
Jo et al Vision-based method for detecting driver drowsiness and distraction
tion (AWAKE)rdquo September 2001ndash2004 lthttpwwwawake-euorggt(April 16 2011)
3 US Department of Transportation ldquo2007 FARSGES an-nual report (final ed)rdquo lthttpwwwnhtsadotgovportalsitenhtsamenuitem6a6eaf83cf719ad24ec86e10dba046a0gt (April 16 2011)
4 W Wierwille L Tijerina S Kiger T Rockwell E Lauber andA Bittne ldquoFinal report supplementmdashheavy vehicle driver workloadassessmentmdashtask 4 review of workload and related researchrdquo USDOTTech Rep No DOT HS 808 467(4) (1996)
5 H Saito T Ishiwaka M Sakata and S Okabayashi ldquoApplicationsof driverrsquos line of sight to automobilesmdashwhat can driverrsquos eye tellrdquo inProc of Vehicle Navigation and Information Systems Conf Yokohamapp 21ndash26 (1994)
6 H Ueno M Kaneda and M Tsukino ldquoDevelopment of drowsiness de-tection systemrdquo in Proc of Vehicle Navigation and Information SystemsConf Yokohama pp 15ndash20 (1994)
7 S Boverie J M Leqellec and A Hirl ldquoIntelligent systems for videomonitoring of vehicle cockpitrdquo in Proc of Int Congress and Exposi-tion ITS Advanced Controls and Vehicle Navigation Systems pp 1ndash5(1998)
8 M Kaneda H Ueno and M Tsukino ldquoDevelopment of a drowsinesswarning systemrdquo in Proc of 11th Int Conf on Enhanced Safety ofVehicle Munich (1994)
9 R Onken ldquoDaisy an adaptive knowledge-based driver monitoring andwarning systemrdquo in Proc of Vehicle Navigation and Information Sys-tems Conf Yokohama pp 3ndash10 (1994)
10 T Ishii M Hirose and H Iwata ldquoAutomatic recognition of driverrsquos fa-cial expression by image analysisrdquo Journal of the Society of AutomotiveEngineers of Japan Vol 41 pp 1398ndash1403 (1987)
11 K Yammamoto and S Higuchi ldquoDevelopment of a drowsiness warningsystemrdquo Journal of the Society of Automotive Engineers of JapanVol 46 pp 127ndash133 (1992)
12 D F Dinges M Mallis G Maislin and J W Powell ldquoEval-uation of techniques for ocular measurement as an index offatigue and the basis for alertness managementrdquo Departmentof Transportation Highway Safety Publication 808 762 April(1998)
13 R Grace V E Byrne D M Bierman and J M Legrand ldquoA drowsydriver detection system for heavy vehiclesrdquo in Proceedings of Digi-tal Avionics Systems Conference 17th DASC Vol 2 pp I361ndashI368(1998)
14 D Cleveland ldquoUnobtrusive eyelid closure and visual of regard mea-surement systemrdquo Conference on Ocular Measures of Driver alertnessApril (1999)
15 J Fukuda K Adachi M Nishida and E Akutsu ldquoDevelopment ofdriverrsquos drowsiness detection technologyrdquo Toyota Tech Rev 45 34ndash40(1995)
16 J H Richardson ldquoThe development of a driver alertness monitoringsystemrdquo in Fatigue and Driving Driver Impairment Driver Fatigueand Driver Simulation L Harrtley Ed Taylor amp Francis London(1995)
17 T DrsquoOrazio M Leo C Guaragnella and A Distante ldquoA visual ap-proach for driver inattention detectionrdquo Pattern Recogn 40 2341ndash2355(2007)
18 E Murphy-Chutorian and M M Trivedi ldquoHead pose estimation incomputer vision a surveyrdquo IEEE Trans Pattern Anal Mach Intell31(4) 607ndash626 (2009)
19 D W Hansen and Q Ji ldquoIn the eye of the beholder a survey of modelsfor eyes and gazerdquo IEEE Trans Pattern Anal Mach Intell 32 478ndash500(2010)
20 A Hattori S Tokoro M Miyashita I Tanakam K Ohue and SUozumi ldquoDevelopment of forward collision warning system using thedriver behavioral informationrdquo presented at 2006 SAE World CongressDetroit Michigan (2006)
21 E Murphy-Chutorian A Doshi and M M Trivedi ldquoHead pose estima-tion for driver assistance systems a robust algorithm and experimentalevaluationrdquo in Proc of 10th Int IEEE Conf Intelligent TransportationSystems pp 709ndash714 (2007)
22 P Smith M Shah and N da Vitoria Lobo ldquoDetermining driver vi-sual attention with one camerardquo IEEE Trans Intell Transp Syst 4(4)2058ndash2218 (2003)
23 J Y Kaminski D Knaan and A Shavit ldquoSingle image face orientationand gaze detectionrdquo Mach Vis Appl 21 85ndash98 (2009)
24 J C Stutts D W Reinfurt L Staplin and E A Rodgman ldquoThe roleof driver distraction in traffic crashesrdquo AAA Foundation for TrafficSafety Washington DC (2001)
25 K Torkkola N Massey and C Wood ldquoDriver inattention detectionthrough intelligent analysis of readily available sensorsrdquo in Proc ofIEEE Conf on Intelligent Transportation Systems Washington DCpp 326ndash331 (2004)
26 G Yang Y Lin and P Bhattacharya ldquoA driver fatigue recogni-tion model using fusion of multiple featuresrdquo in Proc of IEEE IntConf on Syst Man and Cybernetics Hawaii Vol 2 pp 1777ndash1784(2005)
27 S Park and M M Trivedi ldquoDriver activity analysis for in-telligent vehicles issues and development frameworkrdquo in Proc
of IEEE Intelligent Vehicles Symp Las Vegas pp 795ndash800(2005)
28 E Vural M Cetin A Ercil G Littlewort M S Bartlett and J RMovellan ldquoDrowsy driver detection though facial movement analysisrdquoIEEE Int Conf on Computer VisionndashHuman Computer Interaction pp6ndash18 (2007)
29 M Saradadevi and P Bajaj ldquoDriver fatigue detection using mouth andyawning analysisrdquo Int J Comput Sci Netw Security 8(6) 183ndash188(2008)
30 L M Beragasa J Nuevo M A Sotelo R Barea and E LopezldquoReal-time system for monitoring driver vigilancerdquo IEEE Trans IntellTransport Syst 7(1) 1524ndash1538 (2006)
31 R Senaratne D Hardy B Vanderaa and S Halgamuge ldquoDriver fatiguedetection by fusing multiple cuesrdquo Lect Notes Comput Sci 4492 801ndash809 (2007)
32 K Kircher A Kircher and F Claezon ldquoDistraction and drowsinessmdashafield studyrdquo Tech Rep VTI (The Swedish National Road and TransportResearch Institute) (2009)
33 S J Lee J Jo H G Jung K R Park and J Kim ldquoReal-time gaze es-timator based on driverrsquos head orientation for forward collision warningsystemrdquo IEEE Trans Intell Transp Syst 12(1) 254ndash267 (2011)
34 Specification of illuminator lthttproithner-lasercommultiled_multi_tohtmlge (July 25 2011)
35 Camera (EC650) lthttpwwwpyramidimagingcomspecsProsilica700009AA-EC65020User20Manualpdfgt (August 25 2011)
36 Camera lens (ML0614) lthttpwwwphoeniximagingcomml-0614htmge (July 25 2011)
37 Narrow bandpass interference filter (NT43-148) lthttpwwwedmundopticscomonlinecatalogdisplayproductcfmproductid=3198ampPageNum=5ampSort=displayOrderampOrder=ascproductsgt (July 252011)
38 SUV (GIA motors Sportage) lthttpwwwkiacomsportageexploregt (August 25 2011)
39 Sedan (Hyundai Motors Grandeur) lthttpgrandeurhyundaicomge(August 25 2011)
40 T Ito S Mita K Kozuka T Nakano and S Yamamoto ldquoDriver blinkmeasurement by the motion picture processing and its application todrowsiness detectionrdquo in Proc of Int Conf Intelligent TransportationSystems Singapore pp 168ndash173 (2002)
41 K Ohue Y Yamada S Uozumi S Tokoro A Hattori and T HayashildquoDevelopment of a new pre-crash safety systemrdquo SAE Tech PaperSeries Doc No 2006-01-1461 (2006)
42 Specification of motion tracking device called Patriot lthttpwwwpolhemuscompolhemus_editorassetsTech20compare20with20ResolutionvsRange20graphspdfgt (February 15 2011)
43 W J Scheirer A Rocha B Heflin and T E Boult ldquoDifficult detectiona comparison of two different approaches to eye detection for uncon-strained environmentsrdquo in Proc of IEEE 3rd Int Conf on BiometricsTheory Applications and Systems pp 1ndash8 (2009)
44 C Whitelam Z Jafri and T Bourlai ldquoMultispectral eye detection apreliminary studyrdquo in Proc of 2010 Int Conf on Pattern Recognitionpp 209ndash212 (2010)
45 P Viola and M Jones ldquoRapid object detection using a boosted cascadeof simple featuresrdquo in Proc of IEEE CVPR Vol 1 pp I-511ndashI-518(2001)
46 S D Wei and S H Lai ldquoFast template matching based on normalizedcross correlation with adaptive multilevel winner updaterdquo IEEE TransImage Process 17(11) 2227ndash2235 (2008)
47 Open source of blob detection lthttpopencvwillowgaragecomwikicvBlobsLibAlgorithmgt (July 30 2011)
48 R C Gonzalez and R E Woods Digital Image Processing 2nd edpp 523ndash532 Prentice-Hall Englewood Cliffs NJ (2002)
49 G Donato M S Bartlett J C Hager P Ekman and T J SejnowskildquoClassifying facial actionsrdquo IEEE Trans Pattern Anal Mach Intell21 974ndash989 (1999)
50 P N Bellhumeur J P Hespanha and D J Kriegman ldquoEigenfaces vsfisherfaces recognition using class specific linear projectionrdquo IEEETrans Pattern Anal Mach Intell 19 711ndash720 (1997)
51 A M Martinez and A C Kak ldquoPCA versus LDArdquo IEEE Trans PatternAnal Mach Intell 23 228ndash233 (2001)
52 M Turk and A Pentland ldquoEigenfaces for recognitionrdquo J CognitiveNeuro-sci 3 71ndash86 (1991)
53 H Deng L Jin L Zhen and J Huang ldquoA new facial expressionrecognition method nased on local gabor filter bank and PCA plusLDArdquo in Proc of Int Conf on Intelligent Computing August 23ndash26Hefei China pp 6ndash7 (2005)
54 V Vapnik ldquoSupport vector estimation of functionsrdquo in StatisticalLearning Theory pp 375ndash570 Wiley Hoboken NJ (1998)
55 C Hsu C Chang and C Lin ldquoA practical guide to supportvector classificationrdquo Tech Rep Department of Computer Sci-ence and Information Engineering National Taiwan UniversityTaipei lthttpwcsieorg˜cjlinpapersguideguidepdfgt (March 23(2011)
56 L Lang and H Qi ldquoThe study of driver fatigue monitor algorithmcombined PERCLOS and AECSrdquo in Proc of Int Conf on ComputSci and Software Eng pp 349ndash352 (2008)
Optical Engineering December 2011Vol 50(12)127202-23
Jo et al Vision-based method for detecting driver drowsiness and distraction
57 L Harley T Horberry N Mabbott and G Krueger ldquoReview of fa-tigue detection and prediction technologiesrdquo National Road TransportCommission (2000)
58 R Jain R Kasturi and B G Schunck Machine Vision pp 78ndash84McGraw-Hill New York (1995)
59 P O Hoyer ldquoNon-negative matrix factorization with sparseness con-straintsrdquo J Mach Learning Res 5 1457ndash1469 (2004)
60 A Hyvarinen and E Oja ldquoIndependent component analysisrdquo NeuralNetw 13(4ndash5) 411ndash430 (2000)
61 Q Ji and X Yang ldquoReal-time eye gaze and face pose tracking formonitoring driver vigilancerdquo Real-Time Imaging 8(5) 357ndash377 (2002)
62 D F Dinges M M Mallis G Maislin and J W Powell ldquoEvaluationof techniques for ocular measurement as an index of fatigue and thebasis for alertness managementrdquo US Department of TransportationNational Highway Traffic Safety Administration DOT HS 808 762(1998)
63 Smart Eye Pro lthttpwwwsmarteyesegt (25 July 2011)64 S Kawato and J Ohya ldquoReal-time detection of nodding and head-
shaking by directly detecting and tracking the between-eyesrdquo in Procof 4th Intrsquol IEEE Conf Automatic Face and Gesture Recognitionpp 40ndash45 (2000)
65 B Ma S Shan X Chen and W Gao ldquoHead yaw estimation fromasymmetry of facial appearancerdquo IEEE Trans Syst Man Cybern PartB 38(6) 1501ndash1512 (2008)
66 P Watta S Lakshmanan and Y Hou ldquoNonparametric approaches forestimating driver poserdquo IEEE Trans Vehicular Technol 56(4) 2028ndash2041 (2007)
67 J Wu and M M Trivedi ldquoA two-stage head pose estimation frameworkand evaluationrdquo Pattern Recogn 41 1138ndash1158 (2008)
68 E Murphy-Chutorian and M M Trivedi ldquoHyHOPE hybrid head ori-entation and position estimation for vision-based driver head trackingrdquoin Proc of IEEE Intell Vehicles Symp pp 512ndash517 (2008)
69 J P Batista ldquoA real-time driver visual attention monitoring systemrdquoLect Notes Comput Sci 3522 200ndash208 (2005)
70 N K Ratha and V Govindaraju Advances in Biometrics SensorsAlgorithms and System Springer New York (2008)
Jaeik Jo received the BS in electricaland electronic engineering in 2008 fromYonsei University Seoul Korea where he iscurrently working toward the MS-PhD jointdegree His current research interests in-clude driver monitoring systems 3-D face re-construction biometrics pattern recognitionand computer vision
Sung Joo Lee received the BS in electri-cal and electronic engineering and the MSin biometric engineering in 2004 and 2006respectively from Yonsei University SeoulKorea where he received the PhD in elec-trical and electronic engineering in 2011 In2011 he joined the Mobis Co Ltd wherehe is currently an assistant research engi-neer His current research interests includemoving object detection driver monitoringsystem biometrics pattern recognition and
computer vision
Ho Gi Jung received the BE ME and PhDin electronic engineering from Yonsei Univer-sity Seoul Korea in 1995 1997 and 2008respectively He was with MANDO Corpora-tion Global RampD HQ from 1997 to April2009 He developed environmental recog-nition systems for intelligent parking assistsystem collision warning and avoidance sys-tem and active pedestrian protection sys-tem From May 2009 to February 2011 hewas with Yonsei University as a full-time re-
searcher and research professor He researched computer visionapplications for intelligent surveillance systems and biometric sys-tems Since March 2011 he has been with Hanyang University asan assistant professor He is researching recognition systems for in-telligent vehicles His interests are recognition system for intelligentvehicle next generation vehicle computer vision applications andpattern recognition applications
Kang Ryoung Park received his BS and MSin electronic engineering from Yonsei Uni-versity Seoul Korea in 1994 and 1996 re-spectively He also received his PhD in com-puter vision from the Department of Electricaland Computer Engineering Yonsei Univer-sity in 2000 He was an assistant professorin the Division of Digital Media Technologyat Sangmyung University from March 2003to February 2008 He has been an assis-tant and associate professor in the Division
of Electronics and Electrical Engineering at Dongguk University sinceMarch 2008 He is also a research member of BERC His researchinterests include computer vision image processing and biometrics
Jaihie Kim received the BS in electronic en-gineering from Yonsei University Republic ofKorea in 1979 the PhD in electrical engi-neering from the Case Western Reserve Uni-versity USA in 1984 Since 1984 he hasbeen a professor in the School of Electri-cal and Electronic Engineering Yonsei Uni-versity Currently he is the Director of theBiometric Engineering Research Center inKorea the Chairman of the Korea Biomet-ric Association a member of the National
Academy of Engineering of Korea and in 2008 he was the Presi-dent of the IEEK (Institute of Electronics Engineers of Korea) andnow an Emeritus President of the IEEK His general research inter-ests are biometrics pattern recognition and computer vision Specif-ically some of his recent research topics include touchless finger-print recognition fake fingerprint detection fake face detection 2D-to-3D face conversion face age estimationsynthesis He was theauthor of many international technical journals which could be foundat lsquohttpcherupyonseiackrrsquo
Optical Engineering December 2011Vol 50(12)127202-24
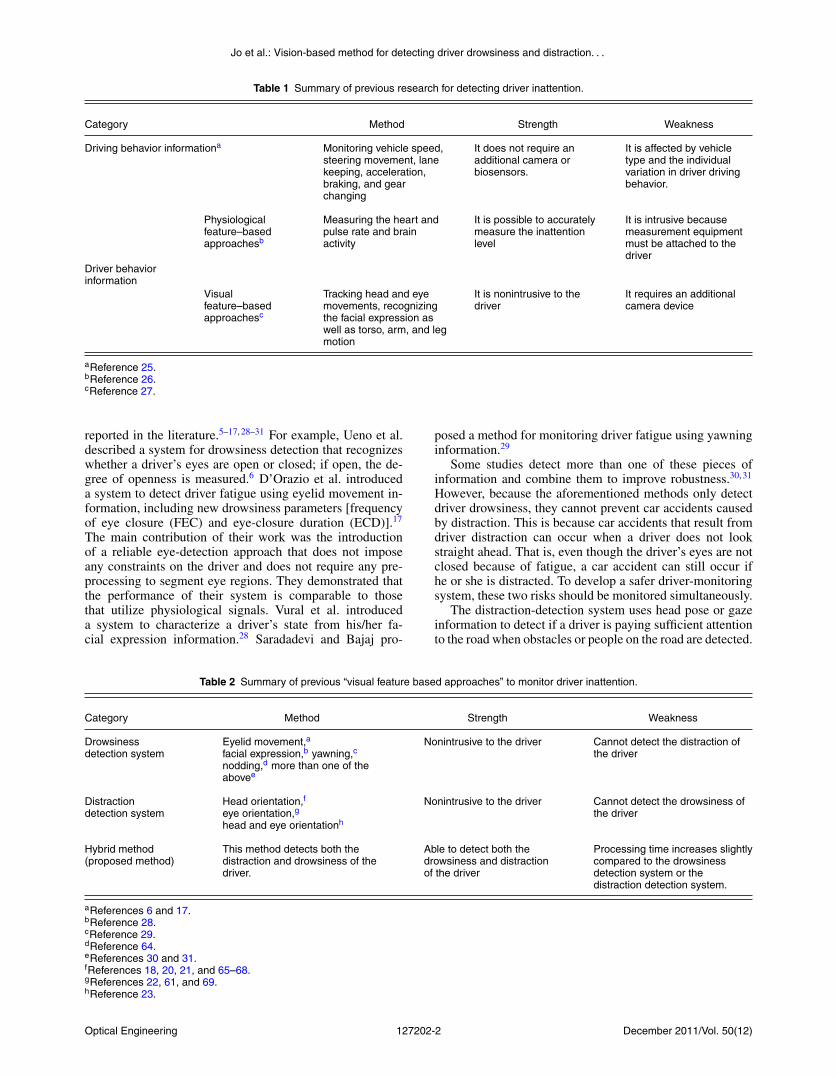
Jo et al Vision-based method for detecting driver drowsiness and distraction
Table 1 Summary of previous research for detecting driver inattention
Category Method Strength Weakness
Driving behavior informationa Monitoring vehicle speedsteering movement lanekeeping accelerationbraking and gearchanging
It does not require anadditional camera orbiosensors
It is affected by vehicletype and the individualvariation in driver drivingbehavior
Physiologicalfeaturendashbasedapproachesb
Measuring the heart andpulse rate and brainactivity
It is possible to accuratelymeasure the inattentionlevel
It is intrusive becausemeasurement equipmentmust be attached to thedriver
Driver behaviorinformation
Visualfeaturendashbasedapproachesc
Tracking head and eyemovements recognizingthe facial expression aswell as torso arm and legmotion
It is nonintrusive to thedriver
It requires an additionalcamera device
aReference 25bReference 26cReference 27
reported in the literature5ndash17 28ndash31 For example Ueno et aldescribed a system for drowsiness detection that recognizeswhether a driverrsquos eyes are open or closed if open the de-gree of openness is measured6 DrsquoOrazio et al introduceda system to detect driver fatigue using eyelid movement in-formation including new drowsiness parameters [frequencyof eye closure (FEC) and eye-closure duration (ECD)]17
The main contribution of their work was the introductionof a reliable eye-detection approach that does not imposeany constraints on the driver and does not require any pre-processing to segment eye regions They demonstrated thatthe performance of their system is comparable to thosethat utilize physiological signals Vural et al introduceda system to characterize a driverrsquos state from hisher fa-cial expression information28 Saradadevi and Bajaj pro-
posed a method for monitoring driver fatigue using yawninginformation29
Some studies detect more than one of these pieces ofinformation and combine them to improve robustness30 31
However because the aforementioned methods only detectdriver drowsiness they cannot prevent car accidents causedby distraction This is because car accidents that result fromdriver distraction can occur when a driver does not lookstraight ahead That is even though the driverrsquos eyes are notclosed because of fatigue a car accident can still occur ifhe or she is distracted To develop a safer driver-monitoringsystem these two risks should be monitored simultaneously
The distraction-detection system uses head pose or gazeinformation to detect if a driver is paying sufficient attentionto the road when obstacles or people on the road are detected
Table 2 Summary of previous ldquovisual feature based approachesrdquo to monitor driver inattention
Category Method Strength Weakness
Drowsinessdetection system
Eyelid movementa
facial expressionb yawningc
noddingd more than one of theabovee
Nonintrusive to the driver Cannot detect the distraction ofthe driver
Distractiondetection system
Head orientationf
eye orientationg
head and eye orientationh
Nonintrusive to the driver Cannot detect the drowsiness ofthe driver
Hybrid method(proposed method)
This method detects both thedistraction and drowsiness of thedriver
Able to detect both thedrowsiness and distractionof the driver
Processing time increases slightlycompared to the drowsinessdetection system or thedistraction detection system
aReferences 6 and 17bReference 28cReference 29dReference 64eReferences 30 and 31fReferences 18 20 21 and 65ndash68gReferences 22 61 and 69hReference 23
Optical Engineering December 2011Vol 50(12)127202-2
Jo et al Vision-based method for detecting driver drowsiness and distraction
Recent surveys on head orientation and gaze from imagesequences can be found in Refs 18 and 19
Among various methods we focused on the previousdriverrsquos gaze and head orientation methods developed forvehicular environments For example Hattori et al intro-duced a forward warning system that employs driver behav-ioral information20 Their system determines driver distrac-tion when it detects that the driver is not looking straightahead Trivedi et al recognized driver awareness using headpose information obtained by a localized gradient orientationhistogram and support vector regressors (SVRs)21 Smithet al analyzed global motion and color statistics to robustlytrack a driverrsquos facial features22 Using these features theyestimated continuous gaze direction However this methodcannot always localize facial features when the driver wearseyeglasses makes conversation closes his eyes or rotateshis head It also failed to work at night Kaminski et al in-troduced a system to compute both head orientation basedon a geometrical model of the human face and eye-gaze de-tection based on a geometrical model of the human eye23
They estimated continuous head orientation and gaze direc-tion However the above-mentioned systems for automotiveapplications did not deal with the problem of driver drowsi-ness That is although the driver is looking ahead he orshe can drive while drowsy Therefore a method that moni-tors both visual distractions and drowsiness is needed for thedriver-monitoring system
Although a technical study32 has reported an intelligentvehicle safety system that detects distraction and drowsinessin real road test conditions such a system differs from oursystem in the following aspects
First it independently detects driver drowsiness and dis-traction using commercialized products Smart Eye Pro and3D head model respectively These two products are simul-taneously operated in all cases On the other hand our systemdivides the driverrsquos state into two cases and then if the driveris looking ahead the system operates the drowsiness detectorHowever if the driver is not looking ahead the system op-erates the distraction detector Therefore the computationalcost of the system can be decreased The other advantage ofthe proposed method is that the eye-detection errors and theconsequent false alarms for drowsiness are decreased in thecase of large head rotation In general eye detection duringlarge head rotation is difficult because the texture and shape ofthe eyes change markedly as a result of head rotation There-fore in the proposed method eye detection is performed onlyin the case of drowsiness detection (when the driver is lookingahead) Both facial border lines and nose center lines are usedin the case of distraction detection (when the driver is notlooking ahead) without eye detection Thus eye-detectionerrors and the consequent false alarms for drowsiness can bedecreased
Second experimental results for blink detection have notbeen provided in the technical study whereas they have beenincluded in our paper Third the study reports that Smart EyePro does not work well when the driver wears eyeglasses orsunglasses the drivers who were tested did not wear glassesIn contrast our system exhibits good performance regardlessof the use of glasses
Fourth Sec 333 of the technical study32 states that3-D head model estimation requires initial calibrationwhich causes inconvenience to the driver and requires alonger processing time On the other hand the proposed
method does not require initial calibration Fifth becausetwo 8-mm IDS uEye USB-cameras were used in thatstudy32 the system was bulky and economically infeasi-ble In contrast only one camera is used in the proposedsystem
In order to measure both drowsiness and distraction in theproposed method we first detect the face region and estimatethe driverrsquos head orientation to determine the gaze direc-tion of driver Accordingly the proposed system determineswhether the driver is looking ahead If the estimated head ori-entation indicates that the driver is not looking ahead thenthe system monitors the driver-distraction level and soundsan alarm when the level is dangerously high If the esti-mated head orientation indicates that the driver is lookingahead then the system detects the driverrsquos eyes to determinethe drowsiness level In this case the system focuses solelyon driver drowsiness The driver-drowsiness level is mea-sured as PERCLOS which is the percentage of eye closuretime during a certain time interval12 Similarly the distrac-tion level is measured as PERLOOK which is the percent-age of time spent not looking ahead during a certain timeinterval
The contributions of the proposed composite method areas follows First the computational cost of system can bedecreased Second eye-detection errors and the consequentfalse alarms for drowsiness are decreased in the case oflarge head rotation Third we developed a hardware unitcapable of eliminating specular reflection due to sunlightreflected by a driverrsquos glasses This unit is essential tothe system because the specular reflection makes it diffi-cult to detect the eyes The unit comprises near-infrared(NIR) illuminators a camera and a narrow bandpass fil-ter whose pass band matches the wavelength of the illu-minator The detailed configuration of the unit is describedin Sec 22 Fourth we propose an eye-detection algorithmthat combines adaptive boosting (adaboost) adaptive tem-plate matching and blob detection with eye validation Thisfacilitates accurate eye detection even when the driverrsquoshead is slightly rotated or the eyes are closed Fifth weintroduce a novel eye-statendashdetection algorithm that com-bines appearance features obtained using PCA and LDAwith statistical features such as the sparseness and kurto-sis of the histogram from the horizontal edge image of theeye
The remainder of the paper is organized as follows InSec 2 we describe the proposed DIMS which comprises eyedetection eye-state detection and inattention determinationIn Sec 3 we present experimental results with a databasecollected from a vehicle under various conditions Finallythe conclusion is provided in Sec 4
2 Proposed Driver-Monitoring Method
21 Overview of Proposed MethodThe proposed method consists of face-detection head-orientationndashestimation eye-detection eye-statendashdetectiondrowsiness-detection and distraction-detection steps asshown in Fig 1 In this work we used the methodsfor face detection and head-pose estimation proposed inRef 33 In the face-detection step the face region is foundwithin the driverrsquos entire facial image to remove unnecessarybackground and to set the regions of interest (ROIs) used in
Optical Engineering December 2011Vol 50(12)127202-3
Jo et al Vision-based method for detecting driver drowsiness and distraction
Fig 1 Flowchart of the proposed driver-monitoring system
the yaw anglendashestimation step In the yaw anglendashestimationstep the left and right borders and center of the driverrsquosface are extracted to estimate the driverrsquos yaw In additionthe normalized mean and standard deviation of the horizon-tal edge-projection histogram are extracted to estimate thedriverrsquos pitch In the estimation step of the driverrsquos head ori-entation using the extracted features the driverrsquos yaw andpitch angles are determined by the ellipsoidal face model andSVR respectively33
The distraction and drowsiness are determined from thehead pose of a driver First the proposed system monitorswhether the driver is paying adequate attention to the roadahead based on the estimated head pose If the frequencyof time in which the driver does not see the road aheadover a certain period of time is greater than a predeterminedthreshold then a warning signal is produced by the distractiondetection Even if the driver is looking straight ahead if thepercentage of time that the driver closes hisher eyes duringa certain period of time exceeds a predetermined threshold awarning signal is also generated by the drowsiness-detection
system A detailed description of each stage can be found inSec 23
22 Image Acquisition MethodThe proposed system consists of two 850-nm illuminators(LED 850-66-60)34 a camera (EC650) (Ref 35) having alens (ML 0614) of 6-mm focal length36 a laboratory-madedevice for controlling the illuminators and a narrow band-pass filter (NT43-148) (Ref 37) placed in front of the cameraExcept for the device that controls the illuminators all theother components are commercially available In our experi-ments we also used two types of vehicles a sedan (GrandeurHyundai Motors) (Ref 38) and a sport-utility vehicle [(SUV)Sportage KIA motors]39
To test the applicability of the system images were ac-quired for the two types of vehicles these images were nearlysimilar When the driver wears eyeglasses glint may be gen-erated by NIR light which may hide the entire eye region Toresolve this issue in the proposed system the camera tiltingangle is constrained to sim45 deg below the driverrsquos face In
Optical Engineering December 2011Vol 50(12)127202-4
Jo et al Vision-based method for detecting driver drowsiness and distraction
Fig 2 Images obtained in various wavelengths using sunglasses(a) 700 nm (b) 750 nm (c) 850 nm and (d) 950 nm
addition the installation height of the proposed device is setto sim70 cm from the driverrsquos feet
A system that can operate in various vehicle environmentsshould satisfy the following three conditions
1 The system should work during both daytime andnighttime Because there is no sunlight at night weprovide additional NIR illumination to capture thedriverrsquos facial image Because visible lights can daz-zle drivers when driving NIR illuminators were usedto capture images We also adjusted the shutter speedof the camera automatically to prevent image satura-tion
2 The system should be operative for drivers who wearsunglasses We performed experiments to identify theproper wavelength of NIR illumination To observethe transmittance of various colors of sunglasses ac-cording to various wavelengths of NIR illuminatorswe conducted tests with black brown blue yellowand pink semitransparent sunglasses As an experi-ment we used an electronically tunable liquid-crystalfilter that has 10-nm bandwidth and a pass-band rangefrom 650 to 1100 nm to capture the images of userswearing sunglasses in the range of 700ndash950 nmFigure 2 depicts the captured face images of a userwearing black sunglasses at 700- 850- and 950-nmwavelengths From this it is evident that the blacksunglasses can be transmitted by the NIR illumina-tion which has a longer wavelength than 750 nmIn the experiments with various wavelengths wefound that the transmission increased from 700 tosim850 nm and then decreased after sim900 nm Wecan confirm in Fig 2 that the light in 700 nm isnot transmitted but that the light in 850 nm is welltransmitted into the sunglasses In Fig 2(d) we canconfirm that the brightness in 950 nm is decreasedbecause the sensor response of the camera is de-creased in accordance with the increase in wave-length Thus we selected 850 nm as the wavelength ofthe NIR illuminator considering the good transmis-sion camera-sensor response and lack of dazzlingeffect
3 The system should be operative when drivers weareyeglasses on which reflected sunlight is generatedThis problem is often encountered in a real automotiveenvironment as shown in Fig 3 A method was reportthat utilized a polarizing filter to remove the reflectedsunlight40 However because sunlight includes vari-ous directional lights it is unknown which direction ofthese lights caused the reflection Thus a polarizingfilter which eliminates the reflection by only pene-
Fig 3 Images of reflected sunlight on eyeglasses
trating specific directional light has limits In the ex-periment with a polarizing filter the reflection couldbe removed only when the directions of the polarizingfilter and the light causing the reflection matched Be-cause the directions of light that causes the reflectionscan be changed but the direction of the polarizingfilter cannot be changed in real time when drivingthe polarizing filter is unsuitable for vehicle appli-cation Moreover because only specific light passesthrough the polarizing filter the image brightness wasdecreased
To overcome these problems and remove the reflected sun-light we use a NIR illuminator and a narrow bandpass filterwhose pass band matches the illuminator First the narrowbandpass filter is installed in front of the camera and restrictsthe incoming wavelength of light to 850 nm with a centralwavelength tolerance of 2 nm37 In the various wavelengthsof sunlight only sunlight with a wavelength of 850 nm passesthrough the narrow bandpass filter and lights of most wave-lengths that caused the reflection are diminished Two high-power light-emitting diode (LED) illuminators34 cast a lightwith 850 nm on the driverrsquos face Because the driver sits in-side a car in which the amount of sunlight is not greater thanthat on the outside we can make the effect of the high-powerLED illuminators greater than the sunlight Consequentlythe reflections on glasses can be eliminated A configurationof our system is shown in Fig 4 and the experimental resultsfor removing reflected sunlight using a NIR illuminator anda narrow bandpass filter are shown in Fig 5
The VTI report32 for driver monitoring briefly mentionsthe use of NIR illuminators and a bandpass filter commercialproducts are used and details such as the wavelengths of NIRilluminators and the filter are not provided Although NIRilluminators and a bandpass filter have been used previouslyfor eye detection in our study we experimentally determinedthe optimal wavelengths of these components To the bestof our knowledge the details of the NIR illuminators andbandpass filter have been reported for the first time in ourstudy
Optical Engineering December 2011Vol 50(12)127202-5
Jo et al Vision-based method for detecting driver drowsiness and distraction
Fig 4 Developed driver-monitoring device (Ref 33)
23 Eye-Detection Method Considering DriverrsquosHead Pose
231 Determination of the range of eye detectionconsidering head pose
The face-detection and head-pose estimation process is per-formed before detecting the driverrsquos eyes33 Through the esti-mated head pose if it is determined that the driver is lookingahead the system detects the eyes to determine drowsinessOtherwise the system does not detect the eyes but does mon-itor the driverrsquos distraction level which is the percentage ofareas viewed other than the front for a certain time intervalThe reasons why the proposed system does not detect theeyes when the driver is not looking ahead are as followsFor driver monitoring the information regarding eye blink-ing is required to detect driver drowsiness However an earlysymptom of drowsy driving is that drivers begin to fall asleepwhen looking ahead but not to the side In light of this phe-nomenon the proposed system does not detect the eyes whenthe driver is not looking ahead This can also solve the prob-lem of high computational cost and low accuracy of driver-monitoring systems for detecting rotated eyes Moreover ifdrivers look at a nonfrontal area when driving this is as haz-
Fig 5 Experimental results for removing a reflected sunlightwithwithout NIR illuminators and a narrow bandpass filter (a) withouta filter and illuminators (b) with a filter and illuminators
ardous as drowsy driving Thus it should be detected by thedistraction-detection method and an alarm signal should beset off Therefore we propose a driver-monitoring systemthat detects the eyes only when the driver looks ahead andmonitors driver distraction when the driver does not lookahead
Before the system detects the eyes it is necessary to de-termine whether the driver is facing the front of the vehicleIn normal straight-road driving when drivers are paying at-tention to the road ahead their facial direction is withinapproximately plusmn15 deg from the straight normal From thisfact the range of facial directions spanning plusmn15 deg is desig-nated ldquofrontrdquo and facial directions greater than plusmn15 deg aredesignated ldquononfrontrdquo The validity of this figure has beenproven in our real-driving test and also in the experimentsconducted by Toyota41 In the experiments by Toyota theysuggested plusmn15 deg as the yaw-angle condition for the frontangle of a driver The same result is obtained in our real-driving experiments In order to measure the ground-truthdata for a head orientation we used an electromagnetic sen-sor called Patriot as shown in Fig 642 The experimentalresult is shown in Fig 7
From the above real-driving test we can confirm that theyaw angle of a driver facing the front of a vehicle is withinplusmn15 deg In the graph the angles are greater or less than thisyaw-angle range when the driver views the side mirror orside windows Except for these cases the head-pose rangeof driver is included in the above-mentioned range of frontviewing within plusmn15 deg
Fig 6 Patriot sensor attached behind the driverrsquos head (Ref 33)
Optical Engineering December 2011Vol 50(12)127202-6
Jo et al Vision-based method for detecting driver drowsiness and distraction
Fig 7 Facial yaw angle distribution in a real driving test (a) driver 1(b) driver 2 and (c) driver 3
The proposed system only detects eyes within this yawangle range If the estimated facial yaw angle is withinplusmn15 deg then the eye ROI is set by using the left and rightborder line centerline and statistical position of the eye inthe face The system then detects the eyes only in this re-
gion The proposed eye-detection algorithm is presented inSec 232
232 Eye-detection methodIn a previous study Scheirer et al43 proposed two dif-ferent approachesmdasha machine learning approach and acorrelation filter approachmdashfor eye detection under un-favorable acquisition circumstances such as low illumi-nation distance variation pose variation and blur Thiseye-detection method is inconvenient because visible lightis required at nighttime which distracts the driver or causespupil contraction In another study Whitelam et al44 an-alyzed eye detection across three different bands (iethe visible multispectral and short-wavendashinfrared (SWIR)bands) in order to illustrate the advantages and limitationsof multiband eye localization However they did not usea narrow bandpass filter for the NIR camera hence thecaptured eye image may contain a large amount of sunlightwhich can make it difficult to locate the eye region More-over eye validation is not conducted which may result infalse eye detection Our system adopts a narrow bandpassfilter and eye validation in order to improve eye-detectionperformance
Our eye-detection algorithm is developed by combin-ing eye adaboost45 adaptive template matching46 blobdetection47 and eye validation The adaboost method hasbeen widely adopted for detecting various facial compo-nents such as the face nose mouth and eyes where weakclassifiers are combined in a cascade this yields a strongerclassifier45 In our system we used the standard OpenCVHaar cascade to detect the face and eyes
The adaptive template-matching method is a digitalimage-processing technique for identifying the correspond-ing parts that match a template in an input image The tem-plate and eye candidate images are compared to determinewhether the two images have a matching region One methodfor template is given by
R(x y) =sum
xprime yprime [T (x prime yprime) minus I (x + x prime y + yprime)]2radicsumx primeyprime T (x prime yprime)2middotsumx primeyprime I (x + x prime y + yprime)2
(1)
where I denotes the input image T denotes the template andR(x y) denotes the matching result at position (x y) Theranges of xprime and yprime are [0 w ndash 1] and [0 h ndash 1] respectivelyw and h are the width and height of the template imagerespectively If the matching value R(x y) is small then itindicates higher similarity if it is large then it indicates lowersimilarity Among all the calculated R(x y) the position(x y) where R(x y) is minimized is selected as the finalmatching position The shape of the eye slightly changes inevery frame hence it is impossible to detect all possible eyeshapes with one fixed template Thus the template is updatedin every frame by the eye image that is successfully detectedin the previous frame
Blob detection is explained as follows From the origi-nal eye image a binary image is obtained on the basis of theadaptive threshold that is set with the mean value of the blockthen it is subjected to the morphology step In the morphol-ogy step there are two phases erosion and dilation48 Firstthe white pixels are expanded and the black pixels are dimin-
Optical Engineering December 2011Vol 50(12)127202-7
Jo et al Vision-based method for detecting driver drowsiness and distraction
Fig 8 Flowchart of proposed eye-detection algorithm
ished by an erosion operator Because the remaining blobs ofthe eyeglass frame may be wrongly detected as eyes the eye-glass frame should be removed by an erosion operator Nextthe black pixels of the eye region diminished by the erosionoperator are expanded by a dilation operator This processof sequentially erosion and dilation is defined as the openingprocess and it has the effect of noise elimination48 After theopening process is applied twice a large blob is generatedfor an eye and small blobs are generated for noise The label-ing process is performed with all the remaining blobs Thusthe remaining blobs are grouped with neighboring blobs andlabeled according to their connectivity48 Therefore all theblobs are represented as being isolated After that all thepixel ldquopositionsrdquo of each isolated blob can be obtained Ac-cordingly the ldquosizerdquo of the blob is calculated as the numberof the pixels of the blob In addition the width and heightof the outermost rectangular box including the blob can beobtained Then the ratio of the height to the width can becalculated as the ldquoshaperdquo of the blob The position size andshape are finally used to determine the location of the eyeOpen source is used for blob detection47
These methods are combined to detect the eyes quicklyand accurately If adaboost alone is used for eye detectionthen it has a great deal of computational cost and cannot de-tect closed eyes To resolve these problems in the first frameeye adaboost is used in the eye-detection step and after theeye verifier checks that the eyes are correctly detected thedetected eye image is saved as a template In the next framethe eyes are detected by adaptive template matching using thepreviously saved template and the template is then updatedby the newly detected eye image This is better than onlyusing eye adaboost in every frame in terms of computationalcost and performance of closed-eye detection However eyeshapes are changeable from an open shape to a closed shapeIf the shape of an opened eye is saved as the template and the
closed eye appears at the next frame then the eyes cannot bedetected by the adaptive template-matching method Thuswhen the adaptive template-matching method fails to detecteyes adaboost is used again to detect the eyes If adaboostalso fails to detect the eyes then the blob-detection method isapplied to do so When the eyes cannot be detected by thesethree eye detectors the previous position of the eye is keptFigure 8 depicts a flowchart of the eye-detection algorithm(a detailed explanation for eye detection will be provided)
The system attempts to realize eye detection using theadaboost eye detector45 The eye adaboost has good per-formance for detecting eyes when the driverrsquos head pose isfrontward However as shown in Fig 9 it has the disadvan-tage of missing eyes when the driverrsquos head pose is rotated orwhen the driverrsquos eyes are closed It also takes a long time todetect the eyes if the eye adaboost is applied in every frame
To resolve these problems with adaboost the adaptivetemplate-matching method was combined with adaboost Inthe first frame the system detects eyes by using adaboostand then saves the detected eye images to a template Inthe next frame adaptive template matching is applied tolocate the eyes As such even the rotated or closed eyesthat were not detected by adaboost can be detected Theadvantage of adaptive template matching is that it requiresless computational cost than adaboost The adaboost needs30 times more computational cost than the adaptive templatemethod As such the eye-detection method combined withadaboost and adaptive template matching is more efficientthan using adaboost alone This combination is robust tohead-pose variation and can detect a closed eye as shown inFig 10
However because the eye detector using these combina-tions may still fail to find eyes the blob-detection methodis additionally supplemented to the combination to improvethe performance of eye detection In particular blob detection
Optical Engineering December 2011Vol 50(12)127202-8
Jo et al Vision-based method for detecting driver drowsiness and distraction
Fig 9 Eye-detection results obtained using adaboost (a) Frontal face (success) (b) rotated face (fail) and (c) closed eye (fail)
improves the detection rate of closed eyes that are not de-tected by adaboost and template matching and saves process-ing time Figure 11 shows a flowchart of the blob-detectionmethod
From the original eye image a binary image is obtainedby the adaptive threshold that is set with the mean value of theblock and then passes through the morphology step In themorphology step there are two phases erosion and dilationFirst the white pixels are expanded and the black pixels arediminished by an erosion operator Because the remainingblobs of the eyeglass frame can be misrecognized as eyesthe eyeglass frame should be removed by an erosion operatorto prevent this from happening Next the diminished blackpixels of the eye region by the erosion operator are expandedby a dilation operator This process of sequentially passingthrough erosion and dilation is defined as the opening processand has an effect of noise elimination48 After the openingprocess is applied twice a large blob for an eye and smallblobs for noise are finally generated All remaining blobsare grouped with neighbor blobs into individual groups anda labeling process ensues To apply the labeling processwe used an open source of blob detection (this source codeis available in Ref 47) The location of the eye is finallydetermined by considering the size shape and position ofblobs
In the eye-detection step the eye-validation process playsan important role in checking whether the detected eyeregion actually contains eyes As shown in Fig 12 this isan eye-validation process that validates the eye detected byadaboost adaptive template matching and blob detectionIf a noneye region is falsely found by the eye detector andsaved in the template without any further validation pro-cess the region containing no eye will be continuously de-tected by the adaptive template matching in the next frameThus an eye-validation process is needed to prevent errorpropagation
In the eye-validation process we used two classicalfeature-extraction methods namely principal component(PC) analysis49ndash52 (PCA) and linear discriminant analysis(LDA)49ndash51 which were used in a different application in(Refs 51 and 53) In this paper we use the PCA + LDAmethods to extract features for eye validation
PCA is a well-known unsupervised algorithm for linearfeature extraction it is a linear mapping that uses the eigen-vectors with the largest eigenvalues In the PCA methodthe pixels of an eye image are ranked as a column vectorxi = (x1i x2i xni)T isin Rn and then by the l matrix X= x1 x2 xl denotes the training sample set that con-sists of l eye images After the mean vector of X is calculatedcentered data are obtained by subtracting the mean from allsamples The PCA can be used to find a linear transformationorthonormal matrix WPCA[m times n(m n)] mapping the orig-inal n-dimensional feature space into m-dimensional featuresubspaces The reduced feature vector yi is defined by
yi = W TPCAxi (i = 1 2 l) (2)
The columns of WPCA are the m eigenvectors associatedwith the m largest eigenvalues of the scatter matrix S whichis defined as
S =lsum
i=1
(xi minus μ)(xi minus μ)T (3)
where μ is the mean of all images in the training setLDA is a supervised learning method that utilizes the cat-
egory information associated with each sample The goal ofLDA is to maximize the between-class scatter while minimiz-ing the within-class scatter The within-class scatter matrixSW and between-class scatter matrix SB are defined as
SB =csum
j=1
(μ j minus μ)(μ j minus μ)T (4)
Fig 10 Eye-detection results obtained by combining with adaptive template matching and adaboost (a) Frontal face (success) (b) rotated face(success) and (c) closed eye (success)
Optical Engineering December 2011Vol 50(12)127202-9
Jo et al Vision-based method for detecting driver drowsiness and distraction
Fig 11 Flowchart of the blob-detection method (a) open eye and (b) closed eye
SW =csum
j=1
N jsumi=1
(x j
i minus μ j)(
x ji minus μ j
)T (5)
where x ji is the irsquoth sample of class j μj is the mean of class
j μ is the mean image of all classes Nj is the number ofsamples of class j and c is the number of classes
In order to guarantee that SW does not become singular werequire at least n + c samples In practice it is difficult to ob-tain so many samples when the dimension of feature n is veryhigh PCA + LDA is proposed to solve this problem51 52
Let the output of PCA be the input of LDA and finally thefeature vectors of eye images are given by
zi = W TLDAW T
PCAxi (i = 1 2 l) (6)
Now let us return to our eye-validation process Eye val-idation is composed of a training and testing process asshown in Fig 12 In the training step the eye-template im-age of 40times26 pixels in the training database is defined asthe column vector of 1040times1 pixels The column vector isthen reduced to an eigenvector with 13 dimensions by us-ing PCA which seeks a projection that best represents theoriginal data in a least-squares sense The eigenvector is re-duced to 11 dimensional spaces (features) by using LDAwhich seeks a projection that best separates the data in aleast-squares sense After the features that best separate eyeand noneye are normalized they are entered into a supportvector machine (SVM) and trained to classify eye and non-eye well An SVM is a classifier that finds the maximum
Fig 12 Eye-validation process
Optical Engineering December 2011Vol 50(12)127202-10
Jo et al Vision-based method for detecting driver drowsiness and distraction
margin hyperplane that optimally separates the data into twocategories for the given training set In general an SVM canbe represented by54
f (x) = sgn
(ksum
i=1
αi yi K (x xi ) + b
) (7)
where k is the number of data points and yi isin ndash1 1 isthe class label of training point xi The coefficients αi arefound by solving a quadratic programming problem with lin-ear constraints and b is a bias To obtain a good classificationperformance a SVM needs to choose a ldquogoodrdquo kernel func-tion K(x xi) In this paper we used a radial basis function(RBF) kernel as shown in Eq (8) because it generally hasfewer numerical difficulties55
KRBF(x x prime) = exp(minusγ ||x minus x prime||2) (8)
In the testing step after features are extracted from theeye image in the testing set by PCA + LDA in the same wayas the training step the extracted features are entered into theSVM to learn the classification of eye and noneye Figure 12depicts this eye-validation process for training and testingWhen the eye validation was added to the eye-detection al-gorithm the accuracy of eye detection was improved Thisresult will be shown in the Sec 3 experiment
24 Eye-State Detection (Determination of Openor Closed Eye)
Drivers that are sleepy exhibit several visual behaviors thatare easily observable from the changes in their facial fea-tures such as the eyes head and face There are many pa-rameters of drowsiness that reflect the vigilance level of adriver such as eye-closure duration (ECD) frequency of eyeclosure (FEC) average eye-closure speed (AECS) and per-centage of eye closure over time (PERCLOS)56 57 For all ofthem the determination of eye state open or closed eye isa necessary step In this section we introduce the novel fea-tures for eye-state analysis The performance of determiningeye status (opening and closing) is enhanced by combiningthe appearance features by PCA and LDA and the statisticalfeatures such as the sparseness and kurtosis of the histogramfrom the eye-edge image
241 Feature extractionPrincipal component and linear discriminant analyses Thefeatures used to determine open or closed eye are 12 dimen-sional features obtained by PCA + LDA This method isthe same as the eye-validation process explained in Fig 12PCA + LDA exhibits better performance than PCA alonewhen there are few samples in each class51
Sparseness and kurtosis Other features for determiningopen or closed eyes are the sparseness and kurtosis of thehistogram from the eye-edge image These features are ex-tracted to classify open and closed eyes by using horizontaledge image processing Here we briefly explain how thesefeatures are extracted The Sobel operator performs a 2-Dspatial gradient measurement on the detected eye imageTypically this is calculated by the absolute gradient mag-nitude at each point in an input gray-scale image The Sobeledge detector uses a pair of 3times3 convolution masks one es-timating the gradient in the horizontal direction (columns)and the other estimating the gradient in the vertical direction
(rows) A horizontal edge image is obtained using a horizon-tal Sobel convolution mask By applying a p-tile thresholdmethod to the horizontal edge image it is transformed intoa binary image58 From the training data we experimen-tally obtained 7 by the p-tile method The p-tile thresholdmethod uses the size and area of eye to obtain a binary im-age For example if eye occupy p of total area gray-valuehistogram of input image is divided by the percentage andthen a threshold is selected considering the p pixel for eyeThe binarized image is projected onto the horizontal axis(x-axis) and a vertical projection histogram is then acquiredas shown in Fig 13 The histogram of the open eye exhibitsa peak that is concentrated into vertical lines This peak iscaused by the brightness difference of the pupil specularreflection and iris In contrast the histogram of the closedeye exhibits a flat distribution on the x-axis Sparseness isa parameter that measures how much energy of a vector isconcentrated on a few components59 This implies that mostvalues are close to zero and that only a few take significantlynonzero values Kurtosis is a measure of whether the dataare peaked or flat relative to a normal distribution60 That isdata sets with high kurtosis tend to have a distinct peak nearthe mean decline rather rapidly and have heavy tails Datasets with low kurtosis tend to have a flat top near the meanrather than a sharp peak A uniform distribution would be anextreme case Therefore there is similarity between the twoparameters The equations of sparseness and kurtosis are asfollows
Sparseness(x) =radic
d minus (sum |x j |)radicsum |x j |2radic
d minus 1 (9)
where d represents the dimensionality of the vector x whosejrsquoth component is xj
Kurtosis = (1N )sumNminus1
n=0 (xn minus μ)4
σ 4 (10)
where μ is the mean of x and σ is the standard deviation ofx
Figure 13 shows that openclosed eye can be classified bythe sparseness and kurtosis of the histogram As shown inFig 13 it can easily be predicted that an open eye has largervalues of sparseness and kurtosis than a closed eye becausethe open eye has greater bulginess than a closed eye Wecan confirm that the distribution of the open-eye histogram isconcentrated in the center of the x-axis when the histogram ofthe closed eye exhibits a relatively flat distribution Thereforeopen and closed eyes are classified in terms of whether thesparseness and kurtosis of the projected histogram exceed acertain threshold value
242 Combination of featuresThe features that are used to classify open or closed eyeswere first extracted from the appearance features of 12dimensions by PCA + LDA and were then extracted fromthe statistical features of two dimensions by sparseness andkurtosis These extracted features were applied to the SVMclassifier We used a SVM with RBF kernels because theclassification ability of the SVM with radial basis functionkernels was superior to that of the SVM with polynomial andlinear kernels Figure 14 shows these processes that combinefeatures and classify open or closed eyes
Optical Engineering December 2011Vol 50(12)127202-11
Jo et al Vision-based method for detecting driver drowsiness and distraction
Fig 13 Horizontal edge-image process for classification of open and closed eye
25 Detection of Drowsiness and DistractionAfter classifying open or closed eyes and estimating the headpose of a driver the inattention of the driver is determinedby PECLOS which represents the drowsiness level andPERLOOK which represents the distraction level PERC-LOS is a parameter of drowsiness that is widely used tomonitor the drowsiness of a driver It is defined as the por-tion of time that the driverrsquos eyes are closed over a certainperiod57 61ndash63 This parameter can be obtained from
PERCLOS[k] =sumk
i=kminusn+1 Blink[i]
ntimes100 () (11)
where PERCLOS[k] means PERCLOS figure in the krsquothframe and n is a period measuring PERCLOS Blink[i] rep-resents that the eye is opened or closed in the irsquoth frame Ithas ldquo0rdquo if the eye is opened and ldquo1rdquo if the eye is closed Thehigher the PERCLOS is the higher the level of driver fatigueWhen PERCLOS exceeds the predetermined threshold the
proposed system generates a warning of inattention The pre-determined threshold was experimentally determined as 02by our experiments with training data
When a driver cannot look at the road ahead because thehead is rotated it causes the same accident hazard as whena driver cannot look ahead because their eyes are closed Assuch we propose a parameter PERLOOK which measuresthe driver-distraction level in the same way as PERCLOSPERLOOK is defined as the proportion of time that a driverrsquoshead is rotated and the driver does not look at the road aheadThis parameter can be obtained from
PERLOOK[k] =sumk
i=kminusn+1 Nonfront[i]
ntimes100 () (12)
where PERLOOK[k] indicates the PERLOOK figure in thekrsquoth frame and n is a period measuring PERLOOK Non-front[i] indicates that the driver is looking at the frontal ornonfrontal area in the irsquoth frame It is 1 if the driver is look-
Fig 14 Process of combining features and classifying open or closed eyes using an SVM
Optical Engineering December 2011Vol 50(12)127202-12
Jo et al Vision-based method for detecting driver drowsiness and distraction
Table 3 Specification of Database 1 for training
Daytime No subjects 12 persons (Male 9 Female 3 without glasses 2 with glasses 10)
No images 44197 images from 216 image sequences (12 personstimes18 gaze zones)
Nighttime No subjects 11 persons (Male 8 Female 3 without glasses 3 with glass 8)
No images 41155 images from 198 image sequences (11 personstimes18 gaze zones)
ing at the non-frontal area and 0 if the driver is looking atthe frontal area The higher the PERLOOK is the higherthe driver-distraction level is When PERLOOK is greaterthan a predetermined threshold the proposed system gener-ates a warning of inattention The predetermined thresholdwas experimentally determined as 035 by our experimentswith training data From Sec 231 if the yaw angle of adriver is greater than +15 deg or less than ndash15 deg (based onthe frontal direction) and if the corresponding accumulativetime is longer than 35 s during the unit interval of 10 s oursystem determines it as a ldquodistractionrdquo For example if theyaw angle and accumulative time when a driver looks at aGPS device or changes a CD is satisfied by this condition itis determined as a distraction
3 Experiments
31 DatabaseIn order to evaluate the proposed method we attached thedeveloped system in front of a dashboard as shown in Fig 4and we collected 162772 frames from 22 subjects Severalexperiments were carried out using images of subjects of bothsexes some of whom wore sunglasses and eyeglasses duringboth daytime and nighttime The databases were acquired ina car using an NIR camera with a resolution of 640 times 480pixels and a frame rate of 25 fps
In our databases there are two data sets for training andtesting 12 subjects were categorized into a training groupand the remaining 10 subjects were categorized into a test-ing group The images from the training group were storedin database 1 whereas those from the testing group wererecorded in database 2 Database 1 which is shown inTable 3 has also been used in a previous study33 It con-tains 85352 images (6700ndash7500 images per subject) 1090images from database 1 were used to train the eye validationprocess as shown in Fig 12 and Table 4 703 images wereused for the classification process for open and closed eyesas shown in Fig 14 and Table 5 The 85352 training imagesinclude numerous overlapped data which can cause overfit-ting of the classification hyperplane of the SVM In order tosolve this problem 1090 samples from 12 subjects were ran-domly selected and used in SVM training for eye validationThe training set for the SVM classifier in the eye-validationprocess contains 860 positive samples (eye images) and 230negative samples (noneye images) as shown in Figs 15(a)and 15(b) In addition 703 samples from 12 subjects wererandomly selected and used in SVM training for eye-statedetection The training set for the SVM classifier in the eye-statendashdetection process contains 530 positive samples (open-eye images) and 173 negative samples (closed-eye images)as shown in Figs 15(c) and 15(d)
The remaining images in database 1 were heuristicallyused for parameter optimization in eye detection (Sec 232)In conclusion the training data were only used for parameteroptimization and SVM training
Database 2 contains 77420 images (7500ndash8000 imagesper subject) from the testing group In database 2 longerimage sequences were captured for each subject in orderto test the proposed inattention-detection method The sub-jects were requested to look frontally for 5 s and to thendrive normally drowsily or distractedly for the remainingperiod Thus for each subject we obtained three types ofsequences a normal driving video a drowsy driving videoand a distracted driving video In addition the subjects whodid not wear glasses were asked to wear sunglasses in orderto capture a new sequence Similarly the subjects who woreglasses were asked to remove their glasses or wear sunglassesin order to capture a new sequence
As compared to the number of drowsy driving videos thenumber of distracted driving videos is relatively large Thereason is as follows A driver can gaze at the 12 differentpositions (1ndash5 8 11 14ndash18) described in Fig 16 hence weneed to test the performance of distraction detection for thevarious gaze directions Thus for each subject we obtainedmultiple distracted videos in which the subject gazed at the12 different positions
Table 4 Train database for eye validation
Number of eye images used
as training data in eye validation
Glass type Left eyes Right eyes
Eye(positivesamples)
Not wearingglasses
627 473
Eyeglasses 128 208
Sunglasses 105 189
Subtotal 860 870
Noneye(negativesamples)
Not wearingglasses
78 123
Eyeglasses 103 108
Sunglasses 49 79
Subtotal 230 310
Total 1090 1180
Optical Engineering December 2011Vol 50(12)127202-13
Jo et al Vision-based method for detecting driver drowsiness and distraction
Table 5 Train database for eye state detection
Number of eye images used as trainingdata for blink detection
Glass type Left eyes Right eyes
Open eye(positivesamples)
Not wearingglasses
420 440
Eyeglasses 50 70
Sunglasses 60 50
Subtotal 530 560
Closedeye(negativesamples)
Not wearingglasses
102 105
Eyeglasses 33 40
Sunglasses 38 40
Subtotal 173 185
Total 703 745
In the case of distraction a driver is not looking aheadThus the videos in which a driver gazed at 12 different posi-tions among the 18 positions shown in Fig 16 were used forthe performance evaluation of distraction detection Unlikedistraction detection only two states [ie drowsy and normal(awake)] can be considered in the case of drowsiness detec-tion Hence the number of drowsy videos obtained from each
Fig 16 Discrete gaze zones in a vehicle
subject is less than that of distracted videos The duration ofeach distracted video is sim1 min whereas that of each drowsyvideo is around 5ndash10 min Table 6 shows database 2 in detail
32 Experimental ResultsThe experimental phase consists of three parts First theeye-detection algorithm was tested using image sequencesof different people obtained in a vehicle under differenttimes and light conditions Then the algorithm for eye-state detection was tested The features used to classifyeye states were extracted from a long image sequence Fi-nally the algorithm measuring the inattention level of adriver was tested The inattention level is composed of thedrowsiness and distraction levels Drowsiness level was mea-sured by PERCLOS and distraction level was calculated byPERLOOK
321 Eye-detection resultsIn order to evaluate the performance of our eye-detectionalgorithm three experiments were carried out and comparedto each other The first was performed using only the eyeadaboost with our database 2 When it is applied to every
Fig 15 Positive and negative samples provided to the SVM classifier in the training phase (a) Eye images (b) noneye images (c) open-eyeimages and (d) closed-eye images
Optical Engineering December 2011Vol 50(12)127202-14
Jo et al Vision-based method for detecting driver drowsiness and distraction
Table 6 Specification of Database 2 for testing
No subjects 9 persons (Male 6 Female 3 without glasses 9 with glasses 4with sunglasses 5)
No images for eye detection and eye state detection 40256 images from 36 image sequences
No images used for eye detection evaluation 32365 images from 36 image sequences (7891 images wereexcluded because the subject was looking away from the roadahead)
Daytime No images used for eye state detection evaluation 30483 images from 36 image sequences (9773 images wereexcluded because the subject was looking away from the roadahead (7891) or because the eyes could not be classified as openor closed (eg narrow eyes) (1882)
No sequences used to measure inattention level 189 video sequences driving normally
36 video sequences driving drowsily
189 video sequences driving distractedly (Total number of imagesabout 239200 images from 414 image sequences)
No subjects 10 persons (Male 7 Female 3 without glasses 5 with glasses 5)
No images for eye detection and eye state detection 37164 images from 20 image sequences
No images used for eye detection evaluation 28608 images from 20 image sequences (8556 images wereexcluded because the subject was looking away from the roadahead)
Nighttime No images used for eye state detection evaluation 26672 images from 20 image sequences (10492 images wereexcluded because the subject was looking away from the roadahead (8556) and because the eyes could not be classified as beingopen or closed (eg narrow eyes) (1936))
No sequences used to measure inattention level 120 video sequences driving normally
20 video sequences driving drowsily
120 video sequences driving distractedly (Total number of imagesabout 105800 images from 260 image sequences)
sequence frame it requires a long processing time and failsto detect eyes when the head is rotated or the eyes are closedThus it resulted in unsatisfactory eye-detection performanceand a slow processing time as shown in Table 7 In the secondexperiment we combined eye-detecting methods includingadaboost adaptive template matching and blob detectionand this improved both the detection accuracy of the closed-eye and the computational performance The third experi-ment was performed by adding the eye validation to thoseused in the second experiment When the eye validation wasadded to the eye-detection algorithm the accuracy of eyedetection was improved Without any eye verifier to checkwhether the detected eye region truly contains an eye thefalsely detected noneye image may be stored in the template
and the falsely detected eye could be repeatedly detected bythe adaptive template matching from the next frame Con-sequently in the second experiment propagation error wasgenerated and the error rate was 756 in eye detectionHowever after applying the eye-validation process the errorrate was decreased from 756 to 104
The eye-detection rate is calculated as follows First im-ages looking at the frontal area are extracted from totalimages in database 2 (Table 6) and then manually dividedinto eye images [as in Fig 15(a)] and noneye images [as inFig 15(b)] Then the eye-detection rate is calculated by thenumber of images that successfully detect eyes over the totalnumber of images Table 7 presents the eye-detection rateresults and also shows that the eyes can be sim989 success-
Fig 17 Excluded narrow eye samples
Optical Engineering December 2011Vol 50(12)127202-15
Jo et al Vision-based method for detecting driver drowsiness and distraction
Table 7 Results obtained after eye detection algorithms on images in Database 2
Conditions Eye-detection rate
Time Glass type Sequences Frames Adaboost
Proposed method(without the eye
validation process)
Proposed method(with the eye
validation process)
Notwearingglasses
18 19994 7652 9254 9855
Day Eyeglasses 8 8012 6735 9235 9888
Sunglasses 10 4359 6353 9202 9891
Subtotal 36 32365 7250 9242 9868
Notwearingglasses
10 16860 7398 9258 9885
Night Eyeglasses 10 11748 7012 9205 9789
subtotal 20 28608 7239 9236 9846
Total 68 60973 7245 9239 9858
Processing time 231 ms 115 ms 145 ms
fully detected by the proposed eye-detection method regard-less of time gender and glass type Detection error is causedby misrecognition of eyeglass frames eyebrows and eyesthat are partially visible in Fig 15(b) as true eyes Howeverthis detection error is not continuous in the video sequencesbecause the eye template is reset by the eye-validation pro-cess in the next frame when the eye detector detected anoneye
322 Eye-statesndashdetection resultsIn order to evaluate the performance of determining eye sta-tus eye images from database 2 in Table 6 were manuallydivided into two classes open and closed eyes and they wereused as ground-truth data Two experiments were then per-formed The first experiment is designed to test the effectof PCA + LDA features compared to PCA features Thesecond experiment is designed to compare and analyze theclassification performance of multiple features combiningPCA + LDA sparseness and kurtosis
It is of note that narrow eyes such as those in Fig 17 wereexcluded from the performance measurement in the testingdata Because human eyes change smoothly from an open eyeto a narrow eye and then a closed eye it is difficult to classifycrisply whether a narrow eye is an open eye or a closed eye inthe middle of the change However although a narrow eye isjudged as either an open or a closed eye it does not affect thetotal performance of determining drowsy behavior becauseit is a temporary and transitional state between an open andclosed eye Therefore narrow eyes were excluded from thetesting data
The performance in eye-states detection is measured byconsidering two errors For convenience when an open eye isfalsely accepted as a closed eye we define it as a type I errorIn addition when a closed eye is falsely rejected as an openeye we define it as a type II error Thus the performance of
eye-states detection was measured by type I error and type IIerror
In the first experiment in order to detect eye states fea-tures are extracted by PCA or PCA + LDA and the featuresare then entered into SVM and finally classified into open andclosed eyes This process is the same as the eye-validationprocess explained in Fig 12 As shown in Table 8 530 framesof open eyes and 173 frames of closed eyes were used in thetraining and some of the eye images in database 2 were testedThen 12 dimensional features for the best performance wereselected The method using the PCA + LDA exhibits betterperformance in classifying eye states than the method usingonly PCA in our experiment In particular the PCA + LDAfeature is more effective than the PCA or LDA feature whenthere are fewer training samples in each class The combinedfeatures of PCA + LDA are less sensitive to different illu-minations whereas the PCA feature is sensitive to changingillumination51 53
Table 9 shows the eye-statesndashdetection results by PCA+ LDA for each dimension First in order to find the properfeature dimension yielding the best recognition rate whenfeatures were extracted solely by PCA we tested for eachdimension and obtained the 15 dimensions as the best number
Table 8 Training and testing data sets for eye states detection
Eye states included
Data set Open eye Closed eye
Train 530 173
Test 7250 800
Optical Engineering December 2011Vol 50(12)127202-16
Jo et al Vision-based method for detecting driver drowsiness and distraction
Table 9 Recognition error rates by eliminating the first one to six principal components
No eliminated principal components
1 (14 dim) 2 (13 dim) 3 (12 dim) 4 (11 dim) 5 (10 dim) 6 (9 dim)
Inputfeature
Type Ierror
Type IIerror
Type Ierror
Type IIerror
Type Ierror
Type IIerror
Type Ierror
Type IIerror
Type Ierror
Type IIerror
Type Ierror
Type IIerror
PCA +LDA
352 350 343 338 326 325 348 350 339 338 415 413
(2557250
) (28
800
) (249
7250
) (27800
) (236
7250
) (26
800
) (2527250
) (28
800
) (2467250
) (27800
) (301
7250
) (33
800
)
of feature dimensions The recognition rates of PCA featuresare 9612 and 9615 for open and closed states respectively
Previous works in face recognition50ndash52 reported that elim-inating the first one to three PCs improved performance Be-cause these PCs are sensitive to various illuminations theyshould be removed In this study we eliminate the first oneto six PCs to analyze the recognition effect for eye-statesdetection The experiment results are presented in Table 9
Table 9 demonstrates that eliminating the first one to threePCs will achieve the best performance rates in our data Thebest performances for the PCA + LDA feature 326 and325 were obtained by eliminating the first three PCsWhen removing more than four PCs the results grew worse
In the second experiment in order to evaluate the clas-sification performances of several features features areextracted by feature extraction methods their combined fea-tures are entered into an SVM and their classification perfor-mances are then measured There are two kinds of featuresused in the second experiment First appearance features areextracted by PCA + LDA and statistical features are alsoextracted by sparseness and kurtosis The classification per-formances resulted from combining these features are shownin Table 10 We can confirm that the performance was im-proved by combining the appearance features by PCA +
LDA and the statistical features such as the sparseness andkurtosis of the histogram from the eye-edge image
Table 11 shows the total performance of the proposedeye-statesndashdetection method with database 2 the total test-ing data As shown in Table 11 our proposed eye-statesndashdetection method works well in both daytime and nighttimeand also for drivers wearing eyeglasses or sunglasses Fi-nally we obtained results that are 145 and 291 for type Iand type II errors respectively
Some qualitative results of the proposed eye-detectionand eye-statesndashdetection method are shown in Figs 18 and19 The proposed method was robust to image variationscaused by sunlight eyeglasses sunglasses blinking mouthmovement and specular reflection on glasses Here the openeye was marked as a circle and the closed eye was marked asa rectangle The eye region is set in proportion to the detectedface region and the average size of the eye region is 40times26pixels
323 Results of measuring the inattention levelIn the driver-monitoring system it is very important to ensurethat a driver is paying adequate attention to the road ahead amust-see position when driving We can consider two situa-
Table 10 Accuracy of the eye states detection method when using each feature or combining multiple features
Input features
Type I error (Error rate forwhen an open eye is falselyaccepted as a closed eye)
Type II error (Error rate for when aclosed eye is falsely rejected as
an open eye)
Kurtosis 874 (6347250) 875 (70800)
Sparseness 786 (5707250) 788 (63800)
Sparsenesskurtosis
697 (5057250) 700 (56800)
PCA 393 (2857250) 400 (32800)
PCA + LDA 326 (2367250) 325 (26800)
PCA + LDAsparseness
280 (2037250) 275 (22800)
PCA + LDAkurtosis
297 (2157250) 300 (24800)
PCA + LDAsparsenesskurtosis
223 (1627250) 225 (18800)
Optical Engineering December 2011Vol 50(12)127202-17
Jo et al Vision-based method for detecting driver drowsiness and distraction
Table 11 Performance of our proposed method for eye states detection in Database 2
Time Glass type
Type I error (Error rate forwhen an open eye isfalsely accepted as a
closed eye)
Type II error (Error rate forwhen a closed eye is
falsely rejected as an openeye)
Not wearing glasses 120 (19816451) 354 (722032)
Eyeglasses 305 (2046699) 156 (161024)
Day Sunglasses 073 (283830) 112 (5447)
Subtotal 159 (43026980) 265 (933503)
Not wearing glasses 049 (6413185) 315 (621967)
Night Eyeglasses 230 (24110465) 332 (351055)
Subtotal 129 (30523650) 321 (973022)
Total 145 (73550630) 291 (1906525)
tions when a driver does not see the road ahead when drivingFirst it is a situation when the driver closes his or her eyesduring driving while drowsy The second situation is whenthe driverrsquos head is rotated when driving distractedly Bothof these situations are dangerous because the driver does notpay adequate attention to the road ahead In this paper weproposed a system to monitor these hazards simultaneouslyTwo measures PERCLOS and PERLOOK are used to detectthe drowsiness and distraction level respectively
Figure 20 shows the result of PERCLOS measurementfor drowsy sequences the state of a driver is alert for thefirst 100 s and during the remaining time the driver exhibitsdrowsy driving behavior In Fig 20 we were able to confirmthat the driver drowsiness was well detected by PERCLOSHowever if the driver exhibits distracted driving behaviorthe distracted behavior cannot be detected using the PERC-LOS measurement In Fig 21 the driver was requested to
Fig 18 Results of the proposed eye-detection and eye-statesndashdetection method on images captured during the daytime for a driverwho (a) did not wear any glasses and (b) wore sunglasses (Threevertical lines refer to the left right and center of the face)
drive normally for the first 160 s and then distractedly forthe remaining time Figure 21(a) shows the result of PER-CLOS measurement for distracted sequences In Figs 21(a)and 21(b) it is evident that distracted behaviors cannot bedetected using the PERCLOS measure alone Figure 21(a)measured by PERCLOS shows the false determination of adistracted behavior as a normal behavior Figure 21(b) mea-sured by PERLOOK shows that the driver distraction waswell detected at sim160 s
The experiments to measure the drowsiness and distrac-tion levels were executed on the image sequences in database2 For each of the subjects 36 drowsy video sequences and189 distracted video sequences were recorded during the day-time and 20 drowsy video sequences and 120 distracted videosequences were recorded during the nighttime For each ofthe drowsy video sequences about 5ndash10 min of observationwas recorded The subjects were requested to look frontally
Fig 19 Results of the proposed eye-detection and eye-statesndashdetection method on images captured during the nighttime for a driverwho (a) did not wear any glasses and (b) wore eyeglasses
Optical Engineering December 2011Vol 50(12)127202-18
Jo et al Vision-based method for detecting driver drowsiness and distraction
Fig 20 PERCLOS measurement for drowsy sequences
for 5 s and then drive normally or to drowsily drive for theremaining period For each of the distracted video sequencessim1 min of observation was recorded The subjects were re-quested to look frontally for 5 s and then drive normallyor to distractively drive for the remaining period Thus foreach subject we obtained three kinds of sequences normaldrowsy and distracted driving video sequences The experi-mental results using these video sequences are presented in
Table 13 In this experiment we achieved satisfying resultsAs shown in Table 13 the error rate of falsely recognizinga drowsy state or a distracted state as a normal state is 0while the error rate (false alarm) of falsely recognizing anormal state as a drowsy state or a distracted state is sim2That is there was no error in detecting drowsiness or dis-traction when the driver was actually drowsy or distractedOn the other hand six cases of a false alarm occurred in nor-
Fig 21 PERCLOS and PERLOOK measurements for a distracted video sequence (a) PERCLOS and (b) PERLOOK
Optical Engineering December 2011Vol 50(12)127202-19
Jo et al Vision-based method for detecting driver drowsiness and distraction
Fig 22 ROC curves for drowsiness and distraction detection accuracy (a) drowsiness detection and (b) distraction detection
mal driving videos of sim4 h which corresponds to 1ndash2 falsealarms per hour these can be regarded as small errors Failureanalysis revealed that a normal state was falsely recognizedas a drowsy state because the eyes were recognized as closedeyes when the driver laughed for a certain amount of timeErrors related to the driverrsquos habit of blinking hisher eyesoccur frequently Thus the measured PERCLOS was largerthan that for normal drivers Because a false alarm can annoythe driver we focused on the detection of dangerous inatten-tion By changing the decision threshold value the number
of false alarms can be reduced at the expense of increasingthe error of missing true detections
Also the false alarm can be reduced using the othermethods such as facial expression recognition user-specificdriver monitoring or driving behavior information such asmonitoring vehicle speed steering movement lane keepingacceleration braking and gear changing These works wouldbe considered in the future
Figure 22 shows the ROC curve for drowsiness and dis-traction detection accuracy by thresholds PERCLOS and
Optical Engineering December 2011Vol 50(12)127202-20
Jo et al Vision-based method for detecting driver drowsiness and distraction
Fig 23 One screen shot of actual drowsy video
PERLOOK ROC curve is a graphical plot of the sensitivityor true acceptance rate versus false acceptance rate for abinary classifier system because its discrimination thresholdis varied70 For convenience when the inattentive state isfalsely accepted as the normal state we define it as false-acceptance rate (FAR) in this paper In addition when thenormal state is falsely accepted as the inattentive state we de-fine it as false-rejection rate (FRR) When the FAR and FRRare equal the common value is referred to as the equal-errorrate The true-acceptance rate indicates a value subtractingFRR from 100
We describe a comparative experiment for measuringdrowsy parameters in each actual and virtual drowsinessvideo In our test the drowsy driverndashdetection performancewas measured using the virtual drowsiness video that wasobtained when 10 people simulated drowsy driving behaviorWe used a virtual drowsiness video because it is dangerousand difficult to obtain an actual drowsiness video moreoveran open database of actual drowsiness videos is not availableThus it was necessary to compare the values of PERCLOS inthe virtual drowsiness video with those in the actual drowsi-
Table 12 Testing data to detect the drowsiness and distraction of adriver in a vehicle
Time Driver state No test videos
Normal state 189
Day Drowsy state 36
Distracted state 189
Normal state 120
Night Drowsy state 20
Distracted state 120
Total 674
ness video The actual drowsiness video shown in Fig 23was obtained when a subject was actually drowsy at dawn (ataround 400 or 500 AM) Although this video was obtainedin the laboratory the acquisition environment (the positionsof a user and the proposed device the viewing angle of thecamera etc) was similar to that in a car Figure 24 showsgraphs for PERCLOS in the actual and virtual drowsinessvideos It is easy to identify that these features of PERC-LOS are similar In the actual drowsiness video the driverbegins to falls asleep after 300 frames and the average valueof PERCLOS is sim05254 In the virtual drowsiness videothe driver begins to falls asleep after 400 frames and theaverage value of PERCLOS is sim05024 Therefore we canpredict that the drowsy driverndashdetection performance in thevirtual drowsiness video will be similar to that in the actualdrowsiness video
Because it is difficult and dangerous to obtain drowsyor distracted videos in real conditions they were not ob-tained However the 189 videos [in (daytime) normal state ofTable 12] include five videos that were obtained when userswere actually driving on an expressway In the future webelieve that it would be possible to obtain a greater number
Fig 24 Comparison between the PERCLOS values in the actual and virtual drowsiness video (a) actual drowsiness and (b) virtual drowsiness
Optical Engineering December 2011Vol 50(12)127202-21
Jo et al Vision-based method for detecting driver drowsiness and distraction
Table 13 Drowsiness and distraction detection results measured from video sequences in a vehicle
Error rates ()
Misrecognizing adrowsy state asa normal state
Misrecognizing anormal state asa drowsy state
Misrecognizing adistracted state
as a normalstate
Misrecognizing anormal state as
a distractedstate
Misrecognizing adrowsy state as
a distractedstate
Misrecognizing adistracted state
as a drowsystate
0 (056) 162 (5309) 0 (0309) 064 (2309) 179 (156) 0 (0309)
of drowsy or distracted videos in real conditions with thesupport of car manufacturers
324 Processing timeThe proposed driver-monitoring system was efficient andworked in real time The software was implemented usingVisual C + + on an Intel Pentium M processor 160 GHz500 MB RAM Although not all the code optimizationswere completed the processing times are encouraging fora real-time implementation The total processing time was31 msframe and the processing times of each step are shownin Table 14
4 ConclusionIn this study we proposed a driver-monitoring system thatcan be used for warning against driver inattention includ-ing drowsiness and distraction We proposed an algorithmthat automatically localizes the eyes determines whetherthey are opened or closed and finally judges whether thedriver is driving drowsily or distractedly This constitutes anonintrusive approach to detecting driver inattention withoutannoyance or interference in both daytime and nighttime
The framework consists of three steps The first stepinvolves eye detection and tracking In driving sequenceimages adaboost adaptive template-matching and blob-detection methods are combined to detect the eyes automat-ically Eye detection is verified using an eye-validation tech-nique based on PCA + LDA and SVM The proposed eyedetector works well when the driver closes his or her eyes orwears eyeglasses and sunglasses High detection rates wereachieved in tests carried out on 12 people in the database
Table 14 Processing time of proposed driver monitoring system
Process Processing time (msframe)
Eye adaboost 231
Adaptive template matching 07
Blob detector 12
Eye validation by using SVM 22
Total eye detection 145
Eye states detection 24
Head pose estimationa 141
Total processing time 31
aReference 39
during both daytime and nighttime as well as when wearingsunglasses or eyeglasses
The second step is a process for classifying eyes as openedor closed For this purpose appearance-based features are ex-tracted from the detected eye image by PCA + LDA andedge-based features are obtained on the basis of sparsenessand kurtosis The detected eyes are then classified as openor closed by an SVM using the combined features We con-firmed that performance of the combined system is betterthan that of a single system Experimental results revealedthat the classification error rate in the databases was lt3during both daytime and nighttime as well as when wearingsunglasses or eyeglasses
The third step is a process for measuring the drowsinessand distraction levels of the driver In this process we pro-posed a method for checking these two conditions simultane-ously Two measures PERCLOS and PERLOOK are used tocalculate the drowsiness and distraction levels respectivelyand they yield satisfactory results
In the future we plan to conduct tests with a greater num-ber of users and over longer periods of time in order to obtainactual drowsy and distracted behaviors From the viewpointof gaze estimation we need to develop a precise gaze-estimation method using both head-pose and eye-movementinformation In the drowsy driverndashdetection method facialexpression recognition must be employed to distinguisheyes closed due to fatigue from those closed due to vigorouslaughter Moreover because eye size eye blinking frequencyand driving habits vary among drivers we need to developa driver-specific monitoring system using an online trainingmethod This system will exhibit better performance if it isintegrated with other sensors such as the accelerator steeringwheel and lane-position sensor Finally an integrated driv-ing safety system will be more effective when combined witha pedestrian-recognition system and a lane-keeping supportsystem
AcknowledgmentsThis work was supported in part by Mando Corporation LtdAnd in part by the National Research Foundation of Korea(NRF) grant funded by the Korea government (MEST) (GrantNo 2011-0015321)
References1 M R Rosekind E L Co K B Gregory and D L Miller ldquoCrew
factors in flight operations XIII a survey of fatigue factors incorporateexecutive aviation operationsrdquo NASA Ames Research Cen-ter NASATM-2000-209 610 (2000)
2 Awake Consortium (IST 2000-28062) ldquoSystem for effective assess-ment of driver vigilance and warning according to traffic risk estima-
Optical Engineering December 2011Vol 50(12)127202-22
Jo et al Vision-based method for detecting driver drowsiness and distraction
tion (AWAKE)rdquo September 2001ndash2004 lthttpwwwawake-euorggt(April 16 2011)
3 US Department of Transportation ldquo2007 FARSGES an-nual report (final ed)rdquo lthttpwwwnhtsadotgovportalsitenhtsamenuitem6a6eaf83cf719ad24ec86e10dba046a0gt (April 16 2011)
4 W Wierwille L Tijerina S Kiger T Rockwell E Lauber andA Bittne ldquoFinal report supplementmdashheavy vehicle driver workloadassessmentmdashtask 4 review of workload and related researchrdquo USDOTTech Rep No DOT HS 808 467(4) (1996)
5 H Saito T Ishiwaka M Sakata and S Okabayashi ldquoApplicationsof driverrsquos line of sight to automobilesmdashwhat can driverrsquos eye tellrdquo inProc of Vehicle Navigation and Information Systems Conf Yokohamapp 21ndash26 (1994)
6 H Ueno M Kaneda and M Tsukino ldquoDevelopment of drowsiness de-tection systemrdquo in Proc of Vehicle Navigation and Information SystemsConf Yokohama pp 15ndash20 (1994)
7 S Boverie J M Leqellec and A Hirl ldquoIntelligent systems for videomonitoring of vehicle cockpitrdquo in Proc of Int Congress and Exposi-tion ITS Advanced Controls and Vehicle Navigation Systems pp 1ndash5(1998)
8 M Kaneda H Ueno and M Tsukino ldquoDevelopment of a drowsinesswarning systemrdquo in Proc of 11th Int Conf on Enhanced Safety ofVehicle Munich (1994)
9 R Onken ldquoDaisy an adaptive knowledge-based driver monitoring andwarning systemrdquo in Proc of Vehicle Navigation and Information Sys-tems Conf Yokohama pp 3ndash10 (1994)
10 T Ishii M Hirose and H Iwata ldquoAutomatic recognition of driverrsquos fa-cial expression by image analysisrdquo Journal of the Society of AutomotiveEngineers of Japan Vol 41 pp 1398ndash1403 (1987)
11 K Yammamoto and S Higuchi ldquoDevelopment of a drowsiness warningsystemrdquo Journal of the Society of Automotive Engineers of JapanVol 46 pp 127ndash133 (1992)
12 D F Dinges M Mallis G Maislin and J W Powell ldquoEval-uation of techniques for ocular measurement as an index offatigue and the basis for alertness managementrdquo Departmentof Transportation Highway Safety Publication 808 762 April(1998)
13 R Grace V E Byrne D M Bierman and J M Legrand ldquoA drowsydriver detection system for heavy vehiclesrdquo in Proceedings of Digi-tal Avionics Systems Conference 17th DASC Vol 2 pp I361ndashI368(1998)
14 D Cleveland ldquoUnobtrusive eyelid closure and visual of regard mea-surement systemrdquo Conference on Ocular Measures of Driver alertnessApril (1999)
15 J Fukuda K Adachi M Nishida and E Akutsu ldquoDevelopment ofdriverrsquos drowsiness detection technologyrdquo Toyota Tech Rev 45 34ndash40(1995)
16 J H Richardson ldquoThe development of a driver alertness monitoringsystemrdquo in Fatigue and Driving Driver Impairment Driver Fatigueand Driver Simulation L Harrtley Ed Taylor amp Francis London(1995)
17 T DrsquoOrazio M Leo C Guaragnella and A Distante ldquoA visual ap-proach for driver inattention detectionrdquo Pattern Recogn 40 2341ndash2355(2007)
18 E Murphy-Chutorian and M M Trivedi ldquoHead pose estimation incomputer vision a surveyrdquo IEEE Trans Pattern Anal Mach Intell31(4) 607ndash626 (2009)
19 D W Hansen and Q Ji ldquoIn the eye of the beholder a survey of modelsfor eyes and gazerdquo IEEE Trans Pattern Anal Mach Intell 32 478ndash500(2010)
20 A Hattori S Tokoro M Miyashita I Tanakam K Ohue and SUozumi ldquoDevelopment of forward collision warning system using thedriver behavioral informationrdquo presented at 2006 SAE World CongressDetroit Michigan (2006)
21 E Murphy-Chutorian A Doshi and M M Trivedi ldquoHead pose estima-tion for driver assistance systems a robust algorithm and experimentalevaluationrdquo in Proc of 10th Int IEEE Conf Intelligent TransportationSystems pp 709ndash714 (2007)
22 P Smith M Shah and N da Vitoria Lobo ldquoDetermining driver vi-sual attention with one camerardquo IEEE Trans Intell Transp Syst 4(4)2058ndash2218 (2003)
23 J Y Kaminski D Knaan and A Shavit ldquoSingle image face orientationand gaze detectionrdquo Mach Vis Appl 21 85ndash98 (2009)
24 J C Stutts D W Reinfurt L Staplin and E A Rodgman ldquoThe roleof driver distraction in traffic crashesrdquo AAA Foundation for TrafficSafety Washington DC (2001)
25 K Torkkola N Massey and C Wood ldquoDriver inattention detectionthrough intelligent analysis of readily available sensorsrdquo in Proc ofIEEE Conf on Intelligent Transportation Systems Washington DCpp 326ndash331 (2004)
26 G Yang Y Lin and P Bhattacharya ldquoA driver fatigue recogni-tion model using fusion of multiple featuresrdquo in Proc of IEEE IntConf on Syst Man and Cybernetics Hawaii Vol 2 pp 1777ndash1784(2005)
27 S Park and M M Trivedi ldquoDriver activity analysis for in-telligent vehicles issues and development frameworkrdquo in Proc
of IEEE Intelligent Vehicles Symp Las Vegas pp 795ndash800(2005)
28 E Vural M Cetin A Ercil G Littlewort M S Bartlett and J RMovellan ldquoDrowsy driver detection though facial movement analysisrdquoIEEE Int Conf on Computer VisionndashHuman Computer Interaction pp6ndash18 (2007)
29 M Saradadevi and P Bajaj ldquoDriver fatigue detection using mouth andyawning analysisrdquo Int J Comput Sci Netw Security 8(6) 183ndash188(2008)
30 L M Beragasa J Nuevo M A Sotelo R Barea and E LopezldquoReal-time system for monitoring driver vigilancerdquo IEEE Trans IntellTransport Syst 7(1) 1524ndash1538 (2006)
31 R Senaratne D Hardy B Vanderaa and S Halgamuge ldquoDriver fatiguedetection by fusing multiple cuesrdquo Lect Notes Comput Sci 4492 801ndash809 (2007)
32 K Kircher A Kircher and F Claezon ldquoDistraction and drowsinessmdashafield studyrdquo Tech Rep VTI (The Swedish National Road and TransportResearch Institute) (2009)
33 S J Lee J Jo H G Jung K R Park and J Kim ldquoReal-time gaze es-timator based on driverrsquos head orientation for forward collision warningsystemrdquo IEEE Trans Intell Transp Syst 12(1) 254ndash267 (2011)
34 Specification of illuminator lthttproithner-lasercommultiled_multi_tohtmlge (July 25 2011)
35 Camera (EC650) lthttpwwwpyramidimagingcomspecsProsilica700009AA-EC65020User20Manualpdfgt (August 25 2011)
36 Camera lens (ML0614) lthttpwwwphoeniximagingcomml-0614htmge (July 25 2011)
37 Narrow bandpass interference filter (NT43-148) lthttpwwwedmundopticscomonlinecatalogdisplayproductcfmproductid=3198ampPageNum=5ampSort=displayOrderampOrder=ascproductsgt (July 252011)
38 SUV (GIA motors Sportage) lthttpwwwkiacomsportageexploregt (August 25 2011)
39 Sedan (Hyundai Motors Grandeur) lthttpgrandeurhyundaicomge(August 25 2011)
40 T Ito S Mita K Kozuka T Nakano and S Yamamoto ldquoDriver blinkmeasurement by the motion picture processing and its application todrowsiness detectionrdquo in Proc of Int Conf Intelligent TransportationSystems Singapore pp 168ndash173 (2002)
41 K Ohue Y Yamada S Uozumi S Tokoro A Hattori and T HayashildquoDevelopment of a new pre-crash safety systemrdquo SAE Tech PaperSeries Doc No 2006-01-1461 (2006)
42 Specification of motion tracking device called Patriot lthttpwwwpolhemuscompolhemus_editorassetsTech20compare20with20ResolutionvsRange20graphspdfgt (February 15 2011)
43 W J Scheirer A Rocha B Heflin and T E Boult ldquoDifficult detectiona comparison of two different approaches to eye detection for uncon-strained environmentsrdquo in Proc of IEEE 3rd Int Conf on BiometricsTheory Applications and Systems pp 1ndash8 (2009)
44 C Whitelam Z Jafri and T Bourlai ldquoMultispectral eye detection apreliminary studyrdquo in Proc of 2010 Int Conf on Pattern Recognitionpp 209ndash212 (2010)
45 P Viola and M Jones ldquoRapid object detection using a boosted cascadeof simple featuresrdquo in Proc of IEEE CVPR Vol 1 pp I-511ndashI-518(2001)
46 S D Wei and S H Lai ldquoFast template matching based on normalizedcross correlation with adaptive multilevel winner updaterdquo IEEE TransImage Process 17(11) 2227ndash2235 (2008)
47 Open source of blob detection lthttpopencvwillowgaragecomwikicvBlobsLibAlgorithmgt (July 30 2011)
48 R C Gonzalez and R E Woods Digital Image Processing 2nd edpp 523ndash532 Prentice-Hall Englewood Cliffs NJ (2002)
49 G Donato M S Bartlett J C Hager P Ekman and T J SejnowskildquoClassifying facial actionsrdquo IEEE Trans Pattern Anal Mach Intell21 974ndash989 (1999)
50 P N Bellhumeur J P Hespanha and D J Kriegman ldquoEigenfaces vsfisherfaces recognition using class specific linear projectionrdquo IEEETrans Pattern Anal Mach Intell 19 711ndash720 (1997)
51 A M Martinez and A C Kak ldquoPCA versus LDArdquo IEEE Trans PatternAnal Mach Intell 23 228ndash233 (2001)
52 M Turk and A Pentland ldquoEigenfaces for recognitionrdquo J CognitiveNeuro-sci 3 71ndash86 (1991)
53 H Deng L Jin L Zhen and J Huang ldquoA new facial expressionrecognition method nased on local gabor filter bank and PCA plusLDArdquo in Proc of Int Conf on Intelligent Computing August 23ndash26Hefei China pp 6ndash7 (2005)
54 V Vapnik ldquoSupport vector estimation of functionsrdquo in StatisticalLearning Theory pp 375ndash570 Wiley Hoboken NJ (1998)
55 C Hsu C Chang and C Lin ldquoA practical guide to supportvector classificationrdquo Tech Rep Department of Computer Sci-ence and Information Engineering National Taiwan UniversityTaipei lthttpwcsieorg˜cjlinpapersguideguidepdfgt (March 23(2011)
56 L Lang and H Qi ldquoThe study of driver fatigue monitor algorithmcombined PERCLOS and AECSrdquo in Proc of Int Conf on ComputSci and Software Eng pp 349ndash352 (2008)
Optical Engineering December 2011Vol 50(12)127202-23
Jo et al Vision-based method for detecting driver drowsiness and distraction
57 L Harley T Horberry N Mabbott and G Krueger ldquoReview of fa-tigue detection and prediction technologiesrdquo National Road TransportCommission (2000)
58 R Jain R Kasturi and B G Schunck Machine Vision pp 78ndash84McGraw-Hill New York (1995)
59 P O Hoyer ldquoNon-negative matrix factorization with sparseness con-straintsrdquo J Mach Learning Res 5 1457ndash1469 (2004)
60 A Hyvarinen and E Oja ldquoIndependent component analysisrdquo NeuralNetw 13(4ndash5) 411ndash430 (2000)
61 Q Ji and X Yang ldquoReal-time eye gaze and face pose tracking formonitoring driver vigilancerdquo Real-Time Imaging 8(5) 357ndash377 (2002)
62 D F Dinges M M Mallis G Maislin and J W Powell ldquoEvaluationof techniques for ocular measurement as an index of fatigue and thebasis for alertness managementrdquo US Department of TransportationNational Highway Traffic Safety Administration DOT HS 808 762(1998)
63 Smart Eye Pro lthttpwwwsmarteyesegt (25 July 2011)64 S Kawato and J Ohya ldquoReal-time detection of nodding and head-
shaking by directly detecting and tracking the between-eyesrdquo in Procof 4th Intrsquol IEEE Conf Automatic Face and Gesture Recognitionpp 40ndash45 (2000)
65 B Ma S Shan X Chen and W Gao ldquoHead yaw estimation fromasymmetry of facial appearancerdquo IEEE Trans Syst Man Cybern PartB 38(6) 1501ndash1512 (2008)
66 P Watta S Lakshmanan and Y Hou ldquoNonparametric approaches forestimating driver poserdquo IEEE Trans Vehicular Technol 56(4) 2028ndash2041 (2007)
67 J Wu and M M Trivedi ldquoA two-stage head pose estimation frameworkand evaluationrdquo Pattern Recogn 41 1138ndash1158 (2008)
68 E Murphy-Chutorian and M M Trivedi ldquoHyHOPE hybrid head ori-entation and position estimation for vision-based driver head trackingrdquoin Proc of IEEE Intell Vehicles Symp pp 512ndash517 (2008)
69 J P Batista ldquoA real-time driver visual attention monitoring systemrdquoLect Notes Comput Sci 3522 200ndash208 (2005)
70 N K Ratha and V Govindaraju Advances in Biometrics SensorsAlgorithms and System Springer New York (2008)
Jaeik Jo received the BS in electricaland electronic engineering in 2008 fromYonsei University Seoul Korea where he iscurrently working toward the MS-PhD jointdegree His current research interests in-clude driver monitoring systems 3-D face re-construction biometrics pattern recognitionand computer vision
Sung Joo Lee received the BS in electri-cal and electronic engineering and the MSin biometric engineering in 2004 and 2006respectively from Yonsei University SeoulKorea where he received the PhD in elec-trical and electronic engineering in 2011 In2011 he joined the Mobis Co Ltd wherehe is currently an assistant research engi-neer His current research interests includemoving object detection driver monitoringsystem biometrics pattern recognition and
computer vision
Ho Gi Jung received the BE ME and PhDin electronic engineering from Yonsei Univer-sity Seoul Korea in 1995 1997 and 2008respectively He was with MANDO Corpora-tion Global RampD HQ from 1997 to April2009 He developed environmental recog-nition systems for intelligent parking assistsystem collision warning and avoidance sys-tem and active pedestrian protection sys-tem From May 2009 to February 2011 hewas with Yonsei University as a full-time re-
searcher and research professor He researched computer visionapplications for intelligent surveillance systems and biometric sys-tems Since March 2011 he has been with Hanyang University asan assistant professor He is researching recognition systems for in-telligent vehicles His interests are recognition system for intelligentvehicle next generation vehicle computer vision applications andpattern recognition applications
Kang Ryoung Park received his BS and MSin electronic engineering from Yonsei Uni-versity Seoul Korea in 1994 and 1996 re-spectively He also received his PhD in com-puter vision from the Department of Electricaland Computer Engineering Yonsei Univer-sity in 2000 He was an assistant professorin the Division of Digital Media Technologyat Sangmyung University from March 2003to February 2008 He has been an assis-tant and associate professor in the Division
of Electronics and Electrical Engineering at Dongguk University sinceMarch 2008 He is also a research member of BERC His researchinterests include computer vision image processing and biometrics
Jaihie Kim received the BS in electronic en-gineering from Yonsei University Republic ofKorea in 1979 the PhD in electrical engi-neering from the Case Western Reserve Uni-versity USA in 1984 Since 1984 he hasbeen a professor in the School of Electri-cal and Electronic Engineering Yonsei Uni-versity Currently he is the Director of theBiometric Engineering Research Center inKorea the Chairman of the Korea Biomet-ric Association a member of the National
Academy of Engineering of Korea and in 2008 he was the Presi-dent of the IEEK (Institute of Electronics Engineers of Korea) andnow an Emeritus President of the IEEK His general research inter-ests are biometrics pattern recognition and computer vision Specif-ically some of his recent research topics include touchless finger-print recognition fake fingerprint detection fake face detection 2D-to-3D face conversion face age estimationsynthesis He was theauthor of many international technical journals which could be foundat lsquohttpcherupyonseiackrrsquo
Optical Engineering December 2011Vol 50(12)127202-24

Jo et al Vision-based method for detecting driver drowsiness and distraction
Fig 2 Images obtained in various wavelengths using sunglasses(a) 700 nm (b) 750 nm (c) 850 nm and (d) 950 nm
addition the installation height of the proposed device is setto sim70 cm from the driverrsquos feet
A system that can operate in various vehicle environmentsshould satisfy the following three conditions
1 The system should work during both daytime andnighttime Because there is no sunlight at night weprovide additional NIR illumination to capture thedriverrsquos facial image Because visible lights can daz-zle drivers when driving NIR illuminators were usedto capture images We also adjusted the shutter speedof the camera automatically to prevent image satura-tion
2 The system should be operative for drivers who wearsunglasses We performed experiments to identify theproper wavelength of NIR illumination To observethe transmittance of various colors of sunglasses ac-cording to various wavelengths of NIR illuminatorswe conducted tests with black brown blue yellowand pink semitransparent sunglasses As an experi-ment we used an electronically tunable liquid-crystalfilter that has 10-nm bandwidth and a pass-band rangefrom 650 to 1100 nm to capture the images of userswearing sunglasses in the range of 700ndash950 nmFigure 2 depicts the captured face images of a userwearing black sunglasses at 700- 850- and 950-nmwavelengths From this it is evident that the blacksunglasses can be transmitted by the NIR illumina-tion which has a longer wavelength than 750 nmIn the experiments with various wavelengths wefound that the transmission increased from 700 tosim850 nm and then decreased after sim900 nm Wecan confirm in Fig 2 that the light in 700 nm isnot transmitted but that the light in 850 nm is welltransmitted into the sunglasses In Fig 2(d) we canconfirm that the brightness in 950 nm is decreasedbecause the sensor response of the camera is de-creased in accordance with the increase in wave-length Thus we selected 850 nm as the wavelength ofthe NIR illuminator considering the good transmis-sion camera-sensor response and lack of dazzlingeffect
3 The system should be operative when drivers weareyeglasses on which reflected sunlight is generatedThis problem is often encountered in a real automotiveenvironment as shown in Fig 3 A method was reportthat utilized a polarizing filter to remove the reflectedsunlight40 However because sunlight includes vari-ous directional lights it is unknown which direction ofthese lights caused the reflection Thus a polarizingfilter which eliminates the reflection by only pene-
Fig 3 Images of reflected sunlight on eyeglasses
trating specific directional light has limits In the ex-periment with a polarizing filter the reflection couldbe removed only when the directions of the polarizingfilter and the light causing the reflection matched Be-cause the directions of light that causes the reflectionscan be changed but the direction of the polarizingfilter cannot be changed in real time when drivingthe polarizing filter is unsuitable for vehicle appli-cation Moreover because only specific light passesthrough the polarizing filter the image brightness wasdecreased
To overcome these problems and remove the reflected sun-light we use a NIR illuminator and a narrow bandpass filterwhose pass band matches the illuminator First the narrowbandpass filter is installed in front of the camera and restrictsthe incoming wavelength of light to 850 nm with a centralwavelength tolerance of 2 nm37 In the various wavelengthsof sunlight only sunlight with a wavelength of 850 nm passesthrough the narrow bandpass filter and lights of most wave-lengths that caused the reflection are diminished Two high-power light-emitting diode (LED) illuminators34 cast a lightwith 850 nm on the driverrsquos face Because the driver sits in-side a car in which the amount of sunlight is not greater thanthat on the outside we can make the effect of the high-powerLED illuminators greater than the sunlight Consequentlythe reflections on glasses can be eliminated A configurationof our system is shown in Fig 4 and the experimental resultsfor removing reflected sunlight using a NIR illuminator anda narrow bandpass filter are shown in Fig 5
The VTI report32 for driver monitoring briefly mentionsthe use of NIR illuminators and a bandpass filter commercialproducts are used and details such as the wavelengths of NIRilluminators and the filter are not provided Although NIRilluminators and a bandpass filter have been used previouslyfor eye detection in our study we experimentally determinedthe optimal wavelengths of these components To the bestof our knowledge the details of the NIR illuminators andbandpass filter have been reported for the first time in ourstudy
Optical Engineering December 2011Vol 50(12)127202-5
Jo et al Vision-based method for detecting driver drowsiness and distraction
Fig 4 Developed driver-monitoring device (Ref 33)
23 Eye-Detection Method Considering DriverrsquosHead Pose
231 Determination of the range of eye detectionconsidering head pose
The face-detection and head-pose estimation process is per-formed before detecting the driverrsquos eyes33 Through the esti-mated head pose if it is determined that the driver is lookingahead the system detects the eyes to determine drowsinessOtherwise the system does not detect the eyes but does mon-itor the driverrsquos distraction level which is the percentage ofareas viewed other than the front for a certain time intervalThe reasons why the proposed system does not detect theeyes when the driver is not looking ahead are as followsFor driver monitoring the information regarding eye blink-ing is required to detect driver drowsiness However an earlysymptom of drowsy driving is that drivers begin to fall asleepwhen looking ahead but not to the side In light of this phe-nomenon the proposed system does not detect the eyes whenthe driver is not looking ahead This can also solve the prob-lem of high computational cost and low accuracy of driver-monitoring systems for detecting rotated eyes Moreover ifdrivers look at a nonfrontal area when driving this is as haz-
Fig 5 Experimental results for removing a reflected sunlightwithwithout NIR illuminators and a narrow bandpass filter (a) withouta filter and illuminators (b) with a filter and illuminators
ardous as drowsy driving Thus it should be detected by thedistraction-detection method and an alarm signal should beset off Therefore we propose a driver-monitoring systemthat detects the eyes only when the driver looks ahead andmonitors driver distraction when the driver does not lookahead
Before the system detects the eyes it is necessary to de-termine whether the driver is facing the front of the vehicleIn normal straight-road driving when drivers are paying at-tention to the road ahead their facial direction is withinapproximately plusmn15 deg from the straight normal From thisfact the range of facial directions spanning plusmn15 deg is desig-nated ldquofrontrdquo and facial directions greater than plusmn15 deg aredesignated ldquononfrontrdquo The validity of this figure has beenproven in our real-driving test and also in the experimentsconducted by Toyota41 In the experiments by Toyota theysuggested plusmn15 deg as the yaw-angle condition for the frontangle of a driver The same result is obtained in our real-driving experiments In order to measure the ground-truthdata for a head orientation we used an electromagnetic sen-sor called Patriot as shown in Fig 642 The experimentalresult is shown in Fig 7
From the above real-driving test we can confirm that theyaw angle of a driver facing the front of a vehicle is withinplusmn15 deg In the graph the angles are greater or less than thisyaw-angle range when the driver views the side mirror orside windows Except for these cases the head-pose rangeof driver is included in the above-mentioned range of frontviewing within plusmn15 deg
Fig 6 Patriot sensor attached behind the driverrsquos head (Ref 33)
Optical Engineering December 2011Vol 50(12)127202-6
Jo et al Vision-based method for detecting driver drowsiness and distraction
Fig 7 Facial yaw angle distribution in a real driving test (a) driver 1(b) driver 2 and (c) driver 3
The proposed system only detects eyes within this yawangle range If the estimated facial yaw angle is withinplusmn15 deg then the eye ROI is set by using the left and rightborder line centerline and statistical position of the eye inthe face The system then detects the eyes only in this re-
gion The proposed eye-detection algorithm is presented inSec 232
232 Eye-detection methodIn a previous study Scheirer et al43 proposed two dif-ferent approachesmdasha machine learning approach and acorrelation filter approachmdashfor eye detection under un-favorable acquisition circumstances such as low illumi-nation distance variation pose variation and blur Thiseye-detection method is inconvenient because visible lightis required at nighttime which distracts the driver or causespupil contraction In another study Whitelam et al44 an-alyzed eye detection across three different bands (iethe visible multispectral and short-wavendashinfrared (SWIR)bands) in order to illustrate the advantages and limitationsof multiband eye localization However they did not usea narrow bandpass filter for the NIR camera hence thecaptured eye image may contain a large amount of sunlightwhich can make it difficult to locate the eye region More-over eye validation is not conducted which may result infalse eye detection Our system adopts a narrow bandpassfilter and eye validation in order to improve eye-detectionperformance
Our eye-detection algorithm is developed by combin-ing eye adaboost45 adaptive template matching46 blobdetection47 and eye validation The adaboost method hasbeen widely adopted for detecting various facial compo-nents such as the face nose mouth and eyes where weakclassifiers are combined in a cascade this yields a strongerclassifier45 In our system we used the standard OpenCVHaar cascade to detect the face and eyes
The adaptive template-matching method is a digitalimage-processing technique for identifying the correspond-ing parts that match a template in an input image The tem-plate and eye candidate images are compared to determinewhether the two images have a matching region One methodfor template is given by
R(x y) =sum
xprime yprime [T (x prime yprime) minus I (x + x prime y + yprime)]2radicsumx primeyprime T (x prime yprime)2middotsumx primeyprime I (x + x prime y + yprime)2
(1)
where I denotes the input image T denotes the template andR(x y) denotes the matching result at position (x y) Theranges of xprime and yprime are [0 w ndash 1] and [0 h ndash 1] respectivelyw and h are the width and height of the template imagerespectively If the matching value R(x y) is small then itindicates higher similarity if it is large then it indicates lowersimilarity Among all the calculated R(x y) the position(x y) where R(x y) is minimized is selected as the finalmatching position The shape of the eye slightly changes inevery frame hence it is impossible to detect all possible eyeshapes with one fixed template Thus the template is updatedin every frame by the eye image that is successfully detectedin the previous frame
Blob detection is explained as follows From the origi-nal eye image a binary image is obtained on the basis of theadaptive threshold that is set with the mean value of the blockthen it is subjected to the morphology step In the morphol-ogy step there are two phases erosion and dilation48 Firstthe white pixels are expanded and the black pixels are dimin-
Optical Engineering December 2011Vol 50(12)127202-7
Jo et al Vision-based method for detecting driver drowsiness and distraction
Fig 8 Flowchart of proposed eye-detection algorithm
ished by an erosion operator Because the remaining blobs ofthe eyeglass frame may be wrongly detected as eyes the eye-glass frame should be removed by an erosion operator Nextthe black pixels of the eye region diminished by the erosionoperator are expanded by a dilation operator This processof sequentially erosion and dilation is defined as the openingprocess and it has the effect of noise elimination48 After theopening process is applied twice a large blob is generatedfor an eye and small blobs are generated for noise The label-ing process is performed with all the remaining blobs Thusthe remaining blobs are grouped with neighboring blobs andlabeled according to their connectivity48 Therefore all theblobs are represented as being isolated After that all thepixel ldquopositionsrdquo of each isolated blob can be obtained Ac-cordingly the ldquosizerdquo of the blob is calculated as the numberof the pixels of the blob In addition the width and heightof the outermost rectangular box including the blob can beobtained Then the ratio of the height to the width can becalculated as the ldquoshaperdquo of the blob The position size andshape are finally used to determine the location of the eyeOpen source is used for blob detection47
These methods are combined to detect the eyes quicklyand accurately If adaboost alone is used for eye detectionthen it has a great deal of computational cost and cannot de-tect closed eyes To resolve these problems in the first frameeye adaboost is used in the eye-detection step and after theeye verifier checks that the eyes are correctly detected thedetected eye image is saved as a template In the next framethe eyes are detected by adaptive template matching using thepreviously saved template and the template is then updatedby the newly detected eye image This is better than onlyusing eye adaboost in every frame in terms of computationalcost and performance of closed-eye detection However eyeshapes are changeable from an open shape to a closed shapeIf the shape of an opened eye is saved as the template and the
closed eye appears at the next frame then the eyes cannot bedetected by the adaptive template-matching method Thuswhen the adaptive template-matching method fails to detecteyes adaboost is used again to detect the eyes If adaboostalso fails to detect the eyes then the blob-detection method isapplied to do so When the eyes cannot be detected by thesethree eye detectors the previous position of the eye is keptFigure 8 depicts a flowchart of the eye-detection algorithm(a detailed explanation for eye detection will be provided)
The system attempts to realize eye detection using theadaboost eye detector45 The eye adaboost has good per-formance for detecting eyes when the driverrsquos head pose isfrontward However as shown in Fig 9 it has the disadvan-tage of missing eyes when the driverrsquos head pose is rotated orwhen the driverrsquos eyes are closed It also takes a long time todetect the eyes if the eye adaboost is applied in every frame
To resolve these problems with adaboost the adaptivetemplate-matching method was combined with adaboost Inthe first frame the system detects eyes by using adaboostand then saves the detected eye images to a template Inthe next frame adaptive template matching is applied tolocate the eyes As such even the rotated or closed eyesthat were not detected by adaboost can be detected Theadvantage of adaptive template matching is that it requiresless computational cost than adaboost The adaboost needs30 times more computational cost than the adaptive templatemethod As such the eye-detection method combined withadaboost and adaptive template matching is more efficientthan using adaboost alone This combination is robust tohead-pose variation and can detect a closed eye as shown inFig 10
However because the eye detector using these combina-tions may still fail to find eyes the blob-detection methodis additionally supplemented to the combination to improvethe performance of eye detection In particular blob detection
Optical Engineering December 2011Vol 50(12)127202-8
Jo et al Vision-based method for detecting driver drowsiness and distraction
Fig 9 Eye-detection results obtained using adaboost (a) Frontal face (success) (b) rotated face (fail) and (c) closed eye (fail)
improves the detection rate of closed eyes that are not de-tected by adaboost and template matching and saves process-ing time Figure 11 shows a flowchart of the blob-detectionmethod
From the original eye image a binary image is obtainedby the adaptive threshold that is set with the mean value of theblock and then passes through the morphology step In themorphology step there are two phases erosion and dilationFirst the white pixels are expanded and the black pixels arediminished by an erosion operator Because the remainingblobs of the eyeglass frame can be misrecognized as eyesthe eyeglass frame should be removed by an erosion operatorto prevent this from happening Next the diminished blackpixels of the eye region by the erosion operator are expandedby a dilation operator This process of sequentially passingthrough erosion and dilation is defined as the opening processand has an effect of noise elimination48 After the openingprocess is applied twice a large blob for an eye and smallblobs for noise are finally generated All remaining blobsare grouped with neighbor blobs into individual groups anda labeling process ensues To apply the labeling processwe used an open source of blob detection (this source codeis available in Ref 47) The location of the eye is finallydetermined by considering the size shape and position ofblobs
In the eye-detection step the eye-validation process playsan important role in checking whether the detected eyeregion actually contains eyes As shown in Fig 12 this isan eye-validation process that validates the eye detected byadaboost adaptive template matching and blob detectionIf a noneye region is falsely found by the eye detector andsaved in the template without any further validation pro-cess the region containing no eye will be continuously de-tected by the adaptive template matching in the next frameThus an eye-validation process is needed to prevent errorpropagation
In the eye-validation process we used two classicalfeature-extraction methods namely principal component(PC) analysis49ndash52 (PCA) and linear discriminant analysis(LDA)49ndash51 which were used in a different application in(Refs 51 and 53) In this paper we use the PCA + LDAmethods to extract features for eye validation
PCA is a well-known unsupervised algorithm for linearfeature extraction it is a linear mapping that uses the eigen-vectors with the largest eigenvalues In the PCA methodthe pixels of an eye image are ranked as a column vectorxi = (x1i x2i xni)T isin Rn and then by the l matrix X= x1 x2 xl denotes the training sample set that con-sists of l eye images After the mean vector of X is calculatedcentered data are obtained by subtracting the mean from allsamples The PCA can be used to find a linear transformationorthonormal matrix WPCA[m times n(m n)] mapping the orig-inal n-dimensional feature space into m-dimensional featuresubspaces The reduced feature vector yi is defined by
yi = W TPCAxi (i = 1 2 l) (2)
The columns of WPCA are the m eigenvectors associatedwith the m largest eigenvalues of the scatter matrix S whichis defined as
S =lsum
i=1
(xi minus μ)(xi minus μ)T (3)
where μ is the mean of all images in the training setLDA is a supervised learning method that utilizes the cat-
egory information associated with each sample The goal ofLDA is to maximize the between-class scatter while minimiz-ing the within-class scatter The within-class scatter matrixSW and between-class scatter matrix SB are defined as
SB =csum
j=1
(μ j minus μ)(μ j minus μ)T (4)
Fig 10 Eye-detection results obtained by combining with adaptive template matching and adaboost (a) Frontal face (success) (b) rotated face(success) and (c) closed eye (success)
Optical Engineering December 2011Vol 50(12)127202-9
Jo et al Vision-based method for detecting driver drowsiness and distraction
Fig 11 Flowchart of the blob-detection method (a) open eye and (b) closed eye
SW =csum
j=1
N jsumi=1
(x j
i minus μ j)(
x ji minus μ j
)T (5)
where x ji is the irsquoth sample of class j μj is the mean of class
j μ is the mean image of all classes Nj is the number ofsamples of class j and c is the number of classes
In order to guarantee that SW does not become singular werequire at least n + c samples In practice it is difficult to ob-tain so many samples when the dimension of feature n is veryhigh PCA + LDA is proposed to solve this problem51 52
Let the output of PCA be the input of LDA and finally thefeature vectors of eye images are given by
zi = W TLDAW T
PCAxi (i = 1 2 l) (6)
Now let us return to our eye-validation process Eye val-idation is composed of a training and testing process asshown in Fig 12 In the training step the eye-template im-age of 40times26 pixels in the training database is defined asthe column vector of 1040times1 pixels The column vector isthen reduced to an eigenvector with 13 dimensions by us-ing PCA which seeks a projection that best represents theoriginal data in a least-squares sense The eigenvector is re-duced to 11 dimensional spaces (features) by using LDAwhich seeks a projection that best separates the data in aleast-squares sense After the features that best separate eyeand noneye are normalized they are entered into a supportvector machine (SVM) and trained to classify eye and non-eye well An SVM is a classifier that finds the maximum
Fig 12 Eye-validation process
Optical Engineering December 2011Vol 50(12)127202-10
Jo et al Vision-based method for detecting driver drowsiness and distraction
margin hyperplane that optimally separates the data into twocategories for the given training set In general an SVM canbe represented by54
f (x) = sgn
(ksum
i=1
αi yi K (x xi ) + b
) (7)
where k is the number of data points and yi isin ndash1 1 isthe class label of training point xi The coefficients αi arefound by solving a quadratic programming problem with lin-ear constraints and b is a bias To obtain a good classificationperformance a SVM needs to choose a ldquogoodrdquo kernel func-tion K(x xi) In this paper we used a radial basis function(RBF) kernel as shown in Eq (8) because it generally hasfewer numerical difficulties55
KRBF(x x prime) = exp(minusγ ||x minus x prime||2) (8)
In the testing step after features are extracted from theeye image in the testing set by PCA + LDA in the same wayas the training step the extracted features are entered into theSVM to learn the classification of eye and noneye Figure 12depicts this eye-validation process for training and testingWhen the eye validation was added to the eye-detection al-gorithm the accuracy of eye detection was improved Thisresult will be shown in the Sec 3 experiment
24 Eye-State Detection (Determination of Openor Closed Eye)
Drivers that are sleepy exhibit several visual behaviors thatare easily observable from the changes in their facial fea-tures such as the eyes head and face There are many pa-rameters of drowsiness that reflect the vigilance level of adriver such as eye-closure duration (ECD) frequency of eyeclosure (FEC) average eye-closure speed (AECS) and per-centage of eye closure over time (PERCLOS)56 57 For all ofthem the determination of eye state open or closed eye isa necessary step In this section we introduce the novel fea-tures for eye-state analysis The performance of determiningeye status (opening and closing) is enhanced by combiningthe appearance features by PCA and LDA and the statisticalfeatures such as the sparseness and kurtosis of the histogramfrom the eye-edge image
241 Feature extractionPrincipal component and linear discriminant analyses Thefeatures used to determine open or closed eye are 12 dimen-sional features obtained by PCA + LDA This method isthe same as the eye-validation process explained in Fig 12PCA + LDA exhibits better performance than PCA alonewhen there are few samples in each class51
Sparseness and kurtosis Other features for determiningopen or closed eyes are the sparseness and kurtosis of thehistogram from the eye-edge image These features are ex-tracted to classify open and closed eyes by using horizontaledge image processing Here we briefly explain how thesefeatures are extracted The Sobel operator performs a 2-Dspatial gradient measurement on the detected eye imageTypically this is calculated by the absolute gradient mag-nitude at each point in an input gray-scale image The Sobeledge detector uses a pair of 3times3 convolution masks one es-timating the gradient in the horizontal direction (columns)and the other estimating the gradient in the vertical direction
(rows) A horizontal edge image is obtained using a horizon-tal Sobel convolution mask By applying a p-tile thresholdmethod to the horizontal edge image it is transformed intoa binary image58 From the training data we experimen-tally obtained 7 by the p-tile method The p-tile thresholdmethod uses the size and area of eye to obtain a binary im-age For example if eye occupy p of total area gray-valuehistogram of input image is divided by the percentage andthen a threshold is selected considering the p pixel for eyeThe binarized image is projected onto the horizontal axis(x-axis) and a vertical projection histogram is then acquiredas shown in Fig 13 The histogram of the open eye exhibitsa peak that is concentrated into vertical lines This peak iscaused by the brightness difference of the pupil specularreflection and iris In contrast the histogram of the closedeye exhibits a flat distribution on the x-axis Sparseness isa parameter that measures how much energy of a vector isconcentrated on a few components59 This implies that mostvalues are close to zero and that only a few take significantlynonzero values Kurtosis is a measure of whether the dataare peaked or flat relative to a normal distribution60 That isdata sets with high kurtosis tend to have a distinct peak nearthe mean decline rather rapidly and have heavy tails Datasets with low kurtosis tend to have a flat top near the meanrather than a sharp peak A uniform distribution would be anextreme case Therefore there is similarity between the twoparameters The equations of sparseness and kurtosis are asfollows
Sparseness(x) =radic
d minus (sum |x j |)radicsum |x j |2radic
d minus 1 (9)
where d represents the dimensionality of the vector x whosejrsquoth component is xj
Kurtosis = (1N )sumNminus1
n=0 (xn minus μ)4
σ 4 (10)
where μ is the mean of x and σ is the standard deviation ofx
Figure 13 shows that openclosed eye can be classified bythe sparseness and kurtosis of the histogram As shown inFig 13 it can easily be predicted that an open eye has largervalues of sparseness and kurtosis than a closed eye becausethe open eye has greater bulginess than a closed eye Wecan confirm that the distribution of the open-eye histogram isconcentrated in the center of the x-axis when the histogram ofthe closed eye exhibits a relatively flat distribution Thereforeopen and closed eyes are classified in terms of whether thesparseness and kurtosis of the projected histogram exceed acertain threshold value
242 Combination of featuresThe features that are used to classify open or closed eyeswere first extracted from the appearance features of 12dimensions by PCA + LDA and were then extracted fromthe statistical features of two dimensions by sparseness andkurtosis These extracted features were applied to the SVMclassifier We used a SVM with RBF kernels because theclassification ability of the SVM with radial basis functionkernels was superior to that of the SVM with polynomial andlinear kernels Figure 14 shows these processes that combinefeatures and classify open or closed eyes
Optical Engineering December 2011Vol 50(12)127202-11
Jo et al Vision-based method for detecting driver drowsiness and distraction
Fig 13 Horizontal edge-image process for classification of open and closed eye
25 Detection of Drowsiness and DistractionAfter classifying open or closed eyes and estimating the headpose of a driver the inattention of the driver is determinedby PECLOS which represents the drowsiness level andPERLOOK which represents the distraction level PERC-LOS is a parameter of drowsiness that is widely used tomonitor the drowsiness of a driver It is defined as the por-tion of time that the driverrsquos eyes are closed over a certainperiod57 61ndash63 This parameter can be obtained from
PERCLOS[k] =sumk
i=kminusn+1 Blink[i]
ntimes100 () (11)
where PERCLOS[k] means PERCLOS figure in the krsquothframe and n is a period measuring PERCLOS Blink[i] rep-resents that the eye is opened or closed in the irsquoth frame Ithas ldquo0rdquo if the eye is opened and ldquo1rdquo if the eye is closed Thehigher the PERCLOS is the higher the level of driver fatigueWhen PERCLOS exceeds the predetermined threshold the
proposed system generates a warning of inattention The pre-determined threshold was experimentally determined as 02by our experiments with training data
When a driver cannot look at the road ahead because thehead is rotated it causes the same accident hazard as whena driver cannot look ahead because their eyes are closed Assuch we propose a parameter PERLOOK which measuresthe driver-distraction level in the same way as PERCLOSPERLOOK is defined as the proportion of time that a driverrsquoshead is rotated and the driver does not look at the road aheadThis parameter can be obtained from
PERLOOK[k] =sumk
i=kminusn+1 Nonfront[i]
ntimes100 () (12)
where PERLOOK[k] indicates the PERLOOK figure in thekrsquoth frame and n is a period measuring PERLOOK Non-front[i] indicates that the driver is looking at the frontal ornonfrontal area in the irsquoth frame It is 1 if the driver is look-
Fig 14 Process of combining features and classifying open or closed eyes using an SVM
Optical Engineering December 2011Vol 50(12)127202-12
Jo et al Vision-based method for detecting driver drowsiness and distraction
Table 3 Specification of Database 1 for training
Daytime No subjects 12 persons (Male 9 Female 3 without glasses 2 with glasses 10)
No images 44197 images from 216 image sequences (12 personstimes18 gaze zones)
Nighttime No subjects 11 persons (Male 8 Female 3 without glasses 3 with glass 8)
No images 41155 images from 198 image sequences (11 personstimes18 gaze zones)
ing at the non-frontal area and 0 if the driver is looking atthe frontal area The higher the PERLOOK is the higherthe driver-distraction level is When PERLOOK is greaterthan a predetermined threshold the proposed system gener-ates a warning of inattention The predetermined thresholdwas experimentally determined as 035 by our experimentswith training data From Sec 231 if the yaw angle of adriver is greater than +15 deg or less than ndash15 deg (based onthe frontal direction) and if the corresponding accumulativetime is longer than 35 s during the unit interval of 10 s oursystem determines it as a ldquodistractionrdquo For example if theyaw angle and accumulative time when a driver looks at aGPS device or changes a CD is satisfied by this condition itis determined as a distraction
3 Experiments
31 DatabaseIn order to evaluate the proposed method we attached thedeveloped system in front of a dashboard as shown in Fig 4and we collected 162772 frames from 22 subjects Severalexperiments were carried out using images of subjects of bothsexes some of whom wore sunglasses and eyeglasses duringboth daytime and nighttime The databases were acquired ina car using an NIR camera with a resolution of 640 times 480pixels and a frame rate of 25 fps
In our databases there are two data sets for training andtesting 12 subjects were categorized into a training groupand the remaining 10 subjects were categorized into a test-ing group The images from the training group were storedin database 1 whereas those from the testing group wererecorded in database 2 Database 1 which is shown inTable 3 has also been used in a previous study33 It con-tains 85352 images (6700ndash7500 images per subject) 1090images from database 1 were used to train the eye validationprocess as shown in Fig 12 and Table 4 703 images wereused for the classification process for open and closed eyesas shown in Fig 14 and Table 5 The 85352 training imagesinclude numerous overlapped data which can cause overfit-ting of the classification hyperplane of the SVM In order tosolve this problem 1090 samples from 12 subjects were ran-domly selected and used in SVM training for eye validationThe training set for the SVM classifier in the eye-validationprocess contains 860 positive samples (eye images) and 230negative samples (noneye images) as shown in Figs 15(a)and 15(b) In addition 703 samples from 12 subjects wererandomly selected and used in SVM training for eye-statedetection The training set for the SVM classifier in the eye-statendashdetection process contains 530 positive samples (open-eye images) and 173 negative samples (closed-eye images)as shown in Figs 15(c) and 15(d)
The remaining images in database 1 were heuristicallyused for parameter optimization in eye detection (Sec 232)In conclusion the training data were only used for parameteroptimization and SVM training
Database 2 contains 77420 images (7500ndash8000 imagesper subject) from the testing group In database 2 longerimage sequences were captured for each subject in orderto test the proposed inattention-detection method The sub-jects were requested to look frontally for 5 s and to thendrive normally drowsily or distractedly for the remainingperiod Thus for each subject we obtained three types ofsequences a normal driving video a drowsy driving videoand a distracted driving video In addition the subjects whodid not wear glasses were asked to wear sunglasses in orderto capture a new sequence Similarly the subjects who woreglasses were asked to remove their glasses or wear sunglassesin order to capture a new sequence
As compared to the number of drowsy driving videos thenumber of distracted driving videos is relatively large Thereason is as follows A driver can gaze at the 12 differentpositions (1ndash5 8 11 14ndash18) described in Fig 16 hence weneed to test the performance of distraction detection for thevarious gaze directions Thus for each subject we obtainedmultiple distracted videos in which the subject gazed at the12 different positions
Table 4 Train database for eye validation
Number of eye images used
as training data in eye validation
Glass type Left eyes Right eyes
Eye(positivesamples)
Not wearingglasses
627 473
Eyeglasses 128 208
Sunglasses 105 189
Subtotal 860 870
Noneye(negativesamples)
Not wearingglasses
78 123
Eyeglasses 103 108
Sunglasses 49 79
Subtotal 230 310
Total 1090 1180
Optical Engineering December 2011Vol 50(12)127202-13
Jo et al Vision-based method for detecting driver drowsiness and distraction
Table 5 Train database for eye state detection
Number of eye images used as trainingdata for blink detection
Glass type Left eyes Right eyes
Open eye(positivesamples)
Not wearingglasses
420 440
Eyeglasses 50 70
Sunglasses 60 50
Subtotal 530 560
Closedeye(negativesamples)
Not wearingglasses
102 105
Eyeglasses 33 40
Sunglasses 38 40
Subtotal 173 185
Total 703 745
In the case of distraction a driver is not looking aheadThus the videos in which a driver gazed at 12 different posi-tions among the 18 positions shown in Fig 16 were used forthe performance evaluation of distraction detection Unlikedistraction detection only two states [ie drowsy and normal(awake)] can be considered in the case of drowsiness detec-tion Hence the number of drowsy videos obtained from each
Fig 16 Discrete gaze zones in a vehicle
subject is less than that of distracted videos The duration ofeach distracted video is sim1 min whereas that of each drowsyvideo is around 5ndash10 min Table 6 shows database 2 in detail
32 Experimental ResultsThe experimental phase consists of three parts First theeye-detection algorithm was tested using image sequencesof different people obtained in a vehicle under differenttimes and light conditions Then the algorithm for eye-state detection was tested The features used to classifyeye states were extracted from a long image sequence Fi-nally the algorithm measuring the inattention level of adriver was tested The inattention level is composed of thedrowsiness and distraction levels Drowsiness level was mea-sured by PERCLOS and distraction level was calculated byPERLOOK
321 Eye-detection resultsIn order to evaluate the performance of our eye-detectionalgorithm three experiments were carried out and comparedto each other The first was performed using only the eyeadaboost with our database 2 When it is applied to every
Fig 15 Positive and negative samples provided to the SVM classifier in the training phase (a) Eye images (b) noneye images (c) open-eyeimages and (d) closed-eye images
Optical Engineering December 2011Vol 50(12)127202-14
Jo et al Vision-based method for detecting driver drowsiness and distraction
Table 6 Specification of Database 2 for testing
No subjects 9 persons (Male 6 Female 3 without glasses 9 with glasses 4with sunglasses 5)
No images for eye detection and eye state detection 40256 images from 36 image sequences
No images used for eye detection evaluation 32365 images from 36 image sequences (7891 images wereexcluded because the subject was looking away from the roadahead)
Daytime No images used for eye state detection evaluation 30483 images from 36 image sequences (9773 images wereexcluded because the subject was looking away from the roadahead (7891) or because the eyes could not be classified as openor closed (eg narrow eyes) (1882)
No sequences used to measure inattention level 189 video sequences driving normally
36 video sequences driving drowsily
189 video sequences driving distractedly (Total number of imagesabout 239200 images from 414 image sequences)
No subjects 10 persons (Male 7 Female 3 without glasses 5 with glasses 5)
No images for eye detection and eye state detection 37164 images from 20 image sequences
No images used for eye detection evaluation 28608 images from 20 image sequences (8556 images wereexcluded because the subject was looking away from the roadahead)
Nighttime No images used for eye state detection evaluation 26672 images from 20 image sequences (10492 images wereexcluded because the subject was looking away from the roadahead (8556) and because the eyes could not be classified as beingopen or closed (eg narrow eyes) (1936))
No sequences used to measure inattention level 120 video sequences driving normally
20 video sequences driving drowsily
120 video sequences driving distractedly (Total number of imagesabout 105800 images from 260 image sequences)
sequence frame it requires a long processing time and failsto detect eyes when the head is rotated or the eyes are closedThus it resulted in unsatisfactory eye-detection performanceand a slow processing time as shown in Table 7 In the secondexperiment we combined eye-detecting methods includingadaboost adaptive template matching and blob detectionand this improved both the detection accuracy of the closed-eye and the computational performance The third experi-ment was performed by adding the eye validation to thoseused in the second experiment When the eye validation wasadded to the eye-detection algorithm the accuracy of eyedetection was improved Without any eye verifier to checkwhether the detected eye region truly contains an eye thefalsely detected noneye image may be stored in the template
and the falsely detected eye could be repeatedly detected bythe adaptive template matching from the next frame Con-sequently in the second experiment propagation error wasgenerated and the error rate was 756 in eye detectionHowever after applying the eye-validation process the errorrate was decreased from 756 to 104
The eye-detection rate is calculated as follows First im-ages looking at the frontal area are extracted from totalimages in database 2 (Table 6) and then manually dividedinto eye images [as in Fig 15(a)] and noneye images [as inFig 15(b)] Then the eye-detection rate is calculated by thenumber of images that successfully detect eyes over the totalnumber of images Table 7 presents the eye-detection rateresults and also shows that the eyes can be sim989 success-
Fig 17 Excluded narrow eye samples
Optical Engineering December 2011Vol 50(12)127202-15
Jo et al Vision-based method for detecting driver drowsiness and distraction
Table 7 Results obtained after eye detection algorithms on images in Database 2
Conditions Eye-detection rate
Time Glass type Sequences Frames Adaboost
Proposed method(without the eye
validation process)
Proposed method(with the eye
validation process)
Notwearingglasses
18 19994 7652 9254 9855
Day Eyeglasses 8 8012 6735 9235 9888
Sunglasses 10 4359 6353 9202 9891
Subtotal 36 32365 7250 9242 9868
Notwearingglasses
10 16860 7398 9258 9885
Night Eyeglasses 10 11748 7012 9205 9789
subtotal 20 28608 7239 9236 9846
Total 68 60973 7245 9239 9858
Processing time 231 ms 115 ms 145 ms
fully detected by the proposed eye-detection method regard-less of time gender and glass type Detection error is causedby misrecognition of eyeglass frames eyebrows and eyesthat are partially visible in Fig 15(b) as true eyes Howeverthis detection error is not continuous in the video sequencesbecause the eye template is reset by the eye-validation pro-cess in the next frame when the eye detector detected anoneye
322 Eye-statesndashdetection resultsIn order to evaluate the performance of determining eye sta-tus eye images from database 2 in Table 6 were manuallydivided into two classes open and closed eyes and they wereused as ground-truth data Two experiments were then per-formed The first experiment is designed to test the effectof PCA + LDA features compared to PCA features Thesecond experiment is designed to compare and analyze theclassification performance of multiple features combiningPCA + LDA sparseness and kurtosis
It is of note that narrow eyes such as those in Fig 17 wereexcluded from the performance measurement in the testingdata Because human eyes change smoothly from an open eyeto a narrow eye and then a closed eye it is difficult to classifycrisply whether a narrow eye is an open eye or a closed eye inthe middle of the change However although a narrow eye isjudged as either an open or a closed eye it does not affect thetotal performance of determining drowsy behavior becauseit is a temporary and transitional state between an open andclosed eye Therefore narrow eyes were excluded from thetesting data
The performance in eye-states detection is measured byconsidering two errors For convenience when an open eye isfalsely accepted as a closed eye we define it as a type I errorIn addition when a closed eye is falsely rejected as an openeye we define it as a type II error Thus the performance of
eye-states detection was measured by type I error and type IIerror
In the first experiment in order to detect eye states fea-tures are extracted by PCA or PCA + LDA and the featuresare then entered into SVM and finally classified into open andclosed eyes This process is the same as the eye-validationprocess explained in Fig 12 As shown in Table 8 530 framesof open eyes and 173 frames of closed eyes were used in thetraining and some of the eye images in database 2 were testedThen 12 dimensional features for the best performance wereselected The method using the PCA + LDA exhibits betterperformance in classifying eye states than the method usingonly PCA in our experiment In particular the PCA + LDAfeature is more effective than the PCA or LDA feature whenthere are fewer training samples in each class The combinedfeatures of PCA + LDA are less sensitive to different illu-minations whereas the PCA feature is sensitive to changingillumination51 53
Table 9 shows the eye-statesndashdetection results by PCA+ LDA for each dimension First in order to find the properfeature dimension yielding the best recognition rate whenfeatures were extracted solely by PCA we tested for eachdimension and obtained the 15 dimensions as the best number
Table 8 Training and testing data sets for eye states detection
Eye states included
Data set Open eye Closed eye
Train 530 173
Test 7250 800
Optical Engineering December 2011Vol 50(12)127202-16
Jo et al Vision-based method for detecting driver drowsiness and distraction
Table 9 Recognition error rates by eliminating the first one to six principal components
No eliminated principal components
1 (14 dim) 2 (13 dim) 3 (12 dim) 4 (11 dim) 5 (10 dim) 6 (9 dim)
Inputfeature
Type Ierror
Type IIerror
Type Ierror
Type IIerror
Type Ierror
Type IIerror
Type Ierror
Type IIerror
Type Ierror
Type IIerror
Type Ierror
Type IIerror
PCA +LDA
352 350 343 338 326 325 348 350 339 338 415 413
(2557250
) (28
800
) (249
7250
) (27800
) (236
7250
) (26
800
) (2527250
) (28
800
) (2467250
) (27800
) (301
7250
) (33
800
)
of feature dimensions The recognition rates of PCA featuresare 9612 and 9615 for open and closed states respectively
Previous works in face recognition50ndash52 reported that elim-inating the first one to three PCs improved performance Be-cause these PCs are sensitive to various illuminations theyshould be removed In this study we eliminate the first oneto six PCs to analyze the recognition effect for eye-statesdetection The experiment results are presented in Table 9
Table 9 demonstrates that eliminating the first one to threePCs will achieve the best performance rates in our data Thebest performances for the PCA + LDA feature 326 and325 were obtained by eliminating the first three PCsWhen removing more than four PCs the results grew worse
In the second experiment in order to evaluate the clas-sification performances of several features features areextracted by feature extraction methods their combined fea-tures are entered into an SVM and their classification perfor-mances are then measured There are two kinds of featuresused in the second experiment First appearance features areextracted by PCA + LDA and statistical features are alsoextracted by sparseness and kurtosis The classification per-formances resulted from combining these features are shownin Table 10 We can confirm that the performance was im-proved by combining the appearance features by PCA +
LDA and the statistical features such as the sparseness andkurtosis of the histogram from the eye-edge image
Table 11 shows the total performance of the proposedeye-statesndashdetection method with database 2 the total test-ing data As shown in Table 11 our proposed eye-statesndashdetection method works well in both daytime and nighttimeand also for drivers wearing eyeglasses or sunglasses Fi-nally we obtained results that are 145 and 291 for type Iand type II errors respectively
Some qualitative results of the proposed eye-detectionand eye-statesndashdetection method are shown in Figs 18 and19 The proposed method was robust to image variationscaused by sunlight eyeglasses sunglasses blinking mouthmovement and specular reflection on glasses Here the openeye was marked as a circle and the closed eye was marked asa rectangle The eye region is set in proportion to the detectedface region and the average size of the eye region is 40times26pixels
323 Results of measuring the inattention levelIn the driver-monitoring system it is very important to ensurethat a driver is paying adequate attention to the road ahead amust-see position when driving We can consider two situa-
Table 10 Accuracy of the eye states detection method when using each feature or combining multiple features
Input features
Type I error (Error rate forwhen an open eye is falselyaccepted as a closed eye)
Type II error (Error rate for when aclosed eye is falsely rejected as
an open eye)
Kurtosis 874 (6347250) 875 (70800)
Sparseness 786 (5707250) 788 (63800)
Sparsenesskurtosis
697 (5057250) 700 (56800)
PCA 393 (2857250) 400 (32800)
PCA + LDA 326 (2367250) 325 (26800)
PCA + LDAsparseness
280 (2037250) 275 (22800)
PCA + LDAkurtosis
297 (2157250) 300 (24800)
PCA + LDAsparsenesskurtosis
223 (1627250) 225 (18800)
Optical Engineering December 2011Vol 50(12)127202-17
Jo et al Vision-based method for detecting driver drowsiness and distraction
Table 11 Performance of our proposed method for eye states detection in Database 2
Time Glass type
Type I error (Error rate forwhen an open eye isfalsely accepted as a
closed eye)
Type II error (Error rate forwhen a closed eye is
falsely rejected as an openeye)
Not wearing glasses 120 (19816451) 354 (722032)
Eyeglasses 305 (2046699) 156 (161024)
Day Sunglasses 073 (283830) 112 (5447)
Subtotal 159 (43026980) 265 (933503)
Not wearing glasses 049 (6413185) 315 (621967)
Night Eyeglasses 230 (24110465) 332 (351055)
Subtotal 129 (30523650) 321 (973022)
Total 145 (73550630) 291 (1906525)
tions when a driver does not see the road ahead when drivingFirst it is a situation when the driver closes his or her eyesduring driving while drowsy The second situation is whenthe driverrsquos head is rotated when driving distractedly Bothof these situations are dangerous because the driver does notpay adequate attention to the road ahead In this paper weproposed a system to monitor these hazards simultaneouslyTwo measures PERCLOS and PERLOOK are used to detectthe drowsiness and distraction level respectively
Figure 20 shows the result of PERCLOS measurementfor drowsy sequences the state of a driver is alert for thefirst 100 s and during the remaining time the driver exhibitsdrowsy driving behavior In Fig 20 we were able to confirmthat the driver drowsiness was well detected by PERCLOSHowever if the driver exhibits distracted driving behaviorthe distracted behavior cannot be detected using the PERC-LOS measurement In Fig 21 the driver was requested to
Fig 18 Results of the proposed eye-detection and eye-statesndashdetection method on images captured during the daytime for a driverwho (a) did not wear any glasses and (b) wore sunglasses (Threevertical lines refer to the left right and center of the face)
drive normally for the first 160 s and then distractedly forthe remaining time Figure 21(a) shows the result of PER-CLOS measurement for distracted sequences In Figs 21(a)and 21(b) it is evident that distracted behaviors cannot bedetected using the PERCLOS measure alone Figure 21(a)measured by PERCLOS shows the false determination of adistracted behavior as a normal behavior Figure 21(b) mea-sured by PERLOOK shows that the driver distraction waswell detected at sim160 s
The experiments to measure the drowsiness and distrac-tion levels were executed on the image sequences in database2 For each of the subjects 36 drowsy video sequences and189 distracted video sequences were recorded during the day-time and 20 drowsy video sequences and 120 distracted videosequences were recorded during the nighttime For each ofthe drowsy video sequences about 5ndash10 min of observationwas recorded The subjects were requested to look frontally
Fig 19 Results of the proposed eye-detection and eye-statesndashdetection method on images captured during the nighttime for a driverwho (a) did not wear any glasses and (b) wore eyeglasses
Optical Engineering December 2011Vol 50(12)127202-18
Jo et al Vision-based method for detecting driver drowsiness and distraction
Fig 20 PERCLOS measurement for drowsy sequences
for 5 s and then drive normally or to drowsily drive for theremaining period For each of the distracted video sequencessim1 min of observation was recorded The subjects were re-quested to look frontally for 5 s and then drive normallyor to distractively drive for the remaining period Thus foreach subject we obtained three kinds of sequences normaldrowsy and distracted driving video sequences The experi-mental results using these video sequences are presented in
Table 13 In this experiment we achieved satisfying resultsAs shown in Table 13 the error rate of falsely recognizinga drowsy state or a distracted state as a normal state is 0while the error rate (false alarm) of falsely recognizing anormal state as a drowsy state or a distracted state is sim2That is there was no error in detecting drowsiness or dis-traction when the driver was actually drowsy or distractedOn the other hand six cases of a false alarm occurred in nor-
Fig 21 PERCLOS and PERLOOK measurements for a distracted video sequence (a) PERCLOS and (b) PERLOOK
Optical Engineering December 2011Vol 50(12)127202-19
Jo et al Vision-based method for detecting driver drowsiness and distraction
Fig 22 ROC curves for drowsiness and distraction detection accuracy (a) drowsiness detection and (b) distraction detection
mal driving videos of sim4 h which corresponds to 1ndash2 falsealarms per hour these can be regarded as small errors Failureanalysis revealed that a normal state was falsely recognizedas a drowsy state because the eyes were recognized as closedeyes when the driver laughed for a certain amount of timeErrors related to the driverrsquos habit of blinking hisher eyesoccur frequently Thus the measured PERCLOS was largerthan that for normal drivers Because a false alarm can annoythe driver we focused on the detection of dangerous inatten-tion By changing the decision threshold value the number
of false alarms can be reduced at the expense of increasingthe error of missing true detections
Also the false alarm can be reduced using the othermethods such as facial expression recognition user-specificdriver monitoring or driving behavior information such asmonitoring vehicle speed steering movement lane keepingacceleration braking and gear changing These works wouldbe considered in the future
Figure 22 shows the ROC curve for drowsiness and dis-traction detection accuracy by thresholds PERCLOS and
Optical Engineering December 2011Vol 50(12)127202-20
Jo et al Vision-based method for detecting driver drowsiness and distraction
Fig 23 One screen shot of actual drowsy video
PERLOOK ROC curve is a graphical plot of the sensitivityor true acceptance rate versus false acceptance rate for abinary classifier system because its discrimination thresholdis varied70 For convenience when the inattentive state isfalsely accepted as the normal state we define it as false-acceptance rate (FAR) in this paper In addition when thenormal state is falsely accepted as the inattentive state we de-fine it as false-rejection rate (FRR) When the FAR and FRRare equal the common value is referred to as the equal-errorrate The true-acceptance rate indicates a value subtractingFRR from 100
We describe a comparative experiment for measuringdrowsy parameters in each actual and virtual drowsinessvideo In our test the drowsy driverndashdetection performancewas measured using the virtual drowsiness video that wasobtained when 10 people simulated drowsy driving behaviorWe used a virtual drowsiness video because it is dangerousand difficult to obtain an actual drowsiness video moreoveran open database of actual drowsiness videos is not availableThus it was necessary to compare the values of PERCLOS inthe virtual drowsiness video with those in the actual drowsi-
Table 12 Testing data to detect the drowsiness and distraction of adriver in a vehicle
Time Driver state No test videos
Normal state 189
Day Drowsy state 36
Distracted state 189
Normal state 120
Night Drowsy state 20
Distracted state 120
Total 674
ness video The actual drowsiness video shown in Fig 23was obtained when a subject was actually drowsy at dawn (ataround 400 or 500 AM) Although this video was obtainedin the laboratory the acquisition environment (the positionsof a user and the proposed device the viewing angle of thecamera etc) was similar to that in a car Figure 24 showsgraphs for PERCLOS in the actual and virtual drowsinessvideos It is easy to identify that these features of PERC-LOS are similar In the actual drowsiness video the driverbegins to falls asleep after 300 frames and the average valueof PERCLOS is sim05254 In the virtual drowsiness videothe driver begins to falls asleep after 400 frames and theaverage value of PERCLOS is sim05024 Therefore we canpredict that the drowsy driverndashdetection performance in thevirtual drowsiness video will be similar to that in the actualdrowsiness video
Because it is difficult and dangerous to obtain drowsyor distracted videos in real conditions they were not ob-tained However the 189 videos [in (daytime) normal state ofTable 12] include five videos that were obtained when userswere actually driving on an expressway In the future webelieve that it would be possible to obtain a greater number
Fig 24 Comparison between the PERCLOS values in the actual and virtual drowsiness video (a) actual drowsiness and (b) virtual drowsiness
Optical Engineering December 2011Vol 50(12)127202-21
Jo et al Vision-based method for detecting driver drowsiness and distraction
Table 13 Drowsiness and distraction detection results measured from video sequences in a vehicle
Error rates ()
Misrecognizing adrowsy state asa normal state
Misrecognizing anormal state asa drowsy state
Misrecognizing adistracted state
as a normalstate
Misrecognizing anormal state as
a distractedstate
Misrecognizing adrowsy state as
a distractedstate
Misrecognizing adistracted state
as a drowsystate
0 (056) 162 (5309) 0 (0309) 064 (2309) 179 (156) 0 (0309)
of drowsy or distracted videos in real conditions with thesupport of car manufacturers
324 Processing timeThe proposed driver-monitoring system was efficient andworked in real time The software was implemented usingVisual C + + on an Intel Pentium M processor 160 GHz500 MB RAM Although not all the code optimizationswere completed the processing times are encouraging fora real-time implementation The total processing time was31 msframe and the processing times of each step are shownin Table 14
4 ConclusionIn this study we proposed a driver-monitoring system thatcan be used for warning against driver inattention includ-ing drowsiness and distraction We proposed an algorithmthat automatically localizes the eyes determines whetherthey are opened or closed and finally judges whether thedriver is driving drowsily or distractedly This constitutes anonintrusive approach to detecting driver inattention withoutannoyance or interference in both daytime and nighttime
The framework consists of three steps The first stepinvolves eye detection and tracking In driving sequenceimages adaboost adaptive template-matching and blob-detection methods are combined to detect the eyes automat-ically Eye detection is verified using an eye-validation tech-nique based on PCA + LDA and SVM The proposed eyedetector works well when the driver closes his or her eyes orwears eyeglasses and sunglasses High detection rates wereachieved in tests carried out on 12 people in the database
Table 14 Processing time of proposed driver monitoring system
Process Processing time (msframe)
Eye adaboost 231
Adaptive template matching 07
Blob detector 12
Eye validation by using SVM 22
Total eye detection 145
Eye states detection 24
Head pose estimationa 141
Total processing time 31
aReference 39
during both daytime and nighttime as well as when wearingsunglasses or eyeglasses
The second step is a process for classifying eyes as openedor closed For this purpose appearance-based features are ex-tracted from the detected eye image by PCA + LDA andedge-based features are obtained on the basis of sparsenessand kurtosis The detected eyes are then classified as openor closed by an SVM using the combined features We con-firmed that performance of the combined system is betterthan that of a single system Experimental results revealedthat the classification error rate in the databases was lt3during both daytime and nighttime as well as when wearingsunglasses or eyeglasses
The third step is a process for measuring the drowsinessand distraction levels of the driver In this process we pro-posed a method for checking these two conditions simultane-ously Two measures PERCLOS and PERLOOK are used tocalculate the drowsiness and distraction levels respectivelyand they yield satisfactory results
In the future we plan to conduct tests with a greater num-ber of users and over longer periods of time in order to obtainactual drowsy and distracted behaviors From the viewpointof gaze estimation we need to develop a precise gaze-estimation method using both head-pose and eye-movementinformation In the drowsy driverndashdetection method facialexpression recognition must be employed to distinguisheyes closed due to fatigue from those closed due to vigorouslaughter Moreover because eye size eye blinking frequencyand driving habits vary among drivers we need to developa driver-specific monitoring system using an online trainingmethod This system will exhibit better performance if it isintegrated with other sensors such as the accelerator steeringwheel and lane-position sensor Finally an integrated driv-ing safety system will be more effective when combined witha pedestrian-recognition system and a lane-keeping supportsystem
AcknowledgmentsThis work was supported in part by Mando Corporation LtdAnd in part by the National Research Foundation of Korea(NRF) grant funded by the Korea government (MEST) (GrantNo 2011-0015321)
References1 M R Rosekind E L Co K B Gregory and D L Miller ldquoCrew
factors in flight operations XIII a survey of fatigue factors incorporateexecutive aviation operationsrdquo NASA Ames Research Cen-ter NASATM-2000-209 610 (2000)
2 Awake Consortium (IST 2000-28062) ldquoSystem for effective assess-ment of driver vigilance and warning according to traffic risk estima-
Optical Engineering December 2011Vol 50(12)127202-22
Jo et al Vision-based method for detecting driver drowsiness and distraction
tion (AWAKE)rdquo September 2001ndash2004 lthttpwwwawake-euorggt(April 16 2011)
3 US Department of Transportation ldquo2007 FARSGES an-nual report (final ed)rdquo lthttpwwwnhtsadotgovportalsitenhtsamenuitem6a6eaf83cf719ad24ec86e10dba046a0gt (April 16 2011)
4 W Wierwille L Tijerina S Kiger T Rockwell E Lauber andA Bittne ldquoFinal report supplementmdashheavy vehicle driver workloadassessmentmdashtask 4 review of workload and related researchrdquo USDOTTech Rep No DOT HS 808 467(4) (1996)
5 H Saito T Ishiwaka M Sakata and S Okabayashi ldquoApplicationsof driverrsquos line of sight to automobilesmdashwhat can driverrsquos eye tellrdquo inProc of Vehicle Navigation and Information Systems Conf Yokohamapp 21ndash26 (1994)
6 H Ueno M Kaneda and M Tsukino ldquoDevelopment of drowsiness de-tection systemrdquo in Proc of Vehicle Navigation and Information SystemsConf Yokohama pp 15ndash20 (1994)
7 S Boverie J M Leqellec and A Hirl ldquoIntelligent systems for videomonitoring of vehicle cockpitrdquo in Proc of Int Congress and Exposi-tion ITS Advanced Controls and Vehicle Navigation Systems pp 1ndash5(1998)
8 M Kaneda H Ueno and M Tsukino ldquoDevelopment of a drowsinesswarning systemrdquo in Proc of 11th Int Conf on Enhanced Safety ofVehicle Munich (1994)
9 R Onken ldquoDaisy an adaptive knowledge-based driver monitoring andwarning systemrdquo in Proc of Vehicle Navigation and Information Sys-tems Conf Yokohama pp 3ndash10 (1994)
10 T Ishii M Hirose and H Iwata ldquoAutomatic recognition of driverrsquos fa-cial expression by image analysisrdquo Journal of the Society of AutomotiveEngineers of Japan Vol 41 pp 1398ndash1403 (1987)
11 K Yammamoto and S Higuchi ldquoDevelopment of a drowsiness warningsystemrdquo Journal of the Society of Automotive Engineers of JapanVol 46 pp 127ndash133 (1992)
12 D F Dinges M Mallis G Maislin and J W Powell ldquoEval-uation of techniques for ocular measurement as an index offatigue and the basis for alertness managementrdquo Departmentof Transportation Highway Safety Publication 808 762 April(1998)
13 R Grace V E Byrne D M Bierman and J M Legrand ldquoA drowsydriver detection system for heavy vehiclesrdquo in Proceedings of Digi-tal Avionics Systems Conference 17th DASC Vol 2 pp I361ndashI368(1998)
14 D Cleveland ldquoUnobtrusive eyelid closure and visual of regard mea-surement systemrdquo Conference on Ocular Measures of Driver alertnessApril (1999)
15 J Fukuda K Adachi M Nishida and E Akutsu ldquoDevelopment ofdriverrsquos drowsiness detection technologyrdquo Toyota Tech Rev 45 34ndash40(1995)
16 J H Richardson ldquoThe development of a driver alertness monitoringsystemrdquo in Fatigue and Driving Driver Impairment Driver Fatigueand Driver Simulation L Harrtley Ed Taylor amp Francis London(1995)
17 T DrsquoOrazio M Leo C Guaragnella and A Distante ldquoA visual ap-proach for driver inattention detectionrdquo Pattern Recogn 40 2341ndash2355(2007)
18 E Murphy-Chutorian and M M Trivedi ldquoHead pose estimation incomputer vision a surveyrdquo IEEE Trans Pattern Anal Mach Intell31(4) 607ndash626 (2009)
19 D W Hansen and Q Ji ldquoIn the eye of the beholder a survey of modelsfor eyes and gazerdquo IEEE Trans Pattern Anal Mach Intell 32 478ndash500(2010)
20 A Hattori S Tokoro M Miyashita I Tanakam K Ohue and SUozumi ldquoDevelopment of forward collision warning system using thedriver behavioral informationrdquo presented at 2006 SAE World CongressDetroit Michigan (2006)
21 E Murphy-Chutorian A Doshi and M M Trivedi ldquoHead pose estima-tion for driver assistance systems a robust algorithm and experimentalevaluationrdquo in Proc of 10th Int IEEE Conf Intelligent TransportationSystems pp 709ndash714 (2007)
22 P Smith M Shah and N da Vitoria Lobo ldquoDetermining driver vi-sual attention with one camerardquo IEEE Trans Intell Transp Syst 4(4)2058ndash2218 (2003)
23 J Y Kaminski D Knaan and A Shavit ldquoSingle image face orientationand gaze detectionrdquo Mach Vis Appl 21 85ndash98 (2009)
24 J C Stutts D W Reinfurt L Staplin and E A Rodgman ldquoThe roleof driver distraction in traffic crashesrdquo AAA Foundation for TrafficSafety Washington DC (2001)
25 K Torkkola N Massey and C Wood ldquoDriver inattention detectionthrough intelligent analysis of readily available sensorsrdquo in Proc ofIEEE Conf on Intelligent Transportation Systems Washington DCpp 326ndash331 (2004)
26 G Yang Y Lin and P Bhattacharya ldquoA driver fatigue recogni-tion model using fusion of multiple featuresrdquo in Proc of IEEE IntConf on Syst Man and Cybernetics Hawaii Vol 2 pp 1777ndash1784(2005)
27 S Park and M M Trivedi ldquoDriver activity analysis for in-telligent vehicles issues and development frameworkrdquo in Proc
of IEEE Intelligent Vehicles Symp Las Vegas pp 795ndash800(2005)
28 E Vural M Cetin A Ercil G Littlewort M S Bartlett and J RMovellan ldquoDrowsy driver detection though facial movement analysisrdquoIEEE Int Conf on Computer VisionndashHuman Computer Interaction pp6ndash18 (2007)
29 M Saradadevi and P Bajaj ldquoDriver fatigue detection using mouth andyawning analysisrdquo Int J Comput Sci Netw Security 8(6) 183ndash188(2008)
30 L M Beragasa J Nuevo M A Sotelo R Barea and E LopezldquoReal-time system for monitoring driver vigilancerdquo IEEE Trans IntellTransport Syst 7(1) 1524ndash1538 (2006)
31 R Senaratne D Hardy B Vanderaa and S Halgamuge ldquoDriver fatiguedetection by fusing multiple cuesrdquo Lect Notes Comput Sci 4492 801ndash809 (2007)
32 K Kircher A Kircher and F Claezon ldquoDistraction and drowsinessmdashafield studyrdquo Tech Rep VTI (The Swedish National Road and TransportResearch Institute) (2009)
33 S J Lee J Jo H G Jung K R Park and J Kim ldquoReal-time gaze es-timator based on driverrsquos head orientation for forward collision warningsystemrdquo IEEE Trans Intell Transp Syst 12(1) 254ndash267 (2011)
34 Specification of illuminator lthttproithner-lasercommultiled_multi_tohtmlge (July 25 2011)
35 Camera (EC650) lthttpwwwpyramidimagingcomspecsProsilica700009AA-EC65020User20Manualpdfgt (August 25 2011)
36 Camera lens (ML0614) lthttpwwwphoeniximagingcomml-0614htmge (July 25 2011)
37 Narrow bandpass interference filter (NT43-148) lthttpwwwedmundopticscomonlinecatalogdisplayproductcfmproductid=3198ampPageNum=5ampSort=displayOrderampOrder=ascproductsgt (July 252011)
38 SUV (GIA motors Sportage) lthttpwwwkiacomsportageexploregt (August 25 2011)
39 Sedan (Hyundai Motors Grandeur) lthttpgrandeurhyundaicomge(August 25 2011)
40 T Ito S Mita K Kozuka T Nakano and S Yamamoto ldquoDriver blinkmeasurement by the motion picture processing and its application todrowsiness detectionrdquo in Proc of Int Conf Intelligent TransportationSystems Singapore pp 168ndash173 (2002)
41 K Ohue Y Yamada S Uozumi S Tokoro A Hattori and T HayashildquoDevelopment of a new pre-crash safety systemrdquo SAE Tech PaperSeries Doc No 2006-01-1461 (2006)
42 Specification of motion tracking device called Patriot lthttpwwwpolhemuscompolhemus_editorassetsTech20compare20with20ResolutionvsRange20graphspdfgt (February 15 2011)
43 W J Scheirer A Rocha B Heflin and T E Boult ldquoDifficult detectiona comparison of two different approaches to eye detection for uncon-strained environmentsrdquo in Proc of IEEE 3rd Int Conf on BiometricsTheory Applications and Systems pp 1ndash8 (2009)
44 C Whitelam Z Jafri and T Bourlai ldquoMultispectral eye detection apreliminary studyrdquo in Proc of 2010 Int Conf on Pattern Recognitionpp 209ndash212 (2010)
45 P Viola and M Jones ldquoRapid object detection using a boosted cascadeof simple featuresrdquo in Proc of IEEE CVPR Vol 1 pp I-511ndashI-518(2001)
46 S D Wei and S H Lai ldquoFast template matching based on normalizedcross correlation with adaptive multilevel winner updaterdquo IEEE TransImage Process 17(11) 2227ndash2235 (2008)
47 Open source of blob detection lthttpopencvwillowgaragecomwikicvBlobsLibAlgorithmgt (July 30 2011)
48 R C Gonzalez and R E Woods Digital Image Processing 2nd edpp 523ndash532 Prentice-Hall Englewood Cliffs NJ (2002)
49 G Donato M S Bartlett J C Hager P Ekman and T J SejnowskildquoClassifying facial actionsrdquo IEEE Trans Pattern Anal Mach Intell21 974ndash989 (1999)
50 P N Bellhumeur J P Hespanha and D J Kriegman ldquoEigenfaces vsfisherfaces recognition using class specific linear projectionrdquo IEEETrans Pattern Anal Mach Intell 19 711ndash720 (1997)
51 A M Martinez and A C Kak ldquoPCA versus LDArdquo IEEE Trans PatternAnal Mach Intell 23 228ndash233 (2001)
52 M Turk and A Pentland ldquoEigenfaces for recognitionrdquo J CognitiveNeuro-sci 3 71ndash86 (1991)
53 H Deng L Jin L Zhen and J Huang ldquoA new facial expressionrecognition method nased on local gabor filter bank and PCA plusLDArdquo in Proc of Int Conf on Intelligent Computing August 23ndash26Hefei China pp 6ndash7 (2005)
54 V Vapnik ldquoSupport vector estimation of functionsrdquo in StatisticalLearning Theory pp 375ndash570 Wiley Hoboken NJ (1998)
55 C Hsu C Chang and C Lin ldquoA practical guide to supportvector classificationrdquo Tech Rep Department of Computer Sci-ence and Information Engineering National Taiwan UniversityTaipei lthttpwcsieorg˜cjlinpapersguideguidepdfgt (March 23(2011)
56 L Lang and H Qi ldquoThe study of driver fatigue monitor algorithmcombined PERCLOS and AECSrdquo in Proc of Int Conf on ComputSci and Software Eng pp 349ndash352 (2008)
Optical Engineering December 2011Vol 50(12)127202-23
Jo et al Vision-based method for detecting driver drowsiness and distraction
57 L Harley T Horberry N Mabbott and G Krueger ldquoReview of fa-tigue detection and prediction technologiesrdquo National Road TransportCommission (2000)
58 R Jain R Kasturi and B G Schunck Machine Vision pp 78ndash84McGraw-Hill New York (1995)
59 P O Hoyer ldquoNon-negative matrix factorization with sparseness con-straintsrdquo J Mach Learning Res 5 1457ndash1469 (2004)
60 A Hyvarinen and E Oja ldquoIndependent component analysisrdquo NeuralNetw 13(4ndash5) 411ndash430 (2000)
61 Q Ji and X Yang ldquoReal-time eye gaze and face pose tracking formonitoring driver vigilancerdquo Real-Time Imaging 8(5) 357ndash377 (2002)
62 D F Dinges M M Mallis G Maislin and J W Powell ldquoEvaluationof techniques for ocular measurement as an index of fatigue and thebasis for alertness managementrdquo US Department of TransportationNational Highway Traffic Safety Administration DOT HS 808 762(1998)
63 Smart Eye Pro lthttpwwwsmarteyesegt (25 July 2011)64 S Kawato and J Ohya ldquoReal-time detection of nodding and head-
shaking by directly detecting and tracking the between-eyesrdquo in Procof 4th Intrsquol IEEE Conf Automatic Face and Gesture Recognitionpp 40ndash45 (2000)
65 B Ma S Shan X Chen and W Gao ldquoHead yaw estimation fromasymmetry of facial appearancerdquo IEEE Trans Syst Man Cybern PartB 38(6) 1501ndash1512 (2008)
66 P Watta S Lakshmanan and Y Hou ldquoNonparametric approaches forestimating driver poserdquo IEEE Trans Vehicular Technol 56(4) 2028ndash2041 (2007)
67 J Wu and M M Trivedi ldquoA two-stage head pose estimation frameworkand evaluationrdquo Pattern Recogn 41 1138ndash1158 (2008)
68 E Murphy-Chutorian and M M Trivedi ldquoHyHOPE hybrid head ori-entation and position estimation for vision-based driver head trackingrdquoin Proc of IEEE Intell Vehicles Symp pp 512ndash517 (2008)
69 J P Batista ldquoA real-time driver visual attention monitoring systemrdquoLect Notes Comput Sci 3522 200ndash208 (2005)
70 N K Ratha and V Govindaraju Advances in Biometrics SensorsAlgorithms and System Springer New York (2008)
Jaeik Jo received the BS in electricaland electronic engineering in 2008 fromYonsei University Seoul Korea where he iscurrently working toward the MS-PhD jointdegree His current research interests in-clude driver monitoring systems 3-D face re-construction biometrics pattern recognitionand computer vision
Sung Joo Lee received the BS in electri-cal and electronic engineering and the MSin biometric engineering in 2004 and 2006respectively from Yonsei University SeoulKorea where he received the PhD in elec-trical and electronic engineering in 2011 In2011 he joined the Mobis Co Ltd wherehe is currently an assistant research engi-neer His current research interests includemoving object detection driver monitoringsystem biometrics pattern recognition and
computer vision
Ho Gi Jung received the BE ME and PhDin electronic engineering from Yonsei Univer-sity Seoul Korea in 1995 1997 and 2008respectively He was with MANDO Corpora-tion Global RampD HQ from 1997 to April2009 He developed environmental recog-nition systems for intelligent parking assistsystem collision warning and avoidance sys-tem and active pedestrian protection sys-tem From May 2009 to February 2011 hewas with Yonsei University as a full-time re-
searcher and research professor He researched computer visionapplications for intelligent surveillance systems and biometric sys-tems Since March 2011 he has been with Hanyang University asan assistant professor He is researching recognition systems for in-telligent vehicles His interests are recognition system for intelligentvehicle next generation vehicle computer vision applications andpattern recognition applications
Kang Ryoung Park received his BS and MSin electronic engineering from Yonsei Uni-versity Seoul Korea in 1994 and 1996 re-spectively He also received his PhD in com-puter vision from the Department of Electricaland Computer Engineering Yonsei Univer-sity in 2000 He was an assistant professorin the Division of Digital Media Technologyat Sangmyung University from March 2003to February 2008 He has been an assis-tant and associate professor in the Division
of Electronics and Electrical Engineering at Dongguk University sinceMarch 2008 He is also a research member of BERC His researchinterests include computer vision image processing and biometrics
Jaihie Kim received the BS in electronic en-gineering from Yonsei University Republic ofKorea in 1979 the PhD in electrical engi-neering from the Case Western Reserve Uni-versity USA in 1984 Since 1984 he hasbeen a professor in the School of Electri-cal and Electronic Engineering Yonsei Uni-versity Currently he is the Director of theBiometric Engineering Research Center inKorea the Chairman of the Korea Biomet-ric Association a member of the National
Academy of Engineering of Korea and in 2008 he was the Presi-dent of the IEEK (Institute of Electronics Engineers of Korea) andnow an Emeritus President of the IEEK His general research inter-ests are biometrics pattern recognition and computer vision Specif-ically some of his recent research topics include touchless finger-print recognition fake fingerprint detection fake face detection 2D-to-3D face conversion face age estimationsynthesis He was theauthor of many international technical journals which could be foundat lsquohttpcherupyonseiackrrsquo
Optical Engineering December 2011Vol 50(12)127202-24
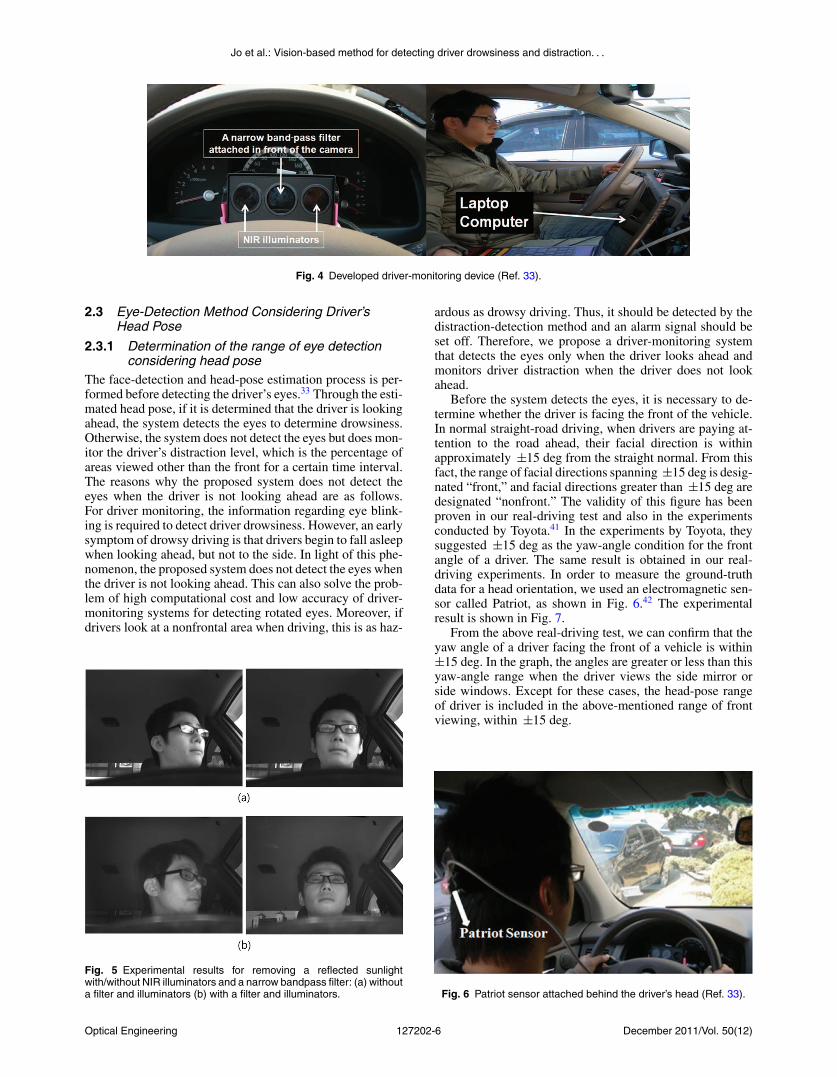
Jo et al Vision-based method for detecting driver drowsiness and distraction
Fig 11 Flowchart of the blob-detection method (a) open eye and (b) closed eye
SW =csum
j=1
N jsumi=1
(x j
i minus μ j)(
x ji minus μ j
)T (5)
where x ji is the irsquoth sample of class j μj is the mean of class
j μ is the mean image of all classes Nj is the number ofsamples of class j and c is the number of classes
In order to guarantee that SW does not become singular werequire at least n + c samples In practice it is difficult to ob-tain so many samples when the dimension of feature n is veryhigh PCA + LDA is proposed to solve this problem51 52
Let the output of PCA be the input of LDA and finally thefeature vectors of eye images are given by
zi = W TLDAW T
PCAxi (i = 1 2 l) (6)
Now let us return to our eye-validation process Eye val-idation is composed of a training and testing process asshown in Fig 12 In the training step the eye-template im-age of 40times26 pixels in the training database is defined asthe column vector of 1040times1 pixels The column vector isthen reduced to an eigenvector with 13 dimensions by us-ing PCA which seeks a projection that best represents theoriginal data in a least-squares sense The eigenvector is re-duced to 11 dimensional spaces (features) by using LDAwhich seeks a projection that best separates the data in aleast-squares sense After the features that best separate eyeand noneye are normalized they are entered into a supportvector machine (SVM) and trained to classify eye and non-eye well An SVM is a classifier that finds the maximum
Fig 12 Eye-validation process
Optical Engineering December 2011Vol 50(12)127202-10
Jo et al Vision-based method for detecting driver drowsiness and distraction
margin hyperplane that optimally separates the data into twocategories for the given training set In general an SVM canbe represented by54
f (x) = sgn
(ksum
i=1
αi yi K (x xi ) + b
) (7)
where k is the number of data points and yi isin ndash1 1 isthe class label of training point xi The coefficients αi arefound by solving a quadratic programming problem with lin-ear constraints and b is a bias To obtain a good classificationperformance a SVM needs to choose a ldquogoodrdquo kernel func-tion K(x xi) In this paper we used a radial basis function(RBF) kernel as shown in Eq (8) because it generally hasfewer numerical difficulties55
KRBF(x x prime) = exp(minusγ ||x minus x prime||2) (8)
In the testing step after features are extracted from theeye image in the testing set by PCA + LDA in the same wayas the training step the extracted features are entered into theSVM to learn the classification of eye and noneye Figure 12depicts this eye-validation process for training and testingWhen the eye validation was added to the eye-detection al-gorithm the accuracy of eye detection was improved Thisresult will be shown in the Sec 3 experiment
24 Eye-State Detection (Determination of Openor Closed Eye)
Drivers that are sleepy exhibit several visual behaviors thatare easily observable from the changes in their facial fea-tures such as the eyes head and face There are many pa-rameters of drowsiness that reflect the vigilance level of adriver such as eye-closure duration (ECD) frequency of eyeclosure (FEC) average eye-closure speed (AECS) and per-centage of eye closure over time (PERCLOS)56 57 For all ofthem the determination of eye state open or closed eye isa necessary step In this section we introduce the novel fea-tures for eye-state analysis The performance of determiningeye status (opening and closing) is enhanced by combiningthe appearance features by PCA and LDA and the statisticalfeatures such as the sparseness and kurtosis of the histogramfrom the eye-edge image
241 Feature extractionPrincipal component and linear discriminant analyses Thefeatures used to determine open or closed eye are 12 dimen-sional features obtained by PCA + LDA This method isthe same as the eye-validation process explained in Fig 12PCA + LDA exhibits better performance than PCA alonewhen there are few samples in each class51
Sparseness and kurtosis Other features for determiningopen or closed eyes are the sparseness and kurtosis of thehistogram from the eye-edge image These features are ex-tracted to classify open and closed eyes by using horizontaledge image processing Here we briefly explain how thesefeatures are extracted The Sobel operator performs a 2-Dspatial gradient measurement on the detected eye imageTypically this is calculated by the absolute gradient mag-nitude at each point in an input gray-scale image The Sobeledge detector uses a pair of 3times3 convolution masks one es-timating the gradient in the horizontal direction (columns)and the other estimating the gradient in the vertical direction
(rows) A horizontal edge image is obtained using a horizon-tal Sobel convolution mask By applying a p-tile thresholdmethod to the horizontal edge image it is transformed intoa binary image58 From the training data we experimen-tally obtained 7 by the p-tile method The p-tile thresholdmethod uses the size and area of eye to obtain a binary im-age For example if eye occupy p of total area gray-valuehistogram of input image is divided by the percentage andthen a threshold is selected considering the p pixel for eyeThe binarized image is projected onto the horizontal axis(x-axis) and a vertical projection histogram is then acquiredas shown in Fig 13 The histogram of the open eye exhibitsa peak that is concentrated into vertical lines This peak iscaused by the brightness difference of the pupil specularreflection and iris In contrast the histogram of the closedeye exhibits a flat distribution on the x-axis Sparseness isa parameter that measures how much energy of a vector isconcentrated on a few components59 This implies that mostvalues are close to zero and that only a few take significantlynonzero values Kurtosis is a measure of whether the dataare peaked or flat relative to a normal distribution60 That isdata sets with high kurtosis tend to have a distinct peak nearthe mean decline rather rapidly and have heavy tails Datasets with low kurtosis tend to have a flat top near the meanrather than a sharp peak A uniform distribution would be anextreme case Therefore there is similarity between the twoparameters The equations of sparseness and kurtosis are asfollows
Sparseness(x) =radic
d minus (sum |x j |)radicsum |x j |2radic
d minus 1 (9)
where d represents the dimensionality of the vector x whosejrsquoth component is xj
Kurtosis = (1N )sumNminus1
n=0 (xn minus μ)4
σ 4 (10)
where μ is the mean of x and σ is the standard deviation ofx
Figure 13 shows that openclosed eye can be classified bythe sparseness and kurtosis of the histogram As shown inFig 13 it can easily be predicted that an open eye has largervalues of sparseness and kurtosis than a closed eye becausethe open eye has greater bulginess than a closed eye Wecan confirm that the distribution of the open-eye histogram isconcentrated in the center of the x-axis when the histogram ofthe closed eye exhibits a relatively flat distribution Thereforeopen and closed eyes are classified in terms of whether thesparseness and kurtosis of the projected histogram exceed acertain threshold value
242 Combination of featuresThe features that are used to classify open or closed eyeswere first extracted from the appearance features of 12dimensions by PCA + LDA and were then extracted fromthe statistical features of two dimensions by sparseness andkurtosis These extracted features were applied to the SVMclassifier We used a SVM with RBF kernels because theclassification ability of the SVM with radial basis functionkernels was superior to that of the SVM with polynomial andlinear kernels Figure 14 shows these processes that combinefeatures and classify open or closed eyes
Optical Engineering December 2011Vol 50(12)127202-11
Jo et al Vision-based method for detecting driver drowsiness and distraction
Fig 13 Horizontal edge-image process for classification of open and closed eye
25 Detection of Drowsiness and DistractionAfter classifying open or closed eyes and estimating the headpose of a driver the inattention of the driver is determinedby PECLOS which represents the drowsiness level andPERLOOK which represents the distraction level PERC-LOS is a parameter of drowsiness that is widely used tomonitor the drowsiness of a driver It is defined as the por-tion of time that the driverrsquos eyes are closed over a certainperiod57 61ndash63 This parameter can be obtained from
PERCLOS[k] =sumk
i=kminusn+1 Blink[i]
ntimes100 () (11)
where PERCLOS[k] means PERCLOS figure in the krsquothframe and n is a period measuring PERCLOS Blink[i] rep-resents that the eye is opened or closed in the irsquoth frame Ithas ldquo0rdquo if the eye is opened and ldquo1rdquo if the eye is closed Thehigher the PERCLOS is the higher the level of driver fatigueWhen PERCLOS exceeds the predetermined threshold the
proposed system generates a warning of inattention The pre-determined threshold was experimentally determined as 02by our experiments with training data
When a driver cannot look at the road ahead because thehead is rotated it causes the same accident hazard as whena driver cannot look ahead because their eyes are closed Assuch we propose a parameter PERLOOK which measuresthe driver-distraction level in the same way as PERCLOSPERLOOK is defined as the proportion of time that a driverrsquoshead is rotated and the driver does not look at the road aheadThis parameter can be obtained from
PERLOOK[k] =sumk
i=kminusn+1 Nonfront[i]
ntimes100 () (12)
where PERLOOK[k] indicates the PERLOOK figure in thekrsquoth frame and n is a period measuring PERLOOK Non-front[i] indicates that the driver is looking at the frontal ornonfrontal area in the irsquoth frame It is 1 if the driver is look-
Fig 14 Process of combining features and classifying open or closed eyes using an SVM
Optical Engineering December 2011Vol 50(12)127202-12
Jo et al Vision-based method for detecting driver drowsiness and distraction
Table 3 Specification of Database 1 for training
Daytime No subjects 12 persons (Male 9 Female 3 without glasses 2 with glasses 10)
No images 44197 images from 216 image sequences (12 personstimes18 gaze zones)
Nighttime No subjects 11 persons (Male 8 Female 3 without glasses 3 with glass 8)
No images 41155 images from 198 image sequences (11 personstimes18 gaze zones)
ing at the non-frontal area and 0 if the driver is looking atthe frontal area The higher the PERLOOK is the higherthe driver-distraction level is When PERLOOK is greaterthan a predetermined threshold the proposed system gener-ates a warning of inattention The predetermined thresholdwas experimentally determined as 035 by our experimentswith training data From Sec 231 if the yaw angle of adriver is greater than +15 deg or less than ndash15 deg (based onthe frontal direction) and if the corresponding accumulativetime is longer than 35 s during the unit interval of 10 s oursystem determines it as a ldquodistractionrdquo For example if theyaw angle and accumulative time when a driver looks at aGPS device or changes a CD is satisfied by this condition itis determined as a distraction
3 Experiments
31 DatabaseIn order to evaluate the proposed method we attached thedeveloped system in front of a dashboard as shown in Fig 4and we collected 162772 frames from 22 subjects Severalexperiments were carried out using images of subjects of bothsexes some of whom wore sunglasses and eyeglasses duringboth daytime and nighttime The databases were acquired ina car using an NIR camera with a resolution of 640 times 480pixels and a frame rate of 25 fps
In our databases there are two data sets for training andtesting 12 subjects were categorized into a training groupand the remaining 10 subjects were categorized into a test-ing group The images from the training group were storedin database 1 whereas those from the testing group wererecorded in database 2 Database 1 which is shown inTable 3 has also been used in a previous study33 It con-tains 85352 images (6700ndash7500 images per subject) 1090images from database 1 were used to train the eye validationprocess as shown in Fig 12 and Table 4 703 images wereused for the classification process for open and closed eyesas shown in Fig 14 and Table 5 The 85352 training imagesinclude numerous overlapped data which can cause overfit-ting of the classification hyperplane of the SVM In order tosolve this problem 1090 samples from 12 subjects were ran-domly selected and used in SVM training for eye validationThe training set for the SVM classifier in the eye-validationprocess contains 860 positive samples (eye images) and 230negative samples (noneye images) as shown in Figs 15(a)and 15(b) In addition 703 samples from 12 subjects wererandomly selected and used in SVM training for eye-statedetection The training set for the SVM classifier in the eye-statendashdetection process contains 530 positive samples (open-eye images) and 173 negative samples (closed-eye images)as shown in Figs 15(c) and 15(d)
The remaining images in database 1 were heuristicallyused for parameter optimization in eye detection (Sec 232)In conclusion the training data were only used for parameteroptimization and SVM training
Database 2 contains 77420 images (7500ndash8000 imagesper subject) from the testing group In database 2 longerimage sequences were captured for each subject in orderto test the proposed inattention-detection method The sub-jects were requested to look frontally for 5 s and to thendrive normally drowsily or distractedly for the remainingperiod Thus for each subject we obtained three types ofsequences a normal driving video a drowsy driving videoand a distracted driving video In addition the subjects whodid not wear glasses were asked to wear sunglasses in orderto capture a new sequence Similarly the subjects who woreglasses were asked to remove their glasses or wear sunglassesin order to capture a new sequence
As compared to the number of drowsy driving videos thenumber of distracted driving videos is relatively large Thereason is as follows A driver can gaze at the 12 differentpositions (1ndash5 8 11 14ndash18) described in Fig 16 hence weneed to test the performance of distraction detection for thevarious gaze directions Thus for each subject we obtainedmultiple distracted videos in which the subject gazed at the12 different positions
Table 4 Train database for eye validation
Number of eye images used
as training data in eye validation
Glass type Left eyes Right eyes
Eye(positivesamples)
Not wearingglasses
627 473
Eyeglasses 128 208
Sunglasses 105 189
Subtotal 860 870
Noneye(negativesamples)
Not wearingglasses
78 123
Eyeglasses 103 108
Sunglasses 49 79
Subtotal 230 310
Total 1090 1180
Optical Engineering December 2011Vol 50(12)127202-13
Jo et al Vision-based method for detecting driver drowsiness and distraction
Table 5 Train database for eye state detection
Number of eye images used as trainingdata for blink detection
Glass type Left eyes Right eyes
Open eye(positivesamples)
Not wearingglasses
420 440
Eyeglasses 50 70
Sunglasses 60 50
Subtotal 530 560
Closedeye(negativesamples)
Not wearingglasses
102 105
Eyeglasses 33 40
Sunglasses 38 40
Subtotal 173 185
Total 703 745
In the case of distraction a driver is not looking aheadThus the videos in which a driver gazed at 12 different posi-tions among the 18 positions shown in Fig 16 were used forthe performance evaluation of distraction detection Unlikedistraction detection only two states [ie drowsy and normal(awake)] can be considered in the case of drowsiness detec-tion Hence the number of drowsy videos obtained from each
Fig 16 Discrete gaze zones in a vehicle
subject is less than that of distracted videos The duration ofeach distracted video is sim1 min whereas that of each drowsyvideo is around 5ndash10 min Table 6 shows database 2 in detail
32 Experimental ResultsThe experimental phase consists of three parts First theeye-detection algorithm was tested using image sequencesof different people obtained in a vehicle under differenttimes and light conditions Then the algorithm for eye-state detection was tested The features used to classifyeye states were extracted from a long image sequence Fi-nally the algorithm measuring the inattention level of adriver was tested The inattention level is composed of thedrowsiness and distraction levels Drowsiness level was mea-sured by PERCLOS and distraction level was calculated byPERLOOK
321 Eye-detection resultsIn order to evaluate the performance of our eye-detectionalgorithm three experiments were carried out and comparedto each other The first was performed using only the eyeadaboost with our database 2 When it is applied to every
Fig 15 Positive and negative samples provided to the SVM classifier in the training phase (a) Eye images (b) noneye images (c) open-eyeimages and (d) closed-eye images
Optical Engineering December 2011Vol 50(12)127202-14
Jo et al Vision-based method for detecting driver drowsiness and distraction
Table 6 Specification of Database 2 for testing
No subjects 9 persons (Male 6 Female 3 without glasses 9 with glasses 4with sunglasses 5)
No images for eye detection and eye state detection 40256 images from 36 image sequences
No images used for eye detection evaluation 32365 images from 36 image sequences (7891 images wereexcluded because the subject was looking away from the roadahead)
Daytime No images used for eye state detection evaluation 30483 images from 36 image sequences (9773 images wereexcluded because the subject was looking away from the roadahead (7891) or because the eyes could not be classified as openor closed (eg narrow eyes) (1882)
No sequences used to measure inattention level 189 video sequences driving normally
36 video sequences driving drowsily
189 video sequences driving distractedly (Total number of imagesabout 239200 images from 414 image sequences)
No subjects 10 persons (Male 7 Female 3 without glasses 5 with glasses 5)
No images for eye detection and eye state detection 37164 images from 20 image sequences
No images used for eye detection evaluation 28608 images from 20 image sequences (8556 images wereexcluded because the subject was looking away from the roadahead)
Nighttime No images used for eye state detection evaluation 26672 images from 20 image sequences (10492 images wereexcluded because the subject was looking away from the roadahead (8556) and because the eyes could not be classified as beingopen or closed (eg narrow eyes) (1936))
No sequences used to measure inattention level 120 video sequences driving normally
20 video sequences driving drowsily
120 video sequences driving distractedly (Total number of imagesabout 105800 images from 260 image sequences)
sequence frame it requires a long processing time and failsto detect eyes when the head is rotated or the eyes are closedThus it resulted in unsatisfactory eye-detection performanceand a slow processing time as shown in Table 7 In the secondexperiment we combined eye-detecting methods includingadaboost adaptive template matching and blob detectionand this improved both the detection accuracy of the closed-eye and the computational performance The third experi-ment was performed by adding the eye validation to thoseused in the second experiment When the eye validation wasadded to the eye-detection algorithm the accuracy of eyedetection was improved Without any eye verifier to checkwhether the detected eye region truly contains an eye thefalsely detected noneye image may be stored in the template
and the falsely detected eye could be repeatedly detected bythe adaptive template matching from the next frame Con-sequently in the second experiment propagation error wasgenerated and the error rate was 756 in eye detectionHowever after applying the eye-validation process the errorrate was decreased from 756 to 104
The eye-detection rate is calculated as follows First im-ages looking at the frontal area are extracted from totalimages in database 2 (Table 6) and then manually dividedinto eye images [as in Fig 15(a)] and noneye images [as inFig 15(b)] Then the eye-detection rate is calculated by thenumber of images that successfully detect eyes over the totalnumber of images Table 7 presents the eye-detection rateresults and also shows that the eyes can be sim989 success-
Fig 17 Excluded narrow eye samples
Optical Engineering December 2011Vol 50(12)127202-15
Jo et al Vision-based method for detecting driver drowsiness and distraction
Table 7 Results obtained after eye detection algorithms on images in Database 2
Conditions Eye-detection rate
Time Glass type Sequences Frames Adaboost
Proposed method(without the eye
validation process)
Proposed method(with the eye
validation process)
Notwearingglasses
18 19994 7652 9254 9855
Day Eyeglasses 8 8012 6735 9235 9888
Sunglasses 10 4359 6353 9202 9891
Subtotal 36 32365 7250 9242 9868
Notwearingglasses
10 16860 7398 9258 9885
Night Eyeglasses 10 11748 7012 9205 9789
subtotal 20 28608 7239 9236 9846
Total 68 60973 7245 9239 9858
Processing time 231 ms 115 ms 145 ms
fully detected by the proposed eye-detection method regard-less of time gender and glass type Detection error is causedby misrecognition of eyeglass frames eyebrows and eyesthat are partially visible in Fig 15(b) as true eyes Howeverthis detection error is not continuous in the video sequencesbecause the eye template is reset by the eye-validation pro-cess in the next frame when the eye detector detected anoneye
322 Eye-statesndashdetection resultsIn order to evaluate the performance of determining eye sta-tus eye images from database 2 in Table 6 were manuallydivided into two classes open and closed eyes and they wereused as ground-truth data Two experiments were then per-formed The first experiment is designed to test the effectof PCA + LDA features compared to PCA features Thesecond experiment is designed to compare and analyze theclassification performance of multiple features combiningPCA + LDA sparseness and kurtosis
It is of note that narrow eyes such as those in Fig 17 wereexcluded from the performance measurement in the testingdata Because human eyes change smoothly from an open eyeto a narrow eye and then a closed eye it is difficult to classifycrisply whether a narrow eye is an open eye or a closed eye inthe middle of the change However although a narrow eye isjudged as either an open or a closed eye it does not affect thetotal performance of determining drowsy behavior becauseit is a temporary and transitional state between an open andclosed eye Therefore narrow eyes were excluded from thetesting data
The performance in eye-states detection is measured byconsidering two errors For convenience when an open eye isfalsely accepted as a closed eye we define it as a type I errorIn addition when a closed eye is falsely rejected as an openeye we define it as a type II error Thus the performance of
eye-states detection was measured by type I error and type IIerror
In the first experiment in order to detect eye states fea-tures are extracted by PCA or PCA + LDA and the featuresare then entered into SVM and finally classified into open andclosed eyes This process is the same as the eye-validationprocess explained in Fig 12 As shown in Table 8 530 framesof open eyes and 173 frames of closed eyes were used in thetraining and some of the eye images in database 2 were testedThen 12 dimensional features for the best performance wereselected The method using the PCA + LDA exhibits betterperformance in classifying eye states than the method usingonly PCA in our experiment In particular the PCA + LDAfeature is more effective than the PCA or LDA feature whenthere are fewer training samples in each class The combinedfeatures of PCA + LDA are less sensitive to different illu-minations whereas the PCA feature is sensitive to changingillumination51 53
Table 9 shows the eye-statesndashdetection results by PCA+ LDA for each dimension First in order to find the properfeature dimension yielding the best recognition rate whenfeatures were extracted solely by PCA we tested for eachdimension and obtained the 15 dimensions as the best number
Table 8 Training and testing data sets for eye states detection
Eye states included
Data set Open eye Closed eye
Train 530 173
Test 7250 800
Optical Engineering December 2011Vol 50(12)127202-16
Jo et al Vision-based method for detecting driver drowsiness and distraction
Table 9 Recognition error rates by eliminating the first one to six principal components
No eliminated principal components
1 (14 dim) 2 (13 dim) 3 (12 dim) 4 (11 dim) 5 (10 dim) 6 (9 dim)
Inputfeature
Type Ierror
Type IIerror
Type Ierror
Type IIerror
Type Ierror
Type IIerror
Type Ierror
Type IIerror
Type Ierror
Type IIerror
Type Ierror
Type IIerror
PCA +LDA
352 350 343 338 326 325 348 350 339 338 415 413
(2557250
) (28
800
) (249
7250
) (27800
) (236
7250
) (26
800
) (2527250
) (28
800
) (2467250
) (27800
) (301
7250
) (33
800
)
of feature dimensions The recognition rates of PCA featuresare 9612 and 9615 for open and closed states respectively
Previous works in face recognition50ndash52 reported that elim-inating the first one to three PCs improved performance Be-cause these PCs are sensitive to various illuminations theyshould be removed In this study we eliminate the first oneto six PCs to analyze the recognition effect for eye-statesdetection The experiment results are presented in Table 9
Table 9 demonstrates that eliminating the first one to threePCs will achieve the best performance rates in our data Thebest performances for the PCA + LDA feature 326 and325 were obtained by eliminating the first three PCsWhen removing more than four PCs the results grew worse
In the second experiment in order to evaluate the clas-sification performances of several features features areextracted by feature extraction methods their combined fea-tures are entered into an SVM and their classification perfor-mances are then measured There are two kinds of featuresused in the second experiment First appearance features areextracted by PCA + LDA and statistical features are alsoextracted by sparseness and kurtosis The classification per-formances resulted from combining these features are shownin Table 10 We can confirm that the performance was im-proved by combining the appearance features by PCA +
LDA and the statistical features such as the sparseness andkurtosis of the histogram from the eye-edge image
Table 11 shows the total performance of the proposedeye-statesndashdetection method with database 2 the total test-ing data As shown in Table 11 our proposed eye-statesndashdetection method works well in both daytime and nighttimeand also for drivers wearing eyeglasses or sunglasses Fi-nally we obtained results that are 145 and 291 for type Iand type II errors respectively
Some qualitative results of the proposed eye-detectionand eye-statesndashdetection method are shown in Figs 18 and19 The proposed method was robust to image variationscaused by sunlight eyeglasses sunglasses blinking mouthmovement and specular reflection on glasses Here the openeye was marked as a circle and the closed eye was marked asa rectangle The eye region is set in proportion to the detectedface region and the average size of the eye region is 40times26pixels
323 Results of measuring the inattention levelIn the driver-monitoring system it is very important to ensurethat a driver is paying adequate attention to the road ahead amust-see position when driving We can consider two situa-
Table 10 Accuracy of the eye states detection method when using each feature or combining multiple features
Input features
Type I error (Error rate forwhen an open eye is falselyaccepted as a closed eye)
Type II error (Error rate for when aclosed eye is falsely rejected as
an open eye)
Kurtosis 874 (6347250) 875 (70800)
Sparseness 786 (5707250) 788 (63800)
Sparsenesskurtosis
697 (5057250) 700 (56800)
PCA 393 (2857250) 400 (32800)
PCA + LDA 326 (2367250) 325 (26800)
PCA + LDAsparseness
280 (2037250) 275 (22800)
PCA + LDAkurtosis
297 (2157250) 300 (24800)
PCA + LDAsparsenesskurtosis
223 (1627250) 225 (18800)
Optical Engineering December 2011Vol 50(12)127202-17
Jo et al Vision-based method for detecting driver drowsiness and distraction
Table 11 Performance of our proposed method for eye states detection in Database 2
Time Glass type
Type I error (Error rate forwhen an open eye isfalsely accepted as a
closed eye)
Type II error (Error rate forwhen a closed eye is
falsely rejected as an openeye)
Not wearing glasses 120 (19816451) 354 (722032)
Eyeglasses 305 (2046699) 156 (161024)
Day Sunglasses 073 (283830) 112 (5447)
Subtotal 159 (43026980) 265 (933503)
Not wearing glasses 049 (6413185) 315 (621967)
Night Eyeglasses 230 (24110465) 332 (351055)
Subtotal 129 (30523650) 321 (973022)
Total 145 (73550630) 291 (1906525)
tions when a driver does not see the road ahead when drivingFirst it is a situation when the driver closes his or her eyesduring driving while drowsy The second situation is whenthe driverrsquos head is rotated when driving distractedly Bothof these situations are dangerous because the driver does notpay adequate attention to the road ahead In this paper weproposed a system to monitor these hazards simultaneouslyTwo measures PERCLOS and PERLOOK are used to detectthe drowsiness and distraction level respectively
Figure 20 shows the result of PERCLOS measurementfor drowsy sequences the state of a driver is alert for thefirst 100 s and during the remaining time the driver exhibitsdrowsy driving behavior In Fig 20 we were able to confirmthat the driver drowsiness was well detected by PERCLOSHowever if the driver exhibits distracted driving behaviorthe distracted behavior cannot be detected using the PERC-LOS measurement In Fig 21 the driver was requested to
Fig 18 Results of the proposed eye-detection and eye-statesndashdetection method on images captured during the daytime for a driverwho (a) did not wear any glasses and (b) wore sunglasses (Threevertical lines refer to the left right and center of the face)
drive normally for the first 160 s and then distractedly forthe remaining time Figure 21(a) shows the result of PER-CLOS measurement for distracted sequences In Figs 21(a)and 21(b) it is evident that distracted behaviors cannot bedetected using the PERCLOS measure alone Figure 21(a)measured by PERCLOS shows the false determination of adistracted behavior as a normal behavior Figure 21(b) mea-sured by PERLOOK shows that the driver distraction waswell detected at sim160 s
The experiments to measure the drowsiness and distrac-tion levels were executed on the image sequences in database2 For each of the subjects 36 drowsy video sequences and189 distracted video sequences were recorded during the day-time and 20 drowsy video sequences and 120 distracted videosequences were recorded during the nighttime For each ofthe drowsy video sequences about 5ndash10 min of observationwas recorded The subjects were requested to look frontally
Fig 19 Results of the proposed eye-detection and eye-statesndashdetection method on images captured during the nighttime for a driverwho (a) did not wear any glasses and (b) wore eyeglasses
Optical Engineering December 2011Vol 50(12)127202-18
Jo et al Vision-based method for detecting driver drowsiness and distraction
Fig 20 PERCLOS measurement for drowsy sequences
for 5 s and then drive normally or to drowsily drive for theremaining period For each of the distracted video sequencessim1 min of observation was recorded The subjects were re-quested to look frontally for 5 s and then drive normallyor to distractively drive for the remaining period Thus foreach subject we obtained three kinds of sequences normaldrowsy and distracted driving video sequences The experi-mental results using these video sequences are presented in
Table 13 In this experiment we achieved satisfying resultsAs shown in Table 13 the error rate of falsely recognizinga drowsy state or a distracted state as a normal state is 0while the error rate (false alarm) of falsely recognizing anormal state as a drowsy state or a distracted state is sim2That is there was no error in detecting drowsiness or dis-traction when the driver was actually drowsy or distractedOn the other hand six cases of a false alarm occurred in nor-
Fig 21 PERCLOS and PERLOOK measurements for a distracted video sequence (a) PERCLOS and (b) PERLOOK
Optical Engineering December 2011Vol 50(12)127202-19
Jo et al Vision-based method for detecting driver drowsiness and distraction
Fig 22 ROC curves for drowsiness and distraction detection accuracy (a) drowsiness detection and (b) distraction detection
mal driving videos of sim4 h which corresponds to 1ndash2 falsealarms per hour these can be regarded as small errors Failureanalysis revealed that a normal state was falsely recognizedas a drowsy state because the eyes were recognized as closedeyes when the driver laughed for a certain amount of timeErrors related to the driverrsquos habit of blinking hisher eyesoccur frequently Thus the measured PERCLOS was largerthan that for normal drivers Because a false alarm can annoythe driver we focused on the detection of dangerous inatten-tion By changing the decision threshold value the number
of false alarms can be reduced at the expense of increasingthe error of missing true detections
Also the false alarm can be reduced using the othermethods such as facial expression recognition user-specificdriver monitoring or driving behavior information such asmonitoring vehicle speed steering movement lane keepingacceleration braking and gear changing These works wouldbe considered in the future
Figure 22 shows the ROC curve for drowsiness and dis-traction detection accuracy by thresholds PERCLOS and
Optical Engineering December 2011Vol 50(12)127202-20
Jo et al Vision-based method for detecting driver drowsiness and distraction
Fig 23 One screen shot of actual drowsy video
PERLOOK ROC curve is a graphical plot of the sensitivityor true acceptance rate versus false acceptance rate for abinary classifier system because its discrimination thresholdis varied70 For convenience when the inattentive state isfalsely accepted as the normal state we define it as false-acceptance rate (FAR) in this paper In addition when thenormal state is falsely accepted as the inattentive state we de-fine it as false-rejection rate (FRR) When the FAR and FRRare equal the common value is referred to as the equal-errorrate The true-acceptance rate indicates a value subtractingFRR from 100
We describe a comparative experiment for measuringdrowsy parameters in each actual and virtual drowsinessvideo In our test the drowsy driverndashdetection performancewas measured using the virtual drowsiness video that wasobtained when 10 people simulated drowsy driving behaviorWe used a virtual drowsiness video because it is dangerousand difficult to obtain an actual drowsiness video moreoveran open database of actual drowsiness videos is not availableThus it was necessary to compare the values of PERCLOS inthe virtual drowsiness video with those in the actual drowsi-
Table 12 Testing data to detect the drowsiness and distraction of adriver in a vehicle
Time Driver state No test videos
Normal state 189
Day Drowsy state 36
Distracted state 189
Normal state 120
Night Drowsy state 20
Distracted state 120
Total 674
ness video The actual drowsiness video shown in Fig 23was obtained when a subject was actually drowsy at dawn (ataround 400 or 500 AM) Although this video was obtainedin the laboratory the acquisition environment (the positionsof a user and the proposed device the viewing angle of thecamera etc) was similar to that in a car Figure 24 showsgraphs for PERCLOS in the actual and virtual drowsinessvideos It is easy to identify that these features of PERC-LOS are similar In the actual drowsiness video the driverbegins to falls asleep after 300 frames and the average valueof PERCLOS is sim05254 In the virtual drowsiness videothe driver begins to falls asleep after 400 frames and theaverage value of PERCLOS is sim05024 Therefore we canpredict that the drowsy driverndashdetection performance in thevirtual drowsiness video will be similar to that in the actualdrowsiness video
Because it is difficult and dangerous to obtain drowsyor distracted videos in real conditions they were not ob-tained However the 189 videos [in (daytime) normal state ofTable 12] include five videos that were obtained when userswere actually driving on an expressway In the future webelieve that it would be possible to obtain a greater number
Fig 24 Comparison between the PERCLOS values in the actual and virtual drowsiness video (a) actual drowsiness and (b) virtual drowsiness
Optical Engineering December 2011Vol 50(12)127202-21
Jo et al Vision-based method for detecting driver drowsiness and distraction
Table 13 Drowsiness and distraction detection results measured from video sequences in a vehicle
Error rates ()
Misrecognizing adrowsy state asa normal state
Misrecognizing anormal state asa drowsy state
Misrecognizing adistracted state
as a normalstate
Misrecognizing anormal state as
a distractedstate
Misrecognizing adrowsy state as
a distractedstate
Misrecognizing adistracted state
as a drowsystate
0 (056) 162 (5309) 0 (0309) 064 (2309) 179 (156) 0 (0309)
of drowsy or distracted videos in real conditions with thesupport of car manufacturers
324 Processing timeThe proposed driver-monitoring system was efficient andworked in real time The software was implemented usingVisual C + + on an Intel Pentium M processor 160 GHz500 MB RAM Although not all the code optimizationswere completed the processing times are encouraging fora real-time implementation The total processing time was31 msframe and the processing times of each step are shownin Table 14
4 ConclusionIn this study we proposed a driver-monitoring system thatcan be used for warning against driver inattention includ-ing drowsiness and distraction We proposed an algorithmthat automatically localizes the eyes determines whetherthey are opened or closed and finally judges whether thedriver is driving drowsily or distractedly This constitutes anonintrusive approach to detecting driver inattention withoutannoyance or interference in both daytime and nighttime
The framework consists of three steps The first stepinvolves eye detection and tracking In driving sequenceimages adaboost adaptive template-matching and blob-detection methods are combined to detect the eyes automat-ically Eye detection is verified using an eye-validation tech-nique based on PCA + LDA and SVM The proposed eyedetector works well when the driver closes his or her eyes orwears eyeglasses and sunglasses High detection rates wereachieved in tests carried out on 12 people in the database
Table 14 Processing time of proposed driver monitoring system
Process Processing time (msframe)
Eye adaboost 231
Adaptive template matching 07
Blob detector 12
Eye validation by using SVM 22
Total eye detection 145
Eye states detection 24
Head pose estimationa 141
Total processing time 31
aReference 39
during both daytime and nighttime as well as when wearingsunglasses or eyeglasses
The second step is a process for classifying eyes as openedor closed For this purpose appearance-based features are ex-tracted from the detected eye image by PCA + LDA andedge-based features are obtained on the basis of sparsenessand kurtosis The detected eyes are then classified as openor closed by an SVM using the combined features We con-firmed that performance of the combined system is betterthan that of a single system Experimental results revealedthat the classification error rate in the databases was lt3during both daytime and nighttime as well as when wearingsunglasses or eyeglasses
The third step is a process for measuring the drowsinessand distraction levels of the driver In this process we pro-posed a method for checking these two conditions simultane-ously Two measures PERCLOS and PERLOOK are used tocalculate the drowsiness and distraction levels respectivelyand they yield satisfactory results
In the future we plan to conduct tests with a greater num-ber of users and over longer periods of time in order to obtainactual drowsy and distracted behaviors From the viewpointof gaze estimation we need to develop a precise gaze-estimation method using both head-pose and eye-movementinformation In the drowsy driverndashdetection method facialexpression recognition must be employed to distinguisheyes closed due to fatigue from those closed due to vigorouslaughter Moreover because eye size eye blinking frequencyand driving habits vary among drivers we need to developa driver-specific monitoring system using an online trainingmethod This system will exhibit better performance if it isintegrated with other sensors such as the accelerator steeringwheel and lane-position sensor Finally an integrated driv-ing safety system will be more effective when combined witha pedestrian-recognition system and a lane-keeping supportsystem
AcknowledgmentsThis work was supported in part by Mando Corporation LtdAnd in part by the National Research Foundation of Korea(NRF) grant funded by the Korea government (MEST) (GrantNo 2011-0015321)
References1 M R Rosekind E L Co K B Gregory and D L Miller ldquoCrew
factors in flight operations XIII a survey of fatigue factors incorporateexecutive aviation operationsrdquo NASA Ames Research Cen-ter NASATM-2000-209 610 (2000)
2 Awake Consortium (IST 2000-28062) ldquoSystem for effective assess-ment of driver vigilance and warning according to traffic risk estima-
Optical Engineering December 2011Vol 50(12)127202-22
Jo et al Vision-based method for detecting driver drowsiness and distraction
tion (AWAKE)rdquo September 2001ndash2004 lthttpwwwawake-euorggt(April 16 2011)
3 US Department of Transportation ldquo2007 FARSGES an-nual report (final ed)rdquo lthttpwwwnhtsadotgovportalsitenhtsamenuitem6a6eaf83cf719ad24ec86e10dba046a0gt (April 16 2011)
4 W Wierwille L Tijerina S Kiger T Rockwell E Lauber andA Bittne ldquoFinal report supplementmdashheavy vehicle driver workloadassessmentmdashtask 4 review of workload and related researchrdquo USDOTTech Rep No DOT HS 808 467(4) (1996)
5 H Saito T Ishiwaka M Sakata and S Okabayashi ldquoApplicationsof driverrsquos line of sight to automobilesmdashwhat can driverrsquos eye tellrdquo inProc of Vehicle Navigation and Information Systems Conf Yokohamapp 21ndash26 (1994)
6 H Ueno M Kaneda and M Tsukino ldquoDevelopment of drowsiness de-tection systemrdquo in Proc of Vehicle Navigation and Information SystemsConf Yokohama pp 15ndash20 (1994)
7 S Boverie J M Leqellec and A Hirl ldquoIntelligent systems for videomonitoring of vehicle cockpitrdquo in Proc of Int Congress and Exposi-tion ITS Advanced Controls and Vehicle Navigation Systems pp 1ndash5(1998)
8 M Kaneda H Ueno and M Tsukino ldquoDevelopment of a drowsinesswarning systemrdquo in Proc of 11th Int Conf on Enhanced Safety ofVehicle Munich (1994)
9 R Onken ldquoDaisy an adaptive knowledge-based driver monitoring andwarning systemrdquo in Proc of Vehicle Navigation and Information Sys-tems Conf Yokohama pp 3ndash10 (1994)
10 T Ishii M Hirose and H Iwata ldquoAutomatic recognition of driverrsquos fa-cial expression by image analysisrdquo Journal of the Society of AutomotiveEngineers of Japan Vol 41 pp 1398ndash1403 (1987)
11 K Yammamoto and S Higuchi ldquoDevelopment of a drowsiness warningsystemrdquo Journal of the Society of Automotive Engineers of JapanVol 46 pp 127ndash133 (1992)
12 D F Dinges M Mallis G Maislin and J W Powell ldquoEval-uation of techniques for ocular measurement as an index offatigue and the basis for alertness managementrdquo Departmentof Transportation Highway Safety Publication 808 762 April(1998)
13 R Grace V E Byrne D M Bierman and J M Legrand ldquoA drowsydriver detection system for heavy vehiclesrdquo in Proceedings of Digi-tal Avionics Systems Conference 17th DASC Vol 2 pp I361ndashI368(1998)
14 D Cleveland ldquoUnobtrusive eyelid closure and visual of regard mea-surement systemrdquo Conference on Ocular Measures of Driver alertnessApril (1999)
15 J Fukuda K Adachi M Nishida and E Akutsu ldquoDevelopment ofdriverrsquos drowsiness detection technologyrdquo Toyota Tech Rev 45 34ndash40(1995)
16 J H Richardson ldquoThe development of a driver alertness monitoringsystemrdquo in Fatigue and Driving Driver Impairment Driver Fatigueand Driver Simulation L Harrtley Ed Taylor amp Francis London(1995)
17 T DrsquoOrazio M Leo C Guaragnella and A Distante ldquoA visual ap-proach for driver inattention detectionrdquo Pattern Recogn 40 2341ndash2355(2007)
18 E Murphy-Chutorian and M M Trivedi ldquoHead pose estimation incomputer vision a surveyrdquo IEEE Trans Pattern Anal Mach Intell31(4) 607ndash626 (2009)
19 D W Hansen and Q Ji ldquoIn the eye of the beholder a survey of modelsfor eyes and gazerdquo IEEE Trans Pattern Anal Mach Intell 32 478ndash500(2010)
20 A Hattori S Tokoro M Miyashita I Tanakam K Ohue and SUozumi ldquoDevelopment of forward collision warning system using thedriver behavioral informationrdquo presented at 2006 SAE World CongressDetroit Michigan (2006)
21 E Murphy-Chutorian A Doshi and M M Trivedi ldquoHead pose estima-tion for driver assistance systems a robust algorithm and experimentalevaluationrdquo in Proc of 10th Int IEEE Conf Intelligent TransportationSystems pp 709ndash714 (2007)
22 P Smith M Shah and N da Vitoria Lobo ldquoDetermining driver vi-sual attention with one camerardquo IEEE Trans Intell Transp Syst 4(4)2058ndash2218 (2003)
23 J Y Kaminski D Knaan and A Shavit ldquoSingle image face orientationand gaze detectionrdquo Mach Vis Appl 21 85ndash98 (2009)
24 J C Stutts D W Reinfurt L Staplin and E A Rodgman ldquoThe roleof driver distraction in traffic crashesrdquo AAA Foundation for TrafficSafety Washington DC (2001)
25 K Torkkola N Massey and C Wood ldquoDriver inattention detectionthrough intelligent analysis of readily available sensorsrdquo in Proc ofIEEE Conf on Intelligent Transportation Systems Washington DCpp 326ndash331 (2004)
26 G Yang Y Lin and P Bhattacharya ldquoA driver fatigue recogni-tion model using fusion of multiple featuresrdquo in Proc of IEEE IntConf on Syst Man and Cybernetics Hawaii Vol 2 pp 1777ndash1784(2005)
27 S Park and M M Trivedi ldquoDriver activity analysis for in-telligent vehicles issues and development frameworkrdquo in Proc
of IEEE Intelligent Vehicles Symp Las Vegas pp 795ndash800(2005)
28 E Vural M Cetin A Ercil G Littlewort M S Bartlett and J RMovellan ldquoDrowsy driver detection though facial movement analysisrdquoIEEE Int Conf on Computer VisionndashHuman Computer Interaction pp6ndash18 (2007)
29 M Saradadevi and P Bajaj ldquoDriver fatigue detection using mouth andyawning analysisrdquo Int J Comput Sci Netw Security 8(6) 183ndash188(2008)
30 L M Beragasa J Nuevo M A Sotelo R Barea and E LopezldquoReal-time system for monitoring driver vigilancerdquo IEEE Trans IntellTransport Syst 7(1) 1524ndash1538 (2006)
31 R Senaratne D Hardy B Vanderaa and S Halgamuge ldquoDriver fatiguedetection by fusing multiple cuesrdquo Lect Notes Comput Sci 4492 801ndash809 (2007)
32 K Kircher A Kircher and F Claezon ldquoDistraction and drowsinessmdashafield studyrdquo Tech Rep VTI (The Swedish National Road and TransportResearch Institute) (2009)
33 S J Lee J Jo H G Jung K R Park and J Kim ldquoReal-time gaze es-timator based on driverrsquos head orientation for forward collision warningsystemrdquo IEEE Trans Intell Transp Syst 12(1) 254ndash267 (2011)
34 Specification of illuminator lthttproithner-lasercommultiled_multi_tohtmlge (July 25 2011)
35 Camera (EC650) lthttpwwwpyramidimagingcomspecsProsilica700009AA-EC65020User20Manualpdfgt (August 25 2011)
36 Camera lens (ML0614) lthttpwwwphoeniximagingcomml-0614htmge (July 25 2011)
37 Narrow bandpass interference filter (NT43-148) lthttpwwwedmundopticscomonlinecatalogdisplayproductcfmproductid=3198ampPageNum=5ampSort=displayOrderampOrder=ascproductsgt (July 252011)
38 SUV (GIA motors Sportage) lthttpwwwkiacomsportageexploregt (August 25 2011)
39 Sedan (Hyundai Motors Grandeur) lthttpgrandeurhyundaicomge(August 25 2011)
40 T Ito S Mita K Kozuka T Nakano and S Yamamoto ldquoDriver blinkmeasurement by the motion picture processing and its application todrowsiness detectionrdquo in Proc of Int Conf Intelligent TransportationSystems Singapore pp 168ndash173 (2002)
41 K Ohue Y Yamada S Uozumi S Tokoro A Hattori and T HayashildquoDevelopment of a new pre-crash safety systemrdquo SAE Tech PaperSeries Doc No 2006-01-1461 (2006)
42 Specification of motion tracking device called Patriot lthttpwwwpolhemuscompolhemus_editorassetsTech20compare20with20ResolutionvsRange20graphspdfgt (February 15 2011)
43 W J Scheirer A Rocha B Heflin and T E Boult ldquoDifficult detectiona comparison of two different approaches to eye detection for uncon-strained environmentsrdquo in Proc of IEEE 3rd Int Conf on BiometricsTheory Applications and Systems pp 1ndash8 (2009)
44 C Whitelam Z Jafri and T Bourlai ldquoMultispectral eye detection apreliminary studyrdquo in Proc of 2010 Int Conf on Pattern Recognitionpp 209ndash212 (2010)
45 P Viola and M Jones ldquoRapid object detection using a boosted cascadeof simple featuresrdquo in Proc of IEEE CVPR Vol 1 pp I-511ndashI-518(2001)
46 S D Wei and S H Lai ldquoFast template matching based on normalizedcross correlation with adaptive multilevel winner updaterdquo IEEE TransImage Process 17(11) 2227ndash2235 (2008)
47 Open source of blob detection lthttpopencvwillowgaragecomwikicvBlobsLibAlgorithmgt (July 30 2011)
48 R C Gonzalez and R E Woods Digital Image Processing 2nd edpp 523ndash532 Prentice-Hall Englewood Cliffs NJ (2002)
49 G Donato M S Bartlett J C Hager P Ekman and T J SejnowskildquoClassifying facial actionsrdquo IEEE Trans Pattern Anal Mach Intell21 974ndash989 (1999)
50 P N Bellhumeur J P Hespanha and D J Kriegman ldquoEigenfaces vsfisherfaces recognition using class specific linear projectionrdquo IEEETrans Pattern Anal Mach Intell 19 711ndash720 (1997)
51 A M Martinez and A C Kak ldquoPCA versus LDArdquo IEEE Trans PatternAnal Mach Intell 23 228ndash233 (2001)
52 M Turk and A Pentland ldquoEigenfaces for recognitionrdquo J CognitiveNeuro-sci 3 71ndash86 (1991)
53 H Deng L Jin L Zhen and J Huang ldquoA new facial expressionrecognition method nased on local gabor filter bank and PCA plusLDArdquo in Proc of Int Conf on Intelligent Computing August 23ndash26Hefei China pp 6ndash7 (2005)
54 V Vapnik ldquoSupport vector estimation of functionsrdquo in StatisticalLearning Theory pp 375ndash570 Wiley Hoboken NJ (1998)
55 C Hsu C Chang and C Lin ldquoA practical guide to supportvector classificationrdquo Tech Rep Department of Computer Sci-ence and Information Engineering National Taiwan UniversityTaipei lthttpwcsieorg˜cjlinpapersguideguidepdfgt (March 23(2011)
56 L Lang and H Qi ldquoThe study of driver fatigue monitor algorithmcombined PERCLOS and AECSrdquo in Proc of Int Conf on ComputSci and Software Eng pp 349ndash352 (2008)
Optical Engineering December 2011Vol 50(12)127202-23
Jo et al Vision-based method for detecting driver drowsiness and distraction
57 L Harley T Horberry N Mabbott and G Krueger ldquoReview of fa-tigue detection and prediction technologiesrdquo National Road TransportCommission (2000)
58 R Jain R Kasturi and B G Schunck Machine Vision pp 78ndash84McGraw-Hill New York (1995)
59 P O Hoyer ldquoNon-negative matrix factorization with sparseness con-straintsrdquo J Mach Learning Res 5 1457ndash1469 (2004)
60 A Hyvarinen and E Oja ldquoIndependent component analysisrdquo NeuralNetw 13(4ndash5) 411ndash430 (2000)
61 Q Ji and X Yang ldquoReal-time eye gaze and face pose tracking formonitoring driver vigilancerdquo Real-Time Imaging 8(5) 357ndash377 (2002)
62 D F Dinges M M Mallis G Maislin and J W Powell ldquoEvaluationof techniques for ocular measurement as an index of fatigue and thebasis for alertness managementrdquo US Department of TransportationNational Highway Traffic Safety Administration DOT HS 808 762(1998)
63 Smart Eye Pro lthttpwwwsmarteyesegt (25 July 2011)64 S Kawato and J Ohya ldquoReal-time detection of nodding and head-
shaking by directly detecting and tracking the between-eyesrdquo in Procof 4th Intrsquol IEEE Conf Automatic Face and Gesture Recognitionpp 40ndash45 (2000)
65 B Ma S Shan X Chen and W Gao ldquoHead yaw estimation fromasymmetry of facial appearancerdquo IEEE Trans Syst Man Cybern PartB 38(6) 1501ndash1512 (2008)
66 P Watta S Lakshmanan and Y Hou ldquoNonparametric approaches forestimating driver poserdquo IEEE Trans Vehicular Technol 56(4) 2028ndash2041 (2007)
67 J Wu and M M Trivedi ldquoA two-stage head pose estimation frameworkand evaluationrdquo Pattern Recogn 41 1138ndash1158 (2008)
68 E Murphy-Chutorian and M M Trivedi ldquoHyHOPE hybrid head ori-entation and position estimation for vision-based driver head trackingrdquoin Proc of IEEE Intell Vehicles Symp pp 512ndash517 (2008)
69 J P Batista ldquoA real-time driver visual attention monitoring systemrdquoLect Notes Comput Sci 3522 200ndash208 (2005)
70 N K Ratha and V Govindaraju Advances in Biometrics SensorsAlgorithms and System Springer New York (2008)
Jaeik Jo received the BS in electricaland electronic engineering in 2008 fromYonsei University Seoul Korea where he iscurrently working toward the MS-PhD jointdegree His current research interests in-clude driver monitoring systems 3-D face re-construction biometrics pattern recognitionand computer vision
Sung Joo Lee received the BS in electri-cal and electronic engineering and the MSin biometric engineering in 2004 and 2006respectively from Yonsei University SeoulKorea where he received the PhD in elec-trical and electronic engineering in 2011 In2011 he joined the Mobis Co Ltd wherehe is currently an assistant research engi-neer His current research interests includemoving object detection driver monitoringsystem biometrics pattern recognition and
computer vision
Ho Gi Jung received the BE ME and PhDin electronic engineering from Yonsei Univer-sity Seoul Korea in 1995 1997 and 2008respectively He was with MANDO Corpora-tion Global RampD HQ from 1997 to April2009 He developed environmental recog-nition systems for intelligent parking assistsystem collision warning and avoidance sys-tem and active pedestrian protection sys-tem From May 2009 to February 2011 hewas with Yonsei University as a full-time re-
searcher and research professor He researched computer visionapplications for intelligent surveillance systems and biometric sys-tems Since March 2011 he has been with Hanyang University asan assistant professor He is researching recognition systems for in-telligent vehicles His interests are recognition system for intelligentvehicle next generation vehicle computer vision applications andpattern recognition applications
Kang Ryoung Park received his BS and MSin electronic engineering from Yonsei Uni-versity Seoul Korea in 1994 and 1996 re-spectively He also received his PhD in com-puter vision from the Department of Electricaland Computer Engineering Yonsei Univer-sity in 2000 He was an assistant professorin the Division of Digital Media Technologyat Sangmyung University from March 2003to February 2008 He has been an assis-tant and associate professor in the Division
of Electronics and Electrical Engineering at Dongguk University sinceMarch 2008 He is also a research member of BERC His researchinterests include computer vision image processing and biometrics
Jaihie Kim received the BS in electronic en-gineering from Yonsei University Republic ofKorea in 1979 the PhD in electrical engi-neering from the Case Western Reserve Uni-versity USA in 1984 Since 1984 he hasbeen a professor in the School of Electri-cal and Electronic Engineering Yonsei Uni-versity Currently he is the Director of theBiometric Engineering Research Center inKorea the Chairman of the Korea Biomet-ric Association a member of the National
Academy of Engineering of Korea and in 2008 he was the Presi-dent of the IEEK (Institute of Electronics Engineers of Korea) andnow an Emeritus President of the IEEK His general research inter-ests are biometrics pattern recognition and computer vision Specif-ically some of his recent research topics include touchless finger-print recognition fake fingerprint detection fake face detection 2D-to-3D face conversion face age estimationsynthesis He was theauthor of many international technical journals which could be foundat lsquohttpcherupyonseiackrrsquo
Optical Engineering December 2011Vol 50(12)127202-24
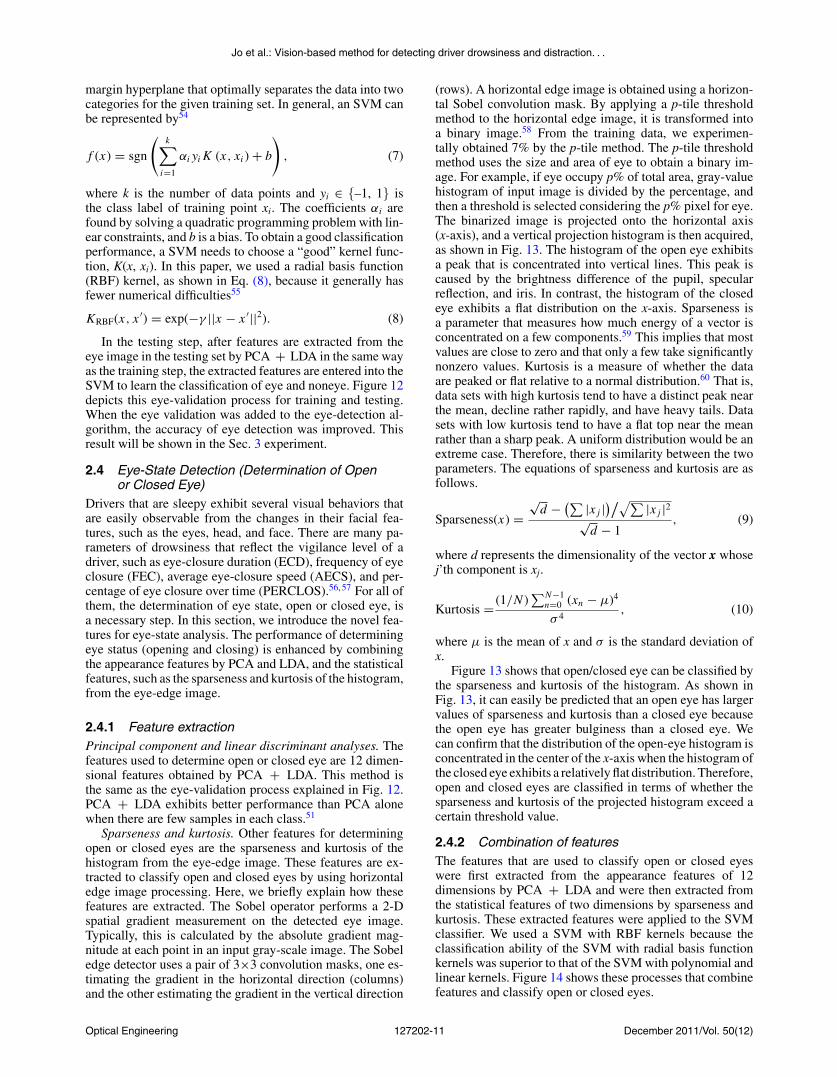
Jo et al Vision-based method for detecting driver drowsiness and distraction
margin hyperplane that optimally separates the data into twocategories for the given training set In general an SVM canbe represented by54
f (x) = sgn
(ksum
i=1
αi yi K (x xi ) + b
) (7)
where k is the number of data points and yi isin ndash1 1 isthe class label of training point xi The coefficients αi arefound by solving a quadratic programming problem with lin-ear constraints and b is a bias To obtain a good classificationperformance a SVM needs to choose a ldquogoodrdquo kernel func-tion K(x xi) In this paper we used a radial basis function(RBF) kernel as shown in Eq (8) because it generally hasfewer numerical difficulties55
KRBF(x x prime) = exp(minusγ ||x minus x prime||2) (8)
In the testing step after features are extracted from theeye image in the testing set by PCA + LDA in the same wayas the training step the extracted features are entered into theSVM to learn the classification of eye and noneye Figure 12depicts this eye-validation process for training and testingWhen the eye validation was added to the eye-detection al-gorithm the accuracy of eye detection was improved Thisresult will be shown in the Sec 3 experiment
24 Eye-State Detection (Determination of Openor Closed Eye)
Drivers that are sleepy exhibit several visual behaviors thatare easily observable from the changes in their facial fea-tures such as the eyes head and face There are many pa-rameters of drowsiness that reflect the vigilance level of adriver such as eye-closure duration (ECD) frequency of eyeclosure (FEC) average eye-closure speed (AECS) and per-centage of eye closure over time (PERCLOS)56 57 For all ofthem the determination of eye state open or closed eye isa necessary step In this section we introduce the novel fea-tures for eye-state analysis The performance of determiningeye status (opening and closing) is enhanced by combiningthe appearance features by PCA and LDA and the statisticalfeatures such as the sparseness and kurtosis of the histogramfrom the eye-edge image
241 Feature extractionPrincipal component and linear discriminant analyses Thefeatures used to determine open or closed eye are 12 dimen-sional features obtained by PCA + LDA This method isthe same as the eye-validation process explained in Fig 12PCA + LDA exhibits better performance than PCA alonewhen there are few samples in each class51
Sparseness and kurtosis Other features for determiningopen or closed eyes are the sparseness and kurtosis of thehistogram from the eye-edge image These features are ex-tracted to classify open and closed eyes by using horizontaledge image processing Here we briefly explain how thesefeatures are extracted The Sobel operator performs a 2-Dspatial gradient measurement on the detected eye imageTypically this is calculated by the absolute gradient mag-nitude at each point in an input gray-scale image The Sobeledge detector uses a pair of 3times3 convolution masks one es-timating the gradient in the horizontal direction (columns)and the other estimating the gradient in the vertical direction
(rows) A horizontal edge image is obtained using a horizon-tal Sobel convolution mask By applying a p-tile thresholdmethod to the horizontal edge image it is transformed intoa binary image58 From the training data we experimen-tally obtained 7 by the p-tile method The p-tile thresholdmethod uses the size and area of eye to obtain a binary im-age For example if eye occupy p of total area gray-valuehistogram of input image is divided by the percentage andthen a threshold is selected considering the p pixel for eyeThe binarized image is projected onto the horizontal axis(x-axis) and a vertical projection histogram is then acquiredas shown in Fig 13 The histogram of the open eye exhibitsa peak that is concentrated into vertical lines This peak iscaused by the brightness difference of the pupil specularreflection and iris In contrast the histogram of the closedeye exhibits a flat distribution on the x-axis Sparseness isa parameter that measures how much energy of a vector isconcentrated on a few components59 This implies that mostvalues are close to zero and that only a few take significantlynonzero values Kurtosis is a measure of whether the dataare peaked or flat relative to a normal distribution60 That isdata sets with high kurtosis tend to have a distinct peak nearthe mean decline rather rapidly and have heavy tails Datasets with low kurtosis tend to have a flat top near the meanrather than a sharp peak A uniform distribution would be anextreme case Therefore there is similarity between the twoparameters The equations of sparseness and kurtosis are asfollows
Sparseness(x) =radic
d minus (sum |x j |)radicsum |x j |2radic
d minus 1 (9)
where d represents the dimensionality of the vector x whosejrsquoth component is xj
Kurtosis = (1N )sumNminus1
n=0 (xn minus μ)4
σ 4 (10)
where μ is the mean of x and σ is the standard deviation ofx
Figure 13 shows that openclosed eye can be classified bythe sparseness and kurtosis of the histogram As shown inFig 13 it can easily be predicted that an open eye has largervalues of sparseness and kurtosis than a closed eye becausethe open eye has greater bulginess than a closed eye Wecan confirm that the distribution of the open-eye histogram isconcentrated in the center of the x-axis when the histogram ofthe closed eye exhibits a relatively flat distribution Thereforeopen and closed eyes are classified in terms of whether thesparseness and kurtosis of the projected histogram exceed acertain threshold value
242 Combination of featuresThe features that are used to classify open or closed eyeswere first extracted from the appearance features of 12dimensions by PCA + LDA and were then extracted fromthe statistical features of two dimensions by sparseness andkurtosis These extracted features were applied to the SVMclassifier We used a SVM with RBF kernels because theclassification ability of the SVM with radial basis functionkernels was superior to that of the SVM with polynomial andlinear kernels Figure 14 shows these processes that combinefeatures and classify open or closed eyes
Optical Engineering December 2011Vol 50(12)127202-11
Jo et al Vision-based method for detecting driver drowsiness and distraction
Fig 13 Horizontal edge-image process for classification of open and closed eye
25 Detection of Drowsiness and DistractionAfter classifying open or closed eyes and estimating the headpose of a driver the inattention of the driver is determinedby PECLOS which represents the drowsiness level andPERLOOK which represents the distraction level PERC-LOS is a parameter of drowsiness that is widely used tomonitor the drowsiness of a driver It is defined as the por-tion of time that the driverrsquos eyes are closed over a certainperiod57 61ndash63 This parameter can be obtained from
PERCLOS[k] =sumk
i=kminusn+1 Blink[i]
ntimes100 () (11)
where PERCLOS[k] means PERCLOS figure in the krsquothframe and n is a period measuring PERCLOS Blink[i] rep-resents that the eye is opened or closed in the irsquoth frame Ithas ldquo0rdquo if the eye is opened and ldquo1rdquo if the eye is closed Thehigher the PERCLOS is the higher the level of driver fatigueWhen PERCLOS exceeds the predetermined threshold the
proposed system generates a warning of inattention The pre-determined threshold was experimentally determined as 02by our experiments with training data
When a driver cannot look at the road ahead because thehead is rotated it causes the same accident hazard as whena driver cannot look ahead because their eyes are closed Assuch we propose a parameter PERLOOK which measuresthe driver-distraction level in the same way as PERCLOSPERLOOK is defined as the proportion of time that a driverrsquoshead is rotated and the driver does not look at the road aheadThis parameter can be obtained from
PERLOOK[k] =sumk
i=kminusn+1 Nonfront[i]
ntimes100 () (12)
where PERLOOK[k] indicates the PERLOOK figure in thekrsquoth frame and n is a period measuring PERLOOK Non-front[i] indicates that the driver is looking at the frontal ornonfrontal area in the irsquoth frame It is 1 if the driver is look-
Fig 14 Process of combining features and classifying open or closed eyes using an SVM
Optical Engineering December 2011Vol 50(12)127202-12
Jo et al Vision-based method for detecting driver drowsiness and distraction
Table 3 Specification of Database 1 for training
Daytime No subjects 12 persons (Male 9 Female 3 without glasses 2 with glasses 10)
No images 44197 images from 216 image sequences (12 personstimes18 gaze zones)
Nighttime No subjects 11 persons (Male 8 Female 3 without glasses 3 with glass 8)
No images 41155 images from 198 image sequences (11 personstimes18 gaze zones)
ing at the non-frontal area and 0 if the driver is looking atthe frontal area The higher the PERLOOK is the higherthe driver-distraction level is When PERLOOK is greaterthan a predetermined threshold the proposed system gener-ates a warning of inattention The predetermined thresholdwas experimentally determined as 035 by our experimentswith training data From Sec 231 if the yaw angle of adriver is greater than +15 deg or less than ndash15 deg (based onthe frontal direction) and if the corresponding accumulativetime is longer than 35 s during the unit interval of 10 s oursystem determines it as a ldquodistractionrdquo For example if theyaw angle and accumulative time when a driver looks at aGPS device or changes a CD is satisfied by this condition itis determined as a distraction
3 Experiments
31 DatabaseIn order to evaluate the proposed method we attached thedeveloped system in front of a dashboard as shown in Fig 4and we collected 162772 frames from 22 subjects Severalexperiments were carried out using images of subjects of bothsexes some of whom wore sunglasses and eyeglasses duringboth daytime and nighttime The databases were acquired ina car using an NIR camera with a resolution of 640 times 480pixels and a frame rate of 25 fps
In our databases there are two data sets for training andtesting 12 subjects were categorized into a training groupand the remaining 10 subjects were categorized into a test-ing group The images from the training group were storedin database 1 whereas those from the testing group wererecorded in database 2 Database 1 which is shown inTable 3 has also been used in a previous study33 It con-tains 85352 images (6700ndash7500 images per subject) 1090images from database 1 were used to train the eye validationprocess as shown in Fig 12 and Table 4 703 images wereused for the classification process for open and closed eyesas shown in Fig 14 and Table 5 The 85352 training imagesinclude numerous overlapped data which can cause overfit-ting of the classification hyperplane of the SVM In order tosolve this problem 1090 samples from 12 subjects were ran-domly selected and used in SVM training for eye validationThe training set for the SVM classifier in the eye-validationprocess contains 860 positive samples (eye images) and 230negative samples (noneye images) as shown in Figs 15(a)and 15(b) In addition 703 samples from 12 subjects wererandomly selected and used in SVM training for eye-statedetection The training set for the SVM classifier in the eye-statendashdetection process contains 530 positive samples (open-eye images) and 173 negative samples (closed-eye images)as shown in Figs 15(c) and 15(d)
The remaining images in database 1 were heuristicallyused for parameter optimization in eye detection (Sec 232)In conclusion the training data were only used for parameteroptimization and SVM training
Database 2 contains 77420 images (7500ndash8000 imagesper subject) from the testing group In database 2 longerimage sequences were captured for each subject in orderto test the proposed inattention-detection method The sub-jects were requested to look frontally for 5 s and to thendrive normally drowsily or distractedly for the remainingperiod Thus for each subject we obtained three types ofsequences a normal driving video a drowsy driving videoand a distracted driving video In addition the subjects whodid not wear glasses were asked to wear sunglasses in orderto capture a new sequence Similarly the subjects who woreglasses were asked to remove their glasses or wear sunglassesin order to capture a new sequence
As compared to the number of drowsy driving videos thenumber of distracted driving videos is relatively large Thereason is as follows A driver can gaze at the 12 differentpositions (1ndash5 8 11 14ndash18) described in Fig 16 hence weneed to test the performance of distraction detection for thevarious gaze directions Thus for each subject we obtainedmultiple distracted videos in which the subject gazed at the12 different positions
Table 4 Train database for eye validation
Number of eye images used
as training data in eye validation
Glass type Left eyes Right eyes
Eye(positivesamples)
Not wearingglasses
627 473
Eyeglasses 128 208
Sunglasses 105 189
Subtotal 860 870
Noneye(negativesamples)
Not wearingglasses
78 123
Eyeglasses 103 108
Sunglasses 49 79
Subtotal 230 310
Total 1090 1180
Optical Engineering December 2011Vol 50(12)127202-13
Jo et al Vision-based method for detecting driver drowsiness and distraction
Table 5 Train database for eye state detection
Number of eye images used as trainingdata for blink detection
Glass type Left eyes Right eyes
Open eye(positivesamples)
Not wearingglasses
420 440
Eyeglasses 50 70
Sunglasses 60 50
Subtotal 530 560
Closedeye(negativesamples)
Not wearingglasses
102 105
Eyeglasses 33 40
Sunglasses 38 40
Subtotal 173 185
Total 703 745
In the case of distraction a driver is not looking aheadThus the videos in which a driver gazed at 12 different posi-tions among the 18 positions shown in Fig 16 were used forthe performance evaluation of distraction detection Unlikedistraction detection only two states [ie drowsy and normal(awake)] can be considered in the case of drowsiness detec-tion Hence the number of drowsy videos obtained from each
Fig 16 Discrete gaze zones in a vehicle
subject is less than that of distracted videos The duration ofeach distracted video is sim1 min whereas that of each drowsyvideo is around 5ndash10 min Table 6 shows database 2 in detail
32 Experimental ResultsThe experimental phase consists of three parts First theeye-detection algorithm was tested using image sequencesof different people obtained in a vehicle under differenttimes and light conditions Then the algorithm for eye-state detection was tested The features used to classifyeye states were extracted from a long image sequence Fi-nally the algorithm measuring the inattention level of adriver was tested The inattention level is composed of thedrowsiness and distraction levels Drowsiness level was mea-sured by PERCLOS and distraction level was calculated byPERLOOK
321 Eye-detection resultsIn order to evaluate the performance of our eye-detectionalgorithm three experiments were carried out and comparedto each other The first was performed using only the eyeadaboost with our database 2 When it is applied to every
Fig 15 Positive and negative samples provided to the SVM classifier in the training phase (a) Eye images (b) noneye images (c) open-eyeimages and (d) closed-eye images
Optical Engineering December 2011Vol 50(12)127202-14
Jo et al Vision-based method for detecting driver drowsiness and distraction
Table 6 Specification of Database 2 for testing
No subjects 9 persons (Male 6 Female 3 without glasses 9 with glasses 4with sunglasses 5)
No images for eye detection and eye state detection 40256 images from 36 image sequences
No images used for eye detection evaluation 32365 images from 36 image sequences (7891 images wereexcluded because the subject was looking away from the roadahead)
Daytime No images used for eye state detection evaluation 30483 images from 36 image sequences (9773 images wereexcluded because the subject was looking away from the roadahead (7891) or because the eyes could not be classified as openor closed (eg narrow eyes) (1882)
No sequences used to measure inattention level 189 video sequences driving normally
36 video sequences driving drowsily
189 video sequences driving distractedly (Total number of imagesabout 239200 images from 414 image sequences)
No subjects 10 persons (Male 7 Female 3 without glasses 5 with glasses 5)
No images for eye detection and eye state detection 37164 images from 20 image sequences
No images used for eye detection evaluation 28608 images from 20 image sequences (8556 images wereexcluded because the subject was looking away from the roadahead)
Nighttime No images used for eye state detection evaluation 26672 images from 20 image sequences (10492 images wereexcluded because the subject was looking away from the roadahead (8556) and because the eyes could not be classified as beingopen or closed (eg narrow eyes) (1936))
No sequences used to measure inattention level 120 video sequences driving normally
20 video sequences driving drowsily
120 video sequences driving distractedly (Total number of imagesabout 105800 images from 260 image sequences)
sequence frame it requires a long processing time and failsto detect eyes when the head is rotated or the eyes are closedThus it resulted in unsatisfactory eye-detection performanceand a slow processing time as shown in Table 7 In the secondexperiment we combined eye-detecting methods includingadaboost adaptive template matching and blob detectionand this improved both the detection accuracy of the closed-eye and the computational performance The third experi-ment was performed by adding the eye validation to thoseused in the second experiment When the eye validation wasadded to the eye-detection algorithm the accuracy of eyedetection was improved Without any eye verifier to checkwhether the detected eye region truly contains an eye thefalsely detected noneye image may be stored in the template
and the falsely detected eye could be repeatedly detected bythe adaptive template matching from the next frame Con-sequently in the second experiment propagation error wasgenerated and the error rate was 756 in eye detectionHowever after applying the eye-validation process the errorrate was decreased from 756 to 104
The eye-detection rate is calculated as follows First im-ages looking at the frontal area are extracted from totalimages in database 2 (Table 6) and then manually dividedinto eye images [as in Fig 15(a)] and noneye images [as inFig 15(b)] Then the eye-detection rate is calculated by thenumber of images that successfully detect eyes over the totalnumber of images Table 7 presents the eye-detection rateresults and also shows that the eyes can be sim989 success-
Fig 17 Excluded narrow eye samples
Optical Engineering December 2011Vol 50(12)127202-15
Jo et al Vision-based method for detecting driver drowsiness and distraction
Table 7 Results obtained after eye detection algorithms on images in Database 2
Conditions Eye-detection rate
Time Glass type Sequences Frames Adaboost
Proposed method(without the eye
validation process)
Proposed method(with the eye
validation process)
Notwearingglasses
18 19994 7652 9254 9855
Day Eyeglasses 8 8012 6735 9235 9888
Sunglasses 10 4359 6353 9202 9891
Subtotal 36 32365 7250 9242 9868
Notwearingglasses
10 16860 7398 9258 9885
Night Eyeglasses 10 11748 7012 9205 9789
subtotal 20 28608 7239 9236 9846
Total 68 60973 7245 9239 9858
Processing time 231 ms 115 ms 145 ms
fully detected by the proposed eye-detection method regard-less of time gender and glass type Detection error is causedby misrecognition of eyeglass frames eyebrows and eyesthat are partially visible in Fig 15(b) as true eyes Howeverthis detection error is not continuous in the video sequencesbecause the eye template is reset by the eye-validation pro-cess in the next frame when the eye detector detected anoneye
322 Eye-statesndashdetection resultsIn order to evaluate the performance of determining eye sta-tus eye images from database 2 in Table 6 were manuallydivided into two classes open and closed eyes and they wereused as ground-truth data Two experiments were then per-formed The first experiment is designed to test the effectof PCA + LDA features compared to PCA features Thesecond experiment is designed to compare and analyze theclassification performance of multiple features combiningPCA + LDA sparseness and kurtosis
It is of note that narrow eyes such as those in Fig 17 wereexcluded from the performance measurement in the testingdata Because human eyes change smoothly from an open eyeto a narrow eye and then a closed eye it is difficult to classifycrisply whether a narrow eye is an open eye or a closed eye inthe middle of the change However although a narrow eye isjudged as either an open or a closed eye it does not affect thetotal performance of determining drowsy behavior becauseit is a temporary and transitional state between an open andclosed eye Therefore narrow eyes were excluded from thetesting data
The performance in eye-states detection is measured byconsidering two errors For convenience when an open eye isfalsely accepted as a closed eye we define it as a type I errorIn addition when a closed eye is falsely rejected as an openeye we define it as a type II error Thus the performance of
eye-states detection was measured by type I error and type IIerror
In the first experiment in order to detect eye states fea-tures are extracted by PCA or PCA + LDA and the featuresare then entered into SVM and finally classified into open andclosed eyes This process is the same as the eye-validationprocess explained in Fig 12 As shown in Table 8 530 framesof open eyes and 173 frames of closed eyes were used in thetraining and some of the eye images in database 2 were testedThen 12 dimensional features for the best performance wereselected The method using the PCA + LDA exhibits betterperformance in classifying eye states than the method usingonly PCA in our experiment In particular the PCA + LDAfeature is more effective than the PCA or LDA feature whenthere are fewer training samples in each class The combinedfeatures of PCA + LDA are less sensitive to different illu-minations whereas the PCA feature is sensitive to changingillumination51 53
Table 9 shows the eye-statesndashdetection results by PCA+ LDA for each dimension First in order to find the properfeature dimension yielding the best recognition rate whenfeatures were extracted solely by PCA we tested for eachdimension and obtained the 15 dimensions as the best number
Table 8 Training and testing data sets for eye states detection
Eye states included
Data set Open eye Closed eye
Train 530 173
Test 7250 800
Optical Engineering December 2011Vol 50(12)127202-16
Jo et al Vision-based method for detecting driver drowsiness and distraction
Table 9 Recognition error rates by eliminating the first one to six principal components
No eliminated principal components
1 (14 dim) 2 (13 dim) 3 (12 dim) 4 (11 dim) 5 (10 dim) 6 (9 dim)
Inputfeature
Type Ierror
Type IIerror
Type Ierror
Type IIerror
Type Ierror
Type IIerror
Type Ierror
Type IIerror
Type Ierror
Type IIerror
Type Ierror
Type IIerror
PCA +LDA
352 350 343 338 326 325 348 350 339 338 415 413
(2557250
) (28
800
) (249
7250
) (27800
) (236
7250
) (26
800
) (2527250
) (28
800
) (2467250
) (27800
) (301
7250
) (33
800
)
of feature dimensions The recognition rates of PCA featuresare 9612 and 9615 for open and closed states respectively
Previous works in face recognition50ndash52 reported that elim-inating the first one to three PCs improved performance Be-cause these PCs are sensitive to various illuminations theyshould be removed In this study we eliminate the first oneto six PCs to analyze the recognition effect for eye-statesdetection The experiment results are presented in Table 9
Table 9 demonstrates that eliminating the first one to threePCs will achieve the best performance rates in our data Thebest performances for the PCA + LDA feature 326 and325 were obtained by eliminating the first three PCsWhen removing more than four PCs the results grew worse
In the second experiment in order to evaluate the clas-sification performances of several features features areextracted by feature extraction methods their combined fea-tures are entered into an SVM and their classification perfor-mances are then measured There are two kinds of featuresused in the second experiment First appearance features areextracted by PCA + LDA and statistical features are alsoextracted by sparseness and kurtosis The classification per-formances resulted from combining these features are shownin Table 10 We can confirm that the performance was im-proved by combining the appearance features by PCA +
LDA and the statistical features such as the sparseness andkurtosis of the histogram from the eye-edge image
Table 11 shows the total performance of the proposedeye-statesndashdetection method with database 2 the total test-ing data As shown in Table 11 our proposed eye-statesndashdetection method works well in both daytime and nighttimeand also for drivers wearing eyeglasses or sunglasses Fi-nally we obtained results that are 145 and 291 for type Iand type II errors respectively
Some qualitative results of the proposed eye-detectionand eye-statesndashdetection method are shown in Figs 18 and19 The proposed method was robust to image variationscaused by sunlight eyeglasses sunglasses blinking mouthmovement and specular reflection on glasses Here the openeye was marked as a circle and the closed eye was marked asa rectangle The eye region is set in proportion to the detectedface region and the average size of the eye region is 40times26pixels
323 Results of measuring the inattention levelIn the driver-monitoring system it is very important to ensurethat a driver is paying adequate attention to the road ahead amust-see position when driving We can consider two situa-
Table 10 Accuracy of the eye states detection method when using each feature or combining multiple features
Input features
Type I error (Error rate forwhen an open eye is falselyaccepted as a closed eye)
Type II error (Error rate for when aclosed eye is falsely rejected as
an open eye)
Kurtosis 874 (6347250) 875 (70800)
Sparseness 786 (5707250) 788 (63800)
Sparsenesskurtosis
697 (5057250) 700 (56800)
PCA 393 (2857250) 400 (32800)
PCA + LDA 326 (2367250) 325 (26800)
PCA + LDAsparseness
280 (2037250) 275 (22800)
PCA + LDAkurtosis
297 (2157250) 300 (24800)
PCA + LDAsparsenesskurtosis
223 (1627250) 225 (18800)
Optical Engineering December 2011Vol 50(12)127202-17
Jo et al Vision-based method for detecting driver drowsiness and distraction
Table 11 Performance of our proposed method for eye states detection in Database 2
Time Glass type
Type I error (Error rate forwhen an open eye isfalsely accepted as a
closed eye)
Type II error (Error rate forwhen a closed eye is
falsely rejected as an openeye)
Not wearing glasses 120 (19816451) 354 (722032)
Eyeglasses 305 (2046699) 156 (161024)
Day Sunglasses 073 (283830) 112 (5447)
Subtotal 159 (43026980) 265 (933503)
Not wearing glasses 049 (6413185) 315 (621967)
Night Eyeglasses 230 (24110465) 332 (351055)
Subtotal 129 (30523650) 321 (973022)
Total 145 (73550630) 291 (1906525)
tions when a driver does not see the road ahead when drivingFirst it is a situation when the driver closes his or her eyesduring driving while drowsy The second situation is whenthe driverrsquos head is rotated when driving distractedly Bothof these situations are dangerous because the driver does notpay adequate attention to the road ahead In this paper weproposed a system to monitor these hazards simultaneouslyTwo measures PERCLOS and PERLOOK are used to detectthe drowsiness and distraction level respectively
Figure 20 shows the result of PERCLOS measurementfor drowsy sequences the state of a driver is alert for thefirst 100 s and during the remaining time the driver exhibitsdrowsy driving behavior In Fig 20 we were able to confirmthat the driver drowsiness was well detected by PERCLOSHowever if the driver exhibits distracted driving behaviorthe distracted behavior cannot be detected using the PERC-LOS measurement In Fig 21 the driver was requested to
Fig 18 Results of the proposed eye-detection and eye-statesndashdetection method on images captured during the daytime for a driverwho (a) did not wear any glasses and (b) wore sunglasses (Threevertical lines refer to the left right and center of the face)
drive normally for the first 160 s and then distractedly forthe remaining time Figure 21(a) shows the result of PER-CLOS measurement for distracted sequences In Figs 21(a)and 21(b) it is evident that distracted behaviors cannot bedetected using the PERCLOS measure alone Figure 21(a)measured by PERCLOS shows the false determination of adistracted behavior as a normal behavior Figure 21(b) mea-sured by PERLOOK shows that the driver distraction waswell detected at sim160 s
The experiments to measure the drowsiness and distrac-tion levels were executed on the image sequences in database2 For each of the subjects 36 drowsy video sequences and189 distracted video sequences were recorded during the day-time and 20 drowsy video sequences and 120 distracted videosequences were recorded during the nighttime For each ofthe drowsy video sequences about 5ndash10 min of observationwas recorded The subjects were requested to look frontally
Fig 19 Results of the proposed eye-detection and eye-statesndashdetection method on images captured during the nighttime for a driverwho (a) did not wear any glasses and (b) wore eyeglasses
Optical Engineering December 2011Vol 50(12)127202-18
Jo et al Vision-based method for detecting driver drowsiness and distraction
Fig 20 PERCLOS measurement for drowsy sequences
for 5 s and then drive normally or to drowsily drive for theremaining period For each of the distracted video sequencessim1 min of observation was recorded The subjects were re-quested to look frontally for 5 s and then drive normallyor to distractively drive for the remaining period Thus foreach subject we obtained three kinds of sequences normaldrowsy and distracted driving video sequences The experi-mental results using these video sequences are presented in
Table 13 In this experiment we achieved satisfying resultsAs shown in Table 13 the error rate of falsely recognizinga drowsy state or a distracted state as a normal state is 0while the error rate (false alarm) of falsely recognizing anormal state as a drowsy state or a distracted state is sim2That is there was no error in detecting drowsiness or dis-traction when the driver was actually drowsy or distractedOn the other hand six cases of a false alarm occurred in nor-
Fig 21 PERCLOS and PERLOOK measurements for a distracted video sequence (a) PERCLOS and (b) PERLOOK
Optical Engineering December 2011Vol 50(12)127202-19
Jo et al Vision-based method for detecting driver drowsiness and distraction
Fig 22 ROC curves for drowsiness and distraction detection accuracy (a) drowsiness detection and (b) distraction detection
mal driving videos of sim4 h which corresponds to 1ndash2 falsealarms per hour these can be regarded as small errors Failureanalysis revealed that a normal state was falsely recognizedas a drowsy state because the eyes were recognized as closedeyes when the driver laughed for a certain amount of timeErrors related to the driverrsquos habit of blinking hisher eyesoccur frequently Thus the measured PERCLOS was largerthan that for normal drivers Because a false alarm can annoythe driver we focused on the detection of dangerous inatten-tion By changing the decision threshold value the number
of false alarms can be reduced at the expense of increasingthe error of missing true detections
Also the false alarm can be reduced using the othermethods such as facial expression recognition user-specificdriver monitoring or driving behavior information such asmonitoring vehicle speed steering movement lane keepingacceleration braking and gear changing These works wouldbe considered in the future
Figure 22 shows the ROC curve for drowsiness and dis-traction detection accuracy by thresholds PERCLOS and
Optical Engineering December 2011Vol 50(12)127202-20
Jo et al Vision-based method for detecting driver drowsiness and distraction
Fig 23 One screen shot of actual drowsy video
PERLOOK ROC curve is a graphical plot of the sensitivityor true acceptance rate versus false acceptance rate for abinary classifier system because its discrimination thresholdis varied70 For convenience when the inattentive state isfalsely accepted as the normal state we define it as false-acceptance rate (FAR) in this paper In addition when thenormal state is falsely accepted as the inattentive state we de-fine it as false-rejection rate (FRR) When the FAR and FRRare equal the common value is referred to as the equal-errorrate The true-acceptance rate indicates a value subtractingFRR from 100
We describe a comparative experiment for measuringdrowsy parameters in each actual and virtual drowsinessvideo In our test the drowsy driverndashdetection performancewas measured using the virtual drowsiness video that wasobtained when 10 people simulated drowsy driving behaviorWe used a virtual drowsiness video because it is dangerousand difficult to obtain an actual drowsiness video moreoveran open database of actual drowsiness videos is not availableThus it was necessary to compare the values of PERCLOS inthe virtual drowsiness video with those in the actual drowsi-
Table 12 Testing data to detect the drowsiness and distraction of adriver in a vehicle
Time Driver state No test videos
Normal state 189
Day Drowsy state 36
Distracted state 189
Normal state 120
Night Drowsy state 20
Distracted state 120
Total 674
ness video The actual drowsiness video shown in Fig 23was obtained when a subject was actually drowsy at dawn (ataround 400 or 500 AM) Although this video was obtainedin the laboratory the acquisition environment (the positionsof a user and the proposed device the viewing angle of thecamera etc) was similar to that in a car Figure 24 showsgraphs for PERCLOS in the actual and virtual drowsinessvideos It is easy to identify that these features of PERC-LOS are similar In the actual drowsiness video the driverbegins to falls asleep after 300 frames and the average valueof PERCLOS is sim05254 In the virtual drowsiness videothe driver begins to falls asleep after 400 frames and theaverage value of PERCLOS is sim05024 Therefore we canpredict that the drowsy driverndashdetection performance in thevirtual drowsiness video will be similar to that in the actualdrowsiness video
Because it is difficult and dangerous to obtain drowsyor distracted videos in real conditions they were not ob-tained However the 189 videos [in (daytime) normal state ofTable 12] include five videos that were obtained when userswere actually driving on an expressway In the future webelieve that it would be possible to obtain a greater number
Fig 24 Comparison between the PERCLOS values in the actual and virtual drowsiness video (a) actual drowsiness and (b) virtual drowsiness
Optical Engineering December 2011Vol 50(12)127202-21
Jo et al Vision-based method for detecting driver drowsiness and distraction
Table 13 Drowsiness and distraction detection results measured from video sequences in a vehicle
Error rates ()
Misrecognizing adrowsy state asa normal state
Misrecognizing anormal state asa drowsy state
Misrecognizing adistracted state
as a normalstate
Misrecognizing anormal state as
a distractedstate
Misrecognizing adrowsy state as
a distractedstate
Misrecognizing adistracted state
as a drowsystate
0 (056) 162 (5309) 0 (0309) 064 (2309) 179 (156) 0 (0309)
of drowsy or distracted videos in real conditions with thesupport of car manufacturers
324 Processing timeThe proposed driver-monitoring system was efficient andworked in real time The software was implemented usingVisual C + + on an Intel Pentium M processor 160 GHz500 MB RAM Although not all the code optimizationswere completed the processing times are encouraging fora real-time implementation The total processing time was31 msframe and the processing times of each step are shownin Table 14
4 ConclusionIn this study we proposed a driver-monitoring system thatcan be used for warning against driver inattention includ-ing drowsiness and distraction We proposed an algorithmthat automatically localizes the eyes determines whetherthey are opened or closed and finally judges whether thedriver is driving drowsily or distractedly This constitutes anonintrusive approach to detecting driver inattention withoutannoyance or interference in both daytime and nighttime
The framework consists of three steps The first stepinvolves eye detection and tracking In driving sequenceimages adaboost adaptive template-matching and blob-detection methods are combined to detect the eyes automat-ically Eye detection is verified using an eye-validation tech-nique based on PCA + LDA and SVM The proposed eyedetector works well when the driver closes his or her eyes orwears eyeglasses and sunglasses High detection rates wereachieved in tests carried out on 12 people in the database
Table 14 Processing time of proposed driver monitoring system
Process Processing time (msframe)
Eye adaboost 231
Adaptive template matching 07
Blob detector 12
Eye validation by using SVM 22
Total eye detection 145
Eye states detection 24
Head pose estimationa 141
Total processing time 31
aReference 39
during both daytime and nighttime as well as when wearingsunglasses or eyeglasses
The second step is a process for classifying eyes as openedor closed For this purpose appearance-based features are ex-tracted from the detected eye image by PCA + LDA andedge-based features are obtained on the basis of sparsenessand kurtosis The detected eyes are then classified as openor closed by an SVM using the combined features We con-firmed that performance of the combined system is betterthan that of a single system Experimental results revealedthat the classification error rate in the databases was lt3during both daytime and nighttime as well as when wearingsunglasses or eyeglasses
The third step is a process for measuring the drowsinessand distraction levels of the driver In this process we pro-posed a method for checking these two conditions simultane-ously Two measures PERCLOS and PERLOOK are used tocalculate the drowsiness and distraction levels respectivelyand they yield satisfactory results
In the future we plan to conduct tests with a greater num-ber of users and over longer periods of time in order to obtainactual drowsy and distracted behaviors From the viewpointof gaze estimation we need to develop a precise gaze-estimation method using both head-pose and eye-movementinformation In the drowsy driverndashdetection method facialexpression recognition must be employed to distinguisheyes closed due to fatigue from those closed due to vigorouslaughter Moreover because eye size eye blinking frequencyand driving habits vary among drivers we need to developa driver-specific monitoring system using an online trainingmethod This system will exhibit better performance if it isintegrated with other sensors such as the accelerator steeringwheel and lane-position sensor Finally an integrated driv-ing safety system will be more effective when combined witha pedestrian-recognition system and a lane-keeping supportsystem
AcknowledgmentsThis work was supported in part by Mando Corporation LtdAnd in part by the National Research Foundation of Korea(NRF) grant funded by the Korea government (MEST) (GrantNo 2011-0015321)
References1 M R Rosekind E L Co K B Gregory and D L Miller ldquoCrew
factors in flight operations XIII a survey of fatigue factors incorporateexecutive aviation operationsrdquo NASA Ames Research Cen-ter NASATM-2000-209 610 (2000)
2 Awake Consortium (IST 2000-28062) ldquoSystem for effective assess-ment of driver vigilance and warning according to traffic risk estima-
Optical Engineering December 2011Vol 50(12)127202-22
Jo et al Vision-based method for detecting driver drowsiness and distraction
tion (AWAKE)rdquo September 2001ndash2004 lthttpwwwawake-euorggt(April 16 2011)
3 US Department of Transportation ldquo2007 FARSGES an-nual report (final ed)rdquo lthttpwwwnhtsadotgovportalsitenhtsamenuitem6a6eaf83cf719ad24ec86e10dba046a0gt (April 16 2011)
4 W Wierwille L Tijerina S Kiger T Rockwell E Lauber andA Bittne ldquoFinal report supplementmdashheavy vehicle driver workloadassessmentmdashtask 4 review of workload and related researchrdquo USDOTTech Rep No DOT HS 808 467(4) (1996)
5 H Saito T Ishiwaka M Sakata and S Okabayashi ldquoApplicationsof driverrsquos line of sight to automobilesmdashwhat can driverrsquos eye tellrdquo inProc of Vehicle Navigation and Information Systems Conf Yokohamapp 21ndash26 (1994)
6 H Ueno M Kaneda and M Tsukino ldquoDevelopment of drowsiness de-tection systemrdquo in Proc of Vehicle Navigation and Information SystemsConf Yokohama pp 15ndash20 (1994)
7 S Boverie J M Leqellec and A Hirl ldquoIntelligent systems for videomonitoring of vehicle cockpitrdquo in Proc of Int Congress and Exposi-tion ITS Advanced Controls and Vehicle Navigation Systems pp 1ndash5(1998)
8 M Kaneda H Ueno and M Tsukino ldquoDevelopment of a drowsinesswarning systemrdquo in Proc of 11th Int Conf on Enhanced Safety ofVehicle Munich (1994)
9 R Onken ldquoDaisy an adaptive knowledge-based driver monitoring andwarning systemrdquo in Proc of Vehicle Navigation and Information Sys-tems Conf Yokohama pp 3ndash10 (1994)
10 T Ishii M Hirose and H Iwata ldquoAutomatic recognition of driverrsquos fa-cial expression by image analysisrdquo Journal of the Society of AutomotiveEngineers of Japan Vol 41 pp 1398ndash1403 (1987)
11 K Yammamoto and S Higuchi ldquoDevelopment of a drowsiness warningsystemrdquo Journal of the Society of Automotive Engineers of JapanVol 46 pp 127ndash133 (1992)
12 D F Dinges M Mallis G Maislin and J W Powell ldquoEval-uation of techniques for ocular measurement as an index offatigue and the basis for alertness managementrdquo Departmentof Transportation Highway Safety Publication 808 762 April(1998)
13 R Grace V E Byrne D M Bierman and J M Legrand ldquoA drowsydriver detection system for heavy vehiclesrdquo in Proceedings of Digi-tal Avionics Systems Conference 17th DASC Vol 2 pp I361ndashI368(1998)
14 D Cleveland ldquoUnobtrusive eyelid closure and visual of regard mea-surement systemrdquo Conference on Ocular Measures of Driver alertnessApril (1999)
15 J Fukuda K Adachi M Nishida and E Akutsu ldquoDevelopment ofdriverrsquos drowsiness detection technologyrdquo Toyota Tech Rev 45 34ndash40(1995)
16 J H Richardson ldquoThe development of a driver alertness monitoringsystemrdquo in Fatigue and Driving Driver Impairment Driver Fatigueand Driver Simulation L Harrtley Ed Taylor amp Francis London(1995)
17 T DrsquoOrazio M Leo C Guaragnella and A Distante ldquoA visual ap-proach for driver inattention detectionrdquo Pattern Recogn 40 2341ndash2355(2007)
18 E Murphy-Chutorian and M M Trivedi ldquoHead pose estimation incomputer vision a surveyrdquo IEEE Trans Pattern Anal Mach Intell31(4) 607ndash626 (2009)
19 D W Hansen and Q Ji ldquoIn the eye of the beholder a survey of modelsfor eyes and gazerdquo IEEE Trans Pattern Anal Mach Intell 32 478ndash500(2010)
20 A Hattori S Tokoro M Miyashita I Tanakam K Ohue and SUozumi ldquoDevelopment of forward collision warning system using thedriver behavioral informationrdquo presented at 2006 SAE World CongressDetroit Michigan (2006)
21 E Murphy-Chutorian A Doshi and M M Trivedi ldquoHead pose estima-tion for driver assistance systems a robust algorithm and experimentalevaluationrdquo in Proc of 10th Int IEEE Conf Intelligent TransportationSystems pp 709ndash714 (2007)
22 P Smith M Shah and N da Vitoria Lobo ldquoDetermining driver vi-sual attention with one camerardquo IEEE Trans Intell Transp Syst 4(4)2058ndash2218 (2003)
23 J Y Kaminski D Knaan and A Shavit ldquoSingle image face orientationand gaze detectionrdquo Mach Vis Appl 21 85ndash98 (2009)
24 J C Stutts D W Reinfurt L Staplin and E A Rodgman ldquoThe roleof driver distraction in traffic crashesrdquo AAA Foundation for TrafficSafety Washington DC (2001)
25 K Torkkola N Massey and C Wood ldquoDriver inattention detectionthrough intelligent analysis of readily available sensorsrdquo in Proc ofIEEE Conf on Intelligent Transportation Systems Washington DCpp 326ndash331 (2004)
26 G Yang Y Lin and P Bhattacharya ldquoA driver fatigue recogni-tion model using fusion of multiple featuresrdquo in Proc of IEEE IntConf on Syst Man and Cybernetics Hawaii Vol 2 pp 1777ndash1784(2005)
27 S Park and M M Trivedi ldquoDriver activity analysis for in-telligent vehicles issues and development frameworkrdquo in Proc
of IEEE Intelligent Vehicles Symp Las Vegas pp 795ndash800(2005)
28 E Vural M Cetin A Ercil G Littlewort M S Bartlett and J RMovellan ldquoDrowsy driver detection though facial movement analysisrdquoIEEE Int Conf on Computer VisionndashHuman Computer Interaction pp6ndash18 (2007)
29 M Saradadevi and P Bajaj ldquoDriver fatigue detection using mouth andyawning analysisrdquo Int J Comput Sci Netw Security 8(6) 183ndash188(2008)
30 L M Beragasa J Nuevo M A Sotelo R Barea and E LopezldquoReal-time system for monitoring driver vigilancerdquo IEEE Trans IntellTransport Syst 7(1) 1524ndash1538 (2006)
31 R Senaratne D Hardy B Vanderaa and S Halgamuge ldquoDriver fatiguedetection by fusing multiple cuesrdquo Lect Notes Comput Sci 4492 801ndash809 (2007)
32 K Kircher A Kircher and F Claezon ldquoDistraction and drowsinessmdashafield studyrdquo Tech Rep VTI (The Swedish National Road and TransportResearch Institute) (2009)
33 S J Lee J Jo H G Jung K R Park and J Kim ldquoReal-time gaze es-timator based on driverrsquos head orientation for forward collision warningsystemrdquo IEEE Trans Intell Transp Syst 12(1) 254ndash267 (2011)
34 Specification of illuminator lthttproithner-lasercommultiled_multi_tohtmlge (July 25 2011)
35 Camera (EC650) lthttpwwwpyramidimagingcomspecsProsilica700009AA-EC65020User20Manualpdfgt (August 25 2011)
36 Camera lens (ML0614) lthttpwwwphoeniximagingcomml-0614htmge (July 25 2011)
37 Narrow bandpass interference filter (NT43-148) lthttpwwwedmundopticscomonlinecatalogdisplayproductcfmproductid=3198ampPageNum=5ampSort=displayOrderampOrder=ascproductsgt (July 252011)
38 SUV (GIA motors Sportage) lthttpwwwkiacomsportageexploregt (August 25 2011)
39 Sedan (Hyundai Motors Grandeur) lthttpgrandeurhyundaicomge(August 25 2011)
40 T Ito S Mita K Kozuka T Nakano and S Yamamoto ldquoDriver blinkmeasurement by the motion picture processing and its application todrowsiness detectionrdquo in Proc of Int Conf Intelligent TransportationSystems Singapore pp 168ndash173 (2002)
41 K Ohue Y Yamada S Uozumi S Tokoro A Hattori and T HayashildquoDevelopment of a new pre-crash safety systemrdquo SAE Tech PaperSeries Doc No 2006-01-1461 (2006)
42 Specification of motion tracking device called Patriot lthttpwwwpolhemuscompolhemus_editorassetsTech20compare20with20ResolutionvsRange20graphspdfgt (February 15 2011)
43 W J Scheirer A Rocha B Heflin and T E Boult ldquoDifficult detectiona comparison of two different approaches to eye detection for uncon-strained environmentsrdquo in Proc of IEEE 3rd Int Conf on BiometricsTheory Applications and Systems pp 1ndash8 (2009)
44 C Whitelam Z Jafri and T Bourlai ldquoMultispectral eye detection apreliminary studyrdquo in Proc of 2010 Int Conf on Pattern Recognitionpp 209ndash212 (2010)
45 P Viola and M Jones ldquoRapid object detection using a boosted cascadeof simple featuresrdquo in Proc of IEEE CVPR Vol 1 pp I-511ndashI-518(2001)
46 S D Wei and S H Lai ldquoFast template matching based on normalizedcross correlation with adaptive multilevel winner updaterdquo IEEE TransImage Process 17(11) 2227ndash2235 (2008)
47 Open source of blob detection lthttpopencvwillowgaragecomwikicvBlobsLibAlgorithmgt (July 30 2011)
48 R C Gonzalez and R E Woods Digital Image Processing 2nd edpp 523ndash532 Prentice-Hall Englewood Cliffs NJ (2002)
49 G Donato M S Bartlett J C Hager P Ekman and T J SejnowskildquoClassifying facial actionsrdquo IEEE Trans Pattern Anal Mach Intell21 974ndash989 (1999)
50 P N Bellhumeur J P Hespanha and D J Kriegman ldquoEigenfaces vsfisherfaces recognition using class specific linear projectionrdquo IEEETrans Pattern Anal Mach Intell 19 711ndash720 (1997)
51 A M Martinez and A C Kak ldquoPCA versus LDArdquo IEEE Trans PatternAnal Mach Intell 23 228ndash233 (2001)
52 M Turk and A Pentland ldquoEigenfaces for recognitionrdquo J CognitiveNeuro-sci 3 71ndash86 (1991)
53 H Deng L Jin L Zhen and J Huang ldquoA new facial expressionrecognition method nased on local gabor filter bank and PCA plusLDArdquo in Proc of Int Conf on Intelligent Computing August 23ndash26Hefei China pp 6ndash7 (2005)
54 V Vapnik ldquoSupport vector estimation of functionsrdquo in StatisticalLearning Theory pp 375ndash570 Wiley Hoboken NJ (1998)
55 C Hsu C Chang and C Lin ldquoA practical guide to supportvector classificationrdquo Tech Rep Department of Computer Sci-ence and Information Engineering National Taiwan UniversityTaipei lthttpwcsieorg˜cjlinpapersguideguidepdfgt (March 23(2011)
56 L Lang and H Qi ldquoThe study of driver fatigue monitor algorithmcombined PERCLOS and AECSrdquo in Proc of Int Conf on ComputSci and Software Eng pp 349ndash352 (2008)
Optical Engineering December 2011Vol 50(12)127202-23
Jo et al Vision-based method for detecting driver drowsiness and distraction
57 L Harley T Horberry N Mabbott and G Krueger ldquoReview of fa-tigue detection and prediction technologiesrdquo National Road TransportCommission (2000)
58 R Jain R Kasturi and B G Schunck Machine Vision pp 78ndash84McGraw-Hill New York (1995)
59 P O Hoyer ldquoNon-negative matrix factorization with sparseness con-straintsrdquo J Mach Learning Res 5 1457ndash1469 (2004)
60 A Hyvarinen and E Oja ldquoIndependent component analysisrdquo NeuralNetw 13(4ndash5) 411ndash430 (2000)
61 Q Ji and X Yang ldquoReal-time eye gaze and face pose tracking formonitoring driver vigilancerdquo Real-Time Imaging 8(5) 357ndash377 (2002)
62 D F Dinges M M Mallis G Maislin and J W Powell ldquoEvaluationof techniques for ocular measurement as an index of fatigue and thebasis for alertness managementrdquo US Department of TransportationNational Highway Traffic Safety Administration DOT HS 808 762(1998)
63 Smart Eye Pro lthttpwwwsmarteyesegt (25 July 2011)64 S Kawato and J Ohya ldquoReal-time detection of nodding and head-
shaking by directly detecting and tracking the between-eyesrdquo in Procof 4th Intrsquol IEEE Conf Automatic Face and Gesture Recognitionpp 40ndash45 (2000)
65 B Ma S Shan X Chen and W Gao ldquoHead yaw estimation fromasymmetry of facial appearancerdquo IEEE Trans Syst Man Cybern PartB 38(6) 1501ndash1512 (2008)
66 P Watta S Lakshmanan and Y Hou ldquoNonparametric approaches forestimating driver poserdquo IEEE Trans Vehicular Technol 56(4) 2028ndash2041 (2007)
67 J Wu and M M Trivedi ldquoA two-stage head pose estimation frameworkand evaluationrdquo Pattern Recogn 41 1138ndash1158 (2008)
68 E Murphy-Chutorian and M M Trivedi ldquoHyHOPE hybrid head ori-entation and position estimation for vision-based driver head trackingrdquoin Proc of IEEE Intell Vehicles Symp pp 512ndash517 (2008)
69 J P Batista ldquoA real-time driver visual attention monitoring systemrdquoLect Notes Comput Sci 3522 200ndash208 (2005)
70 N K Ratha and V Govindaraju Advances in Biometrics SensorsAlgorithms and System Springer New York (2008)
Jaeik Jo received the BS in electricaland electronic engineering in 2008 fromYonsei University Seoul Korea where he iscurrently working toward the MS-PhD jointdegree His current research interests in-clude driver monitoring systems 3-D face re-construction biometrics pattern recognitionand computer vision
Sung Joo Lee received the BS in electri-cal and electronic engineering and the MSin biometric engineering in 2004 and 2006respectively from Yonsei University SeoulKorea where he received the PhD in elec-trical and electronic engineering in 2011 In2011 he joined the Mobis Co Ltd wherehe is currently an assistant research engi-neer His current research interests includemoving object detection driver monitoringsystem biometrics pattern recognition and
computer vision
Ho Gi Jung received the BE ME and PhDin electronic engineering from Yonsei Univer-sity Seoul Korea in 1995 1997 and 2008respectively He was with MANDO Corpora-tion Global RampD HQ from 1997 to April2009 He developed environmental recog-nition systems for intelligent parking assistsystem collision warning and avoidance sys-tem and active pedestrian protection sys-tem From May 2009 to February 2011 hewas with Yonsei University as a full-time re-
searcher and research professor He researched computer visionapplications for intelligent surveillance systems and biometric sys-tems Since March 2011 he has been with Hanyang University asan assistant professor He is researching recognition systems for in-telligent vehicles His interests are recognition system for intelligentvehicle next generation vehicle computer vision applications andpattern recognition applications
Kang Ryoung Park received his BS and MSin electronic engineering from Yonsei Uni-versity Seoul Korea in 1994 and 1996 re-spectively He also received his PhD in com-puter vision from the Department of Electricaland Computer Engineering Yonsei Univer-sity in 2000 He was an assistant professorin the Division of Digital Media Technologyat Sangmyung University from March 2003to February 2008 He has been an assis-tant and associate professor in the Division
of Electronics and Electrical Engineering at Dongguk University sinceMarch 2008 He is also a research member of BERC His researchinterests include computer vision image processing and biometrics
Jaihie Kim received the BS in electronic en-gineering from Yonsei University Republic ofKorea in 1979 the PhD in electrical engi-neering from the Case Western Reserve Uni-versity USA in 1984 Since 1984 he hasbeen a professor in the School of Electri-cal and Electronic Engineering Yonsei Uni-versity Currently he is the Director of theBiometric Engineering Research Center inKorea the Chairman of the Korea Biomet-ric Association a member of the National
Academy of Engineering of Korea and in 2008 he was the Presi-dent of the IEEK (Institute of Electronics Engineers of Korea) andnow an Emeritus President of the IEEK His general research inter-ests are biometrics pattern recognition and computer vision Specif-ically some of his recent research topics include touchless finger-print recognition fake fingerprint detection fake face detection 2D-to-3D face conversion face age estimationsynthesis He was theauthor of many international technical journals which could be foundat lsquohttpcherupyonseiackrrsquo
Optical Engineering December 2011Vol 50(12)127202-24
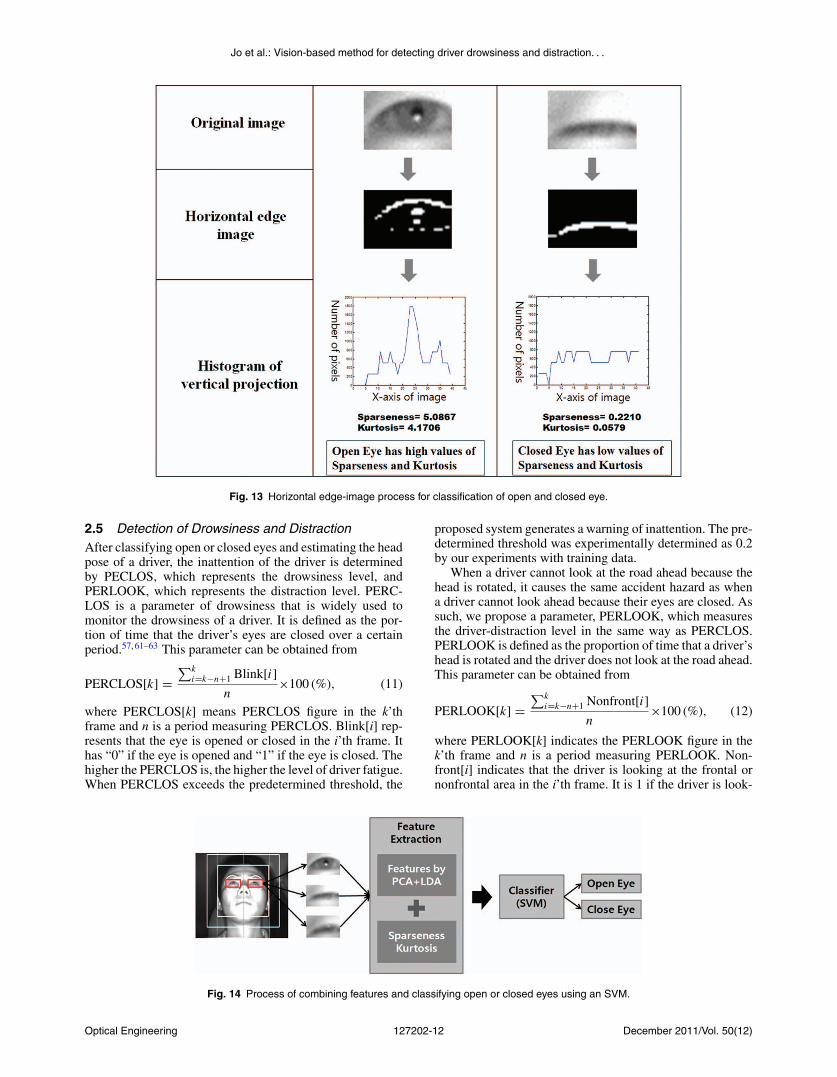
Jo et al Vision-based method for detecting driver drowsiness and distraction
Table 3 Specification of Database 1 for training
Daytime No subjects 12 persons (Male 9 Female 3 without glasses 2 with glasses 10)
No images 44197 images from 216 image sequences (12 personstimes18 gaze zones)
Nighttime No subjects 11 persons (Male 8 Female 3 without glasses 3 with glass 8)
No images 41155 images from 198 image sequences (11 personstimes18 gaze zones)
ing at the non-frontal area and 0 if the driver is looking atthe frontal area The higher the PERLOOK is the higherthe driver-distraction level is When PERLOOK is greaterthan a predetermined threshold the proposed system gener-ates a warning of inattention The predetermined thresholdwas experimentally determined as 035 by our experimentswith training data From Sec 231 if the yaw angle of adriver is greater than +15 deg or less than ndash15 deg (based onthe frontal direction) and if the corresponding accumulativetime is longer than 35 s during the unit interval of 10 s oursystem determines it as a ldquodistractionrdquo For example if theyaw angle and accumulative time when a driver looks at aGPS device or changes a CD is satisfied by this condition itis determined as a distraction
3 Experiments
31 DatabaseIn order to evaluate the proposed method we attached thedeveloped system in front of a dashboard as shown in Fig 4and we collected 162772 frames from 22 subjects Severalexperiments were carried out using images of subjects of bothsexes some of whom wore sunglasses and eyeglasses duringboth daytime and nighttime The databases were acquired ina car using an NIR camera with a resolution of 640 times 480pixels and a frame rate of 25 fps
In our databases there are two data sets for training andtesting 12 subjects were categorized into a training groupand the remaining 10 subjects were categorized into a test-ing group The images from the training group were storedin database 1 whereas those from the testing group wererecorded in database 2 Database 1 which is shown inTable 3 has also been used in a previous study33 It con-tains 85352 images (6700ndash7500 images per subject) 1090images from database 1 were used to train the eye validationprocess as shown in Fig 12 and Table 4 703 images wereused for the classification process for open and closed eyesas shown in Fig 14 and Table 5 The 85352 training imagesinclude numerous overlapped data which can cause overfit-ting of the classification hyperplane of the SVM In order tosolve this problem 1090 samples from 12 subjects were ran-domly selected and used in SVM training for eye validationThe training set for the SVM classifier in the eye-validationprocess contains 860 positive samples (eye images) and 230negative samples (noneye images) as shown in Figs 15(a)and 15(b) In addition 703 samples from 12 subjects wererandomly selected and used in SVM training for eye-statedetection The training set for the SVM classifier in the eye-statendashdetection process contains 530 positive samples (open-eye images) and 173 negative samples (closed-eye images)as shown in Figs 15(c) and 15(d)
The remaining images in database 1 were heuristicallyused for parameter optimization in eye detection (Sec 232)In conclusion the training data were only used for parameteroptimization and SVM training
Database 2 contains 77420 images (7500ndash8000 imagesper subject) from the testing group In database 2 longerimage sequences were captured for each subject in orderto test the proposed inattention-detection method The sub-jects were requested to look frontally for 5 s and to thendrive normally drowsily or distractedly for the remainingperiod Thus for each subject we obtained three types ofsequences a normal driving video a drowsy driving videoand a distracted driving video In addition the subjects whodid not wear glasses were asked to wear sunglasses in orderto capture a new sequence Similarly the subjects who woreglasses were asked to remove their glasses or wear sunglassesin order to capture a new sequence
As compared to the number of drowsy driving videos thenumber of distracted driving videos is relatively large Thereason is as follows A driver can gaze at the 12 differentpositions (1ndash5 8 11 14ndash18) described in Fig 16 hence weneed to test the performance of distraction detection for thevarious gaze directions Thus for each subject we obtainedmultiple distracted videos in which the subject gazed at the12 different positions
Table 4 Train database for eye validation
Number of eye images used
as training data in eye validation
Glass type Left eyes Right eyes
Eye(positivesamples)
Not wearingglasses
627 473
Eyeglasses 128 208
Sunglasses 105 189
Subtotal 860 870
Noneye(negativesamples)
Not wearingglasses
78 123
Eyeglasses 103 108
Sunglasses 49 79
Subtotal 230 310
Total 1090 1180
Optical Engineering December 2011Vol 50(12)127202-13
Jo et al Vision-based method for detecting driver drowsiness and distraction
Table 5 Train database for eye state detection
Number of eye images used as trainingdata for blink detection
Glass type Left eyes Right eyes
Open eye(positivesamples)
Not wearingglasses
420 440
Eyeglasses 50 70
Sunglasses 60 50
Subtotal 530 560
Closedeye(negativesamples)
Not wearingglasses
102 105
Eyeglasses 33 40
Sunglasses 38 40
Subtotal 173 185
Total 703 745
In the case of distraction a driver is not looking aheadThus the videos in which a driver gazed at 12 different posi-tions among the 18 positions shown in Fig 16 were used forthe performance evaluation of distraction detection Unlikedistraction detection only two states [ie drowsy and normal(awake)] can be considered in the case of drowsiness detec-tion Hence the number of drowsy videos obtained from each
Fig 16 Discrete gaze zones in a vehicle
subject is less than that of distracted videos The duration ofeach distracted video is sim1 min whereas that of each drowsyvideo is around 5ndash10 min Table 6 shows database 2 in detail
32 Experimental ResultsThe experimental phase consists of three parts First theeye-detection algorithm was tested using image sequencesof different people obtained in a vehicle under differenttimes and light conditions Then the algorithm for eye-state detection was tested The features used to classifyeye states were extracted from a long image sequence Fi-nally the algorithm measuring the inattention level of adriver was tested The inattention level is composed of thedrowsiness and distraction levels Drowsiness level was mea-sured by PERCLOS and distraction level was calculated byPERLOOK
321 Eye-detection resultsIn order to evaluate the performance of our eye-detectionalgorithm three experiments were carried out and comparedto each other The first was performed using only the eyeadaboost with our database 2 When it is applied to every
Fig 15 Positive and negative samples provided to the SVM classifier in the training phase (a) Eye images (b) noneye images (c) open-eyeimages and (d) closed-eye images
Optical Engineering December 2011Vol 50(12)127202-14
Jo et al Vision-based method for detecting driver drowsiness and distraction
Table 6 Specification of Database 2 for testing
No subjects 9 persons (Male 6 Female 3 without glasses 9 with glasses 4with sunglasses 5)
No images for eye detection and eye state detection 40256 images from 36 image sequences
No images used for eye detection evaluation 32365 images from 36 image sequences (7891 images wereexcluded because the subject was looking away from the roadahead)
Daytime No images used for eye state detection evaluation 30483 images from 36 image sequences (9773 images wereexcluded because the subject was looking away from the roadahead (7891) or because the eyes could not be classified as openor closed (eg narrow eyes) (1882)
No sequences used to measure inattention level 189 video sequences driving normally
36 video sequences driving drowsily
189 video sequences driving distractedly (Total number of imagesabout 239200 images from 414 image sequences)
No subjects 10 persons (Male 7 Female 3 without glasses 5 with glasses 5)
No images for eye detection and eye state detection 37164 images from 20 image sequences
No images used for eye detection evaluation 28608 images from 20 image sequences (8556 images wereexcluded because the subject was looking away from the roadahead)
Nighttime No images used for eye state detection evaluation 26672 images from 20 image sequences (10492 images wereexcluded because the subject was looking away from the roadahead (8556) and because the eyes could not be classified as beingopen or closed (eg narrow eyes) (1936))
No sequences used to measure inattention level 120 video sequences driving normally
20 video sequences driving drowsily
120 video sequences driving distractedly (Total number of imagesabout 105800 images from 260 image sequences)
sequence frame it requires a long processing time and failsto detect eyes when the head is rotated or the eyes are closedThus it resulted in unsatisfactory eye-detection performanceand a slow processing time as shown in Table 7 In the secondexperiment we combined eye-detecting methods includingadaboost adaptive template matching and blob detectionand this improved both the detection accuracy of the closed-eye and the computational performance The third experi-ment was performed by adding the eye validation to thoseused in the second experiment When the eye validation wasadded to the eye-detection algorithm the accuracy of eyedetection was improved Without any eye verifier to checkwhether the detected eye region truly contains an eye thefalsely detected noneye image may be stored in the template
and the falsely detected eye could be repeatedly detected bythe adaptive template matching from the next frame Con-sequently in the second experiment propagation error wasgenerated and the error rate was 756 in eye detectionHowever after applying the eye-validation process the errorrate was decreased from 756 to 104
The eye-detection rate is calculated as follows First im-ages looking at the frontal area are extracted from totalimages in database 2 (Table 6) and then manually dividedinto eye images [as in Fig 15(a)] and noneye images [as inFig 15(b)] Then the eye-detection rate is calculated by thenumber of images that successfully detect eyes over the totalnumber of images Table 7 presents the eye-detection rateresults and also shows that the eyes can be sim989 success-
Fig 17 Excluded narrow eye samples
Optical Engineering December 2011Vol 50(12)127202-15
Jo et al Vision-based method for detecting driver drowsiness and distraction
Table 7 Results obtained after eye detection algorithms on images in Database 2
Conditions Eye-detection rate
Time Glass type Sequences Frames Adaboost
Proposed method(without the eye
validation process)
Proposed method(with the eye
validation process)
Notwearingglasses
18 19994 7652 9254 9855
Day Eyeglasses 8 8012 6735 9235 9888
Sunglasses 10 4359 6353 9202 9891
Subtotal 36 32365 7250 9242 9868
Notwearingglasses
10 16860 7398 9258 9885
Night Eyeglasses 10 11748 7012 9205 9789
subtotal 20 28608 7239 9236 9846
Total 68 60973 7245 9239 9858
Processing time 231 ms 115 ms 145 ms
fully detected by the proposed eye-detection method regard-less of time gender and glass type Detection error is causedby misrecognition of eyeglass frames eyebrows and eyesthat are partially visible in Fig 15(b) as true eyes Howeverthis detection error is not continuous in the video sequencesbecause the eye template is reset by the eye-validation pro-cess in the next frame when the eye detector detected anoneye
322 Eye-statesndashdetection resultsIn order to evaluate the performance of determining eye sta-tus eye images from database 2 in Table 6 were manuallydivided into two classes open and closed eyes and they wereused as ground-truth data Two experiments were then per-formed The first experiment is designed to test the effectof PCA + LDA features compared to PCA features Thesecond experiment is designed to compare and analyze theclassification performance of multiple features combiningPCA + LDA sparseness and kurtosis
It is of note that narrow eyes such as those in Fig 17 wereexcluded from the performance measurement in the testingdata Because human eyes change smoothly from an open eyeto a narrow eye and then a closed eye it is difficult to classifycrisply whether a narrow eye is an open eye or a closed eye inthe middle of the change However although a narrow eye isjudged as either an open or a closed eye it does not affect thetotal performance of determining drowsy behavior becauseit is a temporary and transitional state between an open andclosed eye Therefore narrow eyes were excluded from thetesting data
The performance in eye-states detection is measured byconsidering two errors For convenience when an open eye isfalsely accepted as a closed eye we define it as a type I errorIn addition when a closed eye is falsely rejected as an openeye we define it as a type II error Thus the performance of
eye-states detection was measured by type I error and type IIerror
In the first experiment in order to detect eye states fea-tures are extracted by PCA or PCA + LDA and the featuresare then entered into SVM and finally classified into open andclosed eyes This process is the same as the eye-validationprocess explained in Fig 12 As shown in Table 8 530 framesof open eyes and 173 frames of closed eyes were used in thetraining and some of the eye images in database 2 were testedThen 12 dimensional features for the best performance wereselected The method using the PCA + LDA exhibits betterperformance in classifying eye states than the method usingonly PCA in our experiment In particular the PCA + LDAfeature is more effective than the PCA or LDA feature whenthere are fewer training samples in each class The combinedfeatures of PCA + LDA are less sensitive to different illu-minations whereas the PCA feature is sensitive to changingillumination51 53
Table 9 shows the eye-statesndashdetection results by PCA+ LDA for each dimension First in order to find the properfeature dimension yielding the best recognition rate whenfeatures were extracted solely by PCA we tested for eachdimension and obtained the 15 dimensions as the best number
Table 8 Training and testing data sets for eye states detection
Eye states included
Data set Open eye Closed eye
Train 530 173
Test 7250 800
Optical Engineering December 2011Vol 50(12)127202-16
Jo et al Vision-based method for detecting driver drowsiness and distraction
Table 9 Recognition error rates by eliminating the first one to six principal components
No eliminated principal components
1 (14 dim) 2 (13 dim) 3 (12 dim) 4 (11 dim) 5 (10 dim) 6 (9 dim)
Inputfeature
Type Ierror
Type IIerror
Type Ierror
Type IIerror
Type Ierror
Type IIerror
Type Ierror
Type IIerror
Type Ierror
Type IIerror
Type Ierror
Type IIerror
PCA +LDA
352 350 343 338 326 325 348 350 339 338 415 413
(2557250
) (28
800
) (249
7250
) (27800
) (236
7250
) (26
800
) (2527250
) (28
800
) (2467250
) (27800
) (301
7250
) (33
800
)
of feature dimensions The recognition rates of PCA featuresare 9612 and 9615 for open and closed states respectively
Previous works in face recognition50ndash52 reported that elim-inating the first one to three PCs improved performance Be-cause these PCs are sensitive to various illuminations theyshould be removed In this study we eliminate the first oneto six PCs to analyze the recognition effect for eye-statesdetection The experiment results are presented in Table 9
Table 9 demonstrates that eliminating the first one to threePCs will achieve the best performance rates in our data Thebest performances for the PCA + LDA feature 326 and325 were obtained by eliminating the first three PCsWhen removing more than four PCs the results grew worse
In the second experiment in order to evaluate the clas-sification performances of several features features areextracted by feature extraction methods their combined fea-tures are entered into an SVM and their classification perfor-mances are then measured There are two kinds of featuresused in the second experiment First appearance features areextracted by PCA + LDA and statistical features are alsoextracted by sparseness and kurtosis The classification per-formances resulted from combining these features are shownin Table 10 We can confirm that the performance was im-proved by combining the appearance features by PCA +
LDA and the statistical features such as the sparseness andkurtosis of the histogram from the eye-edge image
Table 11 shows the total performance of the proposedeye-statesndashdetection method with database 2 the total test-ing data As shown in Table 11 our proposed eye-statesndashdetection method works well in both daytime and nighttimeand also for drivers wearing eyeglasses or sunglasses Fi-nally we obtained results that are 145 and 291 for type Iand type II errors respectively
Some qualitative results of the proposed eye-detectionand eye-statesndashdetection method are shown in Figs 18 and19 The proposed method was robust to image variationscaused by sunlight eyeglasses sunglasses blinking mouthmovement and specular reflection on glasses Here the openeye was marked as a circle and the closed eye was marked asa rectangle The eye region is set in proportion to the detectedface region and the average size of the eye region is 40times26pixels
323 Results of measuring the inattention levelIn the driver-monitoring system it is very important to ensurethat a driver is paying adequate attention to the road ahead amust-see position when driving We can consider two situa-
Table 10 Accuracy of the eye states detection method when using each feature or combining multiple features
Input features
Type I error (Error rate forwhen an open eye is falselyaccepted as a closed eye)
Type II error (Error rate for when aclosed eye is falsely rejected as
an open eye)
Kurtosis 874 (6347250) 875 (70800)
Sparseness 786 (5707250) 788 (63800)
Sparsenesskurtosis
697 (5057250) 700 (56800)
PCA 393 (2857250) 400 (32800)
PCA + LDA 326 (2367250) 325 (26800)
PCA + LDAsparseness
280 (2037250) 275 (22800)
PCA + LDAkurtosis
297 (2157250) 300 (24800)
PCA + LDAsparsenesskurtosis
223 (1627250) 225 (18800)
Optical Engineering December 2011Vol 50(12)127202-17
Jo et al Vision-based method for detecting driver drowsiness and distraction
Table 11 Performance of our proposed method for eye states detection in Database 2
Time Glass type
Type I error (Error rate forwhen an open eye isfalsely accepted as a
closed eye)
Type II error (Error rate forwhen a closed eye is
falsely rejected as an openeye)
Not wearing glasses 120 (19816451) 354 (722032)
Eyeglasses 305 (2046699) 156 (161024)
Day Sunglasses 073 (283830) 112 (5447)
Subtotal 159 (43026980) 265 (933503)
Not wearing glasses 049 (6413185) 315 (621967)
Night Eyeglasses 230 (24110465) 332 (351055)
Subtotal 129 (30523650) 321 (973022)
Total 145 (73550630) 291 (1906525)
tions when a driver does not see the road ahead when drivingFirst it is a situation when the driver closes his or her eyesduring driving while drowsy The second situation is whenthe driverrsquos head is rotated when driving distractedly Bothof these situations are dangerous because the driver does notpay adequate attention to the road ahead In this paper weproposed a system to monitor these hazards simultaneouslyTwo measures PERCLOS and PERLOOK are used to detectthe drowsiness and distraction level respectively
Figure 20 shows the result of PERCLOS measurementfor drowsy sequences the state of a driver is alert for thefirst 100 s and during the remaining time the driver exhibitsdrowsy driving behavior In Fig 20 we were able to confirmthat the driver drowsiness was well detected by PERCLOSHowever if the driver exhibits distracted driving behaviorthe distracted behavior cannot be detected using the PERC-LOS measurement In Fig 21 the driver was requested to
Fig 18 Results of the proposed eye-detection and eye-statesndashdetection method on images captured during the daytime for a driverwho (a) did not wear any glasses and (b) wore sunglasses (Threevertical lines refer to the left right and center of the face)
drive normally for the first 160 s and then distractedly forthe remaining time Figure 21(a) shows the result of PER-CLOS measurement for distracted sequences In Figs 21(a)and 21(b) it is evident that distracted behaviors cannot bedetected using the PERCLOS measure alone Figure 21(a)measured by PERCLOS shows the false determination of adistracted behavior as a normal behavior Figure 21(b) mea-sured by PERLOOK shows that the driver distraction waswell detected at sim160 s
The experiments to measure the drowsiness and distrac-tion levels were executed on the image sequences in database2 For each of the subjects 36 drowsy video sequences and189 distracted video sequences were recorded during the day-time and 20 drowsy video sequences and 120 distracted videosequences were recorded during the nighttime For each ofthe drowsy video sequences about 5ndash10 min of observationwas recorded The subjects were requested to look frontally
Fig 19 Results of the proposed eye-detection and eye-statesndashdetection method on images captured during the nighttime for a driverwho (a) did not wear any glasses and (b) wore eyeglasses
Optical Engineering December 2011Vol 50(12)127202-18
Jo et al Vision-based method for detecting driver drowsiness and distraction
Fig 20 PERCLOS measurement for drowsy sequences
for 5 s and then drive normally or to drowsily drive for theremaining period For each of the distracted video sequencessim1 min of observation was recorded The subjects were re-quested to look frontally for 5 s and then drive normallyor to distractively drive for the remaining period Thus foreach subject we obtained three kinds of sequences normaldrowsy and distracted driving video sequences The experi-mental results using these video sequences are presented in
Table 13 In this experiment we achieved satisfying resultsAs shown in Table 13 the error rate of falsely recognizinga drowsy state or a distracted state as a normal state is 0while the error rate (false alarm) of falsely recognizing anormal state as a drowsy state or a distracted state is sim2That is there was no error in detecting drowsiness or dis-traction when the driver was actually drowsy or distractedOn the other hand six cases of a false alarm occurred in nor-
Fig 21 PERCLOS and PERLOOK measurements for a distracted video sequence (a) PERCLOS and (b) PERLOOK
Optical Engineering December 2011Vol 50(12)127202-19
Jo et al Vision-based method for detecting driver drowsiness and distraction
Fig 22 ROC curves for drowsiness and distraction detection accuracy (a) drowsiness detection and (b) distraction detection
mal driving videos of sim4 h which corresponds to 1ndash2 falsealarms per hour these can be regarded as small errors Failureanalysis revealed that a normal state was falsely recognizedas a drowsy state because the eyes were recognized as closedeyes when the driver laughed for a certain amount of timeErrors related to the driverrsquos habit of blinking hisher eyesoccur frequently Thus the measured PERCLOS was largerthan that for normal drivers Because a false alarm can annoythe driver we focused on the detection of dangerous inatten-tion By changing the decision threshold value the number
of false alarms can be reduced at the expense of increasingthe error of missing true detections
Also the false alarm can be reduced using the othermethods such as facial expression recognition user-specificdriver monitoring or driving behavior information such asmonitoring vehicle speed steering movement lane keepingacceleration braking and gear changing These works wouldbe considered in the future
Figure 22 shows the ROC curve for drowsiness and dis-traction detection accuracy by thresholds PERCLOS and
Optical Engineering December 2011Vol 50(12)127202-20
Jo et al Vision-based method for detecting driver drowsiness and distraction
Fig 23 One screen shot of actual drowsy video
PERLOOK ROC curve is a graphical plot of the sensitivityor true acceptance rate versus false acceptance rate for abinary classifier system because its discrimination thresholdis varied70 For convenience when the inattentive state isfalsely accepted as the normal state we define it as false-acceptance rate (FAR) in this paper In addition when thenormal state is falsely accepted as the inattentive state we de-fine it as false-rejection rate (FRR) When the FAR and FRRare equal the common value is referred to as the equal-errorrate The true-acceptance rate indicates a value subtractingFRR from 100
We describe a comparative experiment for measuringdrowsy parameters in each actual and virtual drowsinessvideo In our test the drowsy driverndashdetection performancewas measured using the virtual drowsiness video that wasobtained when 10 people simulated drowsy driving behaviorWe used a virtual drowsiness video because it is dangerousand difficult to obtain an actual drowsiness video moreoveran open database of actual drowsiness videos is not availableThus it was necessary to compare the values of PERCLOS inthe virtual drowsiness video with those in the actual drowsi-
Table 12 Testing data to detect the drowsiness and distraction of adriver in a vehicle
Time Driver state No test videos
Normal state 189
Day Drowsy state 36
Distracted state 189
Normal state 120
Night Drowsy state 20
Distracted state 120
Total 674
ness video The actual drowsiness video shown in Fig 23was obtained when a subject was actually drowsy at dawn (ataround 400 or 500 AM) Although this video was obtainedin the laboratory the acquisition environment (the positionsof a user and the proposed device the viewing angle of thecamera etc) was similar to that in a car Figure 24 showsgraphs for PERCLOS in the actual and virtual drowsinessvideos It is easy to identify that these features of PERC-LOS are similar In the actual drowsiness video the driverbegins to falls asleep after 300 frames and the average valueof PERCLOS is sim05254 In the virtual drowsiness videothe driver begins to falls asleep after 400 frames and theaverage value of PERCLOS is sim05024 Therefore we canpredict that the drowsy driverndashdetection performance in thevirtual drowsiness video will be similar to that in the actualdrowsiness video
Because it is difficult and dangerous to obtain drowsyor distracted videos in real conditions they were not ob-tained However the 189 videos [in (daytime) normal state ofTable 12] include five videos that were obtained when userswere actually driving on an expressway In the future webelieve that it would be possible to obtain a greater number
Fig 24 Comparison between the PERCLOS values in the actual and virtual drowsiness video (a) actual drowsiness and (b) virtual drowsiness
Optical Engineering December 2011Vol 50(12)127202-21
Jo et al Vision-based method for detecting driver drowsiness and distraction
Table 13 Drowsiness and distraction detection results measured from video sequences in a vehicle
Error rates ()
Misrecognizing adrowsy state asa normal state
Misrecognizing anormal state asa drowsy state
Misrecognizing adistracted state
as a normalstate
Misrecognizing anormal state as
a distractedstate
Misrecognizing adrowsy state as
a distractedstate
Misrecognizing adistracted state
as a drowsystate
0 (056) 162 (5309) 0 (0309) 064 (2309) 179 (156) 0 (0309)
of drowsy or distracted videos in real conditions with thesupport of car manufacturers
324 Processing timeThe proposed driver-monitoring system was efficient andworked in real time The software was implemented usingVisual C + + on an Intel Pentium M processor 160 GHz500 MB RAM Although not all the code optimizationswere completed the processing times are encouraging fora real-time implementation The total processing time was31 msframe and the processing times of each step are shownin Table 14
4 ConclusionIn this study we proposed a driver-monitoring system thatcan be used for warning against driver inattention includ-ing drowsiness and distraction We proposed an algorithmthat automatically localizes the eyes determines whetherthey are opened or closed and finally judges whether thedriver is driving drowsily or distractedly This constitutes anonintrusive approach to detecting driver inattention withoutannoyance or interference in both daytime and nighttime
The framework consists of three steps The first stepinvolves eye detection and tracking In driving sequenceimages adaboost adaptive template-matching and blob-detection methods are combined to detect the eyes automat-ically Eye detection is verified using an eye-validation tech-nique based on PCA + LDA and SVM The proposed eyedetector works well when the driver closes his or her eyes orwears eyeglasses and sunglasses High detection rates wereachieved in tests carried out on 12 people in the database
Table 14 Processing time of proposed driver monitoring system
Process Processing time (msframe)
Eye adaboost 231
Adaptive template matching 07
Blob detector 12
Eye validation by using SVM 22
Total eye detection 145
Eye states detection 24
Head pose estimationa 141
Total processing time 31
aReference 39
during both daytime and nighttime as well as when wearingsunglasses or eyeglasses
The second step is a process for classifying eyes as openedor closed For this purpose appearance-based features are ex-tracted from the detected eye image by PCA + LDA andedge-based features are obtained on the basis of sparsenessand kurtosis The detected eyes are then classified as openor closed by an SVM using the combined features We con-firmed that performance of the combined system is betterthan that of a single system Experimental results revealedthat the classification error rate in the databases was lt3during both daytime and nighttime as well as when wearingsunglasses or eyeglasses
The third step is a process for measuring the drowsinessand distraction levels of the driver In this process we pro-posed a method for checking these two conditions simultane-ously Two measures PERCLOS and PERLOOK are used tocalculate the drowsiness and distraction levels respectivelyand they yield satisfactory results
In the future we plan to conduct tests with a greater num-ber of users and over longer periods of time in order to obtainactual drowsy and distracted behaviors From the viewpointof gaze estimation we need to develop a precise gaze-estimation method using both head-pose and eye-movementinformation In the drowsy driverndashdetection method facialexpression recognition must be employed to distinguisheyes closed due to fatigue from those closed due to vigorouslaughter Moreover because eye size eye blinking frequencyand driving habits vary among drivers we need to developa driver-specific monitoring system using an online trainingmethod This system will exhibit better performance if it isintegrated with other sensors such as the accelerator steeringwheel and lane-position sensor Finally an integrated driv-ing safety system will be more effective when combined witha pedestrian-recognition system and a lane-keeping supportsystem
AcknowledgmentsThis work was supported in part by Mando Corporation LtdAnd in part by the National Research Foundation of Korea(NRF) grant funded by the Korea government (MEST) (GrantNo 2011-0015321)
References1 M R Rosekind E L Co K B Gregory and D L Miller ldquoCrew
factors in flight operations XIII a survey of fatigue factors incorporateexecutive aviation operationsrdquo NASA Ames Research Cen-ter NASATM-2000-209 610 (2000)
2 Awake Consortium (IST 2000-28062) ldquoSystem for effective assess-ment of driver vigilance and warning according to traffic risk estima-
Optical Engineering December 2011Vol 50(12)127202-22
Jo et al Vision-based method for detecting driver drowsiness and distraction
tion (AWAKE)rdquo September 2001ndash2004 lthttpwwwawake-euorggt(April 16 2011)
3 US Department of Transportation ldquo2007 FARSGES an-nual report (final ed)rdquo lthttpwwwnhtsadotgovportalsitenhtsamenuitem6a6eaf83cf719ad24ec86e10dba046a0gt (April 16 2011)
4 W Wierwille L Tijerina S Kiger T Rockwell E Lauber andA Bittne ldquoFinal report supplementmdashheavy vehicle driver workloadassessmentmdashtask 4 review of workload and related researchrdquo USDOTTech Rep No DOT HS 808 467(4) (1996)
5 H Saito T Ishiwaka M Sakata and S Okabayashi ldquoApplicationsof driverrsquos line of sight to automobilesmdashwhat can driverrsquos eye tellrdquo inProc of Vehicle Navigation and Information Systems Conf Yokohamapp 21ndash26 (1994)
6 H Ueno M Kaneda and M Tsukino ldquoDevelopment of drowsiness de-tection systemrdquo in Proc of Vehicle Navigation and Information SystemsConf Yokohama pp 15ndash20 (1994)
7 S Boverie J M Leqellec and A Hirl ldquoIntelligent systems for videomonitoring of vehicle cockpitrdquo in Proc of Int Congress and Exposi-tion ITS Advanced Controls and Vehicle Navigation Systems pp 1ndash5(1998)
8 M Kaneda H Ueno and M Tsukino ldquoDevelopment of a drowsinesswarning systemrdquo in Proc of 11th Int Conf on Enhanced Safety ofVehicle Munich (1994)
9 R Onken ldquoDaisy an adaptive knowledge-based driver monitoring andwarning systemrdquo in Proc of Vehicle Navigation and Information Sys-tems Conf Yokohama pp 3ndash10 (1994)
10 T Ishii M Hirose and H Iwata ldquoAutomatic recognition of driverrsquos fa-cial expression by image analysisrdquo Journal of the Society of AutomotiveEngineers of Japan Vol 41 pp 1398ndash1403 (1987)
11 K Yammamoto and S Higuchi ldquoDevelopment of a drowsiness warningsystemrdquo Journal of the Society of Automotive Engineers of JapanVol 46 pp 127ndash133 (1992)
12 D F Dinges M Mallis G Maislin and J W Powell ldquoEval-uation of techniques for ocular measurement as an index offatigue and the basis for alertness managementrdquo Departmentof Transportation Highway Safety Publication 808 762 April(1998)
13 R Grace V E Byrne D M Bierman and J M Legrand ldquoA drowsydriver detection system for heavy vehiclesrdquo in Proceedings of Digi-tal Avionics Systems Conference 17th DASC Vol 2 pp I361ndashI368(1998)
14 D Cleveland ldquoUnobtrusive eyelid closure and visual of regard mea-surement systemrdquo Conference on Ocular Measures of Driver alertnessApril (1999)
15 J Fukuda K Adachi M Nishida and E Akutsu ldquoDevelopment ofdriverrsquos drowsiness detection technologyrdquo Toyota Tech Rev 45 34ndash40(1995)
16 J H Richardson ldquoThe development of a driver alertness monitoringsystemrdquo in Fatigue and Driving Driver Impairment Driver Fatigueand Driver Simulation L Harrtley Ed Taylor amp Francis London(1995)
17 T DrsquoOrazio M Leo C Guaragnella and A Distante ldquoA visual ap-proach for driver inattention detectionrdquo Pattern Recogn 40 2341ndash2355(2007)
18 E Murphy-Chutorian and M M Trivedi ldquoHead pose estimation incomputer vision a surveyrdquo IEEE Trans Pattern Anal Mach Intell31(4) 607ndash626 (2009)
19 D W Hansen and Q Ji ldquoIn the eye of the beholder a survey of modelsfor eyes and gazerdquo IEEE Trans Pattern Anal Mach Intell 32 478ndash500(2010)
20 A Hattori S Tokoro M Miyashita I Tanakam K Ohue and SUozumi ldquoDevelopment of forward collision warning system using thedriver behavioral informationrdquo presented at 2006 SAE World CongressDetroit Michigan (2006)
21 E Murphy-Chutorian A Doshi and M M Trivedi ldquoHead pose estima-tion for driver assistance systems a robust algorithm and experimentalevaluationrdquo in Proc of 10th Int IEEE Conf Intelligent TransportationSystems pp 709ndash714 (2007)
22 P Smith M Shah and N da Vitoria Lobo ldquoDetermining driver vi-sual attention with one camerardquo IEEE Trans Intell Transp Syst 4(4)2058ndash2218 (2003)
23 J Y Kaminski D Knaan and A Shavit ldquoSingle image face orientationand gaze detectionrdquo Mach Vis Appl 21 85ndash98 (2009)
24 J C Stutts D W Reinfurt L Staplin and E A Rodgman ldquoThe roleof driver distraction in traffic crashesrdquo AAA Foundation for TrafficSafety Washington DC (2001)
25 K Torkkola N Massey and C Wood ldquoDriver inattention detectionthrough intelligent analysis of readily available sensorsrdquo in Proc ofIEEE Conf on Intelligent Transportation Systems Washington DCpp 326ndash331 (2004)
26 G Yang Y Lin and P Bhattacharya ldquoA driver fatigue recogni-tion model using fusion of multiple featuresrdquo in Proc of IEEE IntConf on Syst Man and Cybernetics Hawaii Vol 2 pp 1777ndash1784(2005)
27 S Park and M M Trivedi ldquoDriver activity analysis for in-telligent vehicles issues and development frameworkrdquo in Proc
of IEEE Intelligent Vehicles Symp Las Vegas pp 795ndash800(2005)
28 E Vural M Cetin A Ercil G Littlewort M S Bartlett and J RMovellan ldquoDrowsy driver detection though facial movement analysisrdquoIEEE Int Conf on Computer VisionndashHuman Computer Interaction pp6ndash18 (2007)
29 M Saradadevi and P Bajaj ldquoDriver fatigue detection using mouth andyawning analysisrdquo Int J Comput Sci Netw Security 8(6) 183ndash188(2008)
30 L M Beragasa J Nuevo M A Sotelo R Barea and E LopezldquoReal-time system for monitoring driver vigilancerdquo IEEE Trans IntellTransport Syst 7(1) 1524ndash1538 (2006)
31 R Senaratne D Hardy B Vanderaa and S Halgamuge ldquoDriver fatiguedetection by fusing multiple cuesrdquo Lect Notes Comput Sci 4492 801ndash809 (2007)
32 K Kircher A Kircher and F Claezon ldquoDistraction and drowsinessmdashafield studyrdquo Tech Rep VTI (The Swedish National Road and TransportResearch Institute) (2009)
33 S J Lee J Jo H G Jung K R Park and J Kim ldquoReal-time gaze es-timator based on driverrsquos head orientation for forward collision warningsystemrdquo IEEE Trans Intell Transp Syst 12(1) 254ndash267 (2011)
34 Specification of illuminator lthttproithner-lasercommultiled_multi_tohtmlge (July 25 2011)
35 Camera (EC650) lthttpwwwpyramidimagingcomspecsProsilica700009AA-EC65020User20Manualpdfgt (August 25 2011)
36 Camera lens (ML0614) lthttpwwwphoeniximagingcomml-0614htmge (July 25 2011)
37 Narrow bandpass interference filter (NT43-148) lthttpwwwedmundopticscomonlinecatalogdisplayproductcfmproductid=3198ampPageNum=5ampSort=displayOrderampOrder=ascproductsgt (July 252011)
38 SUV (GIA motors Sportage) lthttpwwwkiacomsportageexploregt (August 25 2011)
39 Sedan (Hyundai Motors Grandeur) lthttpgrandeurhyundaicomge(August 25 2011)
40 T Ito S Mita K Kozuka T Nakano and S Yamamoto ldquoDriver blinkmeasurement by the motion picture processing and its application todrowsiness detectionrdquo in Proc of Int Conf Intelligent TransportationSystems Singapore pp 168ndash173 (2002)
41 K Ohue Y Yamada S Uozumi S Tokoro A Hattori and T HayashildquoDevelopment of a new pre-crash safety systemrdquo SAE Tech PaperSeries Doc No 2006-01-1461 (2006)
42 Specification of motion tracking device called Patriot lthttpwwwpolhemuscompolhemus_editorassetsTech20compare20with20ResolutionvsRange20graphspdfgt (February 15 2011)
43 W J Scheirer A Rocha B Heflin and T E Boult ldquoDifficult detectiona comparison of two different approaches to eye detection for uncon-strained environmentsrdquo in Proc of IEEE 3rd Int Conf on BiometricsTheory Applications and Systems pp 1ndash8 (2009)
44 C Whitelam Z Jafri and T Bourlai ldquoMultispectral eye detection apreliminary studyrdquo in Proc of 2010 Int Conf on Pattern Recognitionpp 209ndash212 (2010)
45 P Viola and M Jones ldquoRapid object detection using a boosted cascadeof simple featuresrdquo in Proc of IEEE CVPR Vol 1 pp I-511ndashI-518(2001)
46 S D Wei and S H Lai ldquoFast template matching based on normalizedcross correlation with adaptive multilevel winner updaterdquo IEEE TransImage Process 17(11) 2227ndash2235 (2008)
47 Open source of blob detection lthttpopencvwillowgaragecomwikicvBlobsLibAlgorithmgt (July 30 2011)
48 R C Gonzalez and R E Woods Digital Image Processing 2nd edpp 523ndash532 Prentice-Hall Englewood Cliffs NJ (2002)
49 G Donato M S Bartlett J C Hager P Ekman and T J SejnowskildquoClassifying facial actionsrdquo IEEE Trans Pattern Anal Mach Intell21 974ndash989 (1999)
50 P N Bellhumeur J P Hespanha and D J Kriegman ldquoEigenfaces vsfisherfaces recognition using class specific linear projectionrdquo IEEETrans Pattern Anal Mach Intell 19 711ndash720 (1997)
51 A M Martinez and A C Kak ldquoPCA versus LDArdquo IEEE Trans PatternAnal Mach Intell 23 228ndash233 (2001)
52 M Turk and A Pentland ldquoEigenfaces for recognitionrdquo J CognitiveNeuro-sci 3 71ndash86 (1991)
53 H Deng L Jin L Zhen and J Huang ldquoA new facial expressionrecognition method nased on local gabor filter bank and PCA plusLDArdquo in Proc of Int Conf on Intelligent Computing August 23ndash26Hefei China pp 6ndash7 (2005)
54 V Vapnik ldquoSupport vector estimation of functionsrdquo in StatisticalLearning Theory pp 375ndash570 Wiley Hoboken NJ (1998)
55 C Hsu C Chang and C Lin ldquoA practical guide to supportvector classificationrdquo Tech Rep Department of Computer Sci-ence and Information Engineering National Taiwan UniversityTaipei lthttpwcsieorg˜cjlinpapersguideguidepdfgt (March 23(2011)
56 L Lang and H Qi ldquoThe study of driver fatigue monitor algorithmcombined PERCLOS and AECSrdquo in Proc of Int Conf on ComputSci and Software Eng pp 349ndash352 (2008)
Optical Engineering December 2011Vol 50(12)127202-23
Jo et al Vision-based method for detecting driver drowsiness and distraction
57 L Harley T Horberry N Mabbott and G Krueger ldquoReview of fa-tigue detection and prediction technologiesrdquo National Road TransportCommission (2000)
58 R Jain R Kasturi and B G Schunck Machine Vision pp 78ndash84McGraw-Hill New York (1995)
59 P O Hoyer ldquoNon-negative matrix factorization with sparseness con-straintsrdquo J Mach Learning Res 5 1457ndash1469 (2004)
60 A Hyvarinen and E Oja ldquoIndependent component analysisrdquo NeuralNetw 13(4ndash5) 411ndash430 (2000)
61 Q Ji and X Yang ldquoReal-time eye gaze and face pose tracking formonitoring driver vigilancerdquo Real-Time Imaging 8(5) 357ndash377 (2002)
62 D F Dinges M M Mallis G Maislin and J W Powell ldquoEvaluationof techniques for ocular measurement as an index of fatigue and thebasis for alertness managementrdquo US Department of TransportationNational Highway Traffic Safety Administration DOT HS 808 762(1998)
63 Smart Eye Pro lthttpwwwsmarteyesegt (25 July 2011)64 S Kawato and J Ohya ldquoReal-time detection of nodding and head-
shaking by directly detecting and tracking the between-eyesrdquo in Procof 4th Intrsquol IEEE Conf Automatic Face and Gesture Recognitionpp 40ndash45 (2000)
65 B Ma S Shan X Chen and W Gao ldquoHead yaw estimation fromasymmetry of facial appearancerdquo IEEE Trans Syst Man Cybern PartB 38(6) 1501ndash1512 (2008)
66 P Watta S Lakshmanan and Y Hou ldquoNonparametric approaches forestimating driver poserdquo IEEE Trans Vehicular Technol 56(4) 2028ndash2041 (2007)
67 J Wu and M M Trivedi ldquoA two-stage head pose estimation frameworkand evaluationrdquo Pattern Recogn 41 1138ndash1158 (2008)
68 E Murphy-Chutorian and M M Trivedi ldquoHyHOPE hybrid head ori-entation and position estimation for vision-based driver head trackingrdquoin Proc of IEEE Intell Vehicles Symp pp 512ndash517 (2008)
69 J P Batista ldquoA real-time driver visual attention monitoring systemrdquoLect Notes Comput Sci 3522 200ndash208 (2005)
70 N K Ratha and V Govindaraju Advances in Biometrics SensorsAlgorithms and System Springer New York (2008)
Jaeik Jo received the BS in electricaland electronic engineering in 2008 fromYonsei University Seoul Korea where he iscurrently working toward the MS-PhD jointdegree His current research interests in-clude driver monitoring systems 3-D face re-construction biometrics pattern recognitionand computer vision
Sung Joo Lee received the BS in electri-cal and electronic engineering and the MSin biometric engineering in 2004 and 2006respectively from Yonsei University SeoulKorea where he received the PhD in elec-trical and electronic engineering in 2011 In2011 he joined the Mobis Co Ltd wherehe is currently an assistant research engi-neer His current research interests includemoving object detection driver monitoringsystem biometrics pattern recognition and
computer vision
Ho Gi Jung received the BE ME and PhDin electronic engineering from Yonsei Univer-sity Seoul Korea in 1995 1997 and 2008respectively He was with MANDO Corpora-tion Global RampD HQ from 1997 to April2009 He developed environmental recog-nition systems for intelligent parking assistsystem collision warning and avoidance sys-tem and active pedestrian protection sys-tem From May 2009 to February 2011 hewas with Yonsei University as a full-time re-
searcher and research professor He researched computer visionapplications for intelligent surveillance systems and biometric sys-tems Since March 2011 he has been with Hanyang University asan assistant professor He is researching recognition systems for in-telligent vehicles His interests are recognition system for intelligentvehicle next generation vehicle computer vision applications andpattern recognition applications
Kang Ryoung Park received his BS and MSin electronic engineering from Yonsei Uni-versity Seoul Korea in 1994 and 1996 re-spectively He also received his PhD in com-puter vision from the Department of Electricaland Computer Engineering Yonsei Univer-sity in 2000 He was an assistant professorin the Division of Digital Media Technologyat Sangmyung University from March 2003to February 2008 He has been an assis-tant and associate professor in the Division
of Electronics and Electrical Engineering at Dongguk University sinceMarch 2008 He is also a research member of BERC His researchinterests include computer vision image processing and biometrics
Jaihie Kim received the BS in electronic en-gineering from Yonsei University Republic ofKorea in 1979 the PhD in electrical engi-neering from the Case Western Reserve Uni-versity USA in 1984 Since 1984 he hasbeen a professor in the School of Electri-cal and Electronic Engineering Yonsei Uni-versity Currently he is the Director of theBiometric Engineering Research Center inKorea the Chairman of the Korea Biomet-ric Association a member of the National
Academy of Engineering of Korea and in 2008 he was the Presi-dent of the IEEK (Institute of Electronics Engineers of Korea) andnow an Emeritus President of the IEEK His general research inter-ests are biometrics pattern recognition and computer vision Specif-ically some of his recent research topics include touchless finger-print recognition fake fingerprint detection fake face detection 2D-to-3D face conversion face age estimationsynthesis He was theauthor of many international technical journals which could be foundat lsquohttpcherupyonseiackrrsquo
Optical Engineering December 2011Vol 50(12)127202-24
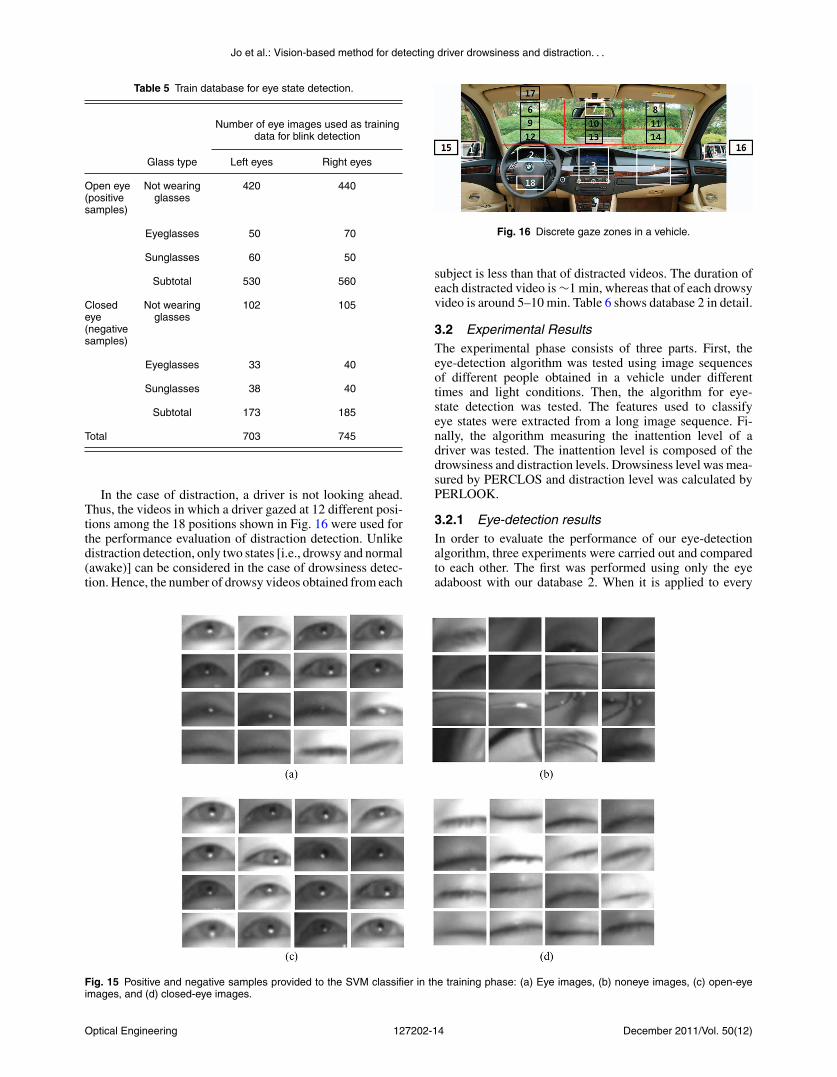
Jo et al Vision-based method for detecting driver drowsiness and distraction
Table 5 Train database for eye state detection
Number of eye images used as trainingdata for blink detection
Glass type Left eyes Right eyes
Open eye(positivesamples)
Not wearingglasses
420 440
Eyeglasses 50 70
Sunglasses 60 50
Subtotal 530 560
Closedeye(negativesamples)
Not wearingglasses
102 105
Eyeglasses 33 40
Sunglasses 38 40
Subtotal 173 185
Total 703 745
In the case of distraction a driver is not looking aheadThus the videos in which a driver gazed at 12 different posi-tions among the 18 positions shown in Fig 16 were used forthe performance evaluation of distraction detection Unlikedistraction detection only two states [ie drowsy and normal(awake)] can be considered in the case of drowsiness detec-tion Hence the number of drowsy videos obtained from each
Fig 16 Discrete gaze zones in a vehicle
subject is less than that of distracted videos The duration ofeach distracted video is sim1 min whereas that of each drowsyvideo is around 5ndash10 min Table 6 shows database 2 in detail
32 Experimental ResultsThe experimental phase consists of three parts First theeye-detection algorithm was tested using image sequencesof different people obtained in a vehicle under differenttimes and light conditions Then the algorithm for eye-state detection was tested The features used to classifyeye states were extracted from a long image sequence Fi-nally the algorithm measuring the inattention level of adriver was tested The inattention level is composed of thedrowsiness and distraction levels Drowsiness level was mea-sured by PERCLOS and distraction level was calculated byPERLOOK
321 Eye-detection resultsIn order to evaluate the performance of our eye-detectionalgorithm three experiments were carried out and comparedto each other The first was performed using only the eyeadaboost with our database 2 When it is applied to every
Fig 15 Positive and negative samples provided to the SVM classifier in the training phase (a) Eye images (b) noneye images (c) open-eyeimages and (d) closed-eye images
Optical Engineering December 2011Vol 50(12)127202-14
Jo et al Vision-based method for detecting driver drowsiness and distraction
Table 6 Specification of Database 2 for testing
No subjects 9 persons (Male 6 Female 3 without glasses 9 with glasses 4with sunglasses 5)
No images for eye detection and eye state detection 40256 images from 36 image sequences
No images used for eye detection evaluation 32365 images from 36 image sequences (7891 images wereexcluded because the subject was looking away from the roadahead)
Daytime No images used for eye state detection evaluation 30483 images from 36 image sequences (9773 images wereexcluded because the subject was looking away from the roadahead (7891) or because the eyes could not be classified as openor closed (eg narrow eyes) (1882)
No sequences used to measure inattention level 189 video sequences driving normally
36 video sequences driving drowsily
189 video sequences driving distractedly (Total number of imagesabout 239200 images from 414 image sequences)
No subjects 10 persons (Male 7 Female 3 without glasses 5 with glasses 5)
No images for eye detection and eye state detection 37164 images from 20 image sequences
No images used for eye detection evaluation 28608 images from 20 image sequences (8556 images wereexcluded because the subject was looking away from the roadahead)
Nighttime No images used for eye state detection evaluation 26672 images from 20 image sequences (10492 images wereexcluded because the subject was looking away from the roadahead (8556) and because the eyes could not be classified as beingopen or closed (eg narrow eyes) (1936))
No sequences used to measure inattention level 120 video sequences driving normally
20 video sequences driving drowsily
120 video sequences driving distractedly (Total number of imagesabout 105800 images from 260 image sequences)
sequence frame it requires a long processing time and failsto detect eyes when the head is rotated or the eyes are closedThus it resulted in unsatisfactory eye-detection performanceand a slow processing time as shown in Table 7 In the secondexperiment we combined eye-detecting methods includingadaboost adaptive template matching and blob detectionand this improved both the detection accuracy of the closed-eye and the computational performance The third experi-ment was performed by adding the eye validation to thoseused in the second experiment When the eye validation wasadded to the eye-detection algorithm the accuracy of eyedetection was improved Without any eye verifier to checkwhether the detected eye region truly contains an eye thefalsely detected noneye image may be stored in the template
and the falsely detected eye could be repeatedly detected bythe adaptive template matching from the next frame Con-sequently in the second experiment propagation error wasgenerated and the error rate was 756 in eye detectionHowever after applying the eye-validation process the errorrate was decreased from 756 to 104
The eye-detection rate is calculated as follows First im-ages looking at the frontal area are extracted from totalimages in database 2 (Table 6) and then manually dividedinto eye images [as in Fig 15(a)] and noneye images [as inFig 15(b)] Then the eye-detection rate is calculated by thenumber of images that successfully detect eyes over the totalnumber of images Table 7 presents the eye-detection rateresults and also shows that the eyes can be sim989 success-
Fig 17 Excluded narrow eye samples
Optical Engineering December 2011Vol 50(12)127202-15
Jo et al Vision-based method for detecting driver drowsiness and distraction
Table 7 Results obtained after eye detection algorithms on images in Database 2
Conditions Eye-detection rate
Time Glass type Sequences Frames Adaboost
Proposed method(without the eye
validation process)
Proposed method(with the eye
validation process)
Notwearingglasses
18 19994 7652 9254 9855
Day Eyeglasses 8 8012 6735 9235 9888
Sunglasses 10 4359 6353 9202 9891
Subtotal 36 32365 7250 9242 9868
Notwearingglasses
10 16860 7398 9258 9885
Night Eyeglasses 10 11748 7012 9205 9789
subtotal 20 28608 7239 9236 9846
Total 68 60973 7245 9239 9858
Processing time 231 ms 115 ms 145 ms
fully detected by the proposed eye-detection method regard-less of time gender and glass type Detection error is causedby misrecognition of eyeglass frames eyebrows and eyesthat are partially visible in Fig 15(b) as true eyes Howeverthis detection error is not continuous in the video sequencesbecause the eye template is reset by the eye-validation pro-cess in the next frame when the eye detector detected anoneye
322 Eye-statesndashdetection resultsIn order to evaluate the performance of determining eye sta-tus eye images from database 2 in Table 6 were manuallydivided into two classes open and closed eyes and they wereused as ground-truth data Two experiments were then per-formed The first experiment is designed to test the effectof PCA + LDA features compared to PCA features Thesecond experiment is designed to compare and analyze theclassification performance of multiple features combiningPCA + LDA sparseness and kurtosis
It is of note that narrow eyes such as those in Fig 17 wereexcluded from the performance measurement in the testingdata Because human eyes change smoothly from an open eyeto a narrow eye and then a closed eye it is difficult to classifycrisply whether a narrow eye is an open eye or a closed eye inthe middle of the change However although a narrow eye isjudged as either an open or a closed eye it does not affect thetotal performance of determining drowsy behavior becauseit is a temporary and transitional state between an open andclosed eye Therefore narrow eyes were excluded from thetesting data
The performance in eye-states detection is measured byconsidering two errors For convenience when an open eye isfalsely accepted as a closed eye we define it as a type I errorIn addition when a closed eye is falsely rejected as an openeye we define it as a type II error Thus the performance of
eye-states detection was measured by type I error and type IIerror
In the first experiment in order to detect eye states fea-tures are extracted by PCA or PCA + LDA and the featuresare then entered into SVM and finally classified into open andclosed eyes This process is the same as the eye-validationprocess explained in Fig 12 As shown in Table 8 530 framesof open eyes and 173 frames of closed eyes were used in thetraining and some of the eye images in database 2 were testedThen 12 dimensional features for the best performance wereselected The method using the PCA + LDA exhibits betterperformance in classifying eye states than the method usingonly PCA in our experiment In particular the PCA + LDAfeature is more effective than the PCA or LDA feature whenthere are fewer training samples in each class The combinedfeatures of PCA + LDA are less sensitive to different illu-minations whereas the PCA feature is sensitive to changingillumination51 53
Table 9 shows the eye-statesndashdetection results by PCA+ LDA for each dimension First in order to find the properfeature dimension yielding the best recognition rate whenfeatures were extracted solely by PCA we tested for eachdimension and obtained the 15 dimensions as the best number
Table 8 Training and testing data sets for eye states detection
Eye states included
Data set Open eye Closed eye
Train 530 173
Test 7250 800
Optical Engineering December 2011Vol 50(12)127202-16
Jo et al Vision-based method for detecting driver drowsiness and distraction
Table 9 Recognition error rates by eliminating the first one to six principal components
No eliminated principal components
1 (14 dim) 2 (13 dim) 3 (12 dim) 4 (11 dim) 5 (10 dim) 6 (9 dim)
Inputfeature
Type Ierror
Type IIerror
Type Ierror
Type IIerror
Type Ierror
Type IIerror
Type Ierror
Type IIerror
Type Ierror
Type IIerror
Type Ierror
Type IIerror
PCA +LDA
352 350 343 338 326 325 348 350 339 338 415 413
(2557250
) (28
800
) (249
7250
) (27800
) (236
7250
) (26
800
) (2527250
) (28
800
) (2467250
) (27800
) (301
7250
) (33
800
)
of feature dimensions The recognition rates of PCA featuresare 9612 and 9615 for open and closed states respectively
Previous works in face recognition50ndash52 reported that elim-inating the first one to three PCs improved performance Be-cause these PCs are sensitive to various illuminations theyshould be removed In this study we eliminate the first oneto six PCs to analyze the recognition effect for eye-statesdetection The experiment results are presented in Table 9
Table 9 demonstrates that eliminating the first one to threePCs will achieve the best performance rates in our data Thebest performances for the PCA + LDA feature 326 and325 were obtained by eliminating the first three PCsWhen removing more than four PCs the results grew worse
In the second experiment in order to evaluate the clas-sification performances of several features features areextracted by feature extraction methods their combined fea-tures are entered into an SVM and their classification perfor-mances are then measured There are two kinds of featuresused in the second experiment First appearance features areextracted by PCA + LDA and statistical features are alsoextracted by sparseness and kurtosis The classification per-formances resulted from combining these features are shownin Table 10 We can confirm that the performance was im-proved by combining the appearance features by PCA +
LDA and the statistical features such as the sparseness andkurtosis of the histogram from the eye-edge image
Table 11 shows the total performance of the proposedeye-statesndashdetection method with database 2 the total test-ing data As shown in Table 11 our proposed eye-statesndashdetection method works well in both daytime and nighttimeand also for drivers wearing eyeglasses or sunglasses Fi-nally we obtained results that are 145 and 291 for type Iand type II errors respectively
Some qualitative results of the proposed eye-detectionand eye-statesndashdetection method are shown in Figs 18 and19 The proposed method was robust to image variationscaused by sunlight eyeglasses sunglasses blinking mouthmovement and specular reflection on glasses Here the openeye was marked as a circle and the closed eye was marked asa rectangle The eye region is set in proportion to the detectedface region and the average size of the eye region is 40times26pixels
323 Results of measuring the inattention levelIn the driver-monitoring system it is very important to ensurethat a driver is paying adequate attention to the road ahead amust-see position when driving We can consider two situa-
Table 10 Accuracy of the eye states detection method when using each feature or combining multiple features
Input features
Type I error (Error rate forwhen an open eye is falselyaccepted as a closed eye)
Type II error (Error rate for when aclosed eye is falsely rejected as
an open eye)
Kurtosis 874 (6347250) 875 (70800)
Sparseness 786 (5707250) 788 (63800)
Sparsenesskurtosis
697 (5057250) 700 (56800)
PCA 393 (2857250) 400 (32800)
PCA + LDA 326 (2367250) 325 (26800)
PCA + LDAsparseness
280 (2037250) 275 (22800)
PCA + LDAkurtosis
297 (2157250) 300 (24800)
PCA + LDAsparsenesskurtosis
223 (1627250) 225 (18800)
Optical Engineering December 2011Vol 50(12)127202-17
Jo et al Vision-based method for detecting driver drowsiness and distraction
Table 11 Performance of our proposed method for eye states detection in Database 2
Time Glass type
Type I error (Error rate forwhen an open eye isfalsely accepted as a
closed eye)
Type II error (Error rate forwhen a closed eye is
falsely rejected as an openeye)
Not wearing glasses 120 (19816451) 354 (722032)
Eyeglasses 305 (2046699) 156 (161024)
Day Sunglasses 073 (283830) 112 (5447)
Subtotal 159 (43026980) 265 (933503)
Not wearing glasses 049 (6413185) 315 (621967)
Night Eyeglasses 230 (24110465) 332 (351055)
Subtotal 129 (30523650) 321 (973022)
Total 145 (73550630) 291 (1906525)
tions when a driver does not see the road ahead when drivingFirst it is a situation when the driver closes his or her eyesduring driving while drowsy The second situation is whenthe driverrsquos head is rotated when driving distractedly Bothof these situations are dangerous because the driver does notpay adequate attention to the road ahead In this paper weproposed a system to monitor these hazards simultaneouslyTwo measures PERCLOS and PERLOOK are used to detectthe drowsiness and distraction level respectively
Figure 20 shows the result of PERCLOS measurementfor drowsy sequences the state of a driver is alert for thefirst 100 s and during the remaining time the driver exhibitsdrowsy driving behavior In Fig 20 we were able to confirmthat the driver drowsiness was well detected by PERCLOSHowever if the driver exhibits distracted driving behaviorthe distracted behavior cannot be detected using the PERC-LOS measurement In Fig 21 the driver was requested to
Fig 18 Results of the proposed eye-detection and eye-statesndashdetection method on images captured during the daytime for a driverwho (a) did not wear any glasses and (b) wore sunglasses (Threevertical lines refer to the left right and center of the face)
drive normally for the first 160 s and then distractedly forthe remaining time Figure 21(a) shows the result of PER-CLOS measurement for distracted sequences In Figs 21(a)and 21(b) it is evident that distracted behaviors cannot bedetected using the PERCLOS measure alone Figure 21(a)measured by PERCLOS shows the false determination of adistracted behavior as a normal behavior Figure 21(b) mea-sured by PERLOOK shows that the driver distraction waswell detected at sim160 s
The experiments to measure the drowsiness and distrac-tion levels were executed on the image sequences in database2 For each of the subjects 36 drowsy video sequences and189 distracted video sequences were recorded during the day-time and 20 drowsy video sequences and 120 distracted videosequences were recorded during the nighttime For each ofthe drowsy video sequences about 5ndash10 min of observationwas recorded The subjects were requested to look frontally
Fig 19 Results of the proposed eye-detection and eye-statesndashdetection method on images captured during the nighttime for a driverwho (a) did not wear any glasses and (b) wore eyeglasses
Optical Engineering December 2011Vol 50(12)127202-18
Jo et al Vision-based method for detecting driver drowsiness and distraction
Fig 20 PERCLOS measurement for drowsy sequences
for 5 s and then drive normally or to drowsily drive for theremaining period For each of the distracted video sequencessim1 min of observation was recorded The subjects were re-quested to look frontally for 5 s and then drive normallyor to distractively drive for the remaining period Thus foreach subject we obtained three kinds of sequences normaldrowsy and distracted driving video sequences The experi-mental results using these video sequences are presented in
Table 13 In this experiment we achieved satisfying resultsAs shown in Table 13 the error rate of falsely recognizinga drowsy state or a distracted state as a normal state is 0while the error rate (false alarm) of falsely recognizing anormal state as a drowsy state or a distracted state is sim2That is there was no error in detecting drowsiness or dis-traction when the driver was actually drowsy or distractedOn the other hand six cases of a false alarm occurred in nor-
Fig 21 PERCLOS and PERLOOK measurements for a distracted video sequence (a) PERCLOS and (b) PERLOOK
Optical Engineering December 2011Vol 50(12)127202-19
Jo et al Vision-based method for detecting driver drowsiness and distraction
Fig 22 ROC curves for drowsiness and distraction detection accuracy (a) drowsiness detection and (b) distraction detection
mal driving videos of sim4 h which corresponds to 1ndash2 falsealarms per hour these can be regarded as small errors Failureanalysis revealed that a normal state was falsely recognizedas a drowsy state because the eyes were recognized as closedeyes when the driver laughed for a certain amount of timeErrors related to the driverrsquos habit of blinking hisher eyesoccur frequently Thus the measured PERCLOS was largerthan that for normal drivers Because a false alarm can annoythe driver we focused on the detection of dangerous inatten-tion By changing the decision threshold value the number
of false alarms can be reduced at the expense of increasingthe error of missing true detections
Also the false alarm can be reduced using the othermethods such as facial expression recognition user-specificdriver monitoring or driving behavior information such asmonitoring vehicle speed steering movement lane keepingacceleration braking and gear changing These works wouldbe considered in the future
Figure 22 shows the ROC curve for drowsiness and dis-traction detection accuracy by thresholds PERCLOS and
Optical Engineering December 2011Vol 50(12)127202-20
Jo et al Vision-based method for detecting driver drowsiness and distraction
Fig 23 One screen shot of actual drowsy video
PERLOOK ROC curve is a graphical plot of the sensitivityor true acceptance rate versus false acceptance rate for abinary classifier system because its discrimination thresholdis varied70 For convenience when the inattentive state isfalsely accepted as the normal state we define it as false-acceptance rate (FAR) in this paper In addition when thenormal state is falsely accepted as the inattentive state we de-fine it as false-rejection rate (FRR) When the FAR and FRRare equal the common value is referred to as the equal-errorrate The true-acceptance rate indicates a value subtractingFRR from 100
We describe a comparative experiment for measuringdrowsy parameters in each actual and virtual drowsinessvideo In our test the drowsy driverndashdetection performancewas measured using the virtual drowsiness video that wasobtained when 10 people simulated drowsy driving behaviorWe used a virtual drowsiness video because it is dangerousand difficult to obtain an actual drowsiness video moreoveran open database of actual drowsiness videos is not availableThus it was necessary to compare the values of PERCLOS inthe virtual drowsiness video with those in the actual drowsi-
Table 12 Testing data to detect the drowsiness and distraction of adriver in a vehicle
Time Driver state No test videos
Normal state 189
Day Drowsy state 36
Distracted state 189
Normal state 120
Night Drowsy state 20
Distracted state 120
Total 674
ness video The actual drowsiness video shown in Fig 23was obtained when a subject was actually drowsy at dawn (ataround 400 or 500 AM) Although this video was obtainedin the laboratory the acquisition environment (the positionsof a user and the proposed device the viewing angle of thecamera etc) was similar to that in a car Figure 24 showsgraphs for PERCLOS in the actual and virtual drowsinessvideos It is easy to identify that these features of PERC-LOS are similar In the actual drowsiness video the driverbegins to falls asleep after 300 frames and the average valueof PERCLOS is sim05254 In the virtual drowsiness videothe driver begins to falls asleep after 400 frames and theaverage value of PERCLOS is sim05024 Therefore we canpredict that the drowsy driverndashdetection performance in thevirtual drowsiness video will be similar to that in the actualdrowsiness video
Because it is difficult and dangerous to obtain drowsyor distracted videos in real conditions they were not ob-tained However the 189 videos [in (daytime) normal state ofTable 12] include five videos that were obtained when userswere actually driving on an expressway In the future webelieve that it would be possible to obtain a greater number
Fig 24 Comparison between the PERCLOS values in the actual and virtual drowsiness video (a) actual drowsiness and (b) virtual drowsiness
Optical Engineering December 2011Vol 50(12)127202-21
Jo et al Vision-based method for detecting driver drowsiness and distraction
Table 13 Drowsiness and distraction detection results measured from video sequences in a vehicle
Error rates ()
Misrecognizing adrowsy state asa normal state
Misrecognizing anormal state asa drowsy state
Misrecognizing adistracted state
as a normalstate
Misrecognizing anormal state as
a distractedstate
Misrecognizing adrowsy state as
a distractedstate
Misrecognizing adistracted state
as a drowsystate
0 (056) 162 (5309) 0 (0309) 064 (2309) 179 (156) 0 (0309)
of drowsy or distracted videos in real conditions with thesupport of car manufacturers
324 Processing timeThe proposed driver-monitoring system was efficient andworked in real time The software was implemented usingVisual C + + on an Intel Pentium M processor 160 GHz500 MB RAM Although not all the code optimizationswere completed the processing times are encouraging fora real-time implementation The total processing time was31 msframe and the processing times of each step are shownin Table 14
4 ConclusionIn this study we proposed a driver-monitoring system thatcan be used for warning against driver inattention includ-ing drowsiness and distraction We proposed an algorithmthat automatically localizes the eyes determines whetherthey are opened or closed and finally judges whether thedriver is driving drowsily or distractedly This constitutes anonintrusive approach to detecting driver inattention withoutannoyance or interference in both daytime and nighttime
The framework consists of three steps The first stepinvolves eye detection and tracking In driving sequenceimages adaboost adaptive template-matching and blob-detection methods are combined to detect the eyes automat-ically Eye detection is verified using an eye-validation tech-nique based on PCA + LDA and SVM The proposed eyedetector works well when the driver closes his or her eyes orwears eyeglasses and sunglasses High detection rates wereachieved in tests carried out on 12 people in the database
Table 14 Processing time of proposed driver monitoring system
Process Processing time (msframe)
Eye adaboost 231
Adaptive template matching 07
Blob detector 12
Eye validation by using SVM 22
Total eye detection 145
Eye states detection 24
Head pose estimationa 141
Total processing time 31
aReference 39
during both daytime and nighttime as well as when wearingsunglasses or eyeglasses
The second step is a process for classifying eyes as openedor closed For this purpose appearance-based features are ex-tracted from the detected eye image by PCA + LDA andedge-based features are obtained on the basis of sparsenessand kurtosis The detected eyes are then classified as openor closed by an SVM using the combined features We con-firmed that performance of the combined system is betterthan that of a single system Experimental results revealedthat the classification error rate in the databases was lt3during both daytime and nighttime as well as when wearingsunglasses or eyeglasses
The third step is a process for measuring the drowsinessand distraction levels of the driver In this process we pro-posed a method for checking these two conditions simultane-ously Two measures PERCLOS and PERLOOK are used tocalculate the drowsiness and distraction levels respectivelyand they yield satisfactory results
In the future we plan to conduct tests with a greater num-ber of users and over longer periods of time in order to obtainactual drowsy and distracted behaviors From the viewpointof gaze estimation we need to develop a precise gaze-estimation method using both head-pose and eye-movementinformation In the drowsy driverndashdetection method facialexpression recognition must be employed to distinguisheyes closed due to fatigue from those closed due to vigorouslaughter Moreover because eye size eye blinking frequencyand driving habits vary among drivers we need to developa driver-specific monitoring system using an online trainingmethod This system will exhibit better performance if it isintegrated with other sensors such as the accelerator steeringwheel and lane-position sensor Finally an integrated driv-ing safety system will be more effective when combined witha pedestrian-recognition system and a lane-keeping supportsystem
AcknowledgmentsThis work was supported in part by Mando Corporation LtdAnd in part by the National Research Foundation of Korea(NRF) grant funded by the Korea government (MEST) (GrantNo 2011-0015321)
References1 M R Rosekind E L Co K B Gregory and D L Miller ldquoCrew
factors in flight operations XIII a survey of fatigue factors incorporateexecutive aviation operationsrdquo NASA Ames Research Cen-ter NASATM-2000-209 610 (2000)
2 Awake Consortium (IST 2000-28062) ldquoSystem for effective assess-ment of driver vigilance and warning according to traffic risk estima-
Optical Engineering December 2011Vol 50(12)127202-22
Jo et al Vision-based method for detecting driver drowsiness and distraction
tion (AWAKE)rdquo September 2001ndash2004 lthttpwwwawake-euorggt(April 16 2011)
3 US Department of Transportation ldquo2007 FARSGES an-nual report (final ed)rdquo lthttpwwwnhtsadotgovportalsitenhtsamenuitem6a6eaf83cf719ad24ec86e10dba046a0gt (April 16 2011)
4 W Wierwille L Tijerina S Kiger T Rockwell E Lauber andA Bittne ldquoFinal report supplementmdashheavy vehicle driver workloadassessmentmdashtask 4 review of workload and related researchrdquo USDOTTech Rep No DOT HS 808 467(4) (1996)
5 H Saito T Ishiwaka M Sakata and S Okabayashi ldquoApplicationsof driverrsquos line of sight to automobilesmdashwhat can driverrsquos eye tellrdquo inProc of Vehicle Navigation and Information Systems Conf Yokohamapp 21ndash26 (1994)
6 H Ueno M Kaneda and M Tsukino ldquoDevelopment of drowsiness de-tection systemrdquo in Proc of Vehicle Navigation and Information SystemsConf Yokohama pp 15ndash20 (1994)
7 S Boverie J M Leqellec and A Hirl ldquoIntelligent systems for videomonitoring of vehicle cockpitrdquo in Proc of Int Congress and Exposi-tion ITS Advanced Controls and Vehicle Navigation Systems pp 1ndash5(1998)
8 M Kaneda H Ueno and M Tsukino ldquoDevelopment of a drowsinesswarning systemrdquo in Proc of 11th Int Conf on Enhanced Safety ofVehicle Munich (1994)
9 R Onken ldquoDaisy an adaptive knowledge-based driver monitoring andwarning systemrdquo in Proc of Vehicle Navigation and Information Sys-tems Conf Yokohama pp 3ndash10 (1994)
10 T Ishii M Hirose and H Iwata ldquoAutomatic recognition of driverrsquos fa-cial expression by image analysisrdquo Journal of the Society of AutomotiveEngineers of Japan Vol 41 pp 1398ndash1403 (1987)
11 K Yammamoto and S Higuchi ldquoDevelopment of a drowsiness warningsystemrdquo Journal of the Society of Automotive Engineers of JapanVol 46 pp 127ndash133 (1992)
12 D F Dinges M Mallis G Maislin and J W Powell ldquoEval-uation of techniques for ocular measurement as an index offatigue and the basis for alertness managementrdquo Departmentof Transportation Highway Safety Publication 808 762 April(1998)
13 R Grace V E Byrne D M Bierman and J M Legrand ldquoA drowsydriver detection system for heavy vehiclesrdquo in Proceedings of Digi-tal Avionics Systems Conference 17th DASC Vol 2 pp I361ndashI368(1998)
14 D Cleveland ldquoUnobtrusive eyelid closure and visual of regard mea-surement systemrdquo Conference on Ocular Measures of Driver alertnessApril (1999)
15 J Fukuda K Adachi M Nishida and E Akutsu ldquoDevelopment ofdriverrsquos drowsiness detection technologyrdquo Toyota Tech Rev 45 34ndash40(1995)
16 J H Richardson ldquoThe development of a driver alertness monitoringsystemrdquo in Fatigue and Driving Driver Impairment Driver Fatigueand Driver Simulation L Harrtley Ed Taylor amp Francis London(1995)
17 T DrsquoOrazio M Leo C Guaragnella and A Distante ldquoA visual ap-proach for driver inattention detectionrdquo Pattern Recogn 40 2341ndash2355(2007)
18 E Murphy-Chutorian and M M Trivedi ldquoHead pose estimation incomputer vision a surveyrdquo IEEE Trans Pattern Anal Mach Intell31(4) 607ndash626 (2009)
19 D W Hansen and Q Ji ldquoIn the eye of the beholder a survey of modelsfor eyes and gazerdquo IEEE Trans Pattern Anal Mach Intell 32 478ndash500(2010)
20 A Hattori S Tokoro M Miyashita I Tanakam K Ohue and SUozumi ldquoDevelopment of forward collision warning system using thedriver behavioral informationrdquo presented at 2006 SAE World CongressDetroit Michigan (2006)
21 E Murphy-Chutorian A Doshi and M M Trivedi ldquoHead pose estima-tion for driver assistance systems a robust algorithm and experimentalevaluationrdquo in Proc of 10th Int IEEE Conf Intelligent TransportationSystems pp 709ndash714 (2007)
22 P Smith M Shah and N da Vitoria Lobo ldquoDetermining driver vi-sual attention with one camerardquo IEEE Trans Intell Transp Syst 4(4)2058ndash2218 (2003)
23 J Y Kaminski D Knaan and A Shavit ldquoSingle image face orientationand gaze detectionrdquo Mach Vis Appl 21 85ndash98 (2009)
24 J C Stutts D W Reinfurt L Staplin and E A Rodgman ldquoThe roleof driver distraction in traffic crashesrdquo AAA Foundation for TrafficSafety Washington DC (2001)
25 K Torkkola N Massey and C Wood ldquoDriver inattention detectionthrough intelligent analysis of readily available sensorsrdquo in Proc ofIEEE Conf on Intelligent Transportation Systems Washington DCpp 326ndash331 (2004)
26 G Yang Y Lin and P Bhattacharya ldquoA driver fatigue recogni-tion model using fusion of multiple featuresrdquo in Proc of IEEE IntConf on Syst Man and Cybernetics Hawaii Vol 2 pp 1777ndash1784(2005)
27 S Park and M M Trivedi ldquoDriver activity analysis for in-telligent vehicles issues and development frameworkrdquo in Proc
of IEEE Intelligent Vehicles Symp Las Vegas pp 795ndash800(2005)
28 E Vural M Cetin A Ercil G Littlewort M S Bartlett and J RMovellan ldquoDrowsy driver detection though facial movement analysisrdquoIEEE Int Conf on Computer VisionndashHuman Computer Interaction pp6ndash18 (2007)
29 M Saradadevi and P Bajaj ldquoDriver fatigue detection using mouth andyawning analysisrdquo Int J Comput Sci Netw Security 8(6) 183ndash188(2008)
30 L M Beragasa J Nuevo M A Sotelo R Barea and E LopezldquoReal-time system for monitoring driver vigilancerdquo IEEE Trans IntellTransport Syst 7(1) 1524ndash1538 (2006)
31 R Senaratne D Hardy B Vanderaa and S Halgamuge ldquoDriver fatiguedetection by fusing multiple cuesrdquo Lect Notes Comput Sci 4492 801ndash809 (2007)
32 K Kircher A Kircher and F Claezon ldquoDistraction and drowsinessmdashafield studyrdquo Tech Rep VTI (The Swedish National Road and TransportResearch Institute) (2009)
33 S J Lee J Jo H G Jung K R Park and J Kim ldquoReal-time gaze es-timator based on driverrsquos head orientation for forward collision warningsystemrdquo IEEE Trans Intell Transp Syst 12(1) 254ndash267 (2011)
34 Specification of illuminator lthttproithner-lasercommultiled_multi_tohtmlge (July 25 2011)
35 Camera (EC650) lthttpwwwpyramidimagingcomspecsProsilica700009AA-EC65020User20Manualpdfgt (August 25 2011)
36 Camera lens (ML0614) lthttpwwwphoeniximagingcomml-0614htmge (July 25 2011)
37 Narrow bandpass interference filter (NT43-148) lthttpwwwedmundopticscomonlinecatalogdisplayproductcfmproductid=3198ampPageNum=5ampSort=displayOrderampOrder=ascproductsgt (July 252011)
38 SUV (GIA motors Sportage) lthttpwwwkiacomsportageexploregt (August 25 2011)
39 Sedan (Hyundai Motors Grandeur) lthttpgrandeurhyundaicomge(August 25 2011)
40 T Ito S Mita K Kozuka T Nakano and S Yamamoto ldquoDriver blinkmeasurement by the motion picture processing and its application todrowsiness detectionrdquo in Proc of Int Conf Intelligent TransportationSystems Singapore pp 168ndash173 (2002)
41 K Ohue Y Yamada S Uozumi S Tokoro A Hattori and T HayashildquoDevelopment of a new pre-crash safety systemrdquo SAE Tech PaperSeries Doc No 2006-01-1461 (2006)
42 Specification of motion tracking device called Patriot lthttpwwwpolhemuscompolhemus_editorassetsTech20compare20with20ResolutionvsRange20graphspdfgt (February 15 2011)
43 W J Scheirer A Rocha B Heflin and T E Boult ldquoDifficult detectiona comparison of two different approaches to eye detection for uncon-strained environmentsrdquo in Proc of IEEE 3rd Int Conf on BiometricsTheory Applications and Systems pp 1ndash8 (2009)
44 C Whitelam Z Jafri and T Bourlai ldquoMultispectral eye detection apreliminary studyrdquo in Proc of 2010 Int Conf on Pattern Recognitionpp 209ndash212 (2010)
45 P Viola and M Jones ldquoRapid object detection using a boosted cascadeof simple featuresrdquo in Proc of IEEE CVPR Vol 1 pp I-511ndashI-518(2001)
46 S D Wei and S H Lai ldquoFast template matching based on normalizedcross correlation with adaptive multilevel winner updaterdquo IEEE TransImage Process 17(11) 2227ndash2235 (2008)
47 Open source of blob detection lthttpopencvwillowgaragecomwikicvBlobsLibAlgorithmgt (July 30 2011)
48 R C Gonzalez and R E Woods Digital Image Processing 2nd edpp 523ndash532 Prentice-Hall Englewood Cliffs NJ (2002)
49 G Donato M S Bartlett J C Hager P Ekman and T J SejnowskildquoClassifying facial actionsrdquo IEEE Trans Pattern Anal Mach Intell21 974ndash989 (1999)
50 P N Bellhumeur J P Hespanha and D J Kriegman ldquoEigenfaces vsfisherfaces recognition using class specific linear projectionrdquo IEEETrans Pattern Anal Mach Intell 19 711ndash720 (1997)
51 A M Martinez and A C Kak ldquoPCA versus LDArdquo IEEE Trans PatternAnal Mach Intell 23 228ndash233 (2001)
52 M Turk and A Pentland ldquoEigenfaces for recognitionrdquo J CognitiveNeuro-sci 3 71ndash86 (1991)
53 H Deng L Jin L Zhen and J Huang ldquoA new facial expressionrecognition method nased on local gabor filter bank and PCA plusLDArdquo in Proc of Int Conf on Intelligent Computing August 23ndash26Hefei China pp 6ndash7 (2005)
54 V Vapnik ldquoSupport vector estimation of functionsrdquo in StatisticalLearning Theory pp 375ndash570 Wiley Hoboken NJ (1998)
55 C Hsu C Chang and C Lin ldquoA practical guide to supportvector classificationrdquo Tech Rep Department of Computer Sci-ence and Information Engineering National Taiwan UniversityTaipei lthttpwcsieorg˜cjlinpapersguideguidepdfgt (March 23(2011)
56 L Lang and H Qi ldquoThe study of driver fatigue monitor algorithmcombined PERCLOS and AECSrdquo in Proc of Int Conf on ComputSci and Software Eng pp 349ndash352 (2008)
Optical Engineering December 2011Vol 50(12)127202-23
Jo et al Vision-based method for detecting driver drowsiness and distraction
57 L Harley T Horberry N Mabbott and G Krueger ldquoReview of fa-tigue detection and prediction technologiesrdquo National Road TransportCommission (2000)
58 R Jain R Kasturi and B G Schunck Machine Vision pp 78ndash84McGraw-Hill New York (1995)
59 P O Hoyer ldquoNon-negative matrix factorization with sparseness con-straintsrdquo J Mach Learning Res 5 1457ndash1469 (2004)
60 A Hyvarinen and E Oja ldquoIndependent component analysisrdquo NeuralNetw 13(4ndash5) 411ndash430 (2000)
61 Q Ji and X Yang ldquoReal-time eye gaze and face pose tracking formonitoring driver vigilancerdquo Real-Time Imaging 8(5) 357ndash377 (2002)
62 D F Dinges M M Mallis G Maislin and J W Powell ldquoEvaluationof techniques for ocular measurement as an index of fatigue and thebasis for alertness managementrdquo US Department of TransportationNational Highway Traffic Safety Administration DOT HS 808 762(1998)
63 Smart Eye Pro lthttpwwwsmarteyesegt (25 July 2011)64 S Kawato and J Ohya ldquoReal-time detection of nodding and head-
shaking by directly detecting and tracking the between-eyesrdquo in Procof 4th Intrsquol IEEE Conf Automatic Face and Gesture Recognitionpp 40ndash45 (2000)
65 B Ma S Shan X Chen and W Gao ldquoHead yaw estimation fromasymmetry of facial appearancerdquo IEEE Trans Syst Man Cybern PartB 38(6) 1501ndash1512 (2008)
66 P Watta S Lakshmanan and Y Hou ldquoNonparametric approaches forestimating driver poserdquo IEEE Trans Vehicular Technol 56(4) 2028ndash2041 (2007)
67 J Wu and M M Trivedi ldquoA two-stage head pose estimation frameworkand evaluationrdquo Pattern Recogn 41 1138ndash1158 (2008)
68 E Murphy-Chutorian and M M Trivedi ldquoHyHOPE hybrid head ori-entation and position estimation for vision-based driver head trackingrdquoin Proc of IEEE Intell Vehicles Symp pp 512ndash517 (2008)
69 J P Batista ldquoA real-time driver visual attention monitoring systemrdquoLect Notes Comput Sci 3522 200ndash208 (2005)
70 N K Ratha and V Govindaraju Advances in Biometrics SensorsAlgorithms and System Springer New York (2008)
Jaeik Jo received the BS in electricaland electronic engineering in 2008 fromYonsei University Seoul Korea where he iscurrently working toward the MS-PhD jointdegree His current research interests in-clude driver monitoring systems 3-D face re-construction biometrics pattern recognitionand computer vision
Sung Joo Lee received the BS in electri-cal and electronic engineering and the MSin biometric engineering in 2004 and 2006respectively from Yonsei University SeoulKorea where he received the PhD in elec-trical and electronic engineering in 2011 In2011 he joined the Mobis Co Ltd wherehe is currently an assistant research engi-neer His current research interests includemoving object detection driver monitoringsystem biometrics pattern recognition and
computer vision
Ho Gi Jung received the BE ME and PhDin electronic engineering from Yonsei Univer-sity Seoul Korea in 1995 1997 and 2008respectively He was with MANDO Corpora-tion Global RampD HQ from 1997 to April2009 He developed environmental recog-nition systems for intelligent parking assistsystem collision warning and avoidance sys-tem and active pedestrian protection sys-tem From May 2009 to February 2011 hewas with Yonsei University as a full-time re-
searcher and research professor He researched computer visionapplications for intelligent surveillance systems and biometric sys-tems Since March 2011 he has been with Hanyang University asan assistant professor He is researching recognition systems for in-telligent vehicles His interests are recognition system for intelligentvehicle next generation vehicle computer vision applications andpattern recognition applications
Kang Ryoung Park received his BS and MSin electronic engineering from Yonsei Uni-versity Seoul Korea in 1994 and 1996 re-spectively He also received his PhD in com-puter vision from the Department of Electricaland Computer Engineering Yonsei Univer-sity in 2000 He was an assistant professorin the Division of Digital Media Technologyat Sangmyung University from March 2003to February 2008 He has been an assis-tant and associate professor in the Division
of Electronics and Electrical Engineering at Dongguk University sinceMarch 2008 He is also a research member of BERC His researchinterests include computer vision image processing and biometrics
Jaihie Kim received the BS in electronic en-gineering from Yonsei University Republic ofKorea in 1979 the PhD in electrical engi-neering from the Case Western Reserve Uni-versity USA in 1984 Since 1984 he hasbeen a professor in the School of Electri-cal and Electronic Engineering Yonsei Uni-versity Currently he is the Director of theBiometric Engineering Research Center inKorea the Chairman of the Korea Biomet-ric Association a member of the National
Academy of Engineering of Korea and in 2008 he was the Presi-dent of the IEEK (Institute of Electronics Engineers of Korea) andnow an Emeritus President of the IEEK His general research inter-ests are biometrics pattern recognition and computer vision Specif-ically some of his recent research topics include touchless finger-print recognition fake fingerprint detection fake face detection 2D-to-3D face conversion face age estimationsynthesis He was theauthor of many international technical journals which could be foundat lsquohttpcherupyonseiackrrsquo
Optical Engineering December 2011Vol 50(12)127202-24
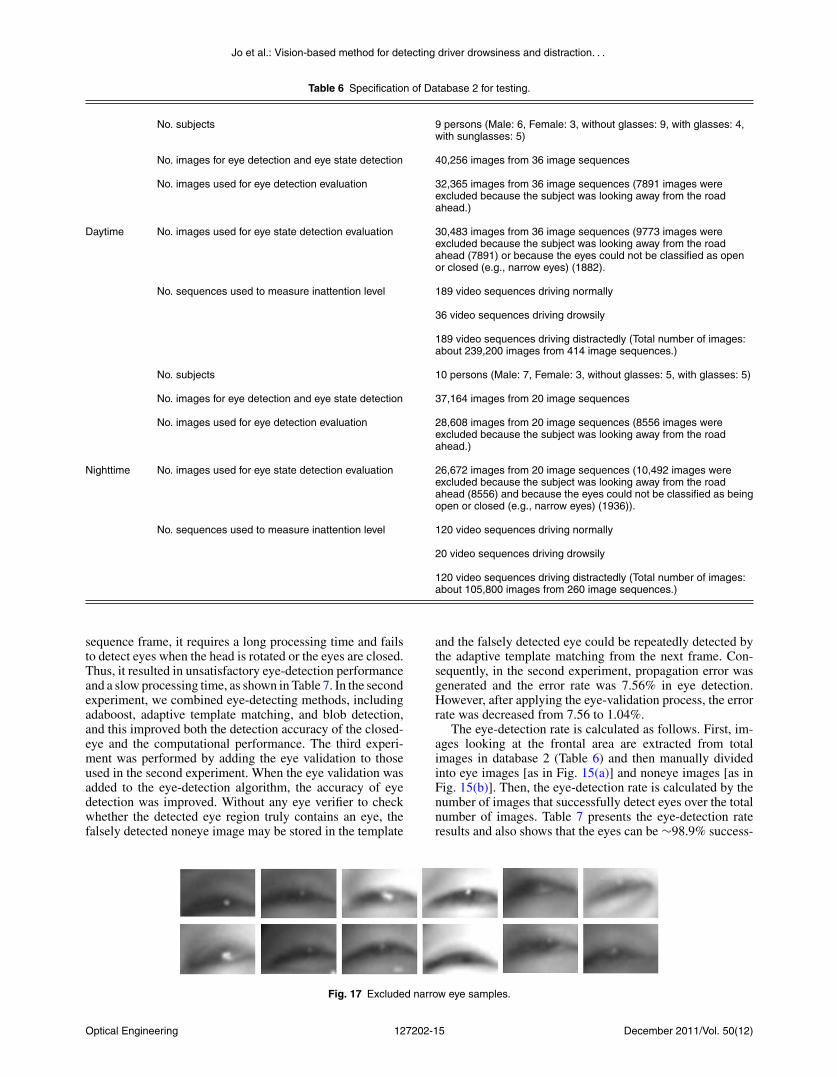
Jo et al Vision-based method for detecting driver drowsiness and distraction
Fig 20 PERCLOS measurement for drowsy sequences
for 5 s and then drive normally or to drowsily drive for theremaining period For each of the distracted video sequencessim1 min of observation was recorded The subjects were re-quested to look frontally for 5 s and then drive normallyor to distractively drive for the remaining period Thus foreach subject we obtained three kinds of sequences normaldrowsy and distracted driving video sequences The experi-mental results using these video sequences are presented in
Table 13 In this experiment we achieved satisfying resultsAs shown in Table 13 the error rate of falsely recognizinga drowsy state or a distracted state as a normal state is 0while the error rate (false alarm) of falsely recognizing anormal state as a drowsy state or a distracted state is sim2That is there was no error in detecting drowsiness or dis-traction when the driver was actually drowsy or distractedOn the other hand six cases of a false alarm occurred in nor-
Fig 21 PERCLOS and PERLOOK measurements for a distracted video sequence (a) PERCLOS and (b) PERLOOK
Optical Engineering December 2011Vol 50(12)127202-19
Jo et al Vision-based method for detecting driver drowsiness and distraction
Fig 22 ROC curves for drowsiness and distraction detection accuracy (a) drowsiness detection and (b) distraction detection
mal driving videos of sim4 h which corresponds to 1ndash2 falsealarms per hour these can be regarded as small errors Failureanalysis revealed that a normal state was falsely recognizedas a drowsy state because the eyes were recognized as closedeyes when the driver laughed for a certain amount of timeErrors related to the driverrsquos habit of blinking hisher eyesoccur frequently Thus the measured PERCLOS was largerthan that for normal drivers Because a false alarm can annoythe driver we focused on the detection of dangerous inatten-tion By changing the decision threshold value the number
of false alarms can be reduced at the expense of increasingthe error of missing true detections
Also the false alarm can be reduced using the othermethods such as facial expression recognition user-specificdriver monitoring or driving behavior information such asmonitoring vehicle speed steering movement lane keepingacceleration braking and gear changing These works wouldbe considered in the future
Figure 22 shows the ROC curve for drowsiness and dis-traction detection accuracy by thresholds PERCLOS and
Optical Engineering December 2011Vol 50(12)127202-20
Jo et al Vision-based method for detecting driver drowsiness and distraction
Fig 23 One screen shot of actual drowsy video
PERLOOK ROC curve is a graphical plot of the sensitivityor true acceptance rate versus false acceptance rate for abinary classifier system because its discrimination thresholdis varied70 For convenience when the inattentive state isfalsely accepted as the normal state we define it as false-acceptance rate (FAR) in this paper In addition when thenormal state is falsely accepted as the inattentive state we de-fine it as false-rejection rate (FRR) When the FAR and FRRare equal the common value is referred to as the equal-errorrate The true-acceptance rate indicates a value subtractingFRR from 100
We describe a comparative experiment for measuringdrowsy parameters in each actual and virtual drowsinessvideo In our test the drowsy driverndashdetection performancewas measured using the virtual drowsiness video that wasobtained when 10 people simulated drowsy driving behaviorWe used a virtual drowsiness video because it is dangerousand difficult to obtain an actual drowsiness video moreoveran open database of actual drowsiness videos is not availableThus it was necessary to compare the values of PERCLOS inthe virtual drowsiness video with those in the actual drowsi-
Table 12 Testing data to detect the drowsiness and distraction of adriver in a vehicle
Time Driver state No test videos
Normal state 189
Day Drowsy state 36
Distracted state 189
Normal state 120
Night Drowsy state 20
Distracted state 120
Total 674
ness video The actual drowsiness video shown in Fig 23was obtained when a subject was actually drowsy at dawn (ataround 400 or 500 AM) Although this video was obtainedin the laboratory the acquisition environment (the positionsof a user and the proposed device the viewing angle of thecamera etc) was similar to that in a car Figure 24 showsgraphs for PERCLOS in the actual and virtual drowsinessvideos It is easy to identify that these features of PERC-LOS are similar In the actual drowsiness video the driverbegins to falls asleep after 300 frames and the average valueof PERCLOS is sim05254 In the virtual drowsiness videothe driver begins to falls asleep after 400 frames and theaverage value of PERCLOS is sim05024 Therefore we canpredict that the drowsy driverndashdetection performance in thevirtual drowsiness video will be similar to that in the actualdrowsiness video
Because it is difficult and dangerous to obtain drowsyor distracted videos in real conditions they were not ob-tained However the 189 videos [in (daytime) normal state ofTable 12] include five videos that were obtained when userswere actually driving on an expressway In the future webelieve that it would be possible to obtain a greater number
Fig 24 Comparison between the PERCLOS values in the actual and virtual drowsiness video (a) actual drowsiness and (b) virtual drowsiness
Optical Engineering December 2011Vol 50(12)127202-21
Jo et al Vision-based method for detecting driver drowsiness and distraction
Table 13 Drowsiness and distraction detection results measured from video sequences in a vehicle
Error rates ()
Misrecognizing adrowsy state asa normal state
Misrecognizing anormal state asa drowsy state
Misrecognizing adistracted state
as a normalstate
Misrecognizing anormal state as
a distractedstate
Misrecognizing adrowsy state as
a distractedstate
Misrecognizing adistracted state
as a drowsystate
0 (056) 162 (5309) 0 (0309) 064 (2309) 179 (156) 0 (0309)
of drowsy or distracted videos in real conditions with thesupport of car manufacturers
324 Processing timeThe proposed driver-monitoring system was efficient andworked in real time The software was implemented usingVisual C + + on an Intel Pentium M processor 160 GHz500 MB RAM Although not all the code optimizationswere completed the processing times are encouraging fora real-time implementation The total processing time was31 msframe and the processing times of each step are shownin Table 14
4 ConclusionIn this study we proposed a driver-monitoring system thatcan be used for warning against driver inattention includ-ing drowsiness and distraction We proposed an algorithmthat automatically localizes the eyes determines whetherthey are opened or closed and finally judges whether thedriver is driving drowsily or distractedly This constitutes anonintrusive approach to detecting driver inattention withoutannoyance or interference in both daytime and nighttime
The framework consists of three steps The first stepinvolves eye detection and tracking In driving sequenceimages adaboost adaptive template-matching and blob-detection methods are combined to detect the eyes automat-ically Eye detection is verified using an eye-validation tech-nique based on PCA + LDA and SVM The proposed eyedetector works well when the driver closes his or her eyes orwears eyeglasses and sunglasses High detection rates wereachieved in tests carried out on 12 people in the database
Table 14 Processing time of proposed driver monitoring system
Process Processing time (msframe)
Eye adaboost 231
Adaptive template matching 07
Blob detector 12
Eye validation by using SVM 22
Total eye detection 145
Eye states detection 24
Head pose estimationa 141
Total processing time 31
aReference 39
during both daytime and nighttime as well as when wearingsunglasses or eyeglasses
The second step is a process for classifying eyes as openedor closed For this purpose appearance-based features are ex-tracted from the detected eye image by PCA + LDA andedge-based features are obtained on the basis of sparsenessand kurtosis The detected eyes are then classified as openor closed by an SVM using the combined features We con-firmed that performance of the combined system is betterthan that of a single system Experimental results revealedthat the classification error rate in the databases was lt3during both daytime and nighttime as well as when wearingsunglasses or eyeglasses
The third step is a process for measuring the drowsinessand distraction levels of the driver In this process we pro-posed a method for checking these two conditions simultane-ously Two measures PERCLOS and PERLOOK are used tocalculate the drowsiness and distraction levels respectivelyand they yield satisfactory results
In the future we plan to conduct tests with a greater num-ber of users and over longer periods of time in order to obtainactual drowsy and distracted behaviors From the viewpointof gaze estimation we need to develop a precise gaze-estimation method using both head-pose and eye-movementinformation In the drowsy driverndashdetection method facialexpression recognition must be employed to distinguisheyes closed due to fatigue from those closed due to vigorouslaughter Moreover because eye size eye blinking frequencyand driving habits vary among drivers we need to developa driver-specific monitoring system using an online trainingmethod This system will exhibit better performance if it isintegrated with other sensors such as the accelerator steeringwheel and lane-position sensor Finally an integrated driv-ing safety system will be more effective when combined witha pedestrian-recognition system and a lane-keeping supportsystem
AcknowledgmentsThis work was supported in part by Mando Corporation LtdAnd in part by the National Research Foundation of Korea(NRF) grant funded by the Korea government (MEST) (GrantNo 2011-0015321)
References1 M R Rosekind E L Co K B Gregory and D L Miller ldquoCrew
factors in flight operations XIII a survey of fatigue factors incorporateexecutive aviation operationsrdquo NASA Ames Research Cen-ter NASATM-2000-209 610 (2000)
2 Awake Consortium (IST 2000-28062) ldquoSystem for effective assess-ment of driver vigilance and warning according to traffic risk estima-
Optical Engineering December 2011Vol 50(12)127202-22
Jo et al Vision-based method for detecting driver drowsiness and distraction
tion (AWAKE)rdquo September 2001ndash2004 lthttpwwwawake-euorggt(April 16 2011)
3 US Department of Transportation ldquo2007 FARSGES an-nual report (final ed)rdquo lthttpwwwnhtsadotgovportalsitenhtsamenuitem6a6eaf83cf719ad24ec86e10dba046a0gt (April 16 2011)
4 W Wierwille L Tijerina S Kiger T Rockwell E Lauber andA Bittne ldquoFinal report supplementmdashheavy vehicle driver workloadassessmentmdashtask 4 review of workload and related researchrdquo USDOTTech Rep No DOT HS 808 467(4) (1996)
5 H Saito T Ishiwaka M Sakata and S Okabayashi ldquoApplicationsof driverrsquos line of sight to automobilesmdashwhat can driverrsquos eye tellrdquo inProc of Vehicle Navigation and Information Systems Conf Yokohamapp 21ndash26 (1994)
6 H Ueno M Kaneda and M Tsukino ldquoDevelopment of drowsiness de-tection systemrdquo in Proc of Vehicle Navigation and Information SystemsConf Yokohama pp 15ndash20 (1994)
7 S Boverie J M Leqellec and A Hirl ldquoIntelligent systems for videomonitoring of vehicle cockpitrdquo in Proc of Int Congress and Exposi-tion ITS Advanced Controls and Vehicle Navigation Systems pp 1ndash5(1998)
8 M Kaneda H Ueno and M Tsukino ldquoDevelopment of a drowsinesswarning systemrdquo in Proc of 11th Int Conf on Enhanced Safety ofVehicle Munich (1994)
9 R Onken ldquoDaisy an adaptive knowledge-based driver monitoring andwarning systemrdquo in Proc of Vehicle Navigation and Information Sys-tems Conf Yokohama pp 3ndash10 (1994)
10 T Ishii M Hirose and H Iwata ldquoAutomatic recognition of driverrsquos fa-cial expression by image analysisrdquo Journal of the Society of AutomotiveEngineers of Japan Vol 41 pp 1398ndash1403 (1987)
11 K Yammamoto and S Higuchi ldquoDevelopment of a drowsiness warningsystemrdquo Journal of the Society of Automotive Engineers of JapanVol 46 pp 127ndash133 (1992)
12 D F Dinges M Mallis G Maislin and J W Powell ldquoEval-uation of techniques for ocular measurement as an index offatigue and the basis for alertness managementrdquo Departmentof Transportation Highway Safety Publication 808 762 April(1998)
13 R Grace V E Byrne D M Bierman and J M Legrand ldquoA drowsydriver detection system for heavy vehiclesrdquo in Proceedings of Digi-tal Avionics Systems Conference 17th DASC Vol 2 pp I361ndashI368(1998)
14 D Cleveland ldquoUnobtrusive eyelid closure and visual of regard mea-surement systemrdquo Conference on Ocular Measures of Driver alertnessApril (1999)
15 J Fukuda K Adachi M Nishida and E Akutsu ldquoDevelopment ofdriverrsquos drowsiness detection technologyrdquo Toyota Tech Rev 45 34ndash40(1995)
16 J H Richardson ldquoThe development of a driver alertness monitoringsystemrdquo in Fatigue and Driving Driver Impairment Driver Fatigueand Driver Simulation L Harrtley Ed Taylor amp Francis London(1995)
17 T DrsquoOrazio M Leo C Guaragnella and A Distante ldquoA visual ap-proach for driver inattention detectionrdquo Pattern Recogn 40 2341ndash2355(2007)
18 E Murphy-Chutorian and M M Trivedi ldquoHead pose estimation incomputer vision a surveyrdquo IEEE Trans Pattern Anal Mach Intell31(4) 607ndash626 (2009)
19 D W Hansen and Q Ji ldquoIn the eye of the beholder a survey of modelsfor eyes and gazerdquo IEEE Trans Pattern Anal Mach Intell 32 478ndash500(2010)
20 A Hattori S Tokoro M Miyashita I Tanakam K Ohue and SUozumi ldquoDevelopment of forward collision warning system using thedriver behavioral informationrdquo presented at 2006 SAE World CongressDetroit Michigan (2006)
21 E Murphy-Chutorian A Doshi and M M Trivedi ldquoHead pose estima-tion for driver assistance systems a robust algorithm and experimentalevaluationrdquo in Proc of 10th Int IEEE Conf Intelligent TransportationSystems pp 709ndash714 (2007)
22 P Smith M Shah and N da Vitoria Lobo ldquoDetermining driver vi-sual attention with one camerardquo IEEE Trans Intell Transp Syst 4(4)2058ndash2218 (2003)
23 J Y Kaminski D Knaan and A Shavit ldquoSingle image face orientationand gaze detectionrdquo Mach Vis Appl 21 85ndash98 (2009)
24 J C Stutts D W Reinfurt L Staplin and E A Rodgman ldquoThe roleof driver distraction in traffic crashesrdquo AAA Foundation for TrafficSafety Washington DC (2001)
25 K Torkkola N Massey and C Wood ldquoDriver inattention detectionthrough intelligent analysis of readily available sensorsrdquo in Proc ofIEEE Conf on Intelligent Transportation Systems Washington DCpp 326ndash331 (2004)
26 G Yang Y Lin and P Bhattacharya ldquoA driver fatigue recogni-tion model using fusion of multiple featuresrdquo in Proc of IEEE IntConf on Syst Man and Cybernetics Hawaii Vol 2 pp 1777ndash1784(2005)
27 S Park and M M Trivedi ldquoDriver activity analysis for in-telligent vehicles issues and development frameworkrdquo in Proc
of IEEE Intelligent Vehicles Symp Las Vegas pp 795ndash800(2005)
28 E Vural M Cetin A Ercil G Littlewort M S Bartlett and J RMovellan ldquoDrowsy driver detection though facial movement analysisrdquoIEEE Int Conf on Computer VisionndashHuman Computer Interaction pp6ndash18 (2007)
29 M Saradadevi and P Bajaj ldquoDriver fatigue detection using mouth andyawning analysisrdquo Int J Comput Sci Netw Security 8(6) 183ndash188(2008)
30 L M Beragasa J Nuevo M A Sotelo R Barea and E LopezldquoReal-time system for monitoring driver vigilancerdquo IEEE Trans IntellTransport Syst 7(1) 1524ndash1538 (2006)
31 R Senaratne D Hardy B Vanderaa and S Halgamuge ldquoDriver fatiguedetection by fusing multiple cuesrdquo Lect Notes Comput Sci 4492 801ndash809 (2007)
32 K Kircher A Kircher and F Claezon ldquoDistraction and drowsinessmdashafield studyrdquo Tech Rep VTI (The Swedish National Road and TransportResearch Institute) (2009)
33 S J Lee J Jo H G Jung K R Park and J Kim ldquoReal-time gaze es-timator based on driverrsquos head orientation for forward collision warningsystemrdquo IEEE Trans Intell Transp Syst 12(1) 254ndash267 (2011)
34 Specification of illuminator lthttproithner-lasercommultiled_multi_tohtmlge (July 25 2011)
35 Camera (EC650) lthttpwwwpyramidimagingcomspecsProsilica700009AA-EC65020User20Manualpdfgt (August 25 2011)
36 Camera lens (ML0614) lthttpwwwphoeniximagingcomml-0614htmge (July 25 2011)
37 Narrow bandpass interference filter (NT43-148) lthttpwwwedmundopticscomonlinecatalogdisplayproductcfmproductid=3198ampPageNum=5ampSort=displayOrderampOrder=ascproductsgt (July 252011)
38 SUV (GIA motors Sportage) lthttpwwwkiacomsportageexploregt (August 25 2011)
39 Sedan (Hyundai Motors Grandeur) lthttpgrandeurhyundaicomge(August 25 2011)
40 T Ito S Mita K Kozuka T Nakano and S Yamamoto ldquoDriver blinkmeasurement by the motion picture processing and its application todrowsiness detectionrdquo in Proc of Int Conf Intelligent TransportationSystems Singapore pp 168ndash173 (2002)
41 K Ohue Y Yamada S Uozumi S Tokoro A Hattori and T HayashildquoDevelopment of a new pre-crash safety systemrdquo SAE Tech PaperSeries Doc No 2006-01-1461 (2006)
42 Specification of motion tracking device called Patriot lthttpwwwpolhemuscompolhemus_editorassetsTech20compare20with20ResolutionvsRange20graphspdfgt (February 15 2011)
43 W J Scheirer A Rocha B Heflin and T E Boult ldquoDifficult detectiona comparison of two different approaches to eye detection for uncon-strained environmentsrdquo in Proc of IEEE 3rd Int Conf on BiometricsTheory Applications and Systems pp 1ndash8 (2009)
44 C Whitelam Z Jafri and T Bourlai ldquoMultispectral eye detection apreliminary studyrdquo in Proc of 2010 Int Conf on Pattern Recognitionpp 209ndash212 (2010)
45 P Viola and M Jones ldquoRapid object detection using a boosted cascadeof simple featuresrdquo in Proc of IEEE CVPR Vol 1 pp I-511ndashI-518(2001)
46 S D Wei and S H Lai ldquoFast template matching based on normalizedcross correlation with adaptive multilevel winner updaterdquo IEEE TransImage Process 17(11) 2227ndash2235 (2008)
47 Open source of blob detection lthttpopencvwillowgaragecomwikicvBlobsLibAlgorithmgt (July 30 2011)
48 R C Gonzalez and R E Woods Digital Image Processing 2nd edpp 523ndash532 Prentice-Hall Englewood Cliffs NJ (2002)
49 G Donato M S Bartlett J C Hager P Ekman and T J SejnowskildquoClassifying facial actionsrdquo IEEE Trans Pattern Anal Mach Intell21 974ndash989 (1999)
50 P N Bellhumeur J P Hespanha and D J Kriegman ldquoEigenfaces vsfisherfaces recognition using class specific linear projectionrdquo IEEETrans Pattern Anal Mach Intell 19 711ndash720 (1997)
51 A M Martinez and A C Kak ldquoPCA versus LDArdquo IEEE Trans PatternAnal Mach Intell 23 228ndash233 (2001)
52 M Turk and A Pentland ldquoEigenfaces for recognitionrdquo J CognitiveNeuro-sci 3 71ndash86 (1991)
53 H Deng L Jin L Zhen and J Huang ldquoA new facial expressionrecognition method nased on local gabor filter bank and PCA plusLDArdquo in Proc of Int Conf on Intelligent Computing August 23ndash26Hefei China pp 6ndash7 (2005)
54 V Vapnik ldquoSupport vector estimation of functionsrdquo in StatisticalLearning Theory pp 375ndash570 Wiley Hoboken NJ (1998)
55 C Hsu C Chang and C Lin ldquoA practical guide to supportvector classificationrdquo Tech Rep Department of Computer Sci-ence and Information Engineering National Taiwan UniversityTaipei lthttpwcsieorg˜cjlinpapersguideguidepdfgt (March 23(2011)
56 L Lang and H Qi ldquoThe study of driver fatigue monitor algorithmcombined PERCLOS and AECSrdquo in Proc of Int Conf on ComputSci and Software Eng pp 349ndash352 (2008)
Optical Engineering December 2011Vol 50(12)127202-23
Jo et al Vision-based method for detecting driver drowsiness and distraction
57 L Harley T Horberry N Mabbott and G Krueger ldquoReview of fa-tigue detection and prediction technologiesrdquo National Road TransportCommission (2000)
58 R Jain R Kasturi and B G Schunck Machine Vision pp 78ndash84McGraw-Hill New York (1995)
59 P O Hoyer ldquoNon-negative matrix factorization with sparseness con-straintsrdquo J Mach Learning Res 5 1457ndash1469 (2004)
60 A Hyvarinen and E Oja ldquoIndependent component analysisrdquo NeuralNetw 13(4ndash5) 411ndash430 (2000)
61 Q Ji and X Yang ldquoReal-time eye gaze and face pose tracking formonitoring driver vigilancerdquo Real-Time Imaging 8(5) 357ndash377 (2002)
62 D F Dinges M M Mallis G Maislin and J W Powell ldquoEvaluationof techniques for ocular measurement as an index of fatigue and thebasis for alertness managementrdquo US Department of TransportationNational Highway Traffic Safety Administration DOT HS 808 762(1998)
63 Smart Eye Pro lthttpwwwsmarteyesegt (25 July 2011)64 S Kawato and J Ohya ldquoReal-time detection of nodding and head-
shaking by directly detecting and tracking the between-eyesrdquo in Procof 4th Intrsquol IEEE Conf Automatic Face and Gesture Recognitionpp 40ndash45 (2000)
65 B Ma S Shan X Chen and W Gao ldquoHead yaw estimation fromasymmetry of facial appearancerdquo IEEE Trans Syst Man Cybern PartB 38(6) 1501ndash1512 (2008)
66 P Watta S Lakshmanan and Y Hou ldquoNonparametric approaches forestimating driver poserdquo IEEE Trans Vehicular Technol 56(4) 2028ndash2041 (2007)
67 J Wu and M M Trivedi ldquoA two-stage head pose estimation frameworkand evaluationrdquo Pattern Recogn 41 1138ndash1158 (2008)
68 E Murphy-Chutorian and M M Trivedi ldquoHyHOPE hybrid head ori-entation and position estimation for vision-based driver head trackingrdquoin Proc of IEEE Intell Vehicles Symp pp 512ndash517 (2008)
69 J P Batista ldquoA real-time driver visual attention monitoring systemrdquoLect Notes Comput Sci 3522 200ndash208 (2005)
70 N K Ratha and V Govindaraju Advances in Biometrics SensorsAlgorithms and System Springer New York (2008)
Jaeik Jo received the BS in electricaland electronic engineering in 2008 fromYonsei University Seoul Korea where he iscurrently working toward the MS-PhD jointdegree His current research interests in-clude driver monitoring systems 3-D face re-construction biometrics pattern recognitionand computer vision
Sung Joo Lee received the BS in electri-cal and electronic engineering and the MSin biometric engineering in 2004 and 2006respectively from Yonsei University SeoulKorea where he received the PhD in elec-trical and electronic engineering in 2011 In2011 he joined the Mobis Co Ltd wherehe is currently an assistant research engi-neer His current research interests includemoving object detection driver monitoringsystem biometrics pattern recognition and
computer vision
Ho Gi Jung received the BE ME and PhDin electronic engineering from Yonsei Univer-sity Seoul Korea in 1995 1997 and 2008respectively He was with MANDO Corpora-tion Global RampD HQ from 1997 to April2009 He developed environmental recog-nition systems for intelligent parking assistsystem collision warning and avoidance sys-tem and active pedestrian protection sys-tem From May 2009 to February 2011 hewas with Yonsei University as a full-time re-
searcher and research professor He researched computer visionapplications for intelligent surveillance systems and biometric sys-tems Since March 2011 he has been with Hanyang University asan assistant professor He is researching recognition systems for in-telligent vehicles His interests are recognition system for intelligentvehicle next generation vehicle computer vision applications andpattern recognition applications
Kang Ryoung Park received his BS and MSin electronic engineering from Yonsei Uni-versity Seoul Korea in 1994 and 1996 re-spectively He also received his PhD in com-puter vision from the Department of Electricaland Computer Engineering Yonsei Univer-sity in 2000 He was an assistant professorin the Division of Digital Media Technologyat Sangmyung University from March 2003to February 2008 He has been an assis-tant and associate professor in the Division
of Electronics and Electrical Engineering at Dongguk University sinceMarch 2008 He is also a research member of BERC His researchinterests include computer vision image processing and biometrics
Jaihie Kim received the BS in electronic en-gineering from Yonsei University Republic ofKorea in 1979 the PhD in electrical engi-neering from the Case Western Reserve Uni-versity USA in 1984 Since 1984 he hasbeen a professor in the School of Electri-cal and Electronic Engineering Yonsei Uni-versity Currently he is the Director of theBiometric Engineering Research Center inKorea the Chairman of the Korea Biomet-ric Association a member of the National
Academy of Engineering of Korea and in 2008 he was the Presi-dent of the IEEK (Institute of Electronics Engineers of Korea) andnow an Emeritus President of the IEEK His general research inter-ests are biometrics pattern recognition and computer vision Specif-ically some of his recent research topics include touchless finger-print recognition fake fingerprint detection fake face detection 2D-to-3D face conversion face age estimationsynthesis He was theauthor of many international technical journals which could be foundat lsquohttpcherupyonseiackrrsquo
Optical Engineering December 2011Vol 50(12)127202-24
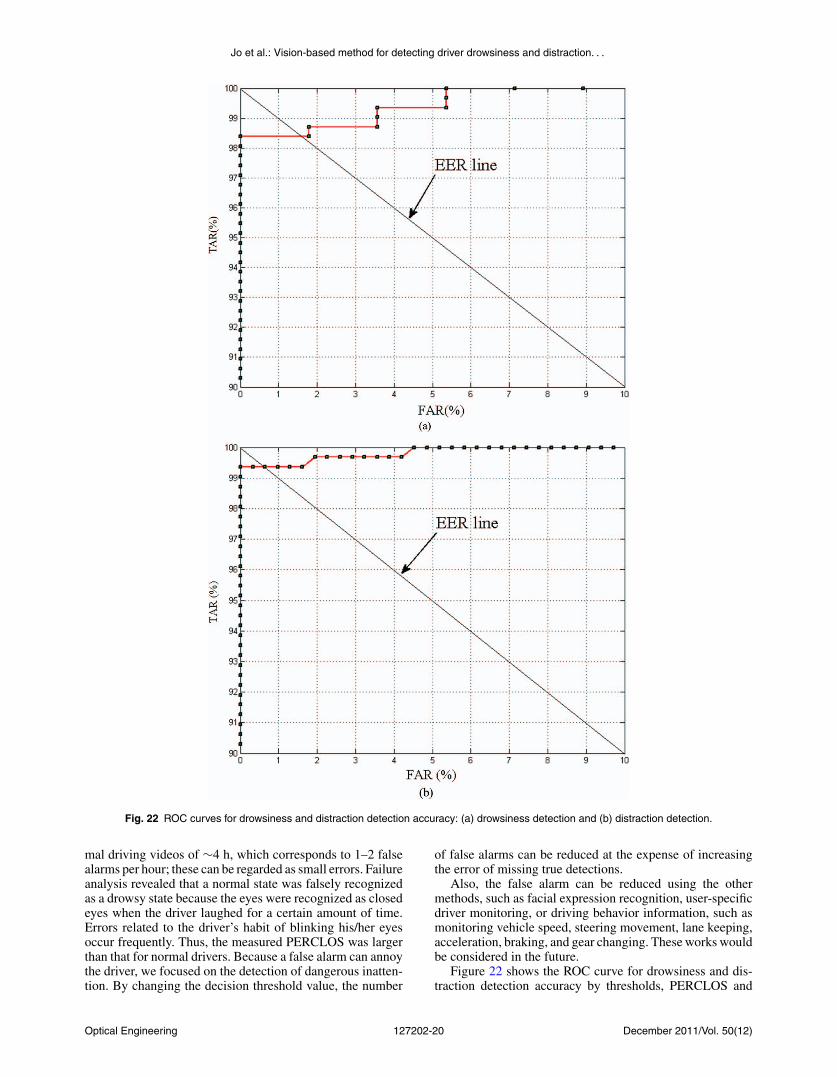
Jo et al Vision-based method for detecting driver drowsiness and distraction
Table 13 Drowsiness and distraction detection results measured from video sequences in a vehicle
Error rates ()
Misrecognizing adrowsy state asa normal state
Misrecognizing anormal state asa drowsy state
Misrecognizing adistracted state
as a normalstate
Misrecognizing anormal state as
a distractedstate
Misrecognizing adrowsy state as
a distractedstate
Misrecognizing adistracted state
as a drowsystate
0 (056) 162 (5309) 0 (0309) 064 (2309) 179 (156) 0 (0309)
of drowsy or distracted videos in real conditions with thesupport of car manufacturers
324 Processing timeThe proposed driver-monitoring system was efficient andworked in real time The software was implemented usingVisual C + + on an Intel Pentium M processor 160 GHz500 MB RAM Although not all the code optimizationswere completed the processing times are encouraging fora real-time implementation The total processing time was31 msframe and the processing times of each step are shownin Table 14
4 ConclusionIn this study we proposed a driver-monitoring system thatcan be used for warning against driver inattention includ-ing drowsiness and distraction We proposed an algorithmthat automatically localizes the eyes determines whetherthey are opened or closed and finally judges whether thedriver is driving drowsily or distractedly This constitutes anonintrusive approach to detecting driver inattention withoutannoyance or interference in both daytime and nighttime
The framework consists of three steps The first stepinvolves eye detection and tracking In driving sequenceimages adaboost adaptive template-matching and blob-detection methods are combined to detect the eyes automat-ically Eye detection is verified using an eye-validation tech-nique based on PCA + LDA and SVM The proposed eyedetector works well when the driver closes his or her eyes orwears eyeglasses and sunglasses High detection rates wereachieved in tests carried out on 12 people in the database
Table 14 Processing time of proposed driver monitoring system
Process Processing time (msframe)
Eye adaboost 231
Adaptive template matching 07
Blob detector 12
Eye validation by using SVM 22
Total eye detection 145
Eye states detection 24
Head pose estimationa 141
Total processing time 31
aReference 39
during both daytime and nighttime as well as when wearingsunglasses or eyeglasses
The second step is a process for classifying eyes as openedor closed For this purpose appearance-based features are ex-tracted from the detected eye image by PCA + LDA andedge-based features are obtained on the basis of sparsenessand kurtosis The detected eyes are then classified as openor closed by an SVM using the combined features We con-firmed that performance of the combined system is betterthan that of a single system Experimental results revealedthat the classification error rate in the databases was lt3during both daytime and nighttime as well as when wearingsunglasses or eyeglasses
The third step is a process for measuring the drowsinessand distraction levels of the driver In this process we pro-posed a method for checking these two conditions simultane-ously Two measures PERCLOS and PERLOOK are used tocalculate the drowsiness and distraction levels respectivelyand they yield satisfactory results
In the future we plan to conduct tests with a greater num-ber of users and over longer periods of time in order to obtainactual drowsy and distracted behaviors From the viewpointof gaze estimation we need to develop a precise gaze-estimation method using both head-pose and eye-movementinformation In the drowsy driverndashdetection method facialexpression recognition must be employed to distinguisheyes closed due to fatigue from those closed due to vigorouslaughter Moreover because eye size eye blinking frequencyand driving habits vary among drivers we need to developa driver-specific monitoring system using an online trainingmethod This system will exhibit better performance if it isintegrated with other sensors such as the accelerator steeringwheel and lane-position sensor Finally an integrated driv-ing safety system will be more effective when combined witha pedestrian-recognition system and a lane-keeping supportsystem
AcknowledgmentsThis work was supported in part by Mando Corporation LtdAnd in part by the National Research Foundation of Korea(NRF) grant funded by the Korea government (MEST) (GrantNo 2011-0015321)
References1 M R Rosekind E L Co K B Gregory and D L Miller ldquoCrew
factors in flight operations XIII a survey of fatigue factors incorporateexecutive aviation operationsrdquo NASA Ames Research Cen-ter NASATM-2000-209 610 (2000)
2 Awake Consortium (IST 2000-28062) ldquoSystem for effective assess-ment of driver vigilance and warning according to traffic risk estima-
Optical Engineering December 2011Vol 50(12)127202-22
Jo et al Vision-based method for detecting driver drowsiness and distraction
tion (AWAKE)rdquo September 2001ndash2004 lthttpwwwawake-euorggt(April 16 2011)
3 US Department of Transportation ldquo2007 FARSGES an-nual report (final ed)rdquo lthttpwwwnhtsadotgovportalsitenhtsamenuitem6a6eaf83cf719ad24ec86e10dba046a0gt (April 16 2011)
4 W Wierwille L Tijerina S Kiger T Rockwell E Lauber andA Bittne ldquoFinal report supplementmdashheavy vehicle driver workloadassessmentmdashtask 4 review of workload and related researchrdquo USDOTTech Rep No DOT HS 808 467(4) (1996)
5 H Saito T Ishiwaka M Sakata and S Okabayashi ldquoApplicationsof driverrsquos line of sight to automobilesmdashwhat can driverrsquos eye tellrdquo inProc of Vehicle Navigation and Information Systems Conf Yokohamapp 21ndash26 (1994)
6 H Ueno M Kaneda and M Tsukino ldquoDevelopment of drowsiness de-tection systemrdquo in Proc of Vehicle Navigation and Information SystemsConf Yokohama pp 15ndash20 (1994)
7 S Boverie J M Leqellec and A Hirl ldquoIntelligent systems for videomonitoring of vehicle cockpitrdquo in Proc of Int Congress and Exposi-tion ITS Advanced Controls and Vehicle Navigation Systems pp 1ndash5(1998)
8 M Kaneda H Ueno and M Tsukino ldquoDevelopment of a drowsinesswarning systemrdquo in Proc of 11th Int Conf on Enhanced Safety ofVehicle Munich (1994)
9 R Onken ldquoDaisy an adaptive knowledge-based driver monitoring andwarning systemrdquo in Proc of Vehicle Navigation and Information Sys-tems Conf Yokohama pp 3ndash10 (1994)
10 T Ishii M Hirose and H Iwata ldquoAutomatic recognition of driverrsquos fa-cial expression by image analysisrdquo Journal of the Society of AutomotiveEngineers of Japan Vol 41 pp 1398ndash1403 (1987)
11 K Yammamoto and S Higuchi ldquoDevelopment of a drowsiness warningsystemrdquo Journal of the Society of Automotive Engineers of JapanVol 46 pp 127ndash133 (1992)
12 D F Dinges M Mallis G Maislin and J W Powell ldquoEval-uation of techniques for ocular measurement as an index offatigue and the basis for alertness managementrdquo Departmentof Transportation Highway Safety Publication 808 762 April(1998)
13 R Grace V E Byrne D M Bierman and J M Legrand ldquoA drowsydriver detection system for heavy vehiclesrdquo in Proceedings of Digi-tal Avionics Systems Conference 17th DASC Vol 2 pp I361ndashI368(1998)
14 D Cleveland ldquoUnobtrusive eyelid closure and visual of regard mea-surement systemrdquo Conference on Ocular Measures of Driver alertnessApril (1999)
15 J Fukuda K Adachi M Nishida and E Akutsu ldquoDevelopment ofdriverrsquos drowsiness detection technologyrdquo Toyota Tech Rev 45 34ndash40(1995)
16 J H Richardson ldquoThe development of a driver alertness monitoringsystemrdquo in Fatigue and Driving Driver Impairment Driver Fatigueand Driver Simulation L Harrtley Ed Taylor amp Francis London(1995)
17 T DrsquoOrazio M Leo C Guaragnella and A Distante ldquoA visual ap-proach for driver inattention detectionrdquo Pattern Recogn 40 2341ndash2355(2007)
18 E Murphy-Chutorian and M M Trivedi ldquoHead pose estimation incomputer vision a surveyrdquo IEEE Trans Pattern Anal Mach Intell31(4) 607ndash626 (2009)
19 D W Hansen and Q Ji ldquoIn the eye of the beholder a survey of modelsfor eyes and gazerdquo IEEE Trans Pattern Anal Mach Intell 32 478ndash500(2010)
20 A Hattori S Tokoro M Miyashita I Tanakam K Ohue and SUozumi ldquoDevelopment of forward collision warning system using thedriver behavioral informationrdquo presented at 2006 SAE World CongressDetroit Michigan (2006)
21 E Murphy-Chutorian A Doshi and M M Trivedi ldquoHead pose estima-tion for driver assistance systems a robust algorithm and experimentalevaluationrdquo in Proc of 10th Int IEEE Conf Intelligent TransportationSystems pp 709ndash714 (2007)
22 P Smith M Shah and N da Vitoria Lobo ldquoDetermining driver vi-sual attention with one camerardquo IEEE Trans Intell Transp Syst 4(4)2058ndash2218 (2003)
23 J Y Kaminski D Knaan and A Shavit ldquoSingle image face orientationand gaze detectionrdquo Mach Vis Appl 21 85ndash98 (2009)
24 J C Stutts D W Reinfurt L Staplin and E A Rodgman ldquoThe roleof driver distraction in traffic crashesrdquo AAA Foundation for TrafficSafety Washington DC (2001)
25 K Torkkola N Massey and C Wood ldquoDriver inattention detectionthrough intelligent analysis of readily available sensorsrdquo in Proc ofIEEE Conf on Intelligent Transportation Systems Washington DCpp 326ndash331 (2004)
26 G Yang Y Lin and P Bhattacharya ldquoA driver fatigue recogni-tion model using fusion of multiple featuresrdquo in Proc of IEEE IntConf on Syst Man and Cybernetics Hawaii Vol 2 pp 1777ndash1784(2005)
27 S Park and M M Trivedi ldquoDriver activity analysis for in-telligent vehicles issues and development frameworkrdquo in Proc
of IEEE Intelligent Vehicles Symp Las Vegas pp 795ndash800(2005)
28 E Vural M Cetin A Ercil G Littlewort M S Bartlett and J RMovellan ldquoDrowsy driver detection though facial movement analysisrdquoIEEE Int Conf on Computer VisionndashHuman Computer Interaction pp6ndash18 (2007)
29 M Saradadevi and P Bajaj ldquoDriver fatigue detection using mouth andyawning analysisrdquo Int J Comput Sci Netw Security 8(6) 183ndash188(2008)
30 L M Beragasa J Nuevo M A Sotelo R Barea and E LopezldquoReal-time system for monitoring driver vigilancerdquo IEEE Trans IntellTransport Syst 7(1) 1524ndash1538 (2006)
31 R Senaratne D Hardy B Vanderaa and S Halgamuge ldquoDriver fatiguedetection by fusing multiple cuesrdquo Lect Notes Comput Sci 4492 801ndash809 (2007)
32 K Kircher A Kircher and F Claezon ldquoDistraction and drowsinessmdashafield studyrdquo Tech Rep VTI (The Swedish National Road and TransportResearch Institute) (2009)
33 S J Lee J Jo H G Jung K R Park and J Kim ldquoReal-time gaze es-timator based on driverrsquos head orientation for forward collision warningsystemrdquo IEEE Trans Intell Transp Syst 12(1) 254ndash267 (2011)
34 Specification of illuminator lthttproithner-lasercommultiled_multi_tohtmlge (July 25 2011)
35 Camera (EC650) lthttpwwwpyramidimagingcomspecsProsilica700009AA-EC65020User20Manualpdfgt (August 25 2011)
36 Camera lens (ML0614) lthttpwwwphoeniximagingcomml-0614htmge (July 25 2011)
37 Narrow bandpass interference filter (NT43-148) lthttpwwwedmundopticscomonlinecatalogdisplayproductcfmproductid=3198ampPageNum=5ampSort=displayOrderampOrder=ascproductsgt (July 252011)
38 SUV (GIA motors Sportage) lthttpwwwkiacomsportageexploregt (August 25 2011)
39 Sedan (Hyundai Motors Grandeur) lthttpgrandeurhyundaicomge(August 25 2011)
40 T Ito S Mita K Kozuka T Nakano and S Yamamoto ldquoDriver blinkmeasurement by the motion picture processing and its application todrowsiness detectionrdquo in Proc of Int Conf Intelligent TransportationSystems Singapore pp 168ndash173 (2002)
41 K Ohue Y Yamada S Uozumi S Tokoro A Hattori and T HayashildquoDevelopment of a new pre-crash safety systemrdquo SAE Tech PaperSeries Doc No 2006-01-1461 (2006)
42 Specification of motion tracking device called Patriot lthttpwwwpolhemuscompolhemus_editorassetsTech20compare20with20ResolutionvsRange20graphspdfgt (February 15 2011)
43 W J Scheirer A Rocha B Heflin and T E Boult ldquoDifficult detectiona comparison of two different approaches to eye detection for uncon-strained environmentsrdquo in Proc of IEEE 3rd Int Conf on BiometricsTheory Applications and Systems pp 1ndash8 (2009)
44 C Whitelam Z Jafri and T Bourlai ldquoMultispectral eye detection apreliminary studyrdquo in Proc of 2010 Int Conf on Pattern Recognitionpp 209ndash212 (2010)
45 P Viola and M Jones ldquoRapid object detection using a boosted cascadeof simple featuresrdquo in Proc of IEEE CVPR Vol 1 pp I-511ndashI-518(2001)
46 S D Wei and S H Lai ldquoFast template matching based on normalizedcross correlation with adaptive multilevel winner updaterdquo IEEE TransImage Process 17(11) 2227ndash2235 (2008)
47 Open source of blob detection lthttpopencvwillowgaragecomwikicvBlobsLibAlgorithmgt (July 30 2011)
48 R C Gonzalez and R E Woods Digital Image Processing 2nd edpp 523ndash532 Prentice-Hall Englewood Cliffs NJ (2002)
49 G Donato M S Bartlett J C Hager P Ekman and T J SejnowskildquoClassifying facial actionsrdquo IEEE Trans Pattern Anal Mach Intell21 974ndash989 (1999)
50 P N Bellhumeur J P Hespanha and D J Kriegman ldquoEigenfaces vsfisherfaces recognition using class specific linear projectionrdquo IEEETrans Pattern Anal Mach Intell 19 711ndash720 (1997)
51 A M Martinez and A C Kak ldquoPCA versus LDArdquo IEEE Trans PatternAnal Mach Intell 23 228ndash233 (2001)
52 M Turk and A Pentland ldquoEigenfaces for recognitionrdquo J CognitiveNeuro-sci 3 71ndash86 (1991)
53 H Deng L Jin L Zhen and J Huang ldquoA new facial expressionrecognition method nased on local gabor filter bank and PCA plusLDArdquo in Proc of Int Conf on Intelligent Computing August 23ndash26Hefei China pp 6ndash7 (2005)
54 V Vapnik ldquoSupport vector estimation of functionsrdquo in StatisticalLearning Theory pp 375ndash570 Wiley Hoboken NJ (1998)
55 C Hsu C Chang and C Lin ldquoA practical guide to supportvector classificationrdquo Tech Rep Department of Computer Sci-ence and Information Engineering National Taiwan UniversityTaipei lthttpwcsieorg˜cjlinpapersguideguidepdfgt (March 23(2011)
56 L Lang and H Qi ldquoThe study of driver fatigue monitor algorithmcombined PERCLOS and AECSrdquo in Proc of Int Conf on ComputSci and Software Eng pp 349ndash352 (2008)
Optical Engineering December 2011Vol 50(12)127202-23
Jo et al Vision-based method for detecting driver drowsiness and distraction
57 L Harley T Horberry N Mabbott and G Krueger ldquoReview of fa-tigue detection and prediction technologiesrdquo National Road TransportCommission (2000)
58 R Jain R Kasturi and B G Schunck Machine Vision pp 78ndash84McGraw-Hill New York (1995)
59 P O Hoyer ldquoNon-negative matrix factorization with sparseness con-straintsrdquo J Mach Learning Res 5 1457ndash1469 (2004)
60 A Hyvarinen and E Oja ldquoIndependent component analysisrdquo NeuralNetw 13(4ndash5) 411ndash430 (2000)
61 Q Ji and X Yang ldquoReal-time eye gaze and face pose tracking formonitoring driver vigilancerdquo Real-Time Imaging 8(5) 357ndash377 (2002)
62 D F Dinges M M Mallis G Maislin and J W Powell ldquoEvaluationof techniques for ocular measurement as an index of fatigue and thebasis for alertness managementrdquo US Department of TransportationNational Highway Traffic Safety Administration DOT HS 808 762(1998)
63 Smart Eye Pro lthttpwwwsmarteyesegt (25 July 2011)64 S Kawato and J Ohya ldquoReal-time detection of nodding and head-
shaking by directly detecting and tracking the between-eyesrdquo in Procof 4th Intrsquol IEEE Conf Automatic Face and Gesture Recognitionpp 40ndash45 (2000)
65 B Ma S Shan X Chen and W Gao ldquoHead yaw estimation fromasymmetry of facial appearancerdquo IEEE Trans Syst Man Cybern PartB 38(6) 1501ndash1512 (2008)
66 P Watta S Lakshmanan and Y Hou ldquoNonparametric approaches forestimating driver poserdquo IEEE Trans Vehicular Technol 56(4) 2028ndash2041 (2007)
67 J Wu and M M Trivedi ldquoA two-stage head pose estimation frameworkand evaluationrdquo Pattern Recogn 41 1138ndash1158 (2008)
68 E Murphy-Chutorian and M M Trivedi ldquoHyHOPE hybrid head ori-entation and position estimation for vision-based driver head trackingrdquoin Proc of IEEE Intell Vehicles Symp pp 512ndash517 (2008)
69 J P Batista ldquoA real-time driver visual attention monitoring systemrdquoLect Notes Comput Sci 3522 200ndash208 (2005)
70 N K Ratha and V Govindaraju Advances in Biometrics SensorsAlgorithms and System Springer New York (2008)
Jaeik Jo received the BS in electricaland electronic engineering in 2008 fromYonsei University Seoul Korea where he iscurrently working toward the MS-PhD jointdegree His current research interests in-clude driver monitoring systems 3-D face re-construction biometrics pattern recognitionand computer vision
Sung Joo Lee received the BS in electri-cal and electronic engineering and the MSin biometric engineering in 2004 and 2006respectively from Yonsei University SeoulKorea where he received the PhD in elec-trical and electronic engineering in 2011 In2011 he joined the Mobis Co Ltd wherehe is currently an assistant research engi-neer His current research interests includemoving object detection driver monitoringsystem biometrics pattern recognition and
computer vision
Ho Gi Jung received the BE ME and PhDin electronic engineering from Yonsei Univer-sity Seoul Korea in 1995 1997 and 2008respectively He was with MANDO Corpora-tion Global RampD HQ from 1997 to April2009 He developed environmental recog-nition systems for intelligent parking assistsystem collision warning and avoidance sys-tem and active pedestrian protection sys-tem From May 2009 to February 2011 hewas with Yonsei University as a full-time re-
searcher and research professor He researched computer visionapplications for intelligent surveillance systems and biometric sys-tems Since March 2011 he has been with Hanyang University asan assistant professor He is researching recognition systems for in-telligent vehicles His interests are recognition system for intelligentvehicle next generation vehicle computer vision applications andpattern recognition applications
Kang Ryoung Park received his BS and MSin electronic engineering from Yonsei Uni-versity Seoul Korea in 1994 and 1996 re-spectively He also received his PhD in com-puter vision from the Department of Electricaland Computer Engineering Yonsei Univer-sity in 2000 He was an assistant professorin the Division of Digital Media Technologyat Sangmyung University from March 2003to February 2008 He has been an assis-tant and associate professor in the Division
of Electronics and Electrical Engineering at Dongguk University sinceMarch 2008 He is also a research member of BERC His researchinterests include computer vision image processing and biometrics
Jaihie Kim received the BS in electronic en-gineering from Yonsei University Republic ofKorea in 1979 the PhD in electrical engi-neering from the Case Western Reserve Uni-versity USA in 1984 Since 1984 he hasbeen a professor in the School of Electri-cal and Electronic Engineering Yonsei Uni-versity Currently he is the Director of theBiometric Engineering Research Center inKorea the Chairman of the Korea Biomet-ric Association a member of the National
Academy of Engineering of Korea and in 2008 he was the Presi-dent of the IEEK (Institute of Electronics Engineers of Korea) andnow an Emeritus President of the IEEK His general research inter-ests are biometrics pattern recognition and computer vision Specif-ically some of his recent research topics include touchless finger-print recognition fake fingerprint detection fake face detection 2D-to-3D face conversion face age estimationsynthesis He was theauthor of many international technical journals which could be foundat lsquohttpcherupyonseiackrrsquo
Optical Engineering December 2011Vol 50(12)127202-24
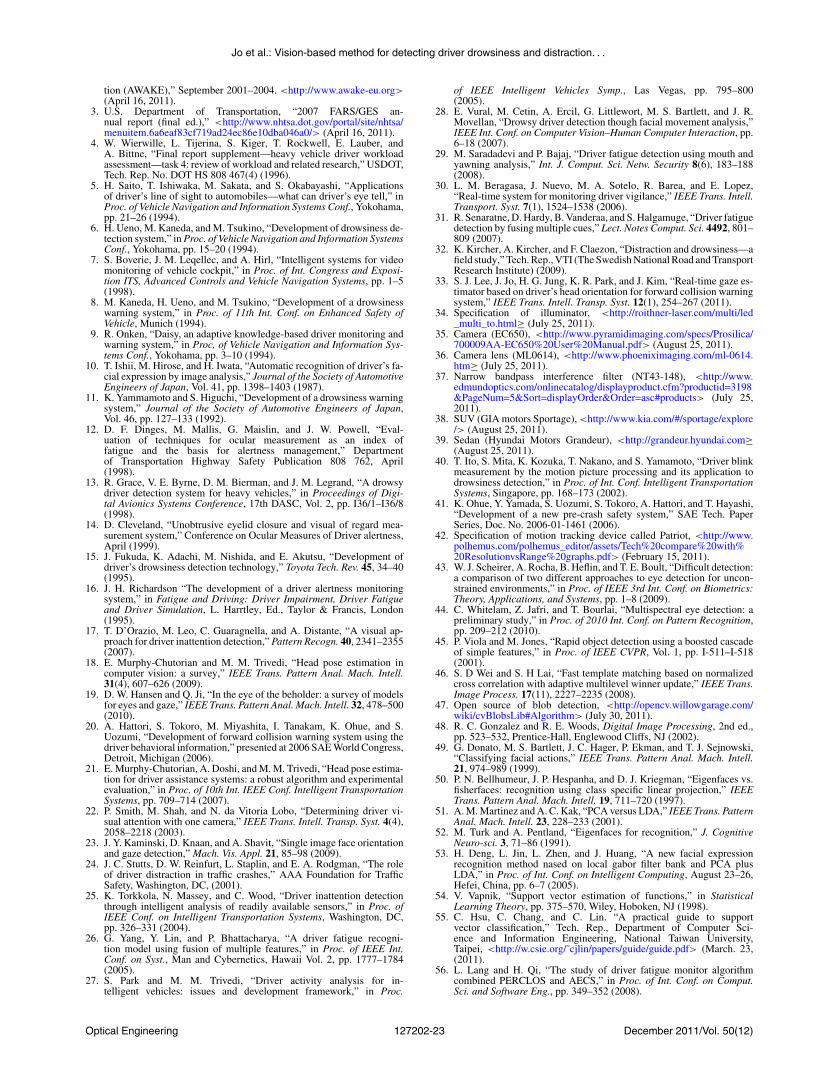
Jo et al Vision-based method for detecting driver drowsiness and distraction
tion (AWAKE)rdquo September 2001ndash2004 lthttpwwwawake-euorggt(April 16 2011)
3 US Department of Transportation ldquo2007 FARSGES an-nual report (final ed)rdquo lthttpwwwnhtsadotgovportalsitenhtsamenuitem6a6eaf83cf719ad24ec86e10dba046a0gt (April 16 2011)
4 W Wierwille L Tijerina S Kiger T Rockwell E Lauber andA Bittne ldquoFinal report supplementmdashheavy vehicle driver workloadassessmentmdashtask 4 review of workload and related researchrdquo USDOTTech Rep No DOT HS 808 467(4) (1996)
5 H Saito T Ishiwaka M Sakata and S Okabayashi ldquoApplicationsof driverrsquos line of sight to automobilesmdashwhat can driverrsquos eye tellrdquo inProc of Vehicle Navigation and Information Systems Conf Yokohamapp 21ndash26 (1994)
6 H Ueno M Kaneda and M Tsukino ldquoDevelopment of drowsiness de-tection systemrdquo in Proc of Vehicle Navigation and Information SystemsConf Yokohama pp 15ndash20 (1994)
7 S Boverie J M Leqellec and A Hirl ldquoIntelligent systems for videomonitoring of vehicle cockpitrdquo in Proc of Int Congress and Exposi-tion ITS Advanced Controls and Vehicle Navigation Systems pp 1ndash5(1998)
8 M Kaneda H Ueno and M Tsukino ldquoDevelopment of a drowsinesswarning systemrdquo in Proc of 11th Int Conf on Enhanced Safety ofVehicle Munich (1994)
9 R Onken ldquoDaisy an adaptive knowledge-based driver monitoring andwarning systemrdquo in Proc of Vehicle Navigation and Information Sys-tems Conf Yokohama pp 3ndash10 (1994)
10 T Ishii M Hirose and H Iwata ldquoAutomatic recognition of driverrsquos fa-cial expression by image analysisrdquo Journal of the Society of AutomotiveEngineers of Japan Vol 41 pp 1398ndash1403 (1987)
11 K Yammamoto and S Higuchi ldquoDevelopment of a drowsiness warningsystemrdquo Journal of the Society of Automotive Engineers of JapanVol 46 pp 127ndash133 (1992)
12 D F Dinges M Mallis G Maislin and J W Powell ldquoEval-uation of techniques for ocular measurement as an index offatigue and the basis for alertness managementrdquo Departmentof Transportation Highway Safety Publication 808 762 April(1998)
13 R Grace V E Byrne D M Bierman and J M Legrand ldquoA drowsydriver detection system for heavy vehiclesrdquo in Proceedings of Digi-tal Avionics Systems Conference 17th DASC Vol 2 pp I361ndashI368(1998)
14 D Cleveland ldquoUnobtrusive eyelid closure and visual of regard mea-surement systemrdquo Conference on Ocular Measures of Driver alertnessApril (1999)
15 J Fukuda K Adachi M Nishida and E Akutsu ldquoDevelopment ofdriverrsquos drowsiness detection technologyrdquo Toyota Tech Rev 45 34ndash40(1995)
16 J H Richardson ldquoThe development of a driver alertness monitoringsystemrdquo in Fatigue and Driving Driver Impairment Driver Fatigueand Driver Simulation L Harrtley Ed Taylor amp Francis London(1995)
17 T DrsquoOrazio M Leo C Guaragnella and A Distante ldquoA visual ap-proach for driver inattention detectionrdquo Pattern Recogn 40 2341ndash2355(2007)
18 E Murphy-Chutorian and M M Trivedi ldquoHead pose estimation incomputer vision a surveyrdquo IEEE Trans Pattern Anal Mach Intell31(4) 607ndash626 (2009)
19 D W Hansen and Q Ji ldquoIn the eye of the beholder a survey of modelsfor eyes and gazerdquo IEEE Trans Pattern Anal Mach Intell 32 478ndash500(2010)
20 A Hattori S Tokoro M Miyashita I Tanakam K Ohue and SUozumi ldquoDevelopment of forward collision warning system using thedriver behavioral informationrdquo presented at 2006 SAE World CongressDetroit Michigan (2006)
21 E Murphy-Chutorian A Doshi and M M Trivedi ldquoHead pose estima-tion for driver assistance systems a robust algorithm and experimentalevaluationrdquo in Proc of 10th Int IEEE Conf Intelligent TransportationSystems pp 709ndash714 (2007)
22 P Smith M Shah and N da Vitoria Lobo ldquoDetermining driver vi-sual attention with one camerardquo IEEE Trans Intell Transp Syst 4(4)2058ndash2218 (2003)
23 J Y Kaminski D Knaan and A Shavit ldquoSingle image face orientationand gaze detectionrdquo Mach Vis Appl 21 85ndash98 (2009)
24 J C Stutts D W Reinfurt L Staplin and E A Rodgman ldquoThe roleof driver distraction in traffic crashesrdquo AAA Foundation for TrafficSafety Washington DC (2001)
25 K Torkkola N Massey and C Wood ldquoDriver inattention detectionthrough intelligent analysis of readily available sensorsrdquo in Proc ofIEEE Conf on Intelligent Transportation Systems Washington DCpp 326ndash331 (2004)
26 G Yang Y Lin and P Bhattacharya ldquoA driver fatigue recogni-tion model using fusion of multiple featuresrdquo in Proc of IEEE IntConf on Syst Man and Cybernetics Hawaii Vol 2 pp 1777ndash1784(2005)
27 S Park and M M Trivedi ldquoDriver activity analysis for in-telligent vehicles issues and development frameworkrdquo in Proc
of IEEE Intelligent Vehicles Symp Las Vegas pp 795ndash800(2005)
28 E Vural M Cetin A Ercil G Littlewort M S Bartlett and J RMovellan ldquoDrowsy driver detection though facial movement analysisrdquoIEEE Int Conf on Computer VisionndashHuman Computer Interaction pp6ndash18 (2007)
29 M Saradadevi and P Bajaj ldquoDriver fatigue detection using mouth andyawning analysisrdquo Int J Comput Sci Netw Security 8(6) 183ndash188(2008)
30 L M Beragasa J Nuevo M A Sotelo R Barea and E LopezldquoReal-time system for monitoring driver vigilancerdquo IEEE Trans IntellTransport Syst 7(1) 1524ndash1538 (2006)
31 R Senaratne D Hardy B Vanderaa and S Halgamuge ldquoDriver fatiguedetection by fusing multiple cuesrdquo Lect Notes Comput Sci 4492 801ndash809 (2007)
32 K Kircher A Kircher and F Claezon ldquoDistraction and drowsinessmdashafield studyrdquo Tech Rep VTI (The Swedish National Road and TransportResearch Institute) (2009)
33 S J Lee J Jo H G Jung K R Park and J Kim ldquoReal-time gaze es-timator based on driverrsquos head orientation for forward collision warningsystemrdquo IEEE Trans Intell Transp Syst 12(1) 254ndash267 (2011)
34 Specification of illuminator lthttproithner-lasercommultiled_multi_tohtmlge (July 25 2011)
35 Camera (EC650) lthttpwwwpyramidimagingcomspecsProsilica700009AA-EC65020User20Manualpdfgt (August 25 2011)
36 Camera lens (ML0614) lthttpwwwphoeniximagingcomml-0614htmge (July 25 2011)
37 Narrow bandpass interference filter (NT43-148) lthttpwwwedmundopticscomonlinecatalogdisplayproductcfmproductid=3198ampPageNum=5ampSort=displayOrderampOrder=ascproductsgt (July 252011)
38 SUV (GIA motors Sportage) lthttpwwwkiacomsportageexploregt (August 25 2011)
39 Sedan (Hyundai Motors Grandeur) lthttpgrandeurhyundaicomge(August 25 2011)
40 T Ito S Mita K Kozuka T Nakano and S Yamamoto ldquoDriver blinkmeasurement by the motion picture processing and its application todrowsiness detectionrdquo in Proc of Int Conf Intelligent TransportationSystems Singapore pp 168ndash173 (2002)
41 K Ohue Y Yamada S Uozumi S Tokoro A Hattori and T HayashildquoDevelopment of a new pre-crash safety systemrdquo SAE Tech PaperSeries Doc No 2006-01-1461 (2006)
42 Specification of motion tracking device called Patriot lthttpwwwpolhemuscompolhemus_editorassetsTech20compare20with20ResolutionvsRange20graphspdfgt (February 15 2011)
43 W J Scheirer A Rocha B Heflin and T E Boult ldquoDifficult detectiona comparison of two different approaches to eye detection for uncon-strained environmentsrdquo in Proc of IEEE 3rd Int Conf on BiometricsTheory Applications and Systems pp 1ndash8 (2009)
44 C Whitelam Z Jafri and T Bourlai ldquoMultispectral eye detection apreliminary studyrdquo in Proc of 2010 Int Conf on Pattern Recognitionpp 209ndash212 (2010)
45 P Viola and M Jones ldquoRapid object detection using a boosted cascadeof simple featuresrdquo in Proc of IEEE CVPR Vol 1 pp I-511ndashI-518(2001)
46 S D Wei and S H Lai ldquoFast template matching based on normalizedcross correlation with adaptive multilevel winner updaterdquo IEEE TransImage Process 17(11) 2227ndash2235 (2008)
47 Open source of blob detection lthttpopencvwillowgaragecomwikicvBlobsLibAlgorithmgt (July 30 2011)
48 R C Gonzalez and R E Woods Digital Image Processing 2nd edpp 523ndash532 Prentice-Hall Englewood Cliffs NJ (2002)
49 G Donato M S Bartlett J C Hager P Ekman and T J SejnowskildquoClassifying facial actionsrdquo IEEE Trans Pattern Anal Mach Intell21 974ndash989 (1999)
50 P N Bellhumeur J P Hespanha and D J Kriegman ldquoEigenfaces vsfisherfaces recognition using class specific linear projectionrdquo IEEETrans Pattern Anal Mach Intell 19 711ndash720 (1997)
51 A M Martinez and A C Kak ldquoPCA versus LDArdquo IEEE Trans PatternAnal Mach Intell 23 228ndash233 (2001)
52 M Turk and A Pentland ldquoEigenfaces for recognitionrdquo J CognitiveNeuro-sci 3 71ndash86 (1991)
53 H Deng L Jin L Zhen and J Huang ldquoA new facial expressionrecognition method nased on local gabor filter bank and PCA plusLDArdquo in Proc of Int Conf on Intelligent Computing August 23ndash26Hefei China pp 6ndash7 (2005)
54 V Vapnik ldquoSupport vector estimation of functionsrdquo in StatisticalLearning Theory pp 375ndash570 Wiley Hoboken NJ (1998)
55 C Hsu C Chang and C Lin ldquoA practical guide to supportvector classificationrdquo Tech Rep Department of Computer Sci-ence and Information Engineering National Taiwan UniversityTaipei lthttpwcsieorg˜cjlinpapersguideguidepdfgt (March 23(2011)
56 L Lang and H Qi ldquoThe study of driver fatigue monitor algorithmcombined PERCLOS and AECSrdquo in Proc of Int Conf on ComputSci and Software Eng pp 349ndash352 (2008)
Optical Engineering December 2011Vol 50(12)127202-23
Jo et al Vision-based method for detecting driver drowsiness and distraction
57 L Harley T Horberry N Mabbott and G Krueger ldquoReview of fa-tigue detection and prediction technologiesrdquo National Road TransportCommission (2000)
58 R Jain R Kasturi and B G Schunck Machine Vision pp 78ndash84McGraw-Hill New York (1995)
59 P O Hoyer ldquoNon-negative matrix factorization with sparseness con-straintsrdquo J Mach Learning Res 5 1457ndash1469 (2004)
60 A Hyvarinen and E Oja ldquoIndependent component analysisrdquo NeuralNetw 13(4ndash5) 411ndash430 (2000)
61 Q Ji and X Yang ldquoReal-time eye gaze and face pose tracking formonitoring driver vigilancerdquo Real-Time Imaging 8(5) 357ndash377 (2002)
62 D F Dinges M M Mallis G Maislin and J W Powell ldquoEvaluationof techniques for ocular measurement as an index of fatigue and thebasis for alertness managementrdquo US Department of TransportationNational Highway Traffic Safety Administration DOT HS 808 762(1998)
63 Smart Eye Pro lthttpwwwsmarteyesegt (25 July 2011)64 S Kawato and J Ohya ldquoReal-time detection of nodding and head-
shaking by directly detecting and tracking the between-eyesrdquo in Procof 4th Intrsquol IEEE Conf Automatic Face and Gesture Recognitionpp 40ndash45 (2000)
65 B Ma S Shan X Chen and W Gao ldquoHead yaw estimation fromasymmetry of facial appearancerdquo IEEE Trans Syst Man Cybern PartB 38(6) 1501ndash1512 (2008)
66 P Watta S Lakshmanan and Y Hou ldquoNonparametric approaches forestimating driver poserdquo IEEE Trans Vehicular Technol 56(4) 2028ndash2041 (2007)
67 J Wu and M M Trivedi ldquoA two-stage head pose estimation frameworkand evaluationrdquo Pattern Recogn 41 1138ndash1158 (2008)
68 E Murphy-Chutorian and M M Trivedi ldquoHyHOPE hybrid head ori-entation and position estimation for vision-based driver head trackingrdquoin Proc of IEEE Intell Vehicles Symp pp 512ndash517 (2008)
69 J P Batista ldquoA real-time driver visual attention monitoring systemrdquoLect Notes Comput Sci 3522 200ndash208 (2005)
70 N K Ratha and V Govindaraju Advances in Biometrics SensorsAlgorithms and System Springer New York (2008)
Jaeik Jo received the BS in electricaland electronic engineering in 2008 fromYonsei University Seoul Korea where he iscurrently working toward the MS-PhD jointdegree His current research interests in-clude driver monitoring systems 3-D face re-construction biometrics pattern recognitionand computer vision
Sung Joo Lee received the BS in electri-cal and electronic engineering and the MSin biometric engineering in 2004 and 2006respectively from Yonsei University SeoulKorea where he received the PhD in elec-trical and electronic engineering in 2011 In2011 he joined the Mobis Co Ltd wherehe is currently an assistant research engi-neer His current research interests includemoving object detection driver monitoringsystem biometrics pattern recognition and
computer vision
Ho Gi Jung received the BE ME and PhDin electronic engineering from Yonsei Univer-sity Seoul Korea in 1995 1997 and 2008respectively He was with MANDO Corpora-tion Global RampD HQ from 1997 to April2009 He developed environmental recog-nition systems for intelligent parking assistsystem collision warning and avoidance sys-tem and active pedestrian protection sys-tem From May 2009 to February 2011 hewas with Yonsei University as a full-time re-
searcher and research professor He researched computer visionapplications for intelligent surveillance systems and biometric sys-tems Since March 2011 he has been with Hanyang University asan assistant professor He is researching recognition systems for in-telligent vehicles His interests are recognition system for intelligentvehicle next generation vehicle computer vision applications andpattern recognition applications
Kang Ryoung Park received his BS and MSin electronic engineering from Yonsei Uni-versity Seoul Korea in 1994 and 1996 re-spectively He also received his PhD in com-puter vision from the Department of Electricaland Computer Engineering Yonsei Univer-sity in 2000 He was an assistant professorin the Division of Digital Media Technologyat Sangmyung University from March 2003to February 2008 He has been an assis-tant and associate professor in the Division
of Electronics and Electrical Engineering at Dongguk University sinceMarch 2008 He is also a research member of BERC His researchinterests include computer vision image processing and biometrics
Jaihie Kim received the BS in electronic en-gineering from Yonsei University Republic ofKorea in 1979 the PhD in electrical engi-neering from the Case Western Reserve Uni-versity USA in 1984 Since 1984 he hasbeen a professor in the School of Electri-cal and Electronic Engineering Yonsei Uni-versity Currently he is the Director of theBiometric Engineering Research Center inKorea the Chairman of the Korea Biomet-ric Association a member of the National
Academy of Engineering of Korea and in 2008 he was the Presi-dent of the IEEK (Institute of Electronics Engineers of Korea) andnow an Emeritus President of the IEEK His general research inter-ests are biometrics pattern recognition and computer vision Specif-ically some of his recent research topics include touchless finger-print recognition fake fingerprint detection fake face detection 2D-to-3D face conversion face age estimationsynthesis He was theauthor of many international technical journals which could be foundat lsquohttpcherupyonseiackrrsquo
Optical Engineering December 2011Vol 50(12)127202-24
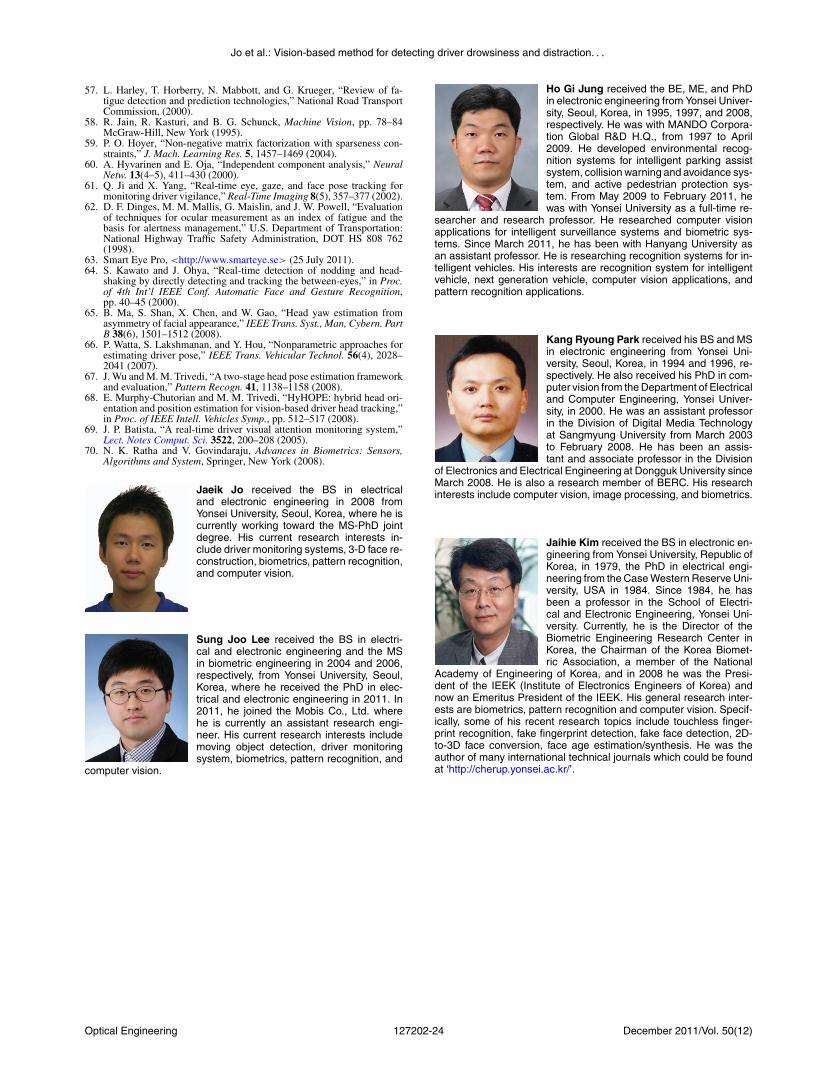
Jo et al Vision-based method for detecting driver drowsiness and distraction
57 L Harley T Horberry N Mabbott and G Krueger ldquoReview of fa-tigue detection and prediction technologiesrdquo National Road TransportCommission (2000)
58 R Jain R Kasturi and B G Schunck Machine Vision pp 78ndash84McGraw-Hill New York (1995)
59 P O Hoyer ldquoNon-negative matrix factorization with sparseness con-straintsrdquo J Mach Learning Res 5 1457ndash1469 (2004)
60 A Hyvarinen and E Oja ldquoIndependent component analysisrdquo NeuralNetw 13(4ndash5) 411ndash430 (2000)
61 Q Ji and X Yang ldquoReal-time eye gaze and face pose tracking formonitoring driver vigilancerdquo Real-Time Imaging 8(5) 357ndash377 (2002)
62 D F Dinges M M Mallis G Maislin and J W Powell ldquoEvaluationof techniques for ocular measurement as an index of fatigue and thebasis for alertness managementrdquo US Department of TransportationNational Highway Traffic Safety Administration DOT HS 808 762(1998)
63 Smart Eye Pro lthttpwwwsmarteyesegt (25 July 2011)64 S Kawato and J Ohya ldquoReal-time detection of nodding and head-
shaking by directly detecting and tracking the between-eyesrdquo in Procof 4th Intrsquol IEEE Conf Automatic Face and Gesture Recognitionpp 40ndash45 (2000)
65 B Ma S Shan X Chen and W Gao ldquoHead yaw estimation fromasymmetry of facial appearancerdquo IEEE Trans Syst Man Cybern PartB 38(6) 1501ndash1512 (2008)
66 P Watta S Lakshmanan and Y Hou ldquoNonparametric approaches forestimating driver poserdquo IEEE Trans Vehicular Technol 56(4) 2028ndash2041 (2007)
67 J Wu and M M Trivedi ldquoA two-stage head pose estimation frameworkand evaluationrdquo Pattern Recogn 41 1138ndash1158 (2008)
68 E Murphy-Chutorian and M M Trivedi ldquoHyHOPE hybrid head ori-entation and position estimation for vision-based driver head trackingrdquoin Proc of IEEE Intell Vehicles Symp pp 512ndash517 (2008)
69 J P Batista ldquoA real-time driver visual attention monitoring systemrdquoLect Notes Comput Sci 3522 200ndash208 (2005)
70 N K Ratha and V Govindaraju Advances in Biometrics SensorsAlgorithms and System Springer New York (2008)
Jaeik Jo received the BS in electricaland electronic engineering in 2008 fromYonsei University Seoul Korea where he iscurrently working toward the MS-PhD jointdegree His current research interests in-clude driver monitoring systems 3-D face re-construction biometrics pattern recognitionand computer vision
Sung Joo Lee received the BS in electri-cal and electronic engineering and the MSin biometric engineering in 2004 and 2006respectively from Yonsei University SeoulKorea where he received the PhD in elec-trical and electronic engineering in 2011 In2011 he joined the Mobis Co Ltd wherehe is currently an assistant research engi-neer His current research interests includemoving object detection driver monitoringsystem biometrics pattern recognition and
computer vision
Ho Gi Jung received the BE ME and PhDin electronic engineering from Yonsei Univer-sity Seoul Korea in 1995 1997 and 2008respectively He was with MANDO Corpora-tion Global RampD HQ from 1997 to April2009 He developed environmental recog-nition systems for intelligent parking assistsystem collision warning and avoidance sys-tem and active pedestrian protection sys-tem From May 2009 to February 2011 hewas with Yonsei University as a full-time re-
searcher and research professor He researched computer visionapplications for intelligent surveillance systems and biometric sys-tems Since March 2011 he has been with Hanyang University asan assistant professor He is researching recognition systems for in-telligent vehicles His interests are recognition system for intelligentvehicle next generation vehicle computer vision applications andpattern recognition applications
Kang Ryoung Park received his BS and MSin electronic engineering from Yonsei Uni-versity Seoul Korea in 1994 and 1996 re-spectively He also received his PhD in com-puter vision from the Department of Electricaland Computer Engineering Yonsei Univer-sity in 2000 He was an assistant professorin the Division of Digital Media Technologyat Sangmyung University from March 2003to February 2008 He has been an assis-tant and associate professor in the Division
of Electronics and Electrical Engineering at Dongguk University sinceMarch 2008 He is also a research member of BERC His researchinterests include computer vision image processing and biometrics
Jaihie Kim received the BS in electronic en-gineering from Yonsei University Republic ofKorea in 1979 the PhD in electrical engi-neering from the Case Western Reserve Uni-versity USA in 1984 Since 1984 he hasbeen a professor in the School of Electri-cal and Electronic Engineering Yonsei Uni-versity Currently he is the Director of theBiometric Engineering Research Center inKorea the Chairman of the Korea Biomet-ric Association a member of the National
Academy of Engineering of Korea and in 2008 he was the Presi-dent of the IEEK (Institute of Electronics Engineers of Korea) andnow an Emeritus President of the IEEK His general research inter-ests are biometrics pattern recognition and computer vision Specif-ically some of his recent research topics include touchless finger-print recognition fake fingerprint detection fake face detection 2D-to-3D face conversion face age estimationsynthesis He was theauthor of many international technical journals which could be foundat lsquohttpcherupyonseiackrrsquo
Optical Engineering December 2011Vol 50(12)127202-24