vision 2 - sarep.ucdavis.edu
TRANSCRIPT

VISION 2: Healthy Local Food Economy
Background and National TrendsOver the past several decades, local food economies have grown as consumer demand for local food has risen.1
Although exact definitions of “local” vary, local food generally refers to food that is grown or pro-cessed within a few hundred miles of where it is consumed.
A wide range of businesses and organizations participate in local food economies. These include farms, processors, distributors, grocery stores, farmers markets, restaurants, schools, gardens, food banks, and others.
Some actors in the local food economy, such a smaller farms, farmers markets, or community gardens, participate primarily in local markets. Others—including larger farms, processors, and dis-tributors—also participate in national or international markets.
California and Kern County are both known for their contributions of fresh fruits, vegetables, nuts, and dairy to national and international markets. Over one third of the vegetables and two thirds of the fruits and nuts consumed in U.S. are grown in California,2 and some of the largest food manufac-turers in the world rely on Kern County’s agricultural abundance.3
This section, however, looks specifically at Kern County’s local food economy. This includes:
(a) those food production, distribution, and sales activities that serve local markets and
(b) local job opportunities in the Kern County food system.
1 Low, S. A., Adalja, A., Beaulieu, E., Key, N., Martinez, S., Melton, A., Perez, A., Ralston, K., Stewart, H., Suttles, S., Vogel, S., & Jablonski, B.B.R. (2015). Trends in US local and regional food systems: A report to Congress. Economic Research Service.
2 California Department of Food and Agriculture. (n.d.). California Department of Food and Agriculture 2015 Crop Year Report. Retrieved March 08, 2017, from https://www.cdfa.ca.gov/statistics/
3 Chapman, R., Holsonbake, C., & Evans, M. (2012). Kern County Labor Market Study. Kern County Economic Development Corporation.
Kern County Food System Assessment32
VISI
ON
2

National trends in food production, distribution, and salesOver the last decade, local food sales have increased across the country. Local foods can be pur-chased at many grocery stores, found in prepared meals at some schools and restaurants, and be purchased directly from local farms. The USDA defines local food sales as including both direct-to-consumer sales and sales through intermediaries, and both categories are growing.
Although a relatively small number of all farms sell local food directly to consumers, direct-to-consumer sales—including farm stands, U-picks, Community Supported Agriculture boxes (CSA), and farmers markets—are an important market channel for many farms, particularly smaller farms. Nationally, 70 percent of the farms that sell food locally only sell directly to consumers.
Most farms that sell directly to consumers (85 percent) are small, with a gross annual income of less than $75,000, and three quarters had annual direct sales of less than $5,000 in 2012. Although they are the most numerous type of farm selling locally, the total sales of these smaller farms only repre-sent 13 percent of total dollars spent on local food. Larger farms (those with a gross annual income of $350,000 and above), though making up just 5 percent of the total farms that sold products locally in 2012, represented 67 percent of all local food sales in the U.S.4 These mid-scale and larger farms are more likely to sell locally through intermediaries like distributors or food hubs, rather than sell-ing directly to consumers.
At most grocery stores and some farmers markets, consumers are able to use public benefits like the Supplemental Nutrition Assistance Program (SNAP) to purchase local foods. There are also a growing number of SNAP-based incentive programs, funded and managed by non-profits or local governments, which provide matching funds to consumers using SNAP benefits at farmers mar-kets.5 Consumers may also access local foods through community gardens, food banks, or Farm to School programs.
4 Low, S. A., Adalja, A., Beaulieu, E., Key, N., Martinez, S., Melton, A., Perez, A., Ralston, K., Stewart, H., Suttles, S., Vogel, S., & Jablonski, B.B.R. (2015). Trends in US local and regional food systems: A report to Congress. Economic Research Service.
5 USDA Food and Nutrition Services. (2014). Nutrition Assistance Program Report. Farmers Market Incentive Provider Study.
Locally produced nut butters at the Hen’s Roost in Bakersfield.PHOTO CREDIT: JILL EGLAND
Kern County Food System Assessment 33

National trends in job opportunities in the food system The food system is the largest source of employment in the U.S., currently employ-ing over 21 million workers (14 percent of all workers). Employment in the food system is also growing, increasing at a rate more than double that of all other industries for the past decade.6 These jobs, however, pay lower wages on average than jobs in other indus-tries, and food systems workers are twice as likely to rely on SNAP benefits as other workers.7
Kern County TrendsLocal food production, distribution, and sales
Total agricultural sales in Kern County have been on a steady increase since 2002 (See Goal 2.1) but trends in direct-to-consumer sales and number of farms have been more variable. Although sales almost doubled overall from 1997 to 2012, the number of farms with direct sales has declined. In 2012, the most recent year of data, 134 farms in Kern County sold directly to consumers, with aver-age direct sales per farm of $44,328, more than double the California average of $19,785 and four times the national average of $9,063.8
The number of farmers markets in Kern County decreased from 16 to 12 between 2013 and 2016, however two additional markets now accept SNAP benefits.
Institutions also participated in increasing sales in the local food economy. Only a handful of schools in Kern County reported participating in Farm to School activities in over the last five years, but those that did are buying approximately one third of their produce locally.
In addition to local food sales, community members also produce some of their own food. There are 16 community gardens in Kern County, most located in the Bakersfield area.
Farms also participate in non-economic activities in the food system by supporting food recovery and distribution. The total number of pounds of donated and gleaned food has continued to rise in Kern County from 2012 to 2015 (see Indicator 1.2c).
Job Opportunities in the food system
The food system is a huge part of the local economy in Kern County, providing almost a third (29 per-cent) of the county’s jobs, double the national average.
The largest sources of Kern County’s food systems jobs in 2014 were farm support services (includ-ing farmworkers, farm management, and farm labor contractors) and food service. As is true at the national level, wages in Kern County’s food system fall below all-industry averages, particularly in the subsectors with the most workers. In 2014, the average annual wage in the Kern County food system was $24,182, compared to $43,737 for all industries.
6 Food Chain Workers Alliance and Solidarity Research Cooperative. (2016). No Piece of the Pie: U.S. Food Workers in 2016. Los Angeles, CA: Food Chain Workers Alliance.
7 Ibid.
8 USDA National Agricultural Statistics Service. (2014). Farmers Marketing: Direct sales through markets, roadside stands, and other means up 8 percent since 2007 (2014). Agriculture Census Highlights (ACH) - 7. U.S.
PHO
TO C
RED
IT: S
USA
N R
EEP
VISI
ON
2:
HEA
LTH
Y LO
CAL
FOO
D E
CON
OM
Y
34 Kern County Food System Assessment

GOAL 2.1: Kern County improves regional economic opportunities for local food producers.
BackgroundIncreased consumer demand for local food has created new economic opportunities for food pro-ducers who are interesting in producing and marketing their products locally. There are a variety of marketing channels that connect producers and consumers of local foods, including direct-to-consumer sales, mediated sales through distributors, stores, or restaurants, and local sales to institutions like schools or hospitals.
EcoCentric FarmEcoCentric Farms was founded in 2011 by Kimberly and Shanta Jackson, and is based in Bakers-field. EcoCentric designs, constructs, and operates innovative aquaponic and hydroponic grow systems on both commercial and residential scales. They have expertise in several methods including nutrient film technique (NFT), deep water culture (DWC), the Kratky method of non-circulating hydroponics, aeroponics, and vertical gardening.
Their most productive system is a 4,000 plant/4,000 gallon vertical aquaponic grow system. It only uses 10% of the water used by traditional farms at the same scale, is 10 times more produc-tive per square foot than NFT, and generates its own organic fish feed and plant fertilizer.
EcoCentric Farms’ goal is to increase community access to sustainably grown organic produce and seafood. By making maximum use of natural resources, increasing yield per square foot, and distributing locally, they can offer healthy alternatives at comparable prices to conventionally farmed food.
Kale growing at EcoCentric Farms.PHOTO CREDIT: GAIL FEENSTRA
35Kern County Food System Assessment

The most direct way consumers can access local food is to purchase it from a local farm. A small but growing number of mostly smaller farms engage in direct-to-consumer sales, which may take place at the farm itself (via a farm stand or U-pick), at a farmers market, or through a Community Sup-ported Agriculture (CSA) subscription. In some cases these direct sales may result in higher profits for farms and lower prices for consumers due to reduced distribution costs. In other cases the pri-mary benefit of direct sales may be a marketing or relationship-building opportunity.
Local food is also sold to local markets through standard distribution channels, and can be purchased at some grocery stores and restaurants. Larger farms, though they do sometimes engage in direct sales, are more likely to contribute to local markets through a distributor or other intermediary.
Farm to School programs are another way that local food can reach local consumers. While some Farm to School programs may focus primarily on school gardens, farm tours, or nutrition education, many also promote the procurement of local food for school meals. School districts that prioritize local procurement can create new market opportunities for farms.
The following indicators describe the variety of ways that consumers connect with local food pro-ducers in Kern County.
These are compared, when applicable, to the larger food economy, within California and nationally.
INDICATOR 2.1.1: Direct-to-consumer agricultural sales in Kern County
Background Local sales, including direct-to-consumer sales, make up a small but important percentage of total agricultural sales. All three kinds of sales (total, local, and direct) appear to be increasing in recent years at the national level.9 California led the country in direct sales to consumers in 2012, with $170 million in sales.10
9 Low, S. A., Adalja, A., Beaulieu, E., Key, N., Martinez, S., Melton, A., Perez, A., Ralston, K., Stewart, H., Suttles, S., Vogel, S., & Jablonski, B.B.R. (2015). Trends in US local and regional food systems: A report to Congress. Economic Research Service.
10 USDA National Agricultural Statistics Service. (2014). Farmers Marketing: Direct sales through markets, roadside stands, and other means up 8 percent since 2007 (2014). Agriculture Census Highlights (ACH) - 7. U.S.
Pomegranates growing in Kern County.
PHO
TO C
RED
IT: G
REG
IGO
R
VISI
ON
2:
HEA
LTH
Y LO
CAL
FOO
D E
CON
OM
Y
36 Kern County Food System Assessment

MEASURE 1: Total dollars of direct-to-consumer agricultural sales
Kern County TrendsAgriculture is a major source of economic activity in Kern County, which ranks third in the state of California for total value of agricultural products sold. In 2012, this value was nearly 4 billion dol-lars.11 Kern County farmers reported almost $6 million in direct sales in 2012, though some of these may have taken place outside the county (for example, if a Kern County farmer traveled to a farmers market in Los Angeles).
According to the 2012 USDA Census of Agriculture, the total value of farm sales in Kern County has been steadily increasing since 1997 (see Figure 9).
Figure 9. Total agricultural sales12 in Kern County (1992–2012)Source: USDA National Agricultural Statistics Service (NASS), Census of Agriculture (1992-2012)
The dollar amount of direct farm sales in Kern County, shown in Figure 10, has also increased since the 1990s, despite a decline from its highest level in 2002. In 1997, the amount of total direct sales was approximately 3 million dollars. The amount in 2012 was almost double that at approximately 6 million dollars.
11 USDA National Agricultural Statistics Service. (2014). USDA 2012 census of agriculture. Retrieved March 08, 2017, from agcensus.usda.gov.
12 “Total agricultural sales” is a gross sales figure from which none of the costs of production, marketing, or distribution have been deducted. Care should be taken not to equate total agricultural sales with farm profits, which are influenced by a wide range of other factors.
37Kern County Food System Assessment

Figure 10. Total direct agricultural sales in Kern County (1992–2012)Source: USDA National Agricultural Statistics Service (NASS), Census of Agriculture (1992-2012)
MEASURE 2: Number of farms with direct-to-consumer sales in Kern County
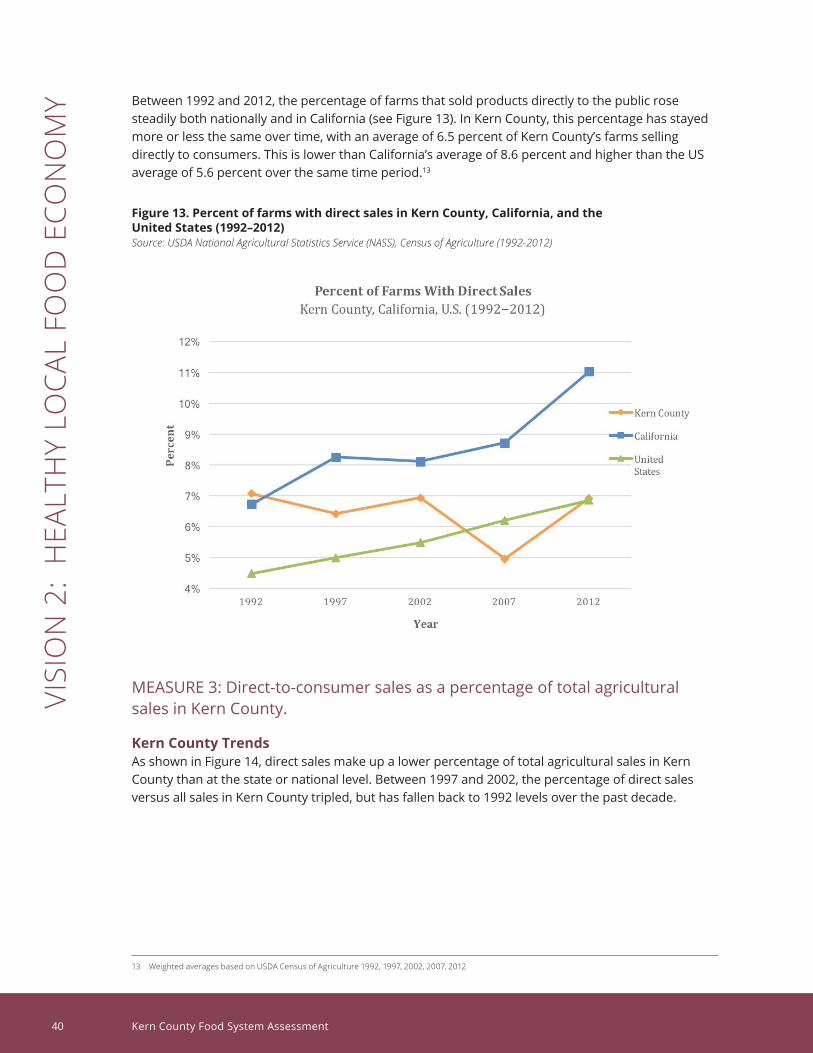
Kern County TrendsThe number of farms in Kern County with direct sales, shown in Figures 11 and 12, remained relatively consistent from 1992 to 2002, at around 150 farms. The number of farms with direct sales fell to 105 in 2007, and rose to 134 in 2012. The total number of farms in Kern County—those with and without direct sales—also decreased over the same time period, even as total dollars in sales have increased.
California strawberriesPHO
TO C
RED
IT: D
OU
G K
ESSL
ER
VISI
ON
2:
HEA
LTH
Y LO
CAL
FOO
D E
CON
OM
Y
38 Kern County Food System Assessment
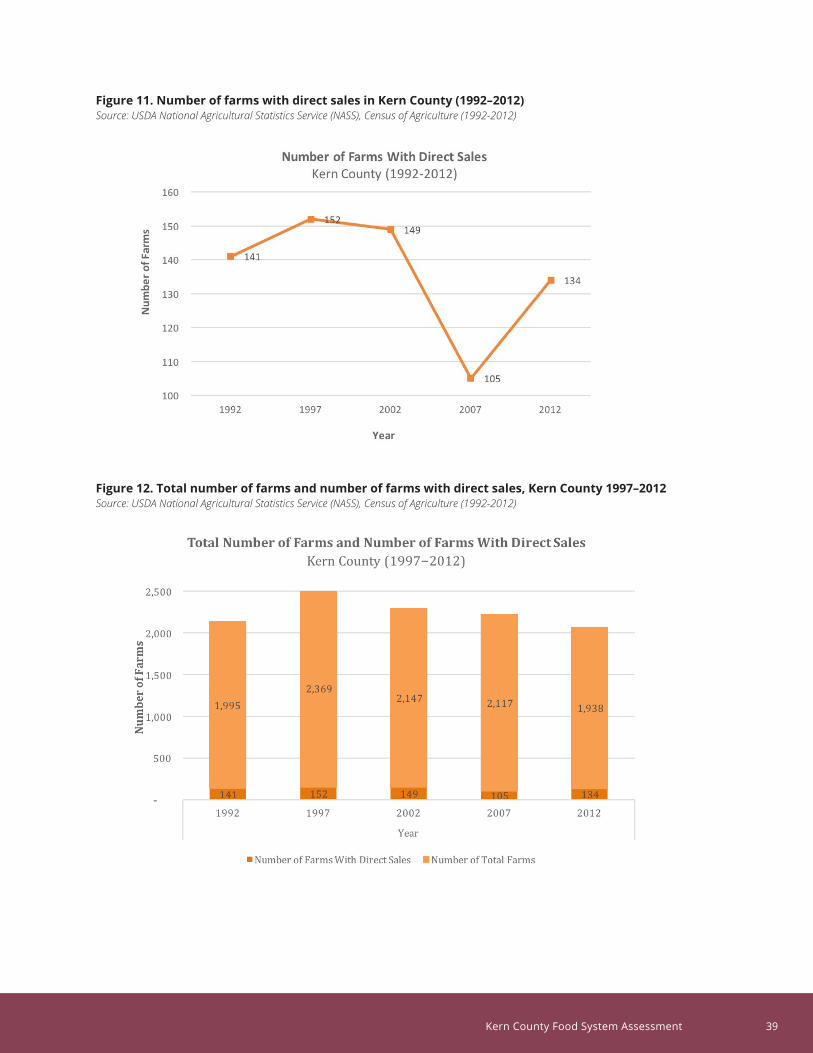
Figure 11. Number of farms with direct sales in Kern County (1992–2012)Source: USDA National Agricultural Statistics Service (NASS), Census of Agriculture (1992-2012)
Figure 12. Total number of farms and number of farms with direct sales, Kern County 1997–2012Source: USDA National Agricultural Statistics Service (NASS), Census of Agriculture (1992-2012)
39Kern County Food System Assessment
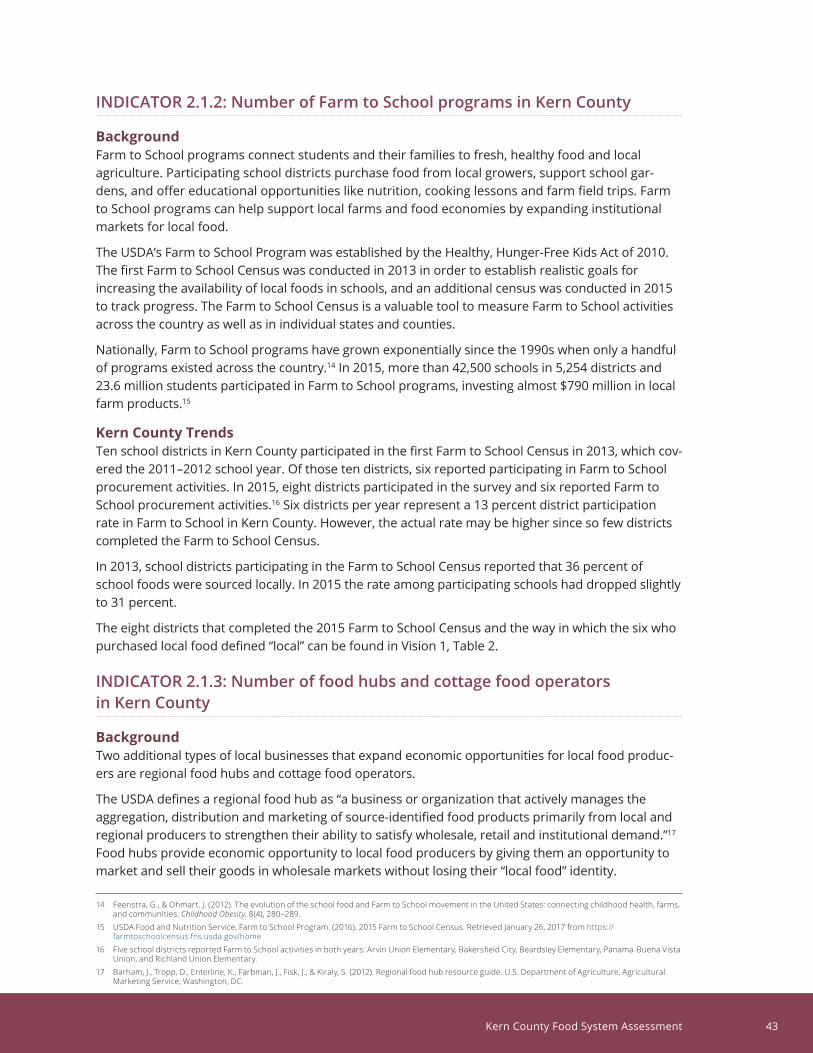
Between 1992 and 2012, the percentage of farms that sold products directly to the public rose steadily both nationally and in California (see Figure 13). In Kern County, this percentage has stayed more or less the same over time, with an average of 6.5 percent of Kern County’s farms selling directly to consumers. This is lower than California’s average of 8.6 percent and higher than the US average of 5.6 percent over the same time period.13
Figure 13. Percent of farms with direct sales in Kern County, California, and the United States (1992–2012)Source: USDA National Agricultural Statistics Service (NASS), Census of Agriculture (1992-2012)
MEASURE 3: Direct-to-consumer sales as a percentage of total agricultural sales in Kern County.
Kern County TrendsAs shown in Figure 14, direct sales make up a lower percentage of total agricultural sales in Kern County than at the state or national level. Between 1997 and 2002, the percentage of direct sales versus all sales in Kern County tripled, but has fallen back to 1992 levels over the past decade.
13 Weighted averages based on USDA Census of Agriculture 1992, 1997, 2002, 2007, 2012
VISI
ON
2:
HEA
LTH
Y LO
CAL
FOO
D E
CON
OM
Y
40 Kern County Food System Assessment

Figure 14. Direct to consumer sales as a percentage of all agricultural sales in Kern County, California, and the United States (1992–2012)
Source: USDA National Agricultural Statistics Service (NASS), Census of Agriculture (1992-2012)
Cherries growing in Kern County.
PHO
TO C
RED
IT: S
USA
N R
EEP
41Kern County Food System Assessment

Direct-to-consumer sales in Kern and Fresno CountiesFresno County is another Central Valley agricultural county with a similar climate and crop-ping patterns to Kern. Figure 15 shows total direct sales and number of farms involved in direct sales in each county. Figure 16 shows average direct sales per farm. We can see that Fresno supports more direct sales in total dollars and also has more farms involved in direct sales. Kern County farms involved in direct sales are fewer in number, but have higher aver-age sales per farm in most years.
Figure 15. Direct agricultural sales in Kern and Fresno Counties in total dollars and total number of farms with direct sales (1992–2012)
Source: USDA National Agricultural Statistics Service (NASS), Census of Agriculture (1992-2012)
Figure 16. Average direct agricultural sales per farmSource: USDA National Agricultural Statistics Service (NASS), Census of Agriculture (1992-2012)
VISI
ON
2:
HEA
LTH
Y LO
CAL
FOO
D E
CON
OM
Y
42 Kern County Food System Assessment
INDICATOR 2.1.2: Number of Farm to School programs in Kern County
BackgroundFarm to School programs connect students and their families to fresh, healthy food and local agriculture. Participating school districts purchase food from local growers, support school gar-dens, and offer educational opportunities like nutrition, cooking lessons and farm field trips. Farm to School programs can help support local farms and food economies by expanding institutional markets for local food.
The USDA’s Farm to School Program was established by the Healthy, Hunger-Free Kids Act of 2010. The first Farm to School Census was conducted in 2013 in order to establish realistic goals for increasing the availability of local foods in schools, and an additional census was conducted in 2015 to track progress. The Farm to School Census is a valuable tool to measure Farm to School activities across the country as well as in individual states and counties.
Nationally, Farm to School programs have grown exponentially since the 1990s when only a handful of programs existed across the country.14 In 2015, more than 42,500 schools in 5,254 districts and 23.6 million students participated in Farm to School programs, investing almost $790 million in local farm products.15
Kern County TrendsTen school districts in Kern County participated in the first Farm to School Census in 2013, which cov-ered the 2011–2012 school year. Of those ten districts, six reported participating in Farm to School procurement activities. In 2015, eight districts participated in the survey and six reported Farm to School procurement activities.16 Six districts per year represent a 13 percent district participation rate in Farm to School in Kern County. However, the actual rate may be higher since so few districts completed the Farm to School Census.
In 2013, school districts participating in the Farm to School Census reported that 36 percent of school foods were sourced locally. In 2015 the rate among participating schools had dropped slightly to 31 percent.
The eight districts that completed the 2015 Farm to School Census and the way in which the six who purchased local food defined “local” can be found in Vision 1, Table 2.
INDICATOR 2.1.3: Number of food hubs and cottage food operators in Kern County
BackgroundTwo additional types of local businesses that expand economic opportunities for local food produc-ers are regional food hubs and cottage food operators.
The USDA defines a regional food hub as “a business or organization that actively manages the aggregation, distribution and marketing of source-identified food products primarily from local and regional producers to strengthen their ability to satisfy wholesale, retail and institutional demand.”17 Food hubs provide economic opportunity to local food producers by giving them an opportunity to market and sell their goods in wholesale markets without losing their “local food” identity.
14 Feenstra, G., & Ohmart, J. (2012). The evolution of the school food and Farm to School movement in the United States: connecting childhood health, farms, and communities. Childhood Obesity, 8(4), 280–289.
15 USDA Food and Nutrition Service, Farm to School Program. (2016). 2015 Farm to School Census. Retrieved January 26, 2017 from https://farmtoschoolcensus.fns.usda.gov/home
16 Five school districts reported Farm to School activities in both years: Arvin Union Elementary, Bakersfield City, Beardsley Elementary, Panama-Buena Vista Union, and Richland Union Elementary.
17 Barham, J., Tropp, D., Enterline, K., Farbman, J., Fisk, J., & Kiraly, S. (2012). Regional food hub resource guide. U.S. Department of Agriculture, Agricultural Marketing Service, Washington, DC.
43Kern County Food System Assessment
Cottage food operators are food producers that create food items on a small scale, oftentimes with locally sourced ingredients. Assembly Bill 1616, known as the California Homemade Food Act, went into effect January 1, 2013, and allows certain low risk foods, known as “cottage foods,” to be made in a private residence on a small scale and be sold to the public. The operators that run these busi-nesses are known as Cottage Food Operators (CFOs). The limitations for how much revenue a CFO can produce is as follows:
$35,000 or less in gross sales in 2013
$45,000 or less in gross sales in 2014
$50,000 or less in gross sales in 2015
CFOs are limited to producing food that is considered “potentially non-hazardous.” These are foods that do not require refrigeration to keep them safe from bacterial growth that could make people sick. Examples include candy, dried fruit, granola, honey, fruit tarts, preserves, jams, jellies, oil, vin-egar, nut mixes, and nut butter.
All CFOs must apply for a permit and pay the associated fee, as well as undergo an inspection by the County Health Department annually or as needed. CFOs can only sell their products within their county, unless under special permission by the health department.18
Kern County TrendsIn Kern County, there were a total of 102 cottage food industry permits issued in 2015.19
There are currently no food hubs within Kern County.20
GOAL 2.2: All Kern County residents have access to local food
BackgroundKern County’s favorable climate and geography have made it one of the top agricultural producers in the nation, and local producers grow and distribute food year-round. This presents not just an economic opportunity, but also an opportunity to ensure that all community members have steady access to the fresh, healthy foods that are produced in Kern County.
However, high poverty rates, limited transportation options, and lack of markets in certain neighbor-hoods can make it challenging for some families to access the agricultural abundance around them. A range of local efforts are being made to help ensure that local foods are accessible to all consum-ers, regardless of income. These include building community gardens, local farms donating produce to food banks, the acceptance of SNAP benefits at farmers markets, and efforts to improve public transportation to local food markets.
INDICATOR 2.2.1: Acceptance of EBT at farmers markets in Kern County
BackgroundAs the number of farmers markets continues to grow across the nation, so too has the recognition that many low-income community members face challenges in accessing these markets. In an effort to increase access for individuals or households receiving public assistance benefits such as CalFresh
18 Kern County Public Health Services. www.kernpublichealth.com.
19 Personal communication with Barbara Chambers at Kern County Department of Environmental Health
20 USDA. Food Hub Directory. (n.d.). Retrieved March 08, 2017, from https://www.ams.usda.gov/local-food-directories/foodhubs
VISI
ON
2:
HEA
LTH
Y LO
CAL
FOO
D E
CON
OM
Y
44 Kern County Food System Assessment

(also known as SNAP or food stamps) or Woman, Infant and Children (WIC) vouchers, Electronic Ben-efit Transfer (EBT) machines are increasingly being utilized at farmers markets to enable redemption of these benefits for fresh, locally grown food. Acceptance of EBT payments at farmers markets may help broaden the customer base for participating farmers and increase community access to local, fresh foods.
Kern County TrendsIn 2013–2014, there were a total of 16 certified farmers’ markets in Kern County. Of these 16 mar-kets, three markets had the capacity to accept public benefits through Electronic Benefit Transfer (EBT) machines. In 2015–2016, there were a total of 12 certified farmers’ markets in Kern County. Of these 12 markets, five markets accepted EBT.21
21 The number and locations of farmers markets were difficult to verify. We used several lists (USDA, Kern County Department of Human Services, Kern County Department of Environmental Health, and the Agricultural Commissioner’s Office), none of which agreed perfectly. Jessica Smith called each market in 2016 to verify EBT use.
The Hen’s RoostThe Hen’s Roost has created a unique concept in the local food scene: bringing Kern County farmers and vendors that you’d normally see at a farmer’s market to a “pop-up” store front site in downtown Bakersfield.
The Hen’s Roost, spearheaded by Jaclyn Allen, who also put together weekend farmer’s markets in west and southwest Bakersfield, now operates as a small grocer each Wednesday on G Street. Allen hopes that their “keep it local” concept will give customers what they want: fresh, local products while keeping the money flowing within Kern County.
The grocery, located just off the corner of G Street and 19th Street, is open every Wednesday from 10 AM to 6 PM. In addition to fresh, local produce, customers can also buy sheep milk yogurt, hummus and other dips, French pastries and quiches, fresh breads, granolas, as well as locally produced peanut, cashew and almond butters.
Jaclyn Allen, owner of The Hen’s Roost in Bakersfield. PHOTO CREDIT: JILL EGLAND
45Kern County Food System Assessment

Figure 16a. Farmers Markets with and without EBT use in Kern CountySource: USDA AMS; Kern County Dept. of Human Services; Kern County Dept. of Environmental Health; Jessica Smith, UC SAREP [contacted each market by phone, 2016]. Map by Brady Bernhart, CAPK.
Kern County farmers market
PHO
TO C
RED
IT: J
ILL
EGLA
ND
VISI
ON
2:
HEA
LTH
Y LO
CAL
FOO
D E
CON
OM
Y
46 Kern County Food System Assessment

Table 4. EBT acceptance at Certified Farmers Markets in Kern County (2013–2014 and 2015–2016)Sources: USDA AMS; Kern County Dept. of Human Services; Kern County Dept. of Environmental Health; Jessica Smith, UC SAREP [contacted each market by phone, 2016]
2013-2014 Certified Farmers Markets 2015-2016 Certified Farmers Markets
Farmers Market Name EBT Y/N Farmers Market Name EBT
(Y/N)The Oildale Farmers Market N The Oildale Farmers Market N
Haggin Oaks Farmers Market N Haggin Oaks Farmers Market N
Brimhall Market N Brimhall Market N
Lakeshore Farmers Market Wofford Heights Y Lakeshore Farmers Market Wofford Heights Y
Farmers Market Onyx Farmers Market N Farmers Market Onyx Farmers Market Y
Nuui Cunni Farmers Market N
Valley Farmers Market Assoc - Bakersfield Y Valley Farmers Market Assoc - Bakersfield Y
Valley Farmers Market Assoc - Shafter Y From the Farmhouse Shafter Y
Tesch Family Farms Lamont (Clinica Sierra Vista) N Tesch Family Farms Lamont (Clinica Sierra Vista) N
Tesch Family Farms Delano (Clinica Sierra Vista) N Tesch Family Farms Delano (Clinica Sierra Vista) N
Tesch Family Farms Bakersfield (Clinica Sierra Vista) N Tesch Family Farms Bakersfield
(Clinica Sierra Vista) N
Main Street Farmers Market N Ridgecrest Certified Farmers Market Y
Taft Famers Market N
Joe’s Market N Kern County Community Farmers Market N
South West City Slickers Farmers Market N
The Market Place N
TOTAL: 16 Certified Farmer’s Markets TOTAL: 12 Certified Farmer’s Markets
TOTAL EBT: 3 TOTAL EBT: 5
INDICATOR 2.2.2: Number of community gardens in Kern County
BackgroundThe American Community Garden Association defines a community garden as any piece of land gar-dened by a group of people.22 These spaces can be urban or rural, public or private, cover multiple acres or the space of a small backyard. Community gardens can increase physical activity and com-munity pride, as well as improve nutrition and knowledge of food.23 Community gardening is part of a renewed interest in local food production and consumption taking place all across California.
Kern County TrendsAs of the writing of this report, there were a total of 16 community gardens in Kern County.24 Figure 17 shows the locations of all known community gardens in Kern County, the majority of which are in the Bakersfield metropolitan area.25 The names and addresses of these community gardens are listed in Table 5.
22 American Community Garden Association. www.communitygarden.org
23 Surls, R., Feenstra, G., Golden, S., Galt, R., Hardesty, S., Napawan, C., & Wilen, C. (2015). Gearing up to support urban farming in California: Preliminary results of a needs assessment. Renewable Agriculture and Food Systems, 30(01), 33–42.
24 Information compiled through personal communications with community partners, including Karen Bayne, University of California Cooperative Extension; Amber Beeson, The Giving Tree; Father Jack, The Gardening Project; and Gustavo Aguirre, Center for Race, Poverty and the Environment.
25 Bernhart, B. Community Action Partnership of Kern. www.capk.org
47Kern County Food System Assessment

Figure 17. Community Gardens in Kern CountySource: Information compiled through personal communications with community partners, including Karen Bayne, University of California Cooperative Extension; Amber Beeson, The Giving Tree; Father Jack, The Gardening Project; and Gustavo Aguirre, Center for Race, Poverty and the Environment.
Community garden in Arvin, CA.
PHO
TO C
RED
IT: S
HO
HSA
CAP
PS
VISI
ON
2:
HEA
LTH
Y LO
CAL
FOO
D E
CON
OM
Y
48 Kern County Food System Assessment

Table 5. Community Gardens in Kern CountySource: Information compiled through personal communications with community partners, including Karen Bayne, University of California Cooperative Extension; Amber Beeson, The Giving Tree; Father Jack, The Gardening Project; and Gustavo Aguirre, Center for Race, Poverty and the Environment.
Garden Name Street Address City ZIP
Center on Race, Poverty, & the Environment – Arvin Garden 698 S. Comanche Rd Arvin 93203
Seeds of Inspiration Community Garden 405 Eye Street Bakersfield 93304
Center on Race, Poverty, & the Environment – Greenfield Walking Group Community Garden 5224 Jonah St Bakersfield 93307
Kern City Community Garden 6510 Club View Dr Bakersfield 93309
Rosewood Senior Living Garden 1301 New Stine Rd Bakersfield 93309
Achievement Center 1721 Westwind Dr Bakersfield 93301
Martin Luther King Community Center 1000 South Owens St Bakersfield 93307
Friendship House 2424 Cottonwood Rd Bakersfield 93307
Boys and Girls Club of Bakersfield 801 Niles St Bakersfield 93305
Delano Community Hospital Community Garden 1401 Garces Hwy Delano 93215
Frazier Park Community Gardens 3800 Park Dr Frazier Park 93225
Green Dragon Community Garden – Oaks of Kern Farm 3433 Los Padres Drive Frazier Park 93225
Kern River Valley Family Resource Center 5109 Lake Isabella Blvd Lake Isabella 93240
Green Dragon Community Garden – Florence Cuddy Farm 335 Lakewood Place Lake of the
Woods 93225
Center on Race, Poverty, & the Environment – Shafter Garden 500 Fresno St. Shafter 93263
Taft Community Garden 9th St & Kern St Taft 93268
INDICATOR 2.2.3: Public transportation availability near local food markets in Kern County
BackgroundAlthough there may be delivery services available in some locations, for the most part, access to local foods depends on the ability to physically get to places where local food is sold. Not all community members have access to a personal vehicle, and for these community members public transporta-tion routes may play a key role in whether or not they are able to purchase and consume local foods. Increasingly, developers and city planners are exploring methods by which community members can either walk to shopping centers and other commercial centers, or walk to public transportation that allows easy access to these places.26
Kern County TrendsThe following map27 (Figure 18) shows all public bus routes in Kern County in relationship to food markets, farmers markets, convenience stores, and other food access points. Local foods may be purchased at any of these types of food access points, although all foods at all of these markets do not necessarily come from local sources (with the exception of farmers markets). This map also
26 Southworth, M. (2005). Designing the walkable city. Journal of urban planning and development, 131(4), 246-257.
27 Bernhart, B. Community Action Partnership of Kern. www.capk.org
49Kern County Food System Assessment

shows areas where households are less likely to have access to a vehicle and whether these areas have nearby public transportation. There are a few areas in which a higher than average percent-age of residents do not have personal vehicles, few or no food outlets exist and there are no nearby public transportation lines.
Figure 18: Transportation and food access in Kern CountySource: Bernhart, B. Community Action Partnership of Kern. www.capk.org A larger, more detailed version of this map can be viewed here: http://asi.ucdavis.edu/programs/sarep/research-initiatives/fs/assessment/bakersfieldmap/view.
VISI
ON
2:
HEA
LTH
Y LO
CAL
FOO
D E
CON
OM
Y
50 Kern County Food System Assessment

INDICATOR 2.2.4: Local produce donations in Kern County
BackgroundThe donation of locally grown produce to emergency food distribution centers is one way to increase the accessibility of locally grown food to lower income community members who may not otherwise be able to afford it. Donated produce may come directly from a farm or farmers market, from gro-cery stores, or from gleaning projects where volunteers go to local farms to harvest donated crops.
Kern County TrendsFor information regarding local produce donations in Kern County, see Vision 1, Goal 2, Indicator 3.
GOAL 2.3: The Kern County food system provides job opportunities
BackgroundOne out of every three jobs in Kern County is in the food system, roughly double national and state averages. These jobs are in a wide range of industries, including farming and farm support services, food processing, food distribution, food service, and food retail.
Some of the most numerous food systems jobs both nationally and in Kern County are in food service, which is also one of the fastest growing sectors in the U.S. economy overall. The food service industry is expected to grow seven percent nationally from 2014 to 2024.28 Crop production also provides a large percentage of the food systems jobs in Kern County.
Currently, there is no predetermined category for “food system related jobs” within the North Ameri-can Industry Classification System (NAICS), which is utilized by the U.S. Bureau of Labor Statistics. Instead, job categories in the food system are layered under various NAICS codes. This report utilizes 32 NAICS codes that relate directly to production, distribution, and consumption activities within the food system. To see which industries were classified as food system related, along with their corre-sponding NAICS codes, please see Appendix B.
INDICATOR 2.3.1: Average wages in the Kern County food system
Kern County TrendsFigure 19 shows the ten food system job categories in Kern County with the highest total number of employees. These are the job categories that employ the most people in Kern County. The average annual wage in Kern County for each category is displayed along with state and national averages.
In 2014, average Kern County wages were lower than both California and national averages in six of these job categories: support activities for crop production, restaurants and other eating places, grocery stores, grocery and related product wholesalers, other food manufacturing,29 and other crop farming.30
In four of the ten job categories, Kern County wages were higher than both California and national averages: fruit and nut tree farming, vegetable and melon farming, cattle ranching and farming, and greenhouse and nursery.
28 Bureau of Labor Statistics. (2015). Occupational Outlook Handbook. www.bls.gov.ooh
29 Includes all miscellaneous manufactured foods that do not fit into another category—primarily snack foods, spices, and sauces. Includes nut roasting. Does NOT include manufacture of animal feed, dairy, meat, bread, pasta, vegetable, fruit, or sugar/confectionary products.
30 Includes all miscellaneous crops that do not fit into another category, including tobacco, cotton, sugarcane, hay, peanuts, etc. Does NOT include fruits, vegetables, livestock, or major commodity crops.
51Kern County Food System Assessment

Figure 19. Average annual pay in ten food systems jobs with the highest number of employees31 in Kern County: Kern County, California, and the United States (2014)Source: U.S. Bureau of Labor Statistics Quarterly Census of Employment and Wages (QCEW)
31 “Top 10” based on ten food systems NAICS codes with the most workers in Kern County.
Workers harvesting peppers in Kern County.
PHO
TO C
RED
IT: G
REG
IGO
R
VISI
ON
2:
HEA
LTH
Y LO
CAL
FOO
D E
CON
OM
Y
52 Kern County Food System Assessment

Figure 20 shows the ten food system job categories with the highest annual wages in Kern County in 2014.
The weighted average annual wage of the ten highest paid food system industry jobs in Kern County in 2014 was $41,792.
The weighted average annual wage of all food system jobs in Kern County in 2014 was $24,182.
Figure 20. Average annual wages of the ten highest paid food systems jobs in Kern County (2014)Source: U.S. Bureau of Labor Statistics Quarterly Census of Employment and Wages (QCEW)
Figure 21 shows the food system job categories with the lowest average annual pay in Kern County in 2014. The weighted average annual wage of the ten lowest paid food system industry jobs in Kern County in 2014 was $19,891.
53Kern County Food System Assessment

Figure 21. Average annual wages of the ten lowest paid food systems jobs in Kern County (2014)32
Source: U.S. Bureau of Labor Statistics Quarterly Census of Employment and Wages (QCEW)
The Federal Poverty Level (FPL) for a household of four persons was $23,850 in 2014. Of these ten job categories, only grocery store wages exceeded the FPL.
Table 6 shows the weighted annual average wages in the Kern County food system compared to the FPL.
Table 6: Weighted annual average wages in Kern County (2014)Source: U.S. Bureau of Labor Statistics Quarterly Census of Employment and Wages (QCEW)
Average annual wage in 2014All food systems jobs $24,182
10 lowest paid food systems jobs $19,891
10 highest paid food systems jobs $41,792
All jobs (all industries, including food systems) $43,737
Federal poverty level for family of 4 $23,850
32 Wages for NAICS 1151, Support Activities for Crop Production, may be less accurate than other job categories due to undercounting of agricultural workers in the QCEW, which leads to overestimating the pay per employee. For more details, see Martin, P. and Costa, D. (2017). Farmworker wages in California: Large gap between full-time equivalent and actual earnings. Economic Policy Institute, Working Economics Blog. Posted March 7, 2017. Retrieved May 10, 2017 from http://www.epi.org/blog/farmworker-wages-in-california-large-gap-between-full-time-equivalent-and-actual-earnings/
VISI
ON
2:
HEA
LTH
Y LO
CAL
FOO
D E
CON
OM
Y
54 Kern County Food System Assessment

The Federal Poverty Level (FPL) is only one measure of poverty. The FPL was originally based on the USDA’s Economy Food Plan, which did not assume a specific dollar amount for any budget category besides food.33 Since that time, costs associated with other budget categories (housing, health care, child care, transportation, etc.) have risen much faster than the cost of food, and as a result many believe that the FPL underestimates current poverty levels.34
Three alternate ways to measure poverty are the U.S. Census Bureau’s Supplemental Poverty Mea-sure (SPM), the Public Policy Institute of California and the Stanford University Center on Poverty and Inequality’s California Poverty Measure (CPM), and the United Way’s Real Cost Measure (RCM). All take into account additional budget categories beyond food, including differences in cost of living by region. The CPM also takes into account the role of California’s social safety net in moderating poverty.35
Measured according to the SPM, California has the highest poverty rate in the country at 20.6 per-cent (versus 15 percent using the FPL)36 due to a high average cost of living. In Kern County, though poverty rates are high relative to the rest of the state, the lower cost of living results in a lower CPM (19.2 percent) relative to the FPL (24.4 percent).37
The income needed by a family of four in Kern County to meet the Real Cost Measure (RCM), an esti-mated budget for all of a household’s basic needs, is $45,125, or almost double (194%) the FPL. 38
The average annual wages of workers in the two food systems jobs with the most employees in Kern County (“Support activities for crop production” and “Restaurant and other eating places”) both fall below the FPL. Most other food systems jobs (see Table 6) likely fall below the RCM.
33 Fisher, G. (1997). The development and history of the U.S. poverty thresholds—a brief overview. Newsletter of the Government Statistics Section and the Social Statistics Section of the American Statistical Association. Department of Health and Human Services, pp. 6-7. Retrieved February 20, 2017, from https://aspe.hhs.gov/history-poverty-thresholds.
34 Block, B., Gascon, H., Manzo, P., & Parker, A. (2015). Struggling to Get By. The Real Cost Measure in California 2015. United Way of California. Retrieved May 12, 2017 from https://www.unitedwaysca.org/images/StrugglingToGetBy/Struggling_to_Get_By.pdf.
35 Bohn, S., Danielson, C., Levin, M., Mattingly, M., & Wimer, C. (2013). The California Poverty Measure: A New Look at the Social Safety Net. Public Policy Institute of California. Retrieved June 1, 2017 from http://www.ppic.org/content/pubs/report/R_1013SBR.pdf.
36 Three year average of 2013, 2014, and 2015. From Renwick, T., & Fox, L. (2016). The Supplemental Poverty Measure: 2015. Current Population Reports, Series P60, 258.
37 2011 rates. From Wimer, C., Mattingly, M., Levin, M., Danielson, C., & Bohn, S. (2013). A portrait of poverty within California counties and demographic groups. The Stanford Center on Poverty and Inequality.
38 Block, B., Gascon, H., Manzo, P., & Parker, A. (2015). Struggling to Get By: The Real Cost Measure in California 2015. United Way of California. Retrieved May 12, 2017 from https://www.unitedwaysca.org/images/StrugglingToGetBy/Struggling_to_Get_By.pdf.
Harvesting carrots in Kern County.PHOTO CREDIT: GREG IGOR
55Kern County Food System Assessment

INDICATOR 2.3.2: Number of jobs in the Kern County food system
Kern County TrendsThe total number of employees in the Kern County food system in 2014 was 91,696. Food system employees made up 29 percent of all employees in Kern County in 2014, double the national and state averages.
Figure 22 shows the ten job categories with the highest number of employees in Kern County in 2014. The job category with the most employees in 2014 was “support activities for crop production,” which includes farm labor and management. This industry had 40,775 total employees in 2014.39 This accounts for almost half (44 percent) of the employees in Kern County’s food system.
The job category with the second highest number of employees in the food system in 2014 is was “restaurants and other eating places.” There were 18,880 employees in this category, accounting for 21 percent of all food system jobs.
Figure 22. Ten food systems jobs with the highest number of employees in Kern County (2014)Source: U.S. Bureau of Labor Statistics Quarterly Census of Employment and Wages (QCEW)
39 NAICS 1151, Support Activities for Crop Production, is typically undercounted by the Bureau of Labor Statistics’ Quarterly Census of Employment and Wages (QCEW), so the actual number of agricultural workers in Kern County may be higher. For more details, see Martin, P. and Costa, D. (2017). Farmworker wages in California: Large gap between full-time equivalent and actual earnings. Economic Policy Institute, Working Economics Blog. Posted March 7, 2017. Retrieved May 10, 2017 from http://www.epi.org/blog/farmworker-wages-in-california-large-gap-between-full-time-equivalent-and-actual-earnings/
VISI
ON
2:
HEA
LTH
Y LO
CAL
FOO
D E
CON
OM
Y
56 Kern County Food System Assessment

Figure 23 shows the number of employees in the food system in 2014 (represented by the blue bars and using the scale on the left), compared with average annual wages for those jobs (represented by the red dots and using the scale on the right).
This graph shows that the majority of employees in the food system are making less than $30,000 annually, and there are many fewer employees in the jobs that have higher average annual wages.
Figure 23. Average annual pay of the ten food systems jobs in Kern County with the highest num-ber of employees (2014)Source: U.S. Bureau of Labor Statistics Quarterly Census of Employment and Wages (QCEW)
57Kern County Food System Assessment