virtual machine storageperformance using...
TRANSCRIPT

Virtual Machine Storage Performance using
SR-IOV
by
c© Michael J. Kopps
B.S., University of Colorado, 2007
A project submitted to the Graduate Faculty of the
University of Colorado at Colorado Springs
in partial fulfilment of the
requirements for the degree of
Master of Science
Department of Computer Science
December 2013

This project report for the Master of Science degree by
Michael J. Kopps
has been approved for the
Department of Computer Science
by
Jia Rao, Chair
Xiabo Zhou
C. Edward Chow
Date

Abstract
This paper presents research on the performance differences for various storage
models on KVM virtual machines when using Single Root I/O Virtualization (SR-
IOV) versus using the traditional hypervisor assisted storage techniques such as virtio.
SR-IOV presents physical hardware devices to the virtual machines and reduces the
overhead of the hypervisor when making disk I/O operations while traditional virtu-
alization techniques use software to provide access to shared hardware.
iii

Contents
Abstract iii
List of Figures vi
1 Introduction 1
2 Background 4
2.1 Linux SCSI Subsystem, a.k.a Bare Metal . . . . . . . . . . . . . . . . 4
2.2 Hypervisor Based Virtual Disks . . . . . . . . . . . . . . . . . . . . . 5
2.2.1 Virtio . . . . . . . . . . . . . . . . . . . . . . . . . . . . . . . 5
2.2.2 IDE Emulation . . . . . . . . . . . . . . . . . . . . . . . . . . 7
2.2.3 Image Storage . . . . . . . . . . . . . . . . . . . . . . . . . . . 7
2.3 SR-IOV Hard Drive Controller Operation . . . . . . . . . . . . . . . . 8
2.4 Benchmarks . . . . . . . . . . . . . . . . . . . . . . . . . . . . . . . . 9
2.4.1 Bonnie++ . . . . . . . . . . . . . . . . . . . . . . . . . . . . . 10
2.4.2 Postmark . . . . . . . . . . . . . . . . . . . . . . . . . . . . . 10
2.4.3 Dos . . . . . . . . . . . . . . . . . . . . . . . . . . . . . . . . . 11
2.4.4 dd . . . . . . . . . . . . . . . . . . . . . . . . . . . . . . . . . 11
iv
3 Discussion 13
3.1 Issues . . . . . . . . . . . . . . . . . . . . . . . . . . . . . . . . . . . 13
3.2 Benchmarks . . . . . . . . . . . . . . . . . . . . . . . . . . . . . . . . 14
3.3 Questions . . . . . . . . . . . . . . . . . . . . . . . . . . . . . . . . . 16
3.4 Projections . . . . . . . . . . . . . . . . . . . . . . . . . . . . . . . . 16
4 Evaluation 18
4.1 Test Methodology . . . . . . . . . . . . . . . . . . . . . . . . . . . . . 18
4.2 Independent Disks . . . . . . . . . . . . . . . . . . . . . . . . . . . . 20
4.3 Disk Sharing . . . . . . . . . . . . . . . . . . . . . . . . . . . . . . . . 31
4.4 Performance on Single Workload . . . . . . . . . . . . . . . . . . . . . 34
5 Conclusion 39
6 Future Work 41
Bibliography 43
v

List of Figures
4.1 Average VM Write Throughput with Independent Disks using Bonnie++ 22
4.2 Average VM Read Throughput with Independent Disks using Bonnie++ 22
4.3 Average VM Write CPU % with Independent Disks using Bonnie++ 24
4.4 Average VM Read CPU % with Independent Disks using Bonnie++ . 24
4.5 Average VM Write Throughput Comparing SR-IOV Configurations
using Independent Disks and Bonnie++ . . . . . . . . . . . . . . . . 25
4.6 Average VM Read Throughput Comparing SR-IOV Configurations us-
ing Independent Disks and Bonnie++ . . . . . . . . . . . . . . . . . . 26
4.7 Average VM Read Throughput with Independent Disks using Postmark 27
4.8 Average VM Throughput Standard Deviations with Independent Disks
using Postmark . . . . . . . . . . . . . . . . . . . . . . . . . . . . . . 28
4.9 Average VM Write Throughput with Independent Disks using Postmark 29
4.10 Average VM Throughput Comparing SR-IOV Configurations using In-
dependent Disks and Postmark . . . . . . . . . . . . . . . . . . . . . 30
4.11 Average VM Write Throughput with Shared Disks using Bonnie++ . 31
4.12 Average VM Read Throughput with Shared Disks using Bonnie++ . 32
4.13 Average VM Read Throughput with Shared Disks using Postmark . . 33
vi

4.14 Average VM Write Throughput with Shared Disks using Postmark . 33
4.15 Average VM Sequential Read Throughput with Shared Disks using Dos 35
4.16 Average VM Random Read Throughput with Shared Disks using Dos 36
4.17 Average VM Throughput with Shared Disks using dd . . . . . . . . . 37
4.18 dd Throughput per VM with Shared Disks and 4 VMs . . . . . . . . 38
vii

Chapter 1
Introduction
Kernel based Virtual Machine (KVM) is a virtualization hypervisor which uses the
Quick Emulator (QEMU) as its virtual machine monitor and is rapidly growing in in-
dustry adoption for virtualizing servers. The architectures of the underlying hardware
this hypervisor runs on vary widely, but there is always a need for the basics: CPU,
memory, network, and persistent storage. KVM’s CPU and memory virtualization
implementation is able to take advantage of CPU hardware such as Intel’s VT-x and
VT-d to simplify virtualization by the hypervisor operating system. The persistent
storage system, which in any computer, virtualized or native, has always been the
largest, least expensive per gigabyte, and slowest form of data storage technology.
This subsystem has struggled to find an easy hardware accelerated virtualization ar-
chitecture to speed up an already slow process. On virtualization platforms such as
KVM, the storage represented is in reality either a file on the hypervisors file system
or a partition on a physical disk set up by the hypervisor. These methods have ben-
efits such as simplicity and ease of management, but they also require the hypervisor
1

to be involved in all disk I/O operations, which adds an extra layer and therefore
extra latency to the already slow persistent storage.
When the storage is really a partition on a disk partitioned by the hypervisor, the
overhead is small because the hypervisor merely needs to forward the requests on to
the disk. On the other hand, when the storage is really a file, all of the requests need
to be translated and then passed through the file system of the hypervisor, increasing
latency. However, the performance of the I/O will suffer as a result of the additional
layers each request must go through. The latter approach has the benefit of being
able to migrate the storage (and the associated virtual machine) easily since the file
just needs to be copied. The former approach must perform operations on at least
the entire disk partition on the destination disk in order to provide room for the
migration.
Single-Root IO Virtualization (SR-IOV) was developed by the Peripheral Com-
ponent Interconnect Special Interest Group (PCI-SIG) to allow multiple virtual ma-
chines to access the same physical PCI-Express devices as if each virtual machine had
their own dedicated device [1]. This technology is growing in use in network interface
cards and the performance benefits in that space has been widely seen [2]. This tech-
nology has not seen wide adoption in the hard disk host bus adapter (HBA) space,
and there is very little known as for the performance benefits of allowing virtual ma-
chines to communicate directly to the HBA. This work will set up a sample system
with a SR-IOV capable HBA and measure its performance compared with the same
system without SR-IOV enabled and running Linux natively without virtualization.
Even with SR-IOV, the hypervisor is is still involved in the I/O path due to the
need to handle and route interrupts. The hardware will still issue interrupts to the
2

hypervisor operating system, which must then pass those interrupts on to its guests.
Secondly, since it requires direct memory access from the hardware, protection should
be provided to prevent the hardware from corrupting or accessing memory belonging
to another virtual machine. This partitioning and security may be accomplished using
an Input/Ouput Memory Management Unit (IOMMU) hardware, which is available
in newer CPUs from both Intel and AMD.
3

Chapter 2
Background
2.1 Linux SCSI Subsystem, a.k.a Bare Metal
The Linux SCSI Subsystem is the baseline of performance in this research. It should
provide the least amount of overhead since there are no virtualization layers for the
I/O to pass through, and it has the most direct route to the hardware. Since this is
running on a non-virtualized Linux system, it is referred to as “Bare Metal.”
There are three layers in the Linux SCSI subsystem. The top most layer provides
the block and char devices nodes used by filesystems for I/O. The upper layer also
provides the \dev nodes for the devices. The middle layer provides routing between
the top layer interfaces and the hardware devices and their drivers in the bottom
layer. It also provides a buffer between the different transport classes available, such
as iSCSI, Serial Attached SCSI (SAS), and Fibre Channel. The bottom layer is
where the hardware specific drivers exist. This layer is responsible for taking requests
from the middle layer, forming hardware readable commands and issuing them to the
4

hardware and then passing the responses back to the middle layer[3]. The lower layer
is also responsible for notifying the middle layer of new devices as they are added to
the physical topology.
The SAS transport is an evolution of the older parallel SCSI transport. SAS is
able to support thousands of devices on a single topology at line speeds of up to
12Gbps. It does away with the shared bus architecture so disk drives (sometimes re-
ferred to as the target) may be attached directly to the controller (sometimes referred
to as the initiator) or they may be attached to the controller through one or more ex-
pander devices, which operate much the same way as an Ethernet switch. Expanders
may be connected to the controller through wide ports, allowing the controller to
communicate with more than one device at a time.
2.2 Hypervisor Based Virtual Disks
In this research, QEMU is used to provide virtualization services to the Kernel Virtual
Machine (KVM). QEMU can provide at least two types of disk drives to the guest
operating systems. The first, Virtio, is a high performance platform for virtualizing
I/O operations, and requires specialized drivers in the guest to operate. It could be
used by several I/O devices in addition to disk based storage, such as network devices
[4].
2.2.1 Virtio
Virtio was developed to move virtualization towards a single, standard method of
handling paravirtualized I/O devices and transporting the I/O between the guest
5

and hypervisor. Paravirtualization is a technique where the guest driver and the
hypervisor use a virtualization specific means of passing the I/O rather than the
hypervisor presenting a completely emulated device found on real hardware devices.
There are several existing implementations, one each for Xen, KVM, VMWare, ad
nauseum. This unified technique will make new development easier due to an existing
infrastructure and design, and make maintenance easier with having a single, common
structure to maintain and support. Virtio also aims to reduce the complexity found
in some of the more proprietary formats, which can overlap functionality between the
guest drivers, the transport with the hypervisor, and the configuration of the devices
[5].
Virtio implements its transport abstraction for I/O requests using a ring buffer.
There are three portions, the descriptors which allow the guest to formulate address
and length tuples. The available ring describes the descriptors which are available for
use, and finally the used ring where the hypervisor places items which it has consumed
[5].
The block device Virtio driver has a simple header describing the request as a
simple read or write, or a more generic SCSI command. The header also contains a
heretofore unused priority field and a sector field which describes where on the virtual
disk the I/O is targeted. The header is placed into a free descriptor, which is chained
to another descriptor containing the memory information about the stored data. If
the memory is discontiguous, multiple descriptors will be chained together to form a
scatter gather list. The completed descriptor chain is placed on the available ring and
the hypervisor is notified there is a new entry available to process. The hypervisor
then processes the request by formulating a native I/O to the image storage location
6

and passing that to its own storage driver. On the return path, the I/O is completed
to the hypervisor, which triggers the hypervisor to place the request descriptor on
the used queue followed by a notification to the guest the I/O has completed [5].
2.2.2 IDE Emulation
QEMU also provides support for a non-paravirtualized storage interface which em-
ulates the legacy IDE interface. This interface is provided to allow guest operating
systems which do not have a driver written to support virtio to still be hosted on
a KVM virtualization environment. This feature is universally advised against for
guests which have support for the virtio interface due to the low performance seen by
the IDE interface [6].
2.2.3 Image Storage
The actual data can be stored on disk in several formats, each offering different
features and performance trade offs.
raw - This format stores the disk exactly as it would be on a physical drive, is simple
to emulate, and is easy to export to other emulators [7]. This method involves
the least amount of overhead in the hypervisor when translating between the
virtual sector and the physical location of the data store.
qcow2 - This format is the QEMU native format and provides features such as zlib
compression and AES encryption [7]. These features add extra complexity in
the I/O path and may perform lower than the raw format.
7

The data may be cached by the hypervisor, based on user selectable options. The files
may be write through, where the data is written to cache and the disk simultaneously;
write back, where the data is written to cache and then is written to the disk at some
later time; and finally may be stored in such a way where caching is disabled [8].
2.3 SR-IOV Hard Drive Controller Operation
Implementing SR-IOV on a hard drive controller requires three components: 1) the
controller itself; 2) the hypervisor driver; 3) and the guest driver.
The controller is the most complex portion of the SR-IOV stack. First and fore-
most, it must present the multiplicity of PCI-Express functions, both the physical
function for the hypervisor and the virtual function for the guests, to the PCI-Express
host to allow independent software to access the hardware simultaneously. Each of
these functions must have the queues necessary for the drivers to submit requests to
the controller and for the controller to submit replies to the drivers. Finally, each
function must be able to maintain the required interrupt configuration, most com-
monly the multiple MSI-X interrupt vectors associated with the function. With all
of these resources, the controller must then monitor the queues for new requests and
submit them to the SAS topology in a fair manner.
The hypervisor driver is responsible for configuring the controller and available
resources for use by the guests. To provide data security, the hypervisor instructs the
controller what virtual functions have access to what SAS devices. The hypervisor
driver may also provide traditional controller resources to the hypervisor through the
physical function so the hypervisor operating system may access disk resources in
8

parallel with the guests.
The hypervisor itself is responsible for assigning virtual functions to guests. A
guest may access multiple virtual functions, but a virtual function may only be ac-
cessed by a single guest at any one time. All that is required of the hypervisor is
to pass the physical PCI-Express memory space for that virtual function through to
the guest. When the guest drivers allocate interrupts for the virtual function, the
hypervisor must also assist the guest in registering the interrupts and then passing
them between the physical interrupt controller and the guest operating system.
The guest driver is identical to the default non-SR-IOV host driver for the con-
troller and it need not be aware it is running on a virtualized system at all. The
guest driver sees the same PCI-Express registers as it would when running on bare
metal Linux and a standard controller. The hypervisor hides the complexity of the
interrupts below the operating system itself. The MSI-x interrupts appear to arrive
in the same manner as they would in a normal, bare metal, system.
2.4 Benchmarks
This research used several storage benchmarking tools. Some are quite simple while
others strive to show a more real world I/O profile. All of these benchmarking tools
access the storage through a filesystem, so it was important to clear any operating
system cache before running them.
9

2.4.1 Bonnie++
The benchmarking tool Bonnie++ is an expansion of the original Bonnie benchmark
program, written by Tim Bray, which adds the capability of testing large storage space
using a 32-bit program [9]. The tests are designed to investigate common bottlenecks
in I/O subsystems when under heavy load. Two tests types were used in this research,
the sequential output and sequential input.
Sequential output performs three types of write I/O to the disk subsystem. It
performs character sized I/O using the putc() function provided by the standard
I/O library in C/C++. The test then re-opens the same file and uses write(2)
function to perform 1 KB1 block sized write operations to disk. Transferring large
blocks will tend to test the write throughput while the smaller I/O sizes will tend
to test the filesystem caches and the raw number of I/O operations per second the
underlying storage subsystem can support. The benchmark will then reopen the file
to perform read using read(2) and rewrite operations, using write(2), dirtying one
word in each block.
Sequential input performs two types of read operations to the storage. It first uses
getc() to read individual characters from the storage. The file is then reopened and
then read using read(2) to read 1 KB blocks of sequential data from the disk.
2.4.2 Postmark
The Postmark benchmarking utility was created to help fill a gap in showing the per-
formance of ephemeral small file access programs such as EMail and online shopping
1Here, KB refers to 1024 bytes of data. 1 MB refers to 220 bytes or 1,048,576 bytes.
10

web sites. Previous benchmarks utilize static large files to perform their testing, which
does not account for the transient small files used by the aforementioned application
types.
Postmark generates large numbers of small files that are constantly being created,
written to, read, and deleted. The size of the files in the pool of files and the size of
each file itself is configurable by the user. File creation causes a randomly selected
amount of data to be written with data from a portion of previously randomly gen-
erated data. Reads are done by randomly selecting a file, opening it, and reading the
entire file using a configured block size to memory [10].
The benchmark records statistics including the total time, time for creating the
initial files, time to read the files, time to append to the files, and the time taken
to delete the files. It also provides bandwidth results from these tests, showing the
amount of data read and written.
2.4.3 Dos
Dos is a benchmark developed to provide a simple application to compare the various
environments against. It is able to provide sequential and random reads in varying
block sizes using simple C provided libraries.
2.4.4 dd
The GNU\Linux utility called dd is used informally as a quick benchmark for storage
by users across the world. Its ubiquity provides a universal benchmark by which
results may be compared across multiple systems. It is by no means a thorough
11

benchmark, but it is able to provide a perspective on the performance of the storage
subsystem without going through a filesystem.
12

Chapter 3
Discussion
3.1 Issues
When implementing a virtualized environment and hosting tenant guests, it is im-
portant to provide a standard service to tenants as described by the service level
agreement. As ever, the trick is to provide these services at the specified level with-
out adding more overhead than is absolutely necessary, since the more overhead taken
by fairness enforcement results in less resources available for tenants, and therefore
the less resources generating revenue through the work the guests perform.
Disk Sharing A problem arises when using a single hard disk drive for multiple
virtual machines. If the virtual machines are accessing different parts of the disk
simultaneously, the disk head must seek across the media repeatedly, causing a higher
latency for each access. If the hypervisor assigned each guest a different partition on
the disk, then the accesses will be bounded by those disk partitions. If each guest is
accessing only the lower portion of its assigned disk area, there will be bands of hot
13

zones corresponding to the lower portions of each partition, and the disk head must
fly across the cold areas of the disk to reach the hot zones for the other guests. If
the disk has a sufficiently large cache, it may be able to reorder the accesses based
on relative locality, i.e. keep the accesses to the hot zones together.
This could have drawbacks of uneven performance for the various virtual machines.
The partitions located on the outside of the disk will be closer together (assuming
equal partition sizes) and will be optimized better than those closer to the interior
of the disk. This performance benefit is the reason organizations choose to short
stroke their drives to gain higher performance, except here some guests benefit from
their effective short stroking while other guests lose out. Short stroking drives is a
technique to utilize the faster outer cylinders of a disk to improve performance.
3.2 Benchmarks
I/O loads on servers can take on several different profiles. File servers tend to generate
a heavy load of sequential reads and writes, often using larger block sizes. Database
and mail servers on the other hand tend to generate a much larger set of very small
block random read and write operation because these loads need to write small email
messages or the blocksize of the database to the disk. The access sequence of these
small blocks has a relatively small amount of locality.
When testing the performance of the systems at the level of the operating system
and guest operating systems, smaller block I/O as found in databases will test the
overhead imposed by the storage subsystem, while larger block sequential I/O will
test the throughput of the data.
14

In all cases tested in this research, the data path is non-copy, so the only real test
is of the overhead. Overhead can be found between the guest and hypervisor, inside
the hypervisor, and between the hypervisor and its underlying storage system. There
are numerous ways of describing the location of the data, but all of them are some
form of scatter gather list (SGL), however each layer tends to use a different format
of SGL which implies the more fragmented the sequential data is in memory, the
more overhead will be created going through the layers of the hypervisor. For small
I/O operations, it is unlikely the request will use more than one element in the SGL,
due to the operating system’s page size being 4096 bytes. For I/O requests involving
larger than 4KB, the SGL overhead will become more pronounced as the I/O gets
larger. Bonnie++ and Postmark only uses I/O sizes smaller than 4KB, so it will not
see too much overhead. Dos and dd will transfer more than a page of data, and the
impact will be felt more significantly here.
Random and sequential I/O is only of consequence for the disk itself. There is no
additional overhead for random I/Os versus sequential I/Os. When testing on a single
disk, random I/Os could make the disk work harder thereby increasing response on
individual I/Os. On the other hand, since the disk head is already moving rapidly
across the disk, it could help place I/Os from different VMs closer together and
increase the distribution of locations on the disk. Sequential I/Os nearly guarantee a
fixed distance on the disk between the sequential areas for each partition.
Any benchmark used must be able to gauge the breadth of these types of I/O
profiles, or a profiler must use multiple tools to gather the information required.
Bonnie++ is an excellent model of file server type workloads because it tends to use
fairly large block sizes with a mix of sequential and random accesses. Postmark on
15

the other hand was written specifically to test the workloads of database servers and
mail servers. Postmark exclusively performs random I/O.
Due to the fact all of the benchmarks used in this research operated at the filesys-
tem level, it is important to clear the filesystem caches at all levels prior to running or
re-running tests otherwise the benchmarks may be measuring the speed of the filesys-
tem cache rather than the actual disk subsystem. Some of the benchmarks attempted
to overcome the effects of file caching by using files that are significantly larger than
the available memory on the system to make it impossible for the filesystem to cache
the entire file used in the test.
3.3 Questions
This research aims to answer the following questions within the bounds of the envi-
ronments tested.
1. Which storage virtualization approach gives the least overhead?
2. Which approach gives the best performance in a multi-tenant environment?
3. Given a specific workload, which approach performs the best?
3.4 Projections
As with all software based virtualzation techniques, the most important factor in
determining performance will be the overhead involved. Bare metal has the small-
est amount of overhead possible while providing flexibility and configurability for
16

the operating system and its applications. This interface has undergone decades of
refinements and analysis to become as streamlined as it possibly can be. Having
multiple processes access different partitions can still be optimized to achieve higher
performance as a whole.
Hypervisor based storage is relatively new and does not have nearly as much
research devoted to the same system as the bare metal case. This methodology
must take care of transferring data to the guest operating systems, translating the
virtual disk into a physical location on physical storage, formulating a physical I/O
operation, and passing that to the hardware. It must do this while arbitrating access
across multiple guests. At the same time, it could be possible for the hypervisor to
cache disk accesses (though this will not be used during the testing for this research),
which will help disk accesses. It could also be possible for the hypervisor to use the
arbitration overhead to its advantage by optimally scheduling the disk to minimize
the head movement.
Direct hardware access by the guests using SR-IOV offers bare metal overhead
in a virtualized environment. The guests deliver the I/O requests directly to the
hardware without any hypervisor intervention by using the I/O MMU. At the same
time, if multiple guests access the same physical disk, then there will be no intelligent
scheduling of those accesses except for any intelligence provided by the disk itself.
17

Chapter 4
Evaluation
4.1 Test Methodology
The testing performed in this research was executed using the three flavors of I/O
configuration discussed previously: using bare metal Linux; using hypervisor virtio
disks; and finally using SR-IOV physical hardware. The tests were performed on a
Dell PowerEdge T620 server (BIOS version 1.5.3) with a single Intel Xeon E5-2620
processor with 6 hyperthreaded cores running at 2.0 GHz. The server had 8 GB of
1333MHz DDR3 RAM. The server and operating system was configured to use the
available I/O MMU to accelerate memory access by the hardware.
The SAS controller used in the experiments was a LSISAS 3108, a 3rd generation
SAS controller made by LSI Corporation. This controller can be either a standard
non-SR-IOV controller or a SR-IOV controller based upon the firmware installed.
When testing SR-IOV, the controller was using SR-IOV firmware and in the bare
metal and virtio environments, the controller was in non-SR-IOV mode to accurately
18

represent the real-world usage of all three of the test cases. In both configurations,
the firmware version was 02.00.01.00. The number of virtual functions presented to
the system can also be configured, along with the resource allocation between the
functions, both physical and virtual. Except where noted, the number of virtual
functions was set to four and the available resources were equal across the virtual
functions. The physical function received reduced resources because it was not needed
for regular I/O operations. The resources in question are the depth of the request
queues provided to the driver to submit requests to the controller. Each function has
up to 8 MSI-x vectors available to it. The driver used was version 3.00.00.00 for non-
SR-IOV mode and 10.165.01.00 for the SR-IOV hypervisor driver. It should be noted
this SR-IOV driver and firmware are pre-production versions. Both the non-SR-IOV
firmware and driver are production versions.
When in SR-IOV mode, the controller must be configured with how to divide its
available resources between the virtual functions. It was decided to configure the
controller to provide each virtual function with 21% of the resources and the physical
function would have 16% of the resources for its own usage. This division is rather
arbitrary, and is discussed further in Chapter 6. A small amount of testing was done
changing the resource allocation and is discussed later in this chapter.
Attached directly to the controller were Seagate Savvio ST9146803SS 6Gbps
10,000 RPM 146GB SAS drives. Two access types to the physical disks was used. In
one case, each guest had access to its own exclusive disk. No machine other than the
one to which the disk was assigned could make any accesses to that disk. The other
paradigm used was sharing a single physical disk across multiple virtual machines.
The disk would be partitioned into four primary partitions with each virtual machine
19

given access to its assigned partition. Each virtual machine could format and mount
its own partition.
CentOS 6.3 with Linux Kernel 2.6.32–279.el6.x86 64 was used as both the host
and guest operating systems for these tests. KVM using libvirt version 0.9.10 was
installed as the hypervisor. The file system used in all cases was the simple and low
overhead ext3 file system. Virtio using the raw storage format was used in all cases
to keep the testing in line with the current recommendations put forth by the KVM
community.
Scripts were written to ensure the tests were executed the same way every time
and also the ensure the operating system caches of all of the systems involved were
cleared before running the tests. These scripts allowed the tester to easily execute 6
of the same test in order to average against temporal irregularities in the data. All
of the tests were run with 1, 2, 3, and 4 virtual machines or in the case of bare metal
testing, numbers of simultaneous processes running the same test. In the cases where
virtual machines were used, when the test execution reduced the number of guests
needed, the extra guest was shut down before continuing so as to ensure it would not
steal resources from the running virtual machines.
4.2 Independent Disks
To determine which paradigm has the least overhead, testing was performed using
independent disks for each virtual machine. The only resources the guests would be
in contention for would be CPU, interrupt, and hard disk controller related.
20

Bonnie++ The Bonnie++ benchmark showed for write operations, bare metal
had the worst performance while SR-IOV and virtio had relatively similar perfor-
mance as seen in Figure 4.1. This seems counterintuitive since the bare metal case
should have the least amount of overhead and therefore the best performance. All
three also showed a non-sequential decrease in throughput as the number of virtual
machines increased, however all of the results were similar enough to be considered
identical. Large block write throughput also showed a non-sequential decrease in
throughput except for virtio. Single VM throughput was worse on bare metal than
in SR-IOV or virtio, suggesting the processes were interfering with one another in
either the filesystem or the middle layer of the Linux SCSI subsystem when not put
into separate guests, which given the severe drop off in throughput when the number
of simultaneous processes was increased to four.
The read performance showed very different results between small I/O and larger
block I/O shown in Figure 4.2. SR-IOV and bare metal cases show very compara-
ble performance in the small block tests, while virtio turned in consistently lower
throughput across all the number of VMs tested. This supports the idea virtio has
much higher overhead since no caching could take place and the small I/O size will
tend to show the overhead in processing each individual request. As could be ex-
pected, the large block throughput was significantly higher than the smaller block
throughput, showing the smaller overhead involved in transferring a given amount
of data. Unexpectedly, however, was bare metal having much lower performance
once more than one process was active simultaneously. As with the write case, this
is likely due to undesirable interaction between the processes causing interference in
those test cases. SR-IOV turned in the highest throughput of all of the environments,
21

0
20000
40000
60000
80000
100000
120000
Bare Metal Per Chr SR-IOV Per Chr Virtio Per Chr Bare Metal Block SR-IOV Block Virtio Block
KB
/s
1 VM
2 VM
3 VM
4 VM
Figure 4.1: Average VM Write Throughput with Independent Disks using Bonnie++
0
20000
40000
60000
80000
100000
120000
140000
160000
Bare Metal Per Chr SR-IOV Per Chr Virtio Per Chr Bare Metal Block SR-IOV Block Virtio Block
KB
/s
1 VM
2 VM
3 VM
4 VM
Figure 4.2: Average VM Read Throughput with Independent Disks using Bonnie++
22

besting virtio across the board, again indicative of the higher overhead in transferring
the data between the hardware, the hypervisor, and the guest, though in this case
it could be attributed more to the scatter gather list translation over the individual
request overhead.
Comparing each method against itself with varying number of guests, write per-
formance was fairly flat across all test configurations. Read performance on the other
hand in bare metal showed a steady decline as the number of processes increased.
SR-IOV and virtio showed a much less pronounced decline in performance as the
number of guests increased, especially for large block requests.
Looking at the CPU utilization during each test in Figure 4.3, write tests indicated
the bare metal had the lowest usage and the virtualization techniques both showed
similar CPU usage. During read tests in Figure 4.4, small block reads caused the
highest usage in bare metal and SR-IOV with virtio having the lowest average usage.
For larger block I/Os, all techniques had similar CPU utilization with writes having
higher utilization than read operations.
What happens if the resources match what will be used? Figure 4.5 shows a com-
parison of small and large block writes using SR-IOV in the same configuration as
seen in Figure 4.1 along with the firmware configured to allocate resources with 16%
going to the physical function and the remaining resources evenly split between the
utilized virtual functions. Note the four VM case is not tested as the configuration
would be the same in both cases. Figure 4.6 shows a similar figure with read I/O
operations. In both the SR-IOV and the minimum SR-IOV configuration, the per-
formance is similar for both read and write. This result indicates for this workload,
the resources were not the bottleneck.
23

0
20
40
60
80
100
120
Bare Metal Per Chr SR-IOV Per Chr Virtio Per Chr Bare Metal Block SR-IOV Block Virtio Block
CP
U U
sag
e %
1 VM
2 VM
3 VM
4 VM
Figure 4.3: Average VM Write CPU % with Independent Disks using Bonnie++
0
20
40
60
80
100
120
Bare Metal Per Chr SR-IOV Per Chr Virtio Per Chr Bare Metal Block SR-IOV Block Virtio Block
CP
U U
sag
e %
1 VM
2 VM
3 VM
4 VM
Figure 4.4: Average VM Read CPU % with Independent Disks using Bonnie++
24

0
20000
40000
60000
80000
100000
120000
Minimum Per Chr SR-IOV Per Chr Minimum Block SR-IOV Block
KB
/s 1 VM
2 VM
3 VM
Figure 4.5: Average VM Write Throughput Comparing SR-IOV Configurations using
Independent Disks and Bonnie++
25

0
20000
40000
60000
80000
100000
120000
140000
160000
Minimum Per Chr SR-IOV Per Chr Minimum Block SR-IOV Block
KB
/s 1 VM
2 VM
3 VM
Figure 4.6: Average VM Read Throughput Comparing SR-IOV Configurations using
Independent Disks and Bonnie++
26

Postmark In comparing the performance of the various methods under the Post-
mark benchmark, virtio on the whole performed the best on both read and write op-
erations. Read and write performance on this benchmark, though scaled differently,
was interestingly identical as seen in Figures 4.7 and 4.9. This property suggests the
multiple file properties made it much more difficult to cache the write operations in
the file system of the operating systems.
0
0.5
1
1.5
2
2.5
3
Bare Metal Read MB/s SR-IOV Read MB/s Virtio Read MB/s
MB
/s
1 VM
2 VM
3 VM
4 VM
Figure 4.7: Average VM Read Throughput with Independent Disks using Postmark
Far more interesting in this benchmark was the effects of adding additional guests.
Bare metal performance had the best performance seen when there was only one
benchmark running, but that performance quickly tailed off as additional processes
were added. SR-IOV was able to keep performance the same as the number of guests
increased, although it was not able to achieve the average performance of either bare
27
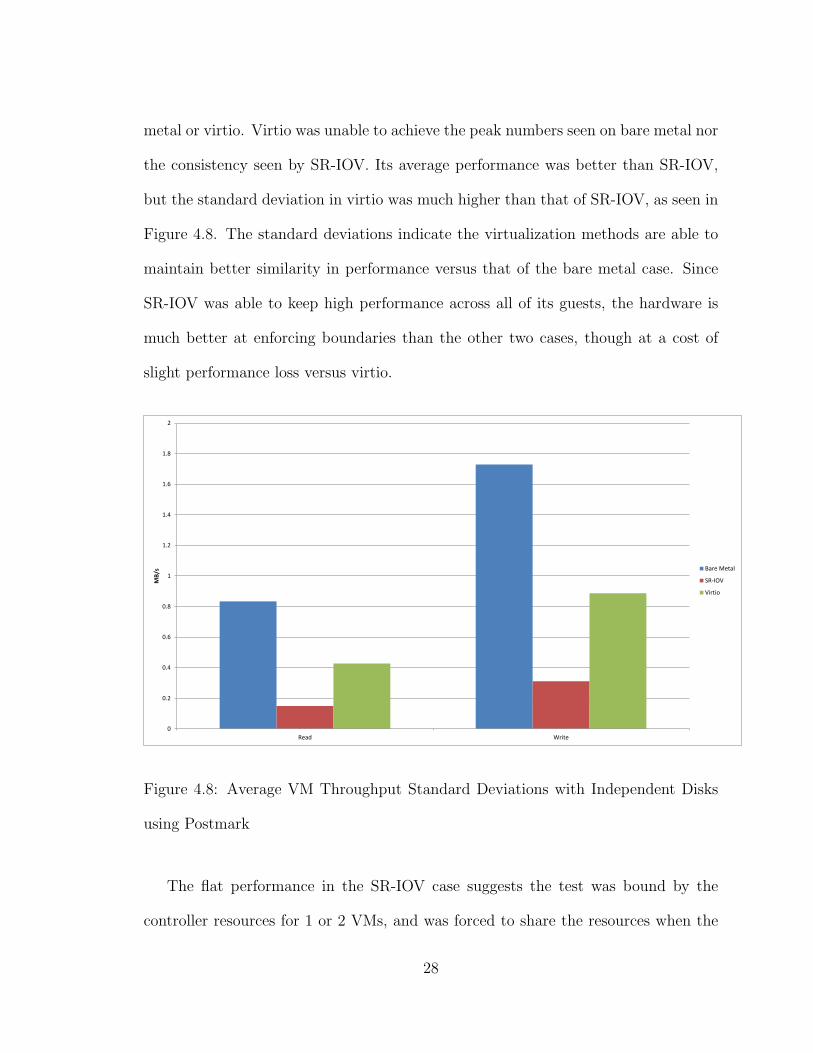
metal or virtio. Virtio was unable to achieve the peak numbers seen on bare metal nor
the consistency seen by SR-IOV. Its average performance was better than SR-IOV,
but the standard deviation in virtio was much higher than that of SR-IOV, as seen in
Figure 4.8. The standard deviations indicate the virtualization methods are able to
maintain better similarity in performance versus that of the bare metal case. Since
SR-IOV was able to keep high performance across all of its guests, the hardware is
much better at enforcing boundaries than the other two cases, though at a cost of
slight performance loss versus virtio.
0
0.2
0.4
0.6
0.8
1
1.2
1.4
1.6
1.8
2
Read Write
MB
/s Bare Metal
SR-IOV
Virtio
Figure 4.8: Average VM Throughput Standard Deviations with Independent Disks
using Postmark
The flat performance in the SR-IOV case suggests the test was bound by the
controller resources for 1 or 2 VMs, and was forced to share the resources when the
28

0
1
2
3
4
5
6
Bare Metal Write MB/s SR-IOV Write MB/s Virtio Write MB/s
MB
/s
1 VM
2 VM
3 VM
4 VM
Figure 4.9: Average VM Write Throughput with Independent Disks using Postmark
number of VMs increased. The lack of performance in bare metal suggests there was
some inefficiency in servicing the multiple processes in the single operating system.
Virtio was able to avoid the single operating system bottleneck while being able to
more fully utilize the resources available on the hardware, though overhead could still
be an issue for small number of guest systems.
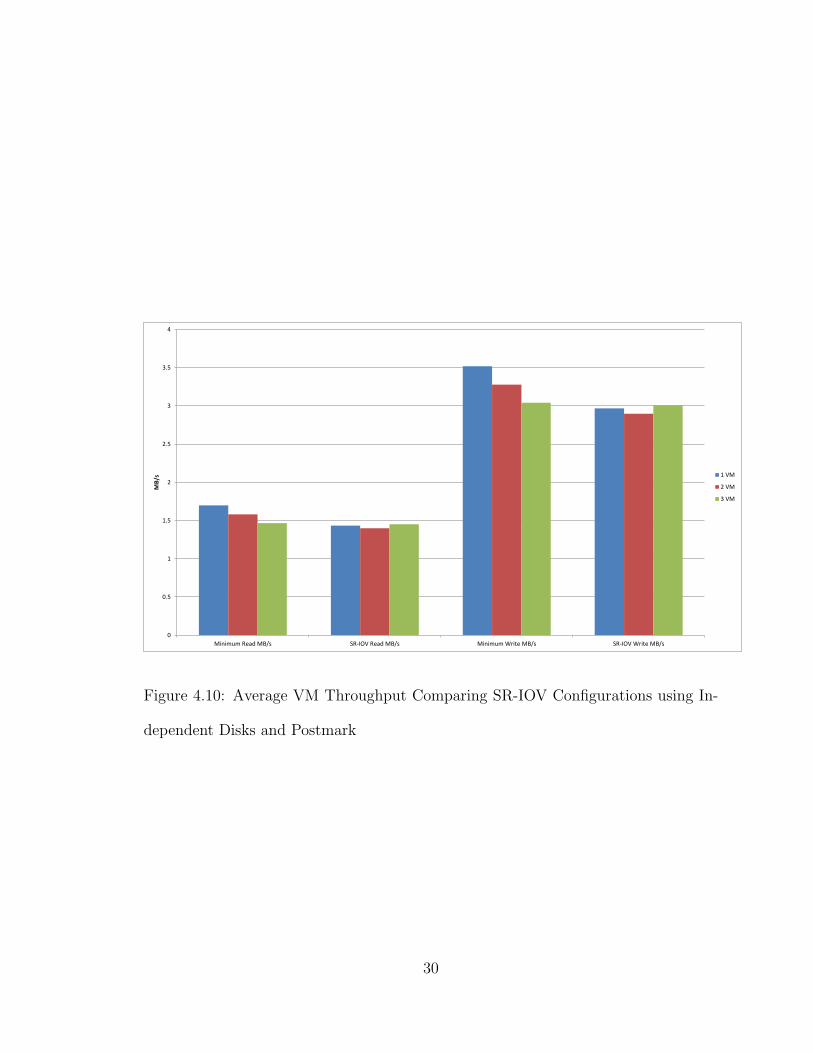
Figure 4.10 shows how the resources can affect performance when using the Post-
mark benchmark. Unlike the Bonnie++ results, here the resource allocation in the
minimum SR-IOV configuration shows a performance beneift in the one and two
guest configurations. Since the Postmark benchmark uses many more files, it is much
more likely to issue more requests and therefore consume more resources than the
Bonnie++ benchmark.
29
0
0.5
1
1.5
2
2.5
3
3.5
4
Minimum Read MB/s SR-IOV Read MB/s Minimum Write MB/s SR-IOV Write MB/s
MB
/s 1 VM
2 VM
3 VM
Figure 4.10: Average VM Throughput Comparing SR-IOV Configurations using In-
dependent Disks and Postmark
30

4.3 Disk Sharing
Sharing disks between virtual machines or processes increases the stress of the I/Os
on the hard disk drive.
0
20000
40000
60000
80000
100000
120000
Bare Metal Per Chr SR-IOV Per Chr Virtio Per Chr Bare Metal Block SR-IOV Block Virtio Block
KB
/s
1 VM
2 VM
3 VM
4 VM
Figure 4.11: Average VM Write Throughput with Shared Disks using Bonnie++
Bonnie++ Looking at write performance in a shared disk configuration, it is clear
adding additional guests has a significant degradation in performance. In both big
and small block writes, once more than one guest was operational at the same time,
the performance was even across the board as seen in Figure 4.11. The only difference
is with single VM testing, which showed similar performance as with the independent
disk tests, which would be expected since the test is effectively the same. It is clear
the disk is the bottleneck in this configuration.
31

0
20000
40000
60000
80000
100000
120000
140000
160000
Bare Metal Per Chr SR-IOV Per Chr Virtio Per Chr Bare Metal Block SR-IOV Block Virtio Block
KB
/s
1 VM
2 VM
3 VM
4 VM
Figure 4.12: Average VM Read Throughput with Shared Disks using Bonnie++
Read performance with shared disk, as with the write tests, shows a significant
drop in performance as the number of guests increase. As opposed to the write tests,
big block and small block tests showed different throughput. In the small block tests,
the performance level was similar across all environments. In large block tests, SR-
IOV and bare metal showed similar levels, while virtio had problems keeping up.
Since the performance levels were different between the environment types, it is clear
virtio suffers from its additional overhead even when the disk is being shared across
multiple guests. This is an interesting result as the hypervisor should be able to
perform some scheduling on the disk to keep accesses localized, however SR-IOV
which has absolutely no centralized disk scheduling was able to outperform it. Either
the overhead of virtio is extremely high or the scheduling mechanism in the hypervisor
is actually degrading performance.
32

0
0.5
1
1.5
2
2.5
3
Bare Metal Read MB/s SR-IOV Read MB/s Virtio Read MB/s
MB
/s
1 VM
2 VM
3 VM
4 VM
Figure 4.13: Average VM Read Throughput with Shared Disks using Postmark
0
1
2
3
4
5
6
Bare Metal Write MB/s SR-IOV Write MB/s Virtio Write MB/s
MB
/s
1 VM
2 VM
3 VM
4 VM
Figure 4.14: Average VM Write Throughput with Shared Disks using Postmark
33

Postmark As with the independent disk testing, the read and write performance
was identical except for a scaling factor, as seen in Figure 4.13 and Figure 4.14. Unlike
Bonnie++, the throughput did not experience a incremental decrease in performance
as the number of guests increased. For bare metal, the performance significantly
degraded when the first additional processes was added, but as additional processes
were added, the throughput actually improved. The first additional guest for both
SR-IOV and virtio severly impacted the throughput of both tests, and subsequently
added guests did not have quite as much of a negative impact.
4.4 Performance on Single Workload
To test a single workload, this research used a shared disk and a custom micro bench-
mark called dos to look at how each profile would perform. Finally, a common
GNU/Linux utility called dd was used to show simple sequential read throughput on
the three environments.
Dos As seen in Figure 4.15, SR-IOV and bare metal performed identically for se-
quential reads across all block sizes with throughput dropping 17% from one simulta-
neous worker to four simultaneous workers. When running virtio based storage on the
guests, performance dramatically degraded as the number of guests increased. Even
adding a single guest saw a performance drop of 57%. Adding one more guest dropped
performance an additional 15% from the single guest performance. With four guests,
the total performance drop was 78% of the single guest performance. This was true
for block sizes ranging from 16KB to 1024KB. Since bare metal and SR-IOV did not
34

0
20
40
60
80
100
120
140
Bare Metal 16KB SR-IOV 16KB Virtio 16KB Bare Metal 128KB SR-IOV 128KB Virtio 128KB Bare Metal 1024KB SR-IOV 1024KB Virtio 1024KB
MB
/s
1 VM
2 VM
3 VM
4 VM
Figure 4.15: Average VM Sequential Read Throughput with Shared Disks using Dos
suffer nearly as significantly when adding workload, it can be concluded the disks
were not the limiting factor and CPU speed was also not the limiting factor since
SR-IOV was able to achieve much higher performance for its guests. Interestingly, for
single guest workloads, virtio had the highest throughput of all of the environments
for all block sizes.
Figure 4.16 displays the results under random read operations, SR-IOV and virtio
performed nearly identically under a 16KB and 128KB block size, both showing about
a 77% drop. When the block size of the read operation was increased to 1024KB, all
three environments had similar results for single guest performance, for two guests
virtio showed similar results as SR-IOV, and for three and four guests, the through-
put on virtio was significantly lower than the other two environments. The similarity
between the environments in the smaller two block sizes indicate the disk was the bot-
35

0
10
20
30
40
50
60
70
80
90
100
Bare Metal 16KB SR-IOV 16KB Virtio 16KB Bare Metal 128KB SR-IOV 128KB Virtio 128KB Bare Metal 1024KB SR-IOV 1024KB Virtio 1024KB
MB
/s
1 VM
2 VM
3 VM
4 VM
Figure 4.16: Average VM Random Read Throughput with Shared Disks using Dos
tleneck for performance. For the largest block size, the environment was the limiting
factor. The high performance on bare metal indicates the file system scheduler was
able to more optimally schedule the requests to improve response time. The lower
performance on high VM count in virtio again shows there is some bottleneck in the
virtio path that arises when the number of VMs increases.
dd Figure 4.17 shows the throughput as measured by the dd utility provided by the
Linux distribution while using shared storage. With one copy of the utility running,
all environments show roughly the throughput available at the disk, a little more
than 120 MB/s, though virtio and SR-IOV have slightly higher results than the bare
metal test. Running more than one copy of the utility in bare metal shows a drop in
performance, but the number of additional workers does not affect the throughput,
36

0
20
40
60
80
100
120
140
Bare Metal SR-IOV Test 1 Virtio
MB
/s
1 VM
2 VM
3 VM
4 VM
Figure 4.17: Average VM Throughput with Shared Disks using dd
suggesting a problem at a higher layer. SR-IOV and virtio both show similar results
as the number of workers increase, with SR-IOV having a very small advantage. It is
clear the disk scheduler working on the bare metal operating system is helping improve
the throughput as the number of workers increase. Any optimization provided by
virtio is ineffective since the numbers in that environment are so similar to SR-IOV,
which has no optimizations.
Looking at the individual workers in Figure 4.18 and not the average of all of
the workers, virtio shows nearly perfectly even results across all of the workers. Bare
metal had a fairly consistent drop across all of the individual workers. SR-IOV shows
excellent service for the first guest, significantly less for the next, and so on. This
is in contrast with the other tests where SR-IOV had consistently the most even
performance for all of the guests. It is surprising to see the fourth worker see the
37

lowest performance because it was allocated the outer cylinders, receiving the benefit
of effectively short stroking the disk. Since bare metal and SR-IOV share no portion
of the I/O path except what is in the hardware, the conclusion is the hard drive is the
bottleneck. Virtio provides consistent performance across guests at the cost of good
performance for any guest. This test was run a second time and the results there
showed very little variation between guest throughput. The huge variability between
runs indicates a small variation in the initial conditions of the test can change the
results dramatically.
0
20
40
60
80
100
120
140
Bare Metal SR-IOV Test 1 Virtio
MB
/s
VM1
VM2
VM3
VM4
Figure 4.18: dd Throughput per VM with Shared Disks and 4 VMs
38

Chapter 5
Conclusion
By most measures, SR-IOV was able to keep on par with the bare metal environ-
ment. Under workloads with many small files, it was able to provide the most even
performance of all of the environments. In all measures except for the Bonnie++
write throughput, virtio was unable to keep up with bare metal or SR-IOV in terms
of throughput. In some tests, it had abysmal performance which could only be at-
tributed to a misbehaving optimization, but it also shows the inherent problem in
adding overhead in order to virtualize hardware resources. This overhead is expected
and therefore the performance impact was anticipated. What was unanticipated was
the uneven performance between VMs. Since virtio has added software overhead, it
should be able to enforce even performance and have the ability to optimally schedule
the disk when there is contention between mutliple guests and one physical resource.
This second point should be the most important because scheduling the I/O requests
optimally for the disk will inevitably force even performance across guests.
It can also be concluded the SR-IOV implementation reduces the need for I/O
39
fairness scheduling in the hypervisor. All of the I/O overhead of formulating the
I/O to submit to the hardware is borne by the guest itself instead of on behalf of
the guest by the hypervisor. This should significantly reduce the complexity of the
scheduler routines used by the hypervisor to schedule the guests to run on the CPU.
It should also make fairness easier between I/O intensive tennants and CPU intensive
tennants since the only resource arbitrated by the hypervisor is access to the CPU.
This property could help large cloud hosting organizations achieve better fairness and
reduce the importance of I/O scheduling in the hypervisor scheduler algorithms.
40

Chapter 6
Future Work
While running the tests described in this research, it was observed configuring per-
missions for the guests on the SR-IOV controller was difficult. It would be useful for
future developers to implement some means of having the SR-IOV resources be con-
figured by the hypervisor configuration utilities rather than through separate means
provided in a vendor unique manner by the SR-IOV driver. This would provide a
much more flexible interface that could be used by many vendors and would make
the job of administrators much easier when faced with a changing environment.
Another possible improvement would be to change the affinity of the guests to be
pinned to certain CPUs if it is using SR-IOV. In the bare metal environment, the
driver allocates one MSI-x vector per CPU in order to route the I/O replies back to
the CPU which initated the request. When virtualization is used, the CPU the guest
is running on may change at the whim of the hypervisor, reducing the ability to keep
recently used data in the CPU cache.
Another thread of future research would be to investigate means of issuing hard-
41

ware interrupts directly to a running guest, rather than needing to break to the
hypervisor to route and map the interrupt to the guest.
This work did not investigate many optimizations in the hard disk controller card
itself. What is the performance of the bare metal case when the resources are spread
thin just as they were for the guests accessing the controller through SR-IOV? Why
was the performance limited so much in the benchmarks when using SR-IOV? At the
conceptual level, the performance should have matched the performance seen when
using bare metal. Was the interrupt routing through the hypervisor really significant
enough to disrupt performance? If not, what is the bottleneck?
A small performance improvement could be found if all entities used the same
format of SGL. The virtio library proposes its own proprietary format [5], the Linux
kernel uses another, and finally the driver and the hardware use yet another. If
the entire stack converged on a uniform SGL format, a certain amount of overhead
dedicated towards converting the SGLs can be eliminated and the performance of the
entire stack, with or without virtualization can be improved.
42

Bibliography
[1] PCI-SIG. Single root i/o virtualization. http://www.pcisig.com/
specifications/iov/single_root/, Jan 2010. Accessed: 2013-04-17.
[2] Jiuxing Liu. Evaluating standard-based self-virtualizing devices: A performance
study on 10 gbe nics with sr-iov support. In Parallel Distributed Processing
(IPDPS), 2010 IEEE International Symposium on, pages 1–12, 2010.
[3] James Bottomley and Rob Landley. SCSI Interfaces Guide. Linux Foun-
dation, 660 York Street, Suite 102 San Francisco, CA 94110, 2007. https:
//www.kernel.org/doc/htmldocs/scsi/index.html Accessed: 2013-11-02.
[4] Ismael Luceno. Qemu/devices/virtio. https://en.wikibooks.org/wiki/QEMU/
Devices/Virtio, Dec 2012. Accessed: 2013-11-2.
[5] Rusty Russell. virtio: towards a de-facto standard for virtual i/o devices. ACM
SIGOPS Operating Systems Review, 42(5):95–103, 2008.
[6] Avi Kivity and Anthony Liguori. Tuning kvm. http://www.linux-kvm.org/
page/Tuning_KVM, September 2012. Accessed: 2013-11-2.
43

[7] Anthony Liguori. Qemu emulator user documentation. http://wiki.qemu.org/
download/qemu-doc.html#disk_005fimages, Jan 2010. Accessed: 2013-11-2.
[8] Qemu/devices/storage. https://en.wikibooks.org/wiki/QEMU/Devices/
Storage, May 2012. Accessed: 2013-11-2.
[9] Tim Bray and Russel Coker. Bonnie++ documentation. http://www.coker.
com.au/bonnie++/readme.html, 1999. Accessed: 2013-10-29.
[10] Jeffrey Katcher. Postmark: A new file system benchmark. Technical re-
port, Technical Report TR3022, Network Appliance, 1997. www. netapp.
com/tech library/3022. html, 1997.
44