virtual load development & fatigue analysis - msc...
TRANSCRIPT

MSC Software Confidential 2012 International Ground Vehicle Users Symposium
Virtual Load Development &
Fatigue Analysis 2012 International Ground Vehicle Users Symposium
Presented By: Wayne Tanner
October 30, 2012

MSC Software Confidential 2012 International Ground Vehicle Users Symposium
• Provide Simulations Services and
Software, with focus on Dynamics,
Fatigue and Load Development
• Strong background in the off-
highway industry
• Focused on helping our customer
implement simulation processes
and tools to drive product
development
• MSC VAR
• Founded 2001
Leading Edge Engineering
2

MSC Software Confidential 2012 International Ground Vehicle Users Symposium
• What it is
– Set of tools to develop system level models to understand system
dynamics and predict fatigue life
– Use in the concept development phase to generate load data for untested
systems or to iterate through design alternatives
• What it is NOT
– Doesn’t replace physical testing – it augments it
– Physical testing is critical to validate assumptions simulation inputs
Virtual Loads/Fatigue Process

MSC Software Confidential 2012 International Ground Vehicle Users Symposium
• Majority of our customer base is using FE tools to validate and
drive product design processes
– Off-Highway customers are typically working with structural components
and weldments, concerned about fatigue issues
– Typically using some type of “screening loads” (G load, max or limit load,
etc.), then apply each load individually to Stress-Life fatigue analysis
– Difficulty correlating fatigue failures with screening load failure locations
and life predictions
• Limitations of Measured Duty Cycle Fatigue Loads
– Acquisition of measured loads are expensive and time consuming tasks
– Measured loads are vehicle/component dependent and scaling to other
vehicles can be difficult
– Difficult to acquire data for new events and vehicles to be relevant during
development process
Motivation behind Virtual Loads/Fatigue Process
4

MSC Software Confidential 2012 International Ground Vehicle Users Symposium
• Software
– MBD Tool - Adams
– FE Solver - Nastran
– Fatigue Analysis – MSC Fatigue
• System Models - Duty Cycle Events
– Simply mimic test track, or complete set of events
• Fatigue Analysis Method
– Quasi-Static or Dynamic Analysis
– Stress & Strain life Algorithms
– Weld Fatigue Analysis
• Damping (how to measure and define)
• Correlation to Test
Components of a Virtual Loads/Fatigue Process
5
MSC Software Confidential 2012 International Ground Vehicle Users Symposium
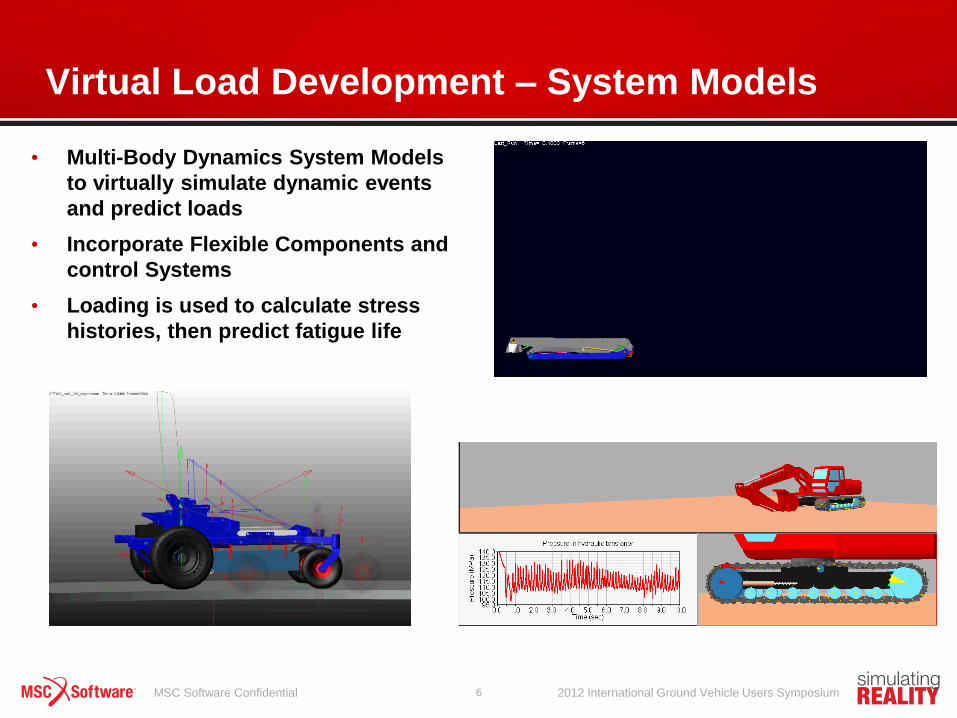
• Multi-Body Dynamics System Models
to virtually simulate dynamic events
and predict loads
• Incorporate Flexible Components and
control Systems
• Loading is used to calculate stress
histories, then predict fatigue life
Virtual Load Development – System Models
6
MSC Software Confidential 2012 International Ground Vehicle Users Symposium
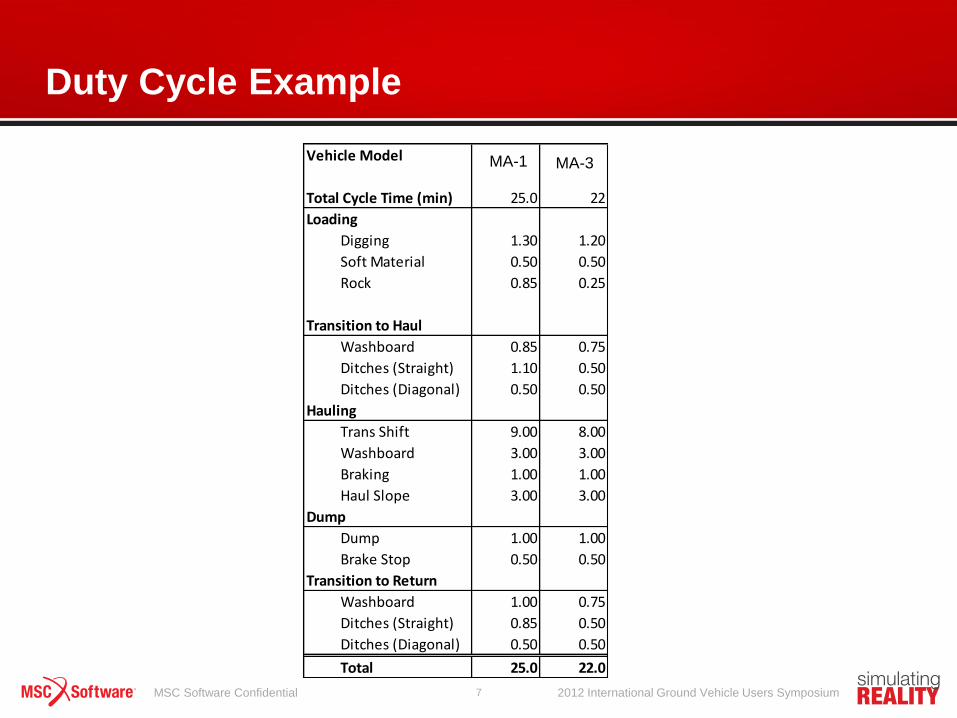
Duty Cycle Example
7
Vehicle Model XXX XXZ
Total Cycle Time (min) 25.0 22
Loading
Digging 1.30 1.20
Soft Material 0.50 0.50
Rock 0.85 0.25
Transition to Haul
Washboard 0.85 0.75
Ditches (Straight) 1.10 0.50
Ditches (Diagonal) 0.50 0.50
Hauling
Trans Shift 9.00 8.00
Washboard 3.00 3.00
Braking 1.00 1.00
Haul Slope 3.00 3.00
Dump
Dump 1.00 1.00
Brake Stop 0.50 0.50
Transition to Return
Washboard 1.00 0.75
Ditches (Straight) 0.85 0.50
Ditches (Diagonal) 0.50 0.50
Total 25.0 22.0
MA-1 MA-3
MSC Software Confidential 2012 International Ground Vehicle Users Symposium
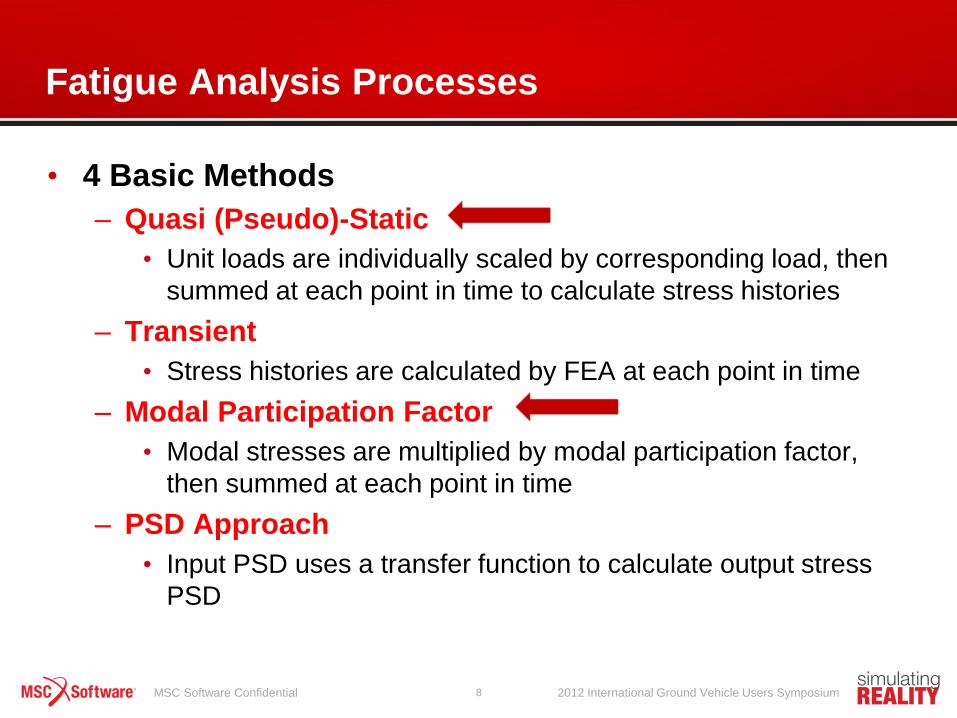
• 4 Basic Methods
– Quasi (Pseudo)-Static
• Unit loads are individually scaled by corresponding load, then
summed at each point in time to calculate stress histories
– Transient
• Stress histories are calculated by FEA at each point in time
– Modal Participation Factor
• Modal stresses are multiplied by modal participation factor,
then summed at each point in time
– PSD Approach
• Input PSD uses a transfer function to calculate output stress
PSD
Fatigue Analysis Processes
8
MSC Software Confidential 2012 International Ground Vehicle Users Symposium
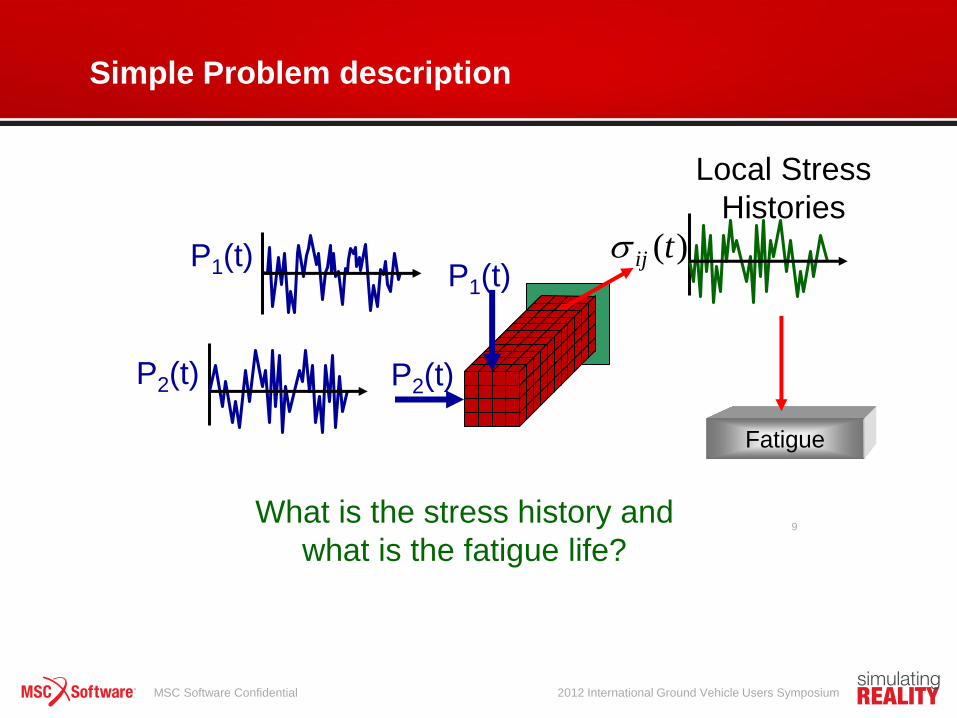
Simple Problem description
What is the stress history and
what is the fatigue life?
Local Stress
Histories
P2(t)
P1(t) P1(t)
P2(t)
Fatigue
)(tij
9

MSC Software Confidential 2012 International Ground Vehicle Users Symposium
Pseudo Static
= Stress for unit
load case k
P1,fea=1
P2,fea=1
x
+
=
x
Real Load P1(t)
Real Load P2(t)
Stress time signal at element ij
in some predetermined direction
k
kijkij tPt ,)()(
1,ij
2,ij
1,ij
2,ij
)(tij
kij ,
FL < 1/3 FN
10

MSC Software Confidential 2012 International Ground Vehicle Users Symposium
Modal Participation Factor method
Stress time signal at element ij
in some predetermined direction
m
mijmij tt ,)()(
1,ij
)(tij
Modal stress results
at element ij for
modes 1,2,…m
Load time history at
point k=1
Load time history at
point k=2
1,2)( mkt2,2)( mkt
5,2)( mkt
3,2)( mkt
4,2)( mkt
1,1)( mkt2,1)( mkt
5,1)( mkt
3,1)( mkt
4,1)( mkt
Combine Participation
Factors for each mode
FL > 1/3 FN
11

MSC Software Confidential 2012 International Ground Vehicle Users Symposium
The basis of the Modal Participation Factor (MPF) method is that each loading
input can be split up into the contribution factors associated with each mode
shape for the structure. In NASTRAN both the modal stresses and modal
participation factors can be extracted from a single sol 112 analysis. In Adams,
the modal participation factors can be exported from a simulation for
each flex body. The modal superposition is then calculated as follows:
where t) is the output stress tensor
i is the stress tensor for mode i
it) is the modal participation factor for mode i
i
ii tt )()(
Modal Participation Factors
12

MSC Software Confidential 2012 International Ground Vehicle Users Symposium
Is the highest possible frequency of
loading greater than one third of the 1st
natural frequency?
frequency
Transfer
function
Fn
1st natural
frequency
FL
Highest loading
frequency
FL < 1/3 FN
Is it necessary to include dynamic response ?
Static Response
13

MSC Software Confidential 2012 International Ground Vehicle Users Symposium
Identify
Limiting
Loads & CP
Optimize &
Redesign
Structure
Simulation Process – Quasi Static
14
MBD Model Run Simulation
Generate Load Data
Fatigue Analysis
Scale & Combine Calculate Fatigue Results
Modal Analysis & MNF
Create FEM
Generate Unit Load Results
Create MBD Model - Adams • Build all kinematic connections, add track and tire data
Create FEM - Patran • Midplane geometry, create Finite Element Mesh –
Midplane surfaces and meshing done in Patran
Run Simulation - Adams • Import MNF files for Flex Body components, run
simulation for CW and CCW track
Fatigue Analysis – MSC Fatigue • Using scale and combine technique, the analysis take each
individual unit load results set, and scales it by the proper
load set, then linearly combines the stress state for each load
at each point in time for all elements in the model
Export Load Data - Adams • Export load data for each attachment point on
frame. This uses Adams/Durability option to export
loads in proper format Unit Load Analysis - Nastran • At each attachment point, solve model with a single
unit load for each load component (X,Y,Z, RX, RY,
RZ). I this model we have 22 load points for frame =>
22*6= 132 unit loads runs
Modal Analysis - Nastran • Run normal modes analysis in Nastran and create
the MNF (Modal Neutral File) file for Adams – This
the flex body representation that allows deformation
in Adams simulation
Fatigue Results - Patran • Analysis creates contour plots of results, which are
then plotted in FEA post processor to view life
results. In this case, scale is in hrs, with a goal of
260 hrs (equal to time on test track)

MSC Software Confidential 2012 International Ground Vehicle Users Symposium
Identify
Limiting
Loads & CP
Optimize &
Redesign
Structure
Simulation Process – Modal Participation
Factors
15
MBD Model Run Simulation
Generate Modal
Participation Files
Calculate Fatigue Results Modal Analysis & MNF
Create FEM
m
mijmij tt ,)()(
Create MBD Model - Adams • Build all kinematic connections, add track and tire data
Create FEM - Patran • Midplane geometry, create Finite Element Mesh –
Midplane surfaces and meshing done in Patran
Run Simulation - Adams • Import MNF files for Flex Body components, run
simulation for CW and CCW track
Fatigue Analysis – MSC Fatigue • Using modal participation technique, the analysis take modal
stress results, and scales it by the proper participation factor,
then sums the stress state for each mode at each point in
time for all elements in the model
Export Load Data - Adams • Export Modal Participation files for each mode. This
uses Adams/Durability option to export loads in proper
format
Modal Analysis - Nastran • Run normal modes analysis in Nastran and create
the MNF (Modal Neutral File) file for Adams – This
the flex body representation that allows deformation
in Adams simulation
Fatigue Results - Patran • Analysis creates contour plots of results, which are
then plotted in FEA post processor to view life
results. In this case, scale is in hrs, with a goal of
260 hrs (equal to time on test track)

MSC Software Confidential 2012 International Ground Vehicle Users Symposium
What is Failure
Crack too big
Crack initiation
Glue joint
breaking
Loss of
stiffness delamination
Loss of
functionality
Durability Fatigue
Damage
Tolerance
Total seperation
16

MSC Software Confidential 2012 International Ground Vehicle Users Symposium
• S-N (Stress-Life)
Relates nominal or local elastic stress to fatigue life
• e-N (Strain-Life)
Relates local strain to fatigue life
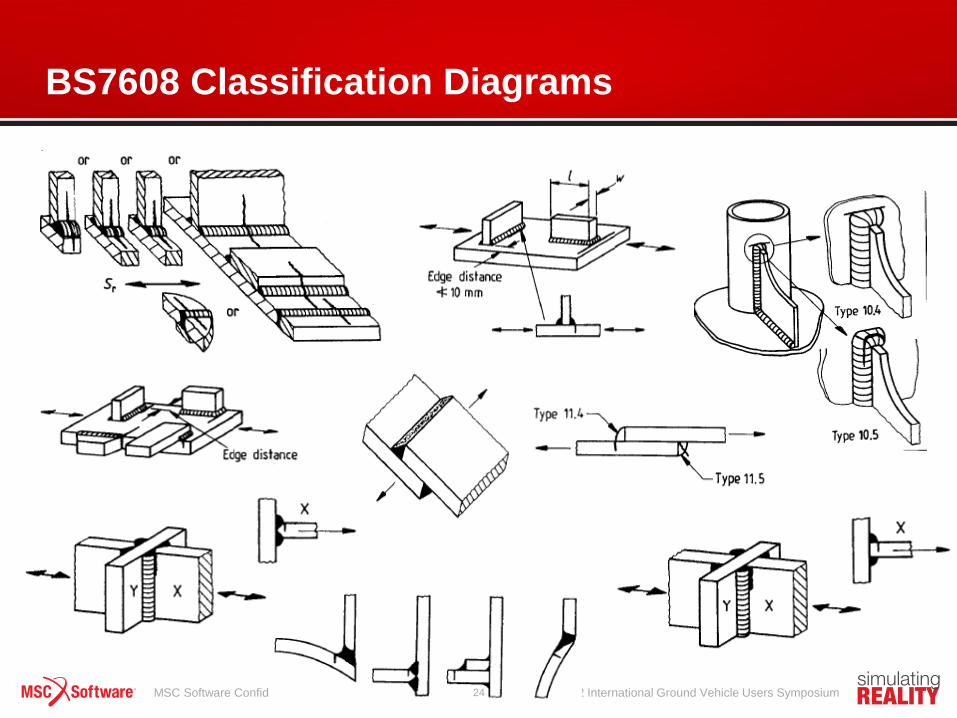
• Weld Fatigue BS5400/7608
Uses set of S-N curves to classify weld, based on
“nominal stress” at a reference distance from weld toe
Fatigue Technology
The Three Basic Methods
17

MSC Software Confidential 2012 International Ground Vehicle Users Symposium
Summary of “variations on a simple approach”
Constant amplitude fully
reversed cycles in to S-N
diagram
Log S
Log N
1
3 Mean stresses
= 1
2
2
1
4 3 2 Palmgren
Miner 1
5 Notches, etc, etc, etc..
Rainflow Cycle Counting
Block loading
Irregular
sequences
Palmgren
Miner
Eg, Goodman
18

MSC Software Confidential 2012 International Ground Vehicle Users Symposium
S
N
NSm=K LCF, say <10000
HCF, say >10000
Note that Strain-Life is OK for all N
Strain-Life OK
Stress-Life OK
Low Cycle vs. High Cycle (deformation based)
19

MSC Software Confidential 2012 International Ground Vehicle Users Symposium
Strain Life
1
2
3
Kf
e
s
e
Cyclic Stress Strain Curve
Neuber
Equation
Solution
point
20

MSC Software Confidential 2012 International Ground Vehicle Users Symposium
• Strengths
– Analysis is simple, and needs few material constants – performed by hand
– Works well for long file, constant amplitude designs
– Significant amount of literature available for variations of surface finish,
load configuration, environment, etc.
• Weaknesses
– Method is completely empirical, and lacks physical insight
– Care must be taken when extrapolating relationships beyond range of
data used to develop them
– True stress-strain response is ignored
• This limits method to long life applications
• Causes problems with non-zero mean load histories
– Does not distinguish between crack initiation and propagation, makes it
difficult to apply towards the concept of damage
Stress-Life Method Summary
21

MSC Software Confidential 2012 International Ground Vehicle Users Symposium
• Strengths
– Plastic strain is accurately modeled, which allows method to be used in
high strain/low cycle analysis
– Method accounts for residual mean stress and sequence effects in load
histories
• Weaknesses
– More complicated to perform (need software program)
– Method predicts crack initiation, cannot be used for propagation
– Some aspects are empirical in nature (Kf or Kt in the Neuber analysis)
Strain-Life Method Summary
22

MSC Software Confidential 2012 International Ground Vehicle Users Symposium
• Method developed in the 1970, with an extensive study carried out in
the performance of welded joints in structural steels
• This study resulted in the development of BS5400, and later BS7608
• S-N Curves for welded steel joints are defined using nominal stress
ranges vs. life in cycles corresponding to different weld classifications
(B, C, D, F, etc).
Assumptions in BS7608
• Stress concentrations and defects in welds make them difficult to
analyze with physics based formula
• BS7608 makes the assumption that stress ranges will be calculated as
if weld did not exist, I.E. the nominal stress is calculated using
engineering stress analysis
• Stress concentrations due to the weld geometry are included in the S-N
curves
BS5400/BS7608
23
MSC Software Confidential 2012 International Ground Vehicle Users Symposium
BS7608 Classification Diagrams
24

MSC Software Confidential 2012 International Ground Vehicle Users Symposium
BS7608 Classification Curves
-2s S-N curves
25

MSC Software Confidential 2012 International Ground Vehicle Users Symposium
General Modeling Rules
Usually 2 elements between midplane and weld toe
Calculate Life Here
• For thin structures, this may require a fine mesh
• Results are sensitive to element quality as well
26

MSC Software Confidential 2012 International Ground Vehicle Users Symposium
Advantages
• Applies to all steels
• Probability of failure can be defined
• No mean stress correction required
• The standard includes the required S-N curves
Disadvantages
• Based on nominal stresses near the weld toe, but distance from the
weld toe is subjective
• Decision on which weld curve to use is open to interpretation and
based not only on geometry but also loading
• Sensitive to element size and shape
BS7608
27

MSC Software Confidential 2012 International Ground Vehicle Users Symposium
• This damping table calculated by correlating test and simulation
models.
Modal Damping Table in FE Model
28
Freq (Hz) Damping %
0 3.0%
9 3.0%
11 10.0%
30 10.0%
40 5.0%
42 2.0%
50 1.0%
62 1.0%
63 3.0%
68 3.0%
75 0.5%
80 0.5%
300 0.5%
Damping Table
0.0%
2.0%
4.0%
6.0%
8.0%
10.0%
12.0%
0 25 50 75 100 125 150 175 200
Frequency (Hz)
Da
mp
ing

MSC Software Confidential 2012 International Ground Vehicle Users Symposium
• Accurate damping models are paramount for accurate life
predictions
• FE models can have complex material and structural damping
effects and have be correlated to test
• Used Generalized Damping in Adams to import damping matrix
from MSC Nastran into the MNF.
• Modal, Structural and Rayleigh damping can be added
Generalized Damping from FEA
29

MSC Software Confidential 2012 International Ground Vehicle Users Symposium
5 5.5 6 6.5 7
-1.5
-1
-0.5
0
0.5
1
1.5
2
PT400CCW - REAR Left
time(s)
Vert
Accel G
Test
Sim
Simulation vs. Test Correlation – Stress and
Acceleration plots
When plotting stress and
acceleration time signals, very
rarely will they match the wave
form exactly. Look for Max/Min
values, appropriate frequency
content, etc.
Place strain gauges in areas of
nominal strain
30

MSC Software Confidential 2012 International Ground Vehicle Users Symposium
• Graph PSD’s of measured
accelerations vs. predicted.
• Ensure that simulation is
predicting frequency content
and power correctly
• Identify unmatched areas, and
review modal content, damping
and other inputs to improve
correlation
• To match the engine excitation,
we applied a signal generator of
60 and 120Hz at the engine
mount points, and used the PSD
plots to adjust the amplitude.
Simulation vs. Test Correlation – Acceleration
PSD’s
31
Rear Accels
Front Accels
Spikes at 60 and 120Hz are caused
by engine vibrations

MSC Software Confidential 2012 International Ground Vehicle Users Symposium
• Developing and implementing a Virtual Loads/Fatigue
process requires at least 3 different software
components
• Typically the knowledge required for the
MBD/FEA/Fatigue domains is split between two
analysts
• When developing a plan to implement this process,
start slow. Implement, validate and correlate one
component at a time.
Virtual Loads/Fatigue Process Implementation
32