virtual characterization of delamination failures in … d accepted manuscript agiraocoelho et...
TRANSCRIPT

http://wrap.warwick.ac.uk/
Original citation: Girão Coelho, Ana M., Mottram, J. Toby and Matharu, Navroop. (2016) Virtual characterization of delamination failures in pultruded GFRP angles. Composites Part B: Engineering. doi:10.1016/j.compositesb.2015.12.025 Permanent WRAP url: http://wrap.warwick.ac.uk/75804 Copyright and reuse: The Warwick Research Archive Portal (WRAP) makes this work of researchers of the University of Warwick available open access under the following conditions. Copyright © and all moral rights to the version of the paper presented here belong to the individual author(s) and/or other copyright owners. To the extent reasonable and practicable the material made available in WRAP has been checked for eligibility before being made available. Copies of full items can be used for personal research or study, educational, or not-for-profit purposes without prior permission or charge. Provided that the authors, title and full bibliographic details are credited, a hyperlink and/or URL is given for the original metadata page and the content is not changed in any way. Publisher statement: © 2016 Elsevier, Licensed under the Creative Commons Attribution-NonCommercial-NoDerivatives 4.0 International http://creativecommons.org/licenses/by-nc-nd/4.0/ A note on versions: The version presented here may differ from the published version or, version of record, if you wish to cite this item you are advised to consult the publisher’s version. Please see the ‘permanent WRAP url’ above for details on accessing the published version and note that access may require a subscription. For more information, please contact the WRAP Team at: [email protected]

MANUSCRIP
T
ACCEPTED
ACCEPTED MANUSCRIPT
AGiraoCoelho et al_manuscript_rev.docx 05-01-2016 P a g e | 1
Virtual characterization of delamination failures in pultruded GFRP angles
Ana M. Girão Coelho
Lecturer (former Marie Curie IEF Research Fellow at the University of Warwick) (Corresponding author, [email protected])
School of Engineering and Geosciences, Newcastle University, Newcastle upon Tyne, NE1 7RU, UK
J. Toby Mottram
Professor ([email protected])
School of Engineering, University of Warwick, Coventry CV4 7AL, UK
Navroop Matharu
Civil Engineer ([email protected])
Hyder Consulting (UK) Ltd, Birmingham B6 5RQ, UK
Abstract
This paper deals with the application of cohesive zone models to study delamination failures in leg-
angles of pultruded glass fibre reinforced polymer material using the general-purpose finite element
software Abaqus. The objective of the study is present a finite element modelling methodology that
can, for example, help to fill-in knowledge gaps in the available experimental data pertaining to the
tying force resistance of angle-cleated jointing in frame construction. It may be used to optimize
cleat shape and laminate lay-up (dependent on composite processing method) for the strongest cleat
against a minimum cost requirement. A benchmark example taken from literature is used to show
that the numerical predictions from the authors’ simulations are reliable. The approach is next used
to analyse an equal leg-angle component where one leg is fixed and the other orthogonal leg is
being deformed by a tensile force applied over the free end surface. Numerical results from Abaqus
are used to show that a lamination produced by the pultrusion processing method fails unstably by
delamination cracks radiating around the curved region and extending into the leg panels. As a
preliminary study to show the potential of the new modelling methodology it is used to show the
influence of the radius of curvature at the junction between the legs on the tying force resistance;
based on the load at delamination onset a smaller radius reduces the cleat’s strength.
Authors Keywords: Curved laminates; Delamination; Finite element analysis; Damage
mechanics; Pultruded GFRP material

MANUSCRIP
T
ACCEPTED
ACCEPTED MANUSCRIPT
AGiraoCoelho et al_manuscript_rev.docx 05-01-2016 P a g e | 2
1. Introduction
Pultruded Glass Fibre Reinforced Polymer (GFRP) shapes and systems are becoming
recognized as an attractive primary structural material in low-rise building residential and
commercial constructions owing to an overall property portfolio that is favourable for achieving
sustainable, low carbon construction [1]. Pultrusion is an economical way of producing constant
thin-walled shapes of FRP laminated composite material. Standard GFRP shapes consist of glass
fibre reinforcement (layers of UniDirectional (UD) rovings and mat) in a thermoset (typically,
polyester or vinylester) resin based matrix. Their standard shapes resemble counterparts found in
structural steelwork, and depending on laminae construction they have direct strengths in the
longitudinal direction of 200 to 400 N/mm2. The strengths in the transverse direction are one third
of the longitudinal values and maybe lower again in the through-thickness direction. The modulus
of elasticity along the length lies in the range from 20 to 30 GPa, in transverse direction from 6 to
10 GPa and the in-plane shear modulus between 3 to 5 GPa. Mechanical properties will depend on
constituent properties, the pultrusion composite processing conditions and long-term loading and
environmental actions.
Arguably, one of the key barriers to wider exploitation of this construction material (like steel,
concrete and timber) is the lack of reliable methods for the prediction of emergence and growth of
composite-specific failure modes, especially from delamination where cracks initiate and grow
between the lamination layers. In this paper the meaning of the word crack is synonymous with the
meaning of fracture. While physical testing should provide the most reliable information about the
load-carrying behaviour of GFRP materials, members, sub-assemblies and structures, numerical
(virtual-prototyping) tests will provide insight into the mechanics involved in the structural
behaviour. Advanced computational analysis has the capability of representing with extreme
numerical accuracy the onset and progression of delamination between the laminae. Girão Coelho
[2] has discussed the difficulties to be overcome when developing numerical formulations capable
of predicting the delamination dominated failure. Only flat plate laminate configurations, where
delamination growth is stable, were then considered.
This is not the case with pultruded GFRP shapes (e.g. I, H, leg-angle) that have a web-flange or
leg curved junction, which is a non-flat configuration where delamination growth is to be unstable
or changes from unstable to stable, depending on the localized deformations. A representative
example of such configurations is the case of an equal-leg angle profile subjected to tensile loading
applied uniformly through one leg and in this leg’s plane, whist the other leg is: (i) totally restrained
[3]; (ii) has a bolted connection with two or three bolts across a single bolt row, usually at the mid-
distance for the leg’s length. [4]. Because angle profiles are used as connecting components in

MANUSCRIP
T
ACCEPTED
ACCEPTED MANUSCRIPT
AGiraoCoelho et al_manuscript_rev.docx 05-01-2016 P a g e | 3
framed joints (for bolted connections refer to introduction in [4]), and with the concept of robustness
and structural integrity being given thoughtful consideration, research into the delamination problem in
GFRP angles subjected to tensile loading (known as tying force) is timely.
Finite Element (FE) simulations as virtual tests are performed in this current work at the mesoscale
level of the structural composite to evaluate the tying force resistance. Each lamina in the GFRP leg-
angle is modelled as a homogeneous, anisotropic continuum and a relative very thin resin layer
(quantified later) is assumed to contain any delamination cracking between stacked layers. A cohesive
zone model is implemented to predict the size and position of the initial delamination, as well as the
load-carrying capacity of the deforming leg-angle. In this paper the word delamination has the
meaning for the formation and growth of a flat flaw in an initially flawless interface (between two
laminae) that grows into a sizeable delamination crack.
The paper begins by describing the cohesive zone modelling approach to treat delamination in
laminated composite components. Presented next are results from material coupon testing with the
Pultex® SuperStructural Series 1525 GFRP material (that is for the leg-angles used in the tying force
experimental programme reported in [4]). The virtual test approach used to simulate the physical
testing is then described and numerical results are presented and discussed. The effect of changing the
curvature at the leg-angle (right-angle) junction when determining the tying force strength is
introduced. Conclusions are finally drawn and further research is suggested.
2. Fundamental behaviour and analysis approach
Delamination cracks are often seen to occur at stress free edges due to the mismatch in directional
properties of the individual fibre reinforced laminae, at notches or at curved regions of composite
components, such as found in the engineering problem that is the subject of this numerical
investigation. This paper is specifically concerned with having a pair of web cleats connecting a beam
to a column member for a beam-to-column joint [4] that is subjected to tension loading with an action
direction coinciding with the longitudinal centroid of the beam’s cross-section. This specific load case
is important should the column member become discontinuous below the level of the joint and the
upper level of cleating has to support the floor loading, via catenary action in the suspended beam
members [4]. Due to the curvature in the cleat components there are in this region to be high normal
stresses in the out-of-lamina direction. Such angles of GFRP thus represent a potential zone of
weakness in pultruded framed structures. The delamination-induced damage in the root of an angle

MANUSCRIP
T
ACCEPTED
ACCEPTED MANUSCRIPT
AGiraoCoelho et al_manuscript_rev.docx 05-01-2016 P a g e | 4
subjected to a tying force is a potential source of failure that has not been addressed previously,
specifically in terms of advanced computational analysis.
The aim of this paper is to develop a FE approach that will characterize the delamination-
dominated failures in the critical regions of pultruded GFRP cleats under representative static loading.
This work is supplemented by having results to compare with from a series of physical tests carried
out by Qureshi et al. [4]. In the present study, the numerical models include a continuum damage
approach to intralaminar failure modelling and a cohesive zone model to represent the delamination
behaviour at the laminae interfaces. When properly implemented, this approach ensures a large degree
of objectivity with respect to FE discretization and requires little or no modification to standard
commercial FE codes, such as the general purpose software Abaqus [5]. This latter aspect is
particularly relevant to practicing engineers concerned with virtual testing related to structural
integrity and damage tolerance of composite structures for safety-critical structures.
In most structural building codes there are specific integrity requirements in order to avoid
disproportionate collapse [6,7]. Disproportionate collapse can be defined as a region of structural
collapse out of proportion to the initiating cause of failure. The most relevant to connection/joint
design is that the detailing for every beam member must possess a minimum horizontal force at
ultimate failure (or tying resistance). Tying force requirements and their implications to design and
detailing (these are for the design of steel frames usually simple rules that will enhance general
structural integrity and provide greater resistance to disproportionate collapse). Background
information on this important basic design requirement towards safe and reliable pultruded framed
structures is given in what follows.
2.1. Modelling of progressive delamination using cohesive zone models
FRP materials used in structural engineering combine reinforcing fibres and polymer resin
based matrix. The fibres provide the high stiffness and strengths, while the surrounding matrix
holds the composite together. The fibre-matrix interphase (or interface) consists of a bond region of
a few nanometres thickness between fibre and bulk matrix and the immediate adjacent region. The
load transfer from matrix into fibres that takes place at the interphase layer is primarily a
mechanistic process and involves the interfacial bond and friction. Delamination is defined as the
separation of reinforcing layers from each other, as a consequence of shear stresses acting in planes
parallel to the layers interfaces and/or tensile stresses acting in the through-thickness direction. This
phenomenon is a typical crack growth problem and is treated in the framework of fracture
mechanics. Today, the most popular computational method for the prediction of delamination

MANUSCRIP
T
ACCEPTED
ACCEPTED MANUSCRIPT
AGiraoCoelho et al_manuscript_rev.docx 05-01-2016 P a g e | 5
failure is based on cohesive zone models that provide a natural bridge between strength-based
models and energy-based models for fracture. This allows delamination to be described by a single
framework that covers a range of applications for which a strength or an energy criterion alone
might not be sufficient.
Cohesive zone models consider fracture as a gradual phenomenon in which separation takes
place across an extended crack tip, or cohesive zone, and is resisted by cohesive tractions [8-10].
Thus cohesive zone elements do not represent any physical material, but describe the cohesive
forces which occur when layers in a laminated material are being pulled apart. In FE modelling,
cohesive zone elements are placed between the continuum elements used to model the layers. A key
analysis feature of these elements is that they include the effect of first failure, and the subsequent
crack propagation by means of critical strain energy release rates.
The simulation of interlaminar damage for delamination failure will be based on the cohesive
zone approach using the Abaqus three-dimensional cohesive element COH3D8. The study is
performed in the quasi-static regime. The traction-separation law formulation assumes a non-zero
elastic stiffness of the cohesive zone, which is physically motivated by the reduced stiffness of the
matrix-rich very thin interface layer as compared to a perfect bond assumed to exist between fibres
and matrix in layer. From a numerical point of view, this elastic stiffness can be understood as a
penalty-type enforcement of displacement continuity in the elastic range.
A quadratic stress criterion is used for the damage initiation criterion. To specify the conditions
for separation in the cohesive zone model [11-13] the following expression is chosen:
2 2 2
n s t
I II III
1f f f
σ σ σ + + =
(1)
whereby σn is the stress in pure opening mode, σs is the stress in the first shear direction, σt is the
stress in the second shear direction, fI, fII and fIII are the peak strength values in the same directions,
and:
n n n n nfor 0 and 0 for 0σ σ σ σ σ= > = ≤ (2)
because compressive normal stresses cannot open the delamination crack.
Progression of damage at the interfaces is modelled using a linear softening law and a critical
mixed mode energy behaviour based on the Benzeggagh-Kenane criterion [14], which is described
by the following expression:
( ) ( )c I,c II,c I,c II I IIG G G G G G Gη
= + − + . (3)
Gm,c (with m = I, II, III) is the total critical strain energy release rate associated with delamination
mode m, and η is the semi-empirical criterion exponent applied to delamination initiation and

MANUSCRIP
T
ACCEPTED
ACCEPTED MANUSCRIPT
AGiraoCoelho et al_manuscript_rev.docx 05-01-2016 P a g e | 6
growth. Illustrated in Figs. 1a to 1c are the three modes that can singular or interact to cause a
delamination failure.
The use of cohesive zone models in FE analyses requires that a very fine mesh specification is
used to ensure that sufficient interface elements exist within the cohesive zone length at the crack
tip. If the mesh design happens to be too coarse, the cohesive stress at the discontinuity may not
even reach the interfacial strength and, as a result, the required failure mode is missed. Falk et al.
[15] suggest a minimum of two to five elements in this cohesive zone length in order to perform a
reliable simulation. Turon et al. [16] indicate that for typical graphite-epoxy or glass-epoxy
composite materials, the length of the cohesive zone should be smaller than one or two millimetres.
As a consequence, the mesh size required in order to have more than two elements in the cohesive
zone should be smaller than half a millimetre. For full-sized structural models of pultruded GFRP
components and structures this has the obvious consequence of a computationally expensive
solution. Current numerical simulations comply with the cohesive zone element mesh size
requirements specified by the first author [2] to allow stable numerical simulations of interface
delamination.
2.2. Design provisions for structural integrity of frame joints
Disproportionate collapse is a relatively rare event in Western nations, as it requires both an
abnormal/accidental loading to initiate the local damage and a structure that lacks adequate
continuity, ductility, integrity, robustness and redundancy to resist the spread of damage.
Significant casualties can be the consequence when there is collapse of key elements. In this paper,
the following terminology for the highlighted words (or concepts) is adopted [17]:
• Integrity is the ability of the elements of a structure to remain connected in the event that
forces are applied beyond the design loads. Requiring connections between members to be
designed for minimum tension forces are means of achieving structural integrity.
• Robustness is the ability of a structure or a structural element to resist forces beyond its design
forces. Robustness of an overall structure can be achieved by strengthening individual
members, by providing elements with high levels of energy absorption or by providing
alternate means of support of a given area.
• Redundancy is the provision of alternate load paths (that have the capacity to resist the full
design load) for a load applied at a specific location.
• Key elements (e.g. joints or connections) are structural elements that if they failed would
cause the collapse of an unacceptable region in the structural system.

MANUSCRIP
T
ACCEPTED
ACCEPTED MANUSCRIPT
AGiraoCoelho et al_manuscript_rev.docx 05-01-2016 P a g e | 7
The European code EN 1991 [6] and the American standard SEI/ASCE [7] have specific
structural integrity requirements for building structures in order to avoid disproportionate collapse,
which, in general, specify that each beam connection must develop a minimum horizontal (axial)
tension capacity, and each column splice has a minimum vertical tension capacity. These
requirements do mandate the verification that connections develop minimum levels of tying resistance
and can usually be met in most buildings with no cost implications and minimal calculations to
verify compliance. For pultruded joints and connections, the ASCE pre-standard for Load and
Resistance Factor Design (LFRD) of pultruded Fiber Reinforced Polymer (FRP) Structures [18]
proposes a minimum horizontal tying force in the mandatory part. Section 2.9 [18] states,
“Notwithstanding the required connection strength determined from structural analysis, the design
strength of structural connections shall not be less than 1 kip (4.5 kN). Should a column lose its
continuity, below the locations where beams are connected, and the FRP clip angles are required to
take tension action, to prevent disproportionate collapse…”. In this paper the meaning of the word
connection as used in ASCE [18] is joint since the Eurocode terminology is used. There is no
provenance to the rationale for the target tying force being specified at 4.5 kN other than the test
strength results in [3]. To know what the strength is of GFRP cleats in the field are is one research
question that the numerical results from using the novel finite element modelling methodology
presented in this paper can help to address.
3. Material properties of the Pultex® SuperStructural material
This section describes the physical and mechanical properties of panel material in a pultruded
GFRP leg-angle shape that is used in the experimental programme reported in [4] and for the
comparison with FE results in Section 4. The fibre architecture and constituent properties are
presented along with measured strengths and moduli of elasticity, and the later predicted on
applying micromechanical modelling with known and assumed constituent properties. The purpose
of this section is to introduce properties for the pultruded material required in the FE modelling to
predict delamination failure and its progress when a leg-angle is subjected to tying force
deformation.
The material is from Creative Pultrusions Inc., and the Pultex® SuperStructural 1525 series of
‘off-the-shelve’ shapes. Identifier number 1525 means the thermoset polyester matrix is Class 1
Flame Retardant. The colour of the material is Gray. It has been manufactured using traditional
continuous pultrusion [19] with the addition of closed mould resin injection instead of an open resin

MANUSCRIP
T
ACCEPTED
ACCEPTED MANUSCRIPT
AGiraoCoelho et al_manuscript_rev.docx 05-01-2016 P a g e | 8
bath. This method is known to ensure there is an effective saturation of the resin matrix throughout
the E-glass fibre reinforcement and generate less voiding [20].
3.1. Physical properties
3.1.1. Fibre reinforcement
The equal leg-angle shape has a cross-section (75×75×9.6 mm) for a thin-walled section.
Panels have a combination of fibre reinforcement in layers of UD rovings and a Tri-axial Stitched
Fabric Mat (TSFM), as shown in Fig. 2. A photograph showing a panel’s lay-up is seen in Fig. 2a
with a close-up in Fig. 2b to show the fibre construction in a TSFM layer (product E-TTXM 4008
from Vectorply® corporation). As seen in Fig. 2a there are seven alternating layers of UD and
TSFM, with two TSFM layers at mid-thickness. TSFM is of a stitched continuous fabric having
four layers with the fibre lay-up sequence of +45°/90°/-45°/random Chopped Strand Mat (CSM). It
is known from Creative Pultrusions Inc. that 56 yield rovings are used for the UD roving layers in
the 9.6 mm thickness (t). At both surfaces there is an outer (relatively thin) non-structural Surface
Veil (SV) to provide UV protection and a barrier to moisture diffusion. The NEXUS® veil layer is
resin-rich and consists of randomly orientated short 100% melt polyester fibres, which has a mass
per unit area < 100 g/m2 and a semi-glossy finish that allows the pultrudated to be easily handled.
3.1.2. Resin matrix
The thermoset resin is the Reichhold 31031 unsaturated isophthalic (an isomer of phthalic acid
benzene-1 and 3-dicarboxylic acid) polyester resin. To produce the matrix there are additives. The
filler is clay, assumed to be aluminium silicate, which is commonly kaolin clay. This filler is used,
in addition to economic purposes, to improve chemical resistance, opacity, surface finish, and
insulation properties [21]. The Flame Retardant additive is antimony trioxide acts alongside the
other resin base of brominated polyester to provide the 1525 series shapes with fire protection.
Other additives include a mould releasing agent, and low, mid and high range catalysts activated
during the pultrusion composite processing. Finally, internal stresses and cracking issues are dealt
with the addition of glass beads. UV inhibitors are present in the additive design. The largest
proportions in the matrix formula, which consist of 13 constituent parts, are for the polyester resin,
known to be approximately 80% of the bulk matrix.

MANUSCRIP
T
ACCEPTED
ACCEPTED MANUSCRIPT
AGiraoCoelho et al_manuscript_rev.docx 05-01-2016 P a g e | 9
3.1.3. Constituent material properties
A series of resin burn-off tests were conducted to estimate the volumetric proportions of UD
and TSFM fibres and matrix, as well as to establish the nominal thicknesses of each layer in a
pultruded panel. The resin burn-off procedure was adapted from the method described in Appendix
B of the PhD thesis by Lane [22], and with reference made to the testing procedure given in [23,24].
Table 1 summarizes the results from the resin burn-off tests. Because the reinforcing effect of the
SV layers is minimal it can be seen that the total amount of glass fibre with the two main
reinforcing types of UD and TSFM are equal. In the leg-angle the volume percentages of UD,
TSFM and matrix are in the range 30 to 34. The final row in Table 1 reports the nominal
thicknesses of the layers on the assumption that they are constants for a particular fibre
reinforcement type.
3.2. Mechanical properties
The data presented for mechanical properties is defined with respect to the local material
coordinate system, with: 1 for the UD fibre direction; 2 for the in-plane direction normal to UD
fibres; 3 for the through-thickness direction. The normal direction is in the direction of pultrusion,
and in in the literature is often referred to as the longitudinal direction. Notation f1 is therefore for
the in-plane longitudinal strength, f2 for the in-plane transverse strength, f1,S for the in-plane shear
strength, and f2,S for the transverse shear strength. Strength values for tensile (T) and compressive
(C) actions are given for in-plane strengths.
3.2.1. Elastic constants
The determination of the elastic constants summarized in Table 2 was carried out using
micromechanical modelling with volume fractions of the constituents established by using the resin
burn-off method, as described in [22]. In making the micromechanical modelling calculations, it is
assumed that the densities of matrix and E-glass fibres are 1.1 g/cm3 and 2.56 g/cm3. The modulus
of elasticity for the matrix constituent is assumed to be 3.2 kN/mm2 and for the E-glass fibres it is
taken as 72 kN/mm2. The constituent Poisson’s ratios are assumed to be 0.36 and 0.22, respectively.
Using the rule of mixtures approach with the two reinforcing lamina stiffnesses in Table 2
predictions for the elastic constants of the 9.6 mm thick panel are E1 = 25.0 kN/mm2, E2 = 16.7
kN/mm2, G12 = 4.5 kN/mm2 and ν12 = 0.36. The pultruded material consists of alternative
reinforcing layer of UD and the TSFM. A leg panel has a balanced lay-up that comprises TSFM1

MANUSCRIP
T
ACCEPTED
ACCEPTED MANUSCRIPT
AGiraoCoelho et al_manuscript_rev.docx 05-01-2016 P a g e | 10
layer at 1.38 mm thickness, UD1 at 1.93 mm, TSFM2 at 1.42 mm, TSFM3 at 1.39 mm, UD2 at
2.01 mm and TSFM4 at 1.47 mm.
3.2.2. Strength
A series of tension and compression coupon tests were conducted using modified test methods.
It should be noted that compression strength is given for fullness. Only compression and tension
tests using non-standard coupons were conducted at the University of Warwick. The data for shear
strength was taken from standard tests conducted by D’Alessandro [25] on identical pultruded
material.
Compressive Strength Tests: The test rig, shown in Fig. 3, was designed and manufactured at
the University of Warwick as a modified version of the apparatus used by Barker and Balasundaram
[26], which was later used by Haeberle and Matthews [27]. Some advantages of this set-up as stated
by Mottram [28] are the elimination of end effects, no need for end tabs and failure occurs within
the gauge length. The test rig was clamped into a load-controlled 40 metric tonne Amsler universal
testing machine and specimens were set within the clamps. The load rate was applied at
approximately 10 kN/min and ultimate load recorded. Tests were conducted at ambient laboratory
temperatures. All specimens failed within the gauge length initially with audible inter-layer splitting
followed by an angled shear crack at approximately 45° throughout the cross-section of the coupon.
This crack initiated from one of the loaded-face corners and extended through the thickness and was
the predominate-failure mode in most coupons. Fig. 4 shows failed specimens; the typical 45° shear
cracks can be seen.
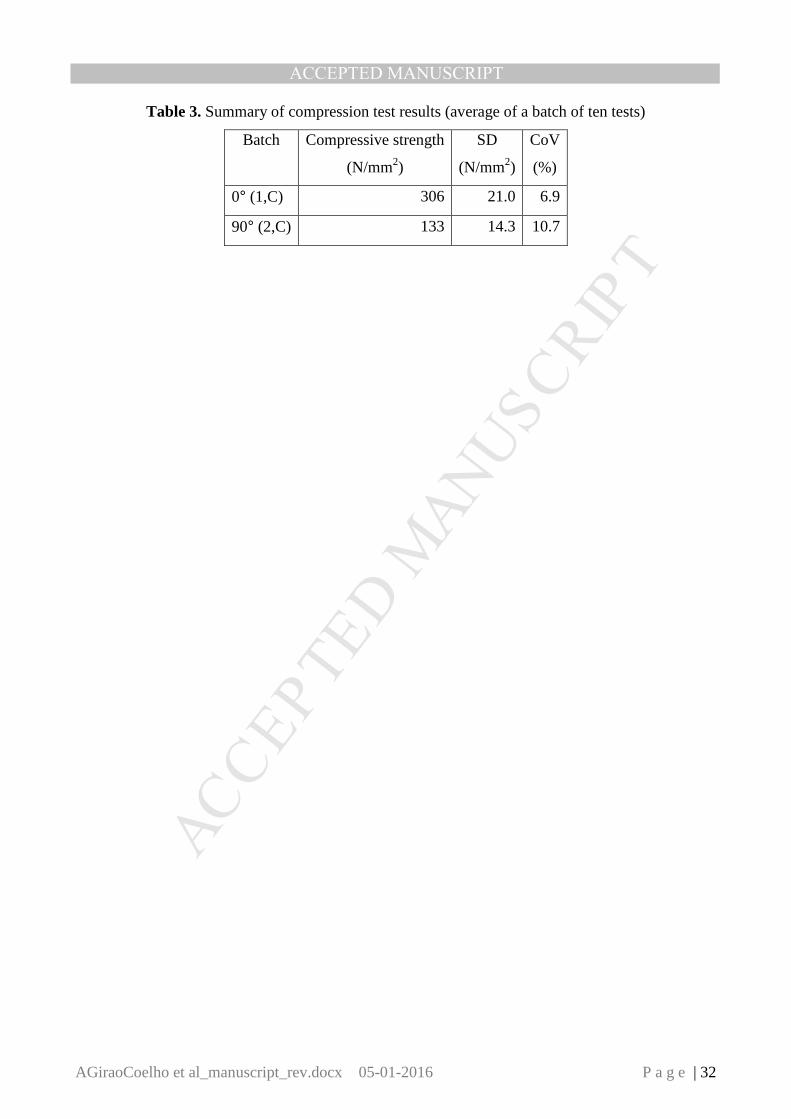
The longitudinal (compression) strength for the batch ranges from 280 to 328 N/mm2. The
transverse strength is found to range from 99 to 153 N/mm2. Although the two batches (each of ten
specimens) had a relatively high Coefficient of Variation (CoV) of approximately 10%, no value
was removed from further analysis since they all lay within the acceptable bounds as determined by
the Chauvenet criteria [29]. Table 3 summarizes the average strengths, Standard Deviation (SD) and
CoV from testing 10 nominally identical coupons. The mean compressive strengths in both
longitudinal and transverse directions determined by testing are seen to be 25% higher than the
pultruder’s values tabulated in [21].
Tensile Strength Tests: A total of ten longitudinal and ten transverse coupons were tested.
Tensile tests were conducted using a load-controlled Amsler universal testing machine; the loading
was applied at a rate of approximately 10 kN/min. The ultimate load was recorded. Acoustic
emissions could be heard prior to ultimate load being attained, especially in the longitudinal

MANUSCRIP
T
ACCEPTED
ACCEPTED MANUSCRIPT
AGiraoCoelho et al_manuscript_rev.docx 05-01-2016 P a g e | 11
coupons. Ultimate failure was always by fibre rupture across the specimen width. A failed 90°
specimen is shown in Fig. 5, with the typical failure mode of rupture across the specimen width.
Table 4 summarizes the results as for compression loading in Table 3. The CoV ranges between
3 and 10%, with the larger batch dispersion in the transverse direction. The mean longitudinal
strength in tension at 294 N/mm2 is 4% lower than the mean compression, whereas the transverse
tensile strength is, as expected, much lower, at 63% of the compression mean of 133 N/mm2.
Shear Strength: D’Alessandro [25] conducted a series of in-plane shear strength tests in spirit of
ASTM D5379 (M) [30] using ten longitudinal specimens only. The use of an Iosipescu test fixture
was employed with the in-plane strength and in-plane stiffness (for shear modulus) being measured.
The procedure and further details on the test set-up are given in [25] and only salient strength and
modulus values are given here. It was found that the mean in-plane shear strength is f1,s = 90.6
N/mm2 with a SD and CoV of 2.8 N/mm2 and 3.1%, respectively. The same values are taken for the
transverse shear strength (f2,s) in this work. The shear stress against shear strain relationship is
nonlinear throughout to an ultimate shear strain of > 5%. Using the secant gradient between shear
strains of 0.02 and 0.06% the mean in-plane shear modulus is determined to be 4.3 GPa, having a
relatively high CoV of 17.1%
4. Finite element simulations
The FE study presented next includes a continuum damage model with a cohesive zone
approach to modelling of laminate materials. Continuum damage models address the intralaminar
failure mechanisms from a global standpoint, whereas if the analyst used individual damage
mechanisms they would be homogenized and constructed around a failure criterion. This approach
is the least complex and uses the composite lay-up modeller tool within the Abaqus pre-processor to
define the individual laminae through a laminate thickness. Each layer is cohesively bonded
together to form the lamination with interfaces assumed to have a thickness of 10-3tlay, where tlay is
the thickness of the thinnest layer either side of the interface. Values for tlay are reported in Section
3. This modelling dimension plays the role of a length scale, and it has been shown that the
thickness of the cohesive interface does not affect the model’s performance provided its thickness is
small enough compared to tlay [2].
The static analysis of the delamination dominated progressive failure process in a single equal
leg-angle cleat under tensile (tying force) loading is examined and the predictions are compared

MANUSCRIP
T
ACCEPTED
ACCEPTED MANUSCRIPT
AGiraoCoelho et al_manuscript_rev.docx 05-01-2016 P a g e | 12
with experimental results taken from [4]. The dominant failure mechanism as the cleat
progressively fails in testing is delamination cracking, although fibre breakage is observed to occur,
and this depends on localized stresses and fibre architecture.
4.1. Description of the model
Figs. 6a and 6b show the dimensions of the cleat problem from [4] that is to be represented and
analysed. Each leg of 9.6 mm thickness is 75 mm long and at the junction between the two
orthogonal legs there is a fillet radius with inner radius, R, of 9.6 mm (= t). The width of the cleat is
128 mm, and at 32 mm from the 75 mm edges a leg has a M16 steel bolt that give fixity to the
vertical displacement boundary condition. There are therefore two bolts across the cleats width.
Because of symmetry the modelling adopts half symmetry and the FE mesh has a width of 64 mm.
The layers are oriented with their 0° direction coincident with direction of pultrusion. The steel
bolting is not explicitly modelled in order to simplify the modelling methodology. Although the bolt
restraining action plays an important role in the evaluation of the stiffness of the structural response
it is deemed unlikely to have an influence on the load-carrying resistance of the cleat, which is
presented below.
The FE model is built-up from stacked continuum shell elements with the individual UD and
TSFM layers in Fig. 6b being modelled separately. These elements have the geometry of bricks but
their kinematic and constitutive behaviour are similar to those of conventional shell elements. The
continuum shell elements are able to reproduce reliable results in simulations of thin-walled
structures by means of only one element in a lamina thickness, owing to a higher-order
displacement field [31,32]. Cohesive interface elements are used to connect a TSFM and an UD
layer to allow for (multi-)delamination failure to occur. As illustrated in Fig. 6b four cohesive
interfaces I1 to I4 are considered; there is no such interface required between the two touching
TSFM layers at mid-thickness. The in-plane mesh geometry for the interfaces is the same as that for
the laminae. The FE mesh specification in our principal study has a total of 85760 continuum shell
SC8R elements, and 68608 COH3D8 cohesive elements, and its overall refinement is shown in Fig.
6c.
A monotonic loading for the tensile tying force is applied in the form of an applied uniform
vertical displacement δ as shown in Fig. 6a. The numerical analysis is performed using a global
stabilization factor (dissipated energy fraction) of 2×10⁻⁴.

MANUSCRIP
T
ACCEPTED
ACCEPTED MANUSCRIPT
AGiraoCoelho et al_manuscript_rev.docx 05-01-2016 P a g e | 13
The Abaqus analysis is run with the material properties from Tables 2-4 assigned to the
appropriate layers. The Hashin failure criterion [33] is used to predict damage onset and the
governing failure mode within each lamina.
The interfacial strength properties were reduced from those of the matrix material by adopting a
weakening factor fw, according to Puck’s guidelines [34, 35]. It was found by a sensitivity analysis
that the overall response for fw equal to 0.3 gives the one closest to the experimental results in [4],
which indicates a relatively weak interface in the pultruded GFRP material. The piecewise linear
traction-separation law of the cohesive elements is described according to the mechanical properties
of the UD layer presented in the second column in Tables 2 and 4. Using the guidance from
Camanho et al. [13] the elastic stiffness (per unit area) of the interface is assumed to be equal to 106
N/mm3. The critical normal interface tractions of the cohesive zone elements is equal to the tensile
normal strength of the UD layers in direction normal to the fibres, f2,T, times the weakening factor.
The critical shear interface tractions is equal to the shear strength of the UD, f2,S, times the same
weakening factor. Mode I, mode II and mode III critical energy release rates, GI,c, GII,c = GIII,c, were
taken as 0.2 and 0.5, respectively, for the pultruded material [2].
4.2. Modelling strategy verification
Results from the FE modelling strategy for the static analysis of curved laminates is compared
with (plane strain) numerical results taken from the literature [36]. The laminate lay-up arrangement
is that of the fifteen layer cross-ply laminate [0/90/0/ … /0/90/0]. The curved leg-angle section
investigated by Wimmer et al. [36] has dimensions 11.2×11.2×2.25 mm (for tlay = 0.15 mm) and the
internal radius of curvature R is 2.55 mm. The composite material has laminae with an epoxy resin
matrix and a UD reinforcement of carbon fibre. The lamina mechanical properties for the current
FE analysis are taken from [36] and summarized in Table 5. Note that with fw =0.9 the interface
bond is strong. A unit horizontal displacement is prescribed at the top of the ‘vertical’ leg in order
to simulate flexure for the opening mode; that is the angle between the two orthogonal legs is forced
to be > 90o.
Numerical results from Wimmer et al. [36] have shown that the critical location for
delamination initiation is the interface between layers five and six (going into the 15 layer laminate
from the top surface having the smallest fillet radius). As a result of this finding only this particular
interface, for a single delamination failure surface, is included in the authors’ FE modelling. This
approach was used in order to reduce the computational size of this benchmark study.

MANUSCRIP
T
ACCEPTED
ACCEPTED MANUSCRIPT
AGiraoCoelho et al_manuscript_rev.docx 05-01-2016 P a g e | 14
The leg-angle’s strength, here expressed in terms of applied horizontal load per unit length of
the laminate, is reached as a result of excessive delamination at the critical interface between the
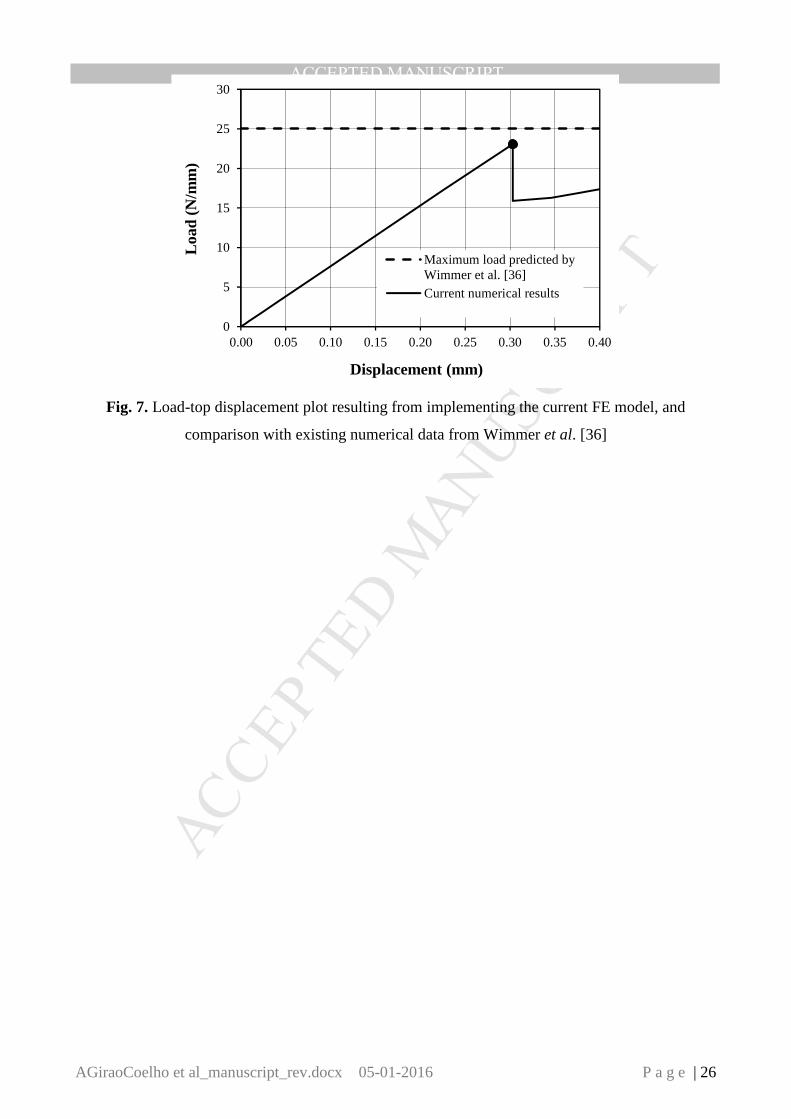
fifth and sixth layers. Fig. 7 is for a plot of strength versus the top horizontal displacement from
Abaqus outputs using the Section 3 FE modelling methodology. Maximum load, given by the filled
circle symbol, is compared with the FE maximum ‘load’ prediction of 25.1 N/mm by Wimmer et al.
[36], which is shown by the horizontal dashed solid line. The authors’ nonlinear analysis shows an
elastic response to a strength value of 23.7 N/mm, at which there is a sudden reduction to 15.8
N/mm. Further increase to the horizontal displacement shows a slight nonlinear increase in the force
that can be resisted. The maximum ‘load’ predictions are in good agreement (authors’ is 6% lower).
This finding is not unexpectedly as both represent acceptable numerical formulations to the
structural engineering problem. The very acceptable correlation provides a validation for the
Abaqus modelling methodology described in Section 3.
Plotted in Fig. 8, on the top surface of the leg-angle, is the delamination damage parameter for
the critical interface at the maximum ‘load’ of 23.7 N/mm. Damage progression can be tracked,
from 0 (none) to 1 (complete), using the Abaqus output parameter Stiffness DEGradation, SDEG.
The plot used three colours, with blue for undamaged (< 0.3), green for partially damaged (0.3 to
0.7) and red (> 0.7) for completely damaged. Delamination failure initiates at the leg’s junction, in
the curved part of the 2.25 mm thick laminate, and propagates into the legs. This leads to a change
of the structural stiffness and a reduction of the ‘strength’ required for a constant horizontal
displacement as seen in Fig. 7, indicating that the growth of delamination failure is unstable.
4.3. Analysis results for Pultruded GFRP cleat
Fig. 9 is for a plot of tying force load against applied vertical displacement, δ, for the pultruded
cleat of size 75×75×9.6 mm (and R/t = 1) with loading and displacement boundary conditions
defined in Fig. 6a. On the solid line giving the tensile force vs. δ relationship there are three points
labelled A to C. To point B the relationship is virtually linear. At a load of 8.5 kN (point A), the
Abaqus analysis predicts that delamination failure starts to accumulate in a small region over
interface I4, which is between layers UD2 and TSFM4 (labelled in Figs. 6b). This level of tying
force corresponds to 85% of the maximum of 10 kN, which is point B. After the cleat’s resistance
has been reached, unstable delamination crack growth takes place on interface I4 localized to the
curved region in the laminate. Note that the other three interfaces I1 to I3 remain intact and thereby
undamaged (and intralaminar damage does not occur). The progressive damage leads to a
considerable increase in the size of delamination, and a consequent drop, to Point C, in the tensile

MANUSCRIP
T
ACCEPTED
ACCEPTED MANUSCRIPT
AGiraoCoelho et al_manuscript_rev.docx 05-01-2016 P a g e | 15
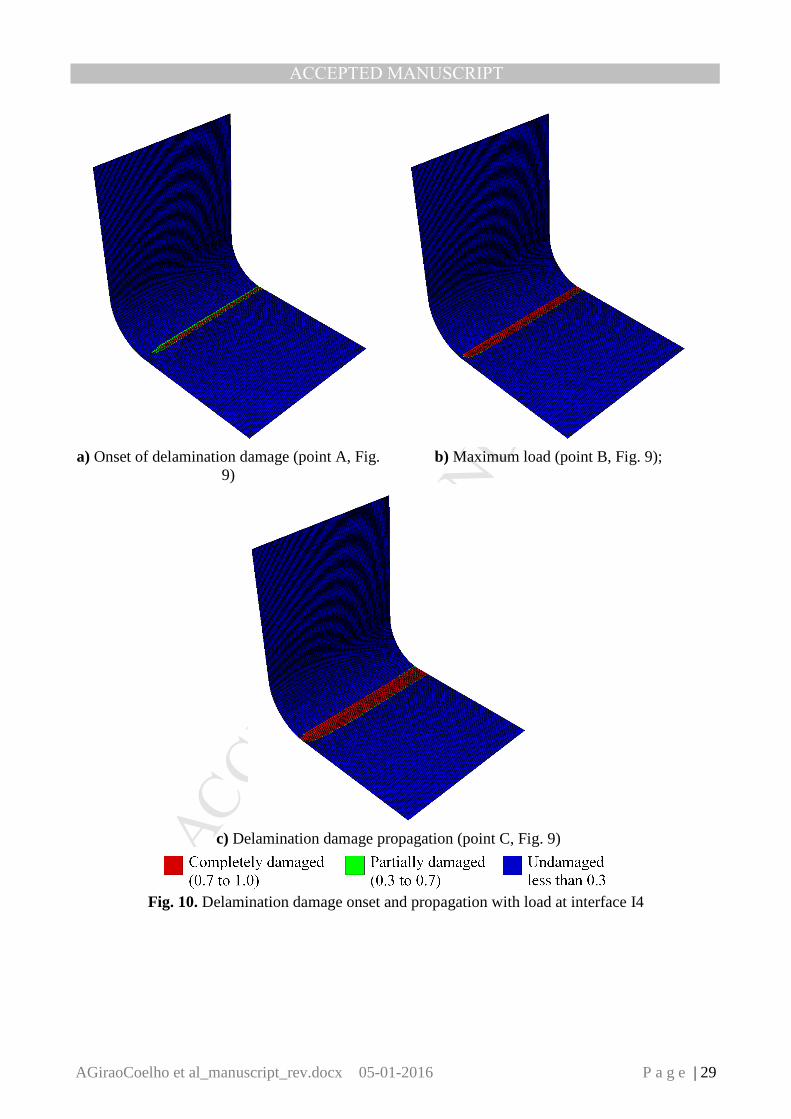
force that is resisted. Figure 10 has a similar content to Fig. 8, with its parts a) to c) showing the
damage states at points A to C in Fig. 9, respectively. Figures 10a and 10b show where
delamination starts (point A load) and develops when the ultimate strength at point B is achieved.
Figure 10c illustrates the delamination damage that has grown along interface I4 into the horizontal
leg, predominantly by the opening mode I illustrated in Fig. 1a.
Presented as constant tying forces in Fig. 9 are two results from the series of tests by Qureshi et
al. [4]. The horizontal thick line with short dashes at 6.2 kN is for the test load when a change in
initial stiffness was recorded. This can be identified as a test signal for the onset of cleat failure by
delamination. A noticeable drop of stiffness was observed experimentally, but it is not observed in
the numerical predictions plotted in Fig. 9. The horizontal thick line with long dashes at 9.8 kN is
for the ultimate (typing force) strength. This experimental result (representing a single cleat) is
established from the mean of six cleats, tested in pairs as a standard web-cleated detailing for a
simple frame joint [4]. With a 2% difference between the test strength and point B it is observed
that there is very good correlation for a pultruded cleat’s resistance between the FE simulation and
the experimental approach employed by Qureshi et al. [4].
4.4. Influence of leg junction on tying resistance
Having demonstrate with two benchmark examples in Sections 4.2 and 4.3 that the FE
modelling methodology in Section 3 is effective and reliable it was decided to simulate a tying force
problem that cannot be readily characterized by physical testing. Keeping t constant at 9.6 mm a
change in the radius of curvature given by R/t = 0.2 (i.e. R = 1.92 mm) was computationally
investigated. By having a much smaller R, the tying resistance is predicted to increase by 10% to 11
kN. Delamination now initiates at the same interface I4 when the tying force is 7.5 kN,
corresponding to about 70% of the maximum load (and 12% lower than when the radius of
curvature is generous for R/t =1.0). For the R/t = 0.2 dimensioning it was found that at 10.6 kN
delamination cracking starts to emerge in interfaces I2, which as Fig. 6b shows lies between the
internal UD1 and the middle TSFM layers. Delamination growth then continues to propagate over
both interfaces localized to the curved region in the cleat.
This preliminary result could be for the start of a numerical parametric sensitivity analysis to
establish what is an optimum cleat shape and lay-up (dependent on composite processing method)
for the strongest cleat against a minimum cost requirement when the governing mode of failure is
caused by a tensile tying force.
MANUSCRIP
T
ACCEPTED
ACCEPTED MANUSCRIPT
AGiraoCoelho et al_manuscript_rev.docx 05-01-2016 P a g e | 16
5. Summary and concluding remarks
This paper describes a preparatory FE investigation into the effect of curvature on the
resistance of laminate composite structures that fail by initiation and excessive delamination
cracking. The effective utilization of thick laminated, curved structural components with out-of-
plane loading requires that a methodology for their detailed design be in hand. FE procedures are
proposed in this numerical study for the structural analysis, using the general purpose software
Abaqus, without user subroutines, to create a model using stacked shell continuum and cohesive
zone elements. As recently suggested by Lopes et al. [37], a possible sophistication in the FE model
methodology is to employ cohesive surfaces to address the delamination failure phenomenon.
In this numerical work, a FE three-dimensional model was developed for calculating the tying
force resistance of an equal leg-angle when the loading is out-of-plane of a laminated panel leg. The
reliability of the outputs was evaluated by comparing the authors’ numerical predictions with other
FE results and, importantly, with published results from series of physical tests. In both cases the
agreement is shown to be very acceptable given the inherent uncertainties in how the various results
have been obtained. It is hoped that the new knowledge and understanding presented in this paper
will spur more research into this important structural engineering response and provide insight that
will assist in direct future research and design code development endeavours, such as those now
transforming the ASCE pre-standard [18] into a published standard with consensus design
procedures for pultruded frame construction. It is worthy of mention that currently [18] requires
web cleats [4] in simple frame joints to be of steel material because there is a lack of knowledge and
understanding towards the performance of composite cleat components, especially over the full
service working life (say 50 years) of pultruded structures.
Acknowledgments
This paper was partially produced in the framework of the project Structural joints for building
frames of pultruded fibre reinforced polymers. This research was supported by a Marie Curie Intra
European Fellowship within the 7th European Community Framework Programme under contract
grant PIEF-GA-2012-327142. The authors would like to thank Dr. Jawed Qureshi of the University
MANUSCRIP
T
ACCEPTED
ACCEPTED MANUSCRIPT
AGiraoCoelho et al_manuscript_rev.docx 05-01-2016 P a g e | 17
of East London for providing raw test results from a series of tying force tests [4] when he was with
University of Warwick.
References
[1] Mottram JT. Does performance based design with fibre reinforced polymer components and
structures provide any new benefits and challenges? The Structural Engineer 2011; 89(6):23–
27.
[2] Girão Coelho AM. Finite element guidelines for simulation of delamination dominated
failures in composite materials validated by case studies. Arch Computat Methods Eng 2015;
DOI: 10.1007/s11831-015-9144-1.
[3] Turvey GJ, Wang P. Failure of pultruded GRP angle-leg junctions in tension. Proc. 17th
International Conference on Composite Materials (ICCM17), 27-31 July 2009, paper A1:1.
[4] Qureshi J, Mottram JT, Zafari B. Robustness of simple joints in pultruded FRP frames.
Structures 2015; 3:120–129.
[5] Abaqus [Computer Software]. (2015). Version 6.14 Dassault systems,
http://www.3ds.com/products-services/simulia/products/abaqus.
[6] CEN (European Committee for Standardization). Actions on structures, part 1.7: General
actions – Accidental actions.” EN 1991-1-7:2006 Eurocode 1, Brussels, 2006.
[7] SEI/ASCE (Structural Engineering Institute of the American Society of Civil Engineers).
Minimum design loads for buildings and other structures. SEI/ASCE 7-05, Reston, VA, USA,
2005.
[8] Dugdale DS. Yielding of steel sheets containing slits. J Mech Phys Solids 1960; 8:100–104.
[9] Barenblatt GI. The mathematical theory of equilibrium cracks in brittle fracture. Advances in
Applied Mechanics 1962, HL Dryden, Th von Kármán, G Kuerti, FH van den Dungen, L
Howarth, eds.; 7:55–129.
[10] Ortiz M, Pandolfi A. Finite-deformation irreversible cohesive elements for three dimensional
crack-propagation analysis. Int J Numer Meth Eng 1999; 44:1267–1282.
[11] Brewer JC, Lagace PA. Quadratic stress criterion for initiation of delamination. J Compos
Mater 1988; 22:1141–1155.
[12] Mohammadi S, Owen DRJ, Peric D. A combined finite/discrete element algorithm for
delamination analysis of composites. Finite Elem Anal Des 1998; 28:321–336.

MANUSCRIP
T
ACCEPTED
ACCEPTED MANUSCRIPT
AGiraoCoelho et al_manuscript_rev.docx 05-01-2016 P a g e | 18
[13] Camanho PP, Dávila CG, Moura MF. Numerical simulation of mixed-mode progressive
delamination in composite materials. J Compos Mater 2003; 37(16):1415–1438.
[14] Benzeggagh ML, Kenane M. Measurement of mixed-mode delamination fracture toughness
of unidirectional glass/epoxy composites with mixed-mode bending apparatus. Compos Sci
Technol 1996; 56:439–449.
[15] Falk ML, Needleman A, Rice JR. A critical evaluation of cohesive zone models of dynamic
fracture. J Phys IV 2001; Proc 11(Pr.5):43–50.
[16] Turon A, Dávila CG, Camanho PP, Costa J. An engineering solution for mesh size effects in
the simulation of delamination using cohesive zone models. Eng Fract Mech 2000; 74:1665–
1682.
[17] Johnson RB, Mahamid M. Design of steel connections for tie forces. ASCE Structures
Congress. ASCE Structures Congress 2010, Orlando, Florida, USA; 943–954. DOI:
10.1061/41130(369)86.
[18] ASCE (American Society of Civil Engineers). Pre-Standard for Load & Resistance Factor
Design (LFRD) of Pultruded Reinforced Polymer (FRP) Structures, Arlington, VA, USA,
2010.
[19] Bank LC. Composites for construction: Structural design with FRP materials, John Wiley &
Sons, New Jersey, USA, 2006.
[20] Starr T. Pultrusion for engineers, Woodhead publishing Ltd., Cambridge, UK, 2000.
[21] Creative Pultrusions. The new and improved Pultrex© pultrusion design manual, Creative
Pultrusions Inc., Alum bank, PA, USA, 2010.
[22] Lane A. An experimental investigation of buckling mode interaction in PFRP columns, PhD
thesis, University of Warwick, UK, 2002.
[23] ASTM (American Society for Testing and Materials). Standard test method for ignition loss
of cured reinforced resins. D2584-11, West Conshohocken, Pennsylvania, USA, 2011.
[24] Ye BS, Svenson AL, Bank LC. Mass and volume fraction properties of pultruded glass fibre-
reinforced composites. Composites 1995; 26(10):725–731.
[25] D'Alessandro RG. Characteristic values of mechanical properties of wide-flange pultruded
FRF beams, MSc Thesis, University of Wisconsin-Madison, USA, 2009.
[26] Barker AJ, Balasundaram V. Compression testing of carbon fibre reinforced plastics exposed
to humid environments. Composites 1987; 18(3):217–226.
[27] Haeberle J, Matthews FL. Studies on compressive failure in unidirectional CFRP using an
improved test method. Proc. 4th European Conference on Composites (ECCM-4) 1990,
European Association for Composite Materials, Elsevier, London, UK, 517–523.

MANUSCRIP
T
ACCEPTED
ACCEPTED MANUSCRIPT
AGiraoCoelho et al_manuscript_rev.docx 05-01-2016 P a g e | 19
[28] Mottram JT. Compression strength of pultruded flat sheet material. J Mater Civ Eng 1994;
6(2):185–200.
[29] Kennedy JB, Neville AM. Basic statistical methods for engineers and scientists, 3rd Edition,
Harper & Row, London and New York, 1986.
[30] ASTM (American Society for Testing and Materials). Standard test method for shear
properties of composite materials by the V-notched beam method. D5379/D5379M-12, West
Conshohocken, Pennsylvania, USA, 2012.
[31] Parisch H. A continuum-based shell theory for non-linear applications. Int J Numer Meth Eng
1995; 38:1855–1833.
[32] Remmers JC, Wells GN, de Borst R. A solid-like shell element allowing for arbitrary
delaminations. Int J Numer Meth Eng 2003; 58:1701–1736.
[33] Hashin Z. Analysis of composite materials. J Appl Mech 1983; 50:481–505.
[34] Knops M. Analysis of failure in fiber polymer laminates – the theory of Alfred Puck.
Springer, Germany, 2008.
[35] Puck A, Schürmann H. Failure analysis of FRP laminates by means of physically based
phenomenological models. Compos Sci Technol 2002; 62:1633–1662.
[36] Wimmer G, Schuecker C, Pettermann HE. Numerical simulation of delamination in laminated
composite components – A combination of a strength criterion and fracture mechanics.
Compos Part B-Eng 2009; 40:158–165.
[37] Lopes CS, Sádaba S, González C, Llorca J, Camanho PP. Physically-sound simulation of low-
velocity impact on fibre reinforced laminates. Int J Impact Eng 2015; DOI:
10.1016/j.ijimpeng.2015.05.014

MANUSCRIP
T
ACCEPTED
ACCEPTED MANUSCRIPT
AGiraoCoelho et al_manuscript_rev.docx 05-01-2016 P a g e | 20
a) Mode I (m = I): opening b) Mode II (m = II): sliding c) Mode III (m =III): tearing
Fig. 1. Modes of delamination failure

MANUSCRIP
T
ACCEPTED
ACCEPTED MANUSCRIPT
AGiraoCoelho et al_manuscript_rev.docx 05-01-2016 P a g e | 21
Fig. 2. Sections of GFRP composite angle cleats showing a) Leg material and b) Tri-axial stitched
fabric sketch (http://vectorply.com/stitch-bonded-reinforcements/)

MANUSCRIP
T
ACCEPTED
ACCEPTED MANUSCRIPT
AGiraoCoelho et al_manuscript_rev.docx 05-01-2016 P a g e | 22
Fig. 3. Compression test rig and clamping arrangement drawing [28]
Load Linear
Bearin
g
Load
Clamping
Arran
geme

MANUSCRIP
T
ACCEPTED
ACCEPTED MANUSCRIPT
AGiraoCoelho et al_manuscript_rev.docx 05-01-2016 P a g e | 23
a) Material orientated at 0° b) Material orientated at 90°
Fig. 4. Failed compression test specimen

MANUSCRIP
T
ACCEPTED
ACCEPTED MANUSCRIPT
AGiraoCoelho et al_manuscript_rev.docx 05-01-2016 P a g e | 24
Fig. 5. Failed tension test specimen (material orientated at 90°)

MANUSCRIP
T
ACCEPTED
ACCEPTED MANUSCRIPT
AGiraoCoelho et al_manuscript_rev.docx 05-01-2016 P a g e | 25
a) Schematic of leg-angle with tying force
b) Composite lay-up adopted in the numerical study
c) FE mesh
Fig. 6. Composite angle cleat geometry
MANUSCRIP
T
ACCEPTED
ACCEPTED MANUSCRIPT
AGiraoCoelho et al_manuscript_rev.docx 05-01-2016 P a g e | 26
Fig. 7. Load-top displacement plot resulting from implementing the current FE model, and
comparison with existing numerical data from Wimmer et al. [36]
0
5
10
15
20
25
30
0.00 0.05 0.10 0.15 0.20 0.25 0.30 0.35 0.40
Load
(N
/mm
)
Displacement (mm)
Maximum load predicted byWimmer et al. [36]Current numerical results

MANUSCRIP
T
ACCEPTED
ACCEPTED MANUSCRIPT
AGiraoCoelho et al_manuscript_rev.docx 05-01-2016 P a g e | 27
Fig. 8. Delamination between layers five and six at maximum predicted load (plots on deformed
structure, magnification factor 5)

MANUSCRIP
T
ACCEPTED
ACCEPTED MANUSCRIPT
AGiraoCoelho et al_manuscript_rev.docx 05-01-2016 P a g e | 28
Fig. 9. Tensile load-top displacement plot resulting from implementing the current FE model, and
comparison with existing numerical data (per cleat) from Qureshi et al. [4]
0
2
4
6
8
10
12
0.00 0.02 0.04 0.06 0.08 0.10 0.12
Load
(kN
)
Applied displacement (mm)
Experiments - First loss of stiffness
Experiments - Maximum load
Current numerical model
A
B
C
MANUSCRIP
T
ACCEPTED
ACCEPTED MANUSCRIPT
AGiraoCoelho et al_manuscript_rev.docx 05-01-2016 P a g e | 29
a) Onset of delamination damage (point A, Fig.
9) b) Maximum load (point B, Fig. 9);
c) Delamination damage propagation (point C, Fig. 9)
Fig. 10. Delamination damage onset and propagation with load at interface I4

MANUSCRIP
T
ACCEPTED
ACCEPTED MANUSCRIPT
AGiraoCoelho et al_manuscript_rev.docx 05-01-2016 P a g e | 30
Table 1. Material constituent properties
Constituent part
SV TSFM UD Matrix
Number of layers in thickness 2 4 2* ‒
Fibre architecture Random fibre veil +45°/90°/-45°/CSM 156 (56 yield) ‒
% volume in total 3 34 33 30
% total of fibre reinforcement 5 48 47 ‒
Nominal layer thickness (mm) 0.03 1.4 2.0 ‒ * There is no UD layer found in between the middle TSFM layers as confirmed from observation of
cross-section in Fig. 2a.

MANUSCRIP
T
ACCEPTED
ACCEPTED MANUSCRIPT
AGiraoCoelho et al_manuscript_rev.docx 05-01-2016 P a g e | 31
Table 2. Elastic constants from micromechanical analysis
Constituent part
UD TSFM
Mat layer
(+45°/90°/-45°)
CSM
E1 (kN/mm2) 44.7 13.1 7.7
E2 (kN/mm2) 14.0 25.5 7.7
G12 (kN/mm2) 4.1 6.1 2.7
ν 0.28 0.41 0.41
MANUSCRIP
T
ACCEPTED
ACCEPTED MANUSCRIPT
AGiraoCoelho et al_manuscript_rev.docx 05-01-2016 P a g e | 32
Table 3. Summary of compression test results (average of a batch of ten tests)
Batch Compressive strength
(N/mm2)
SD
(N/mm2)
CoV
(%)
0° (1,C) 306 21.0 6.9
90° (2,C) 133 14.3 10.7

MANUSCRIP
T
ACCEPTED
ACCEPTED MANUSCRIPT
AGiraoCoelho et al_manuscript_rev.docx 05-01-2016 P a g e | 33
Table 4. Summary of tension test results (average of a batch of ten tests)
Batch Tensile strength
(N/mm2)
SD
(N/mm2)
CoV
(%)
0° (1,T) 294 7.6 2.6
90° (2,T) 84 8.6 10.0

MANUSCRIP
T
ACCEPTED
ACCEPTED MANUSCRIPT
AGiraoCoelho et al_manuscript_rev.docx 05-01-2016 P a g e | 34
Table 5. Lamina and interfacial properties of the curved laminate analysed by Wimmer et al. [36]
Elastic lamina properties Lamina strength properties Interfacial properties
E1 (N/mm2) 139300 f1,T (N/mm2) 1517 KI = KII = KIII (N/mm3) 3×10⁵
E2 = E3 (N/mm2) 9720 f1,C (N/mm2) 1593 fI (N/mm2) 40.5*
G12 = G13 (N/mm2) 5590 f2,T (N/mm2) 45 fII = fIII (N/mm2) 96.3*
ν12 0.29 f2,C (N/mm2) 253 GI,c (N/mm) 0.15
f1,S = f2,S (N/mm2) 107 GII,c = GIII,c (N/mm) 0.4 * These values correspond to a weakening factor of 0.9.