virtual adult ears reveal the roles of acoustical factors and experience in auditory space map
TRANSCRIPT
Behavioral/Systems/Cognitive
Virtual Adult Ears Reveal the Roles of Acoustical Factors andExperience in Auditory Space Map Development
Robert A. A. Campbell, Andrew J. King, Fernando R. Nodal, Jan W. H. Schnupp, Simon Carlile, and Timothy P. DoubellDepartment of Physiology, Anatomy and Genetics, Sherrington Building, University of Oxford, Oxford OX1 3PT, United Kingdom
Auditory neurons in the superior colliculus (SC) respond preferentially to sounds from restricted directions to form a map of auditoryspace. The development of this representation is shaped by sensory experience, but little is known about the relative contribution ofperipheral and central factors to the emergence of adult responses. By recording from the SC of anesthetized ferrets at different age points,we show that the map matures gradually after birth; the spatial receptive fields (SRFs) become more sharply tuned and topographic orderemerges by the end of the second postnatal month. Principal components analysis of the head-related transfer function revealed that thetime course of map development is mirrored by the maturation of the spatial cues generated by the growing head and external ears.However, using virtual acoustic space stimuli, we show that these acoustical changes are not by themselves responsible for the emergenceof SC map topography. Presenting stimuli to infant ferrets through virtual adult ears did not improve the order in the representation ofsound azimuth in the SC. But by using linear discriminant analysis to compare different response properties across age, we found that theSRFs of infant neurons nevertheless became more adult-like when stimuli were delivered through virtual adult ears. Hence, although theemergence of auditory topography is likely to depend on refinements in neural circuitry, maturation of the structure of the SRFs(particularly their spatial extent) can be largely accounted for by changes in the acoustics associated with growth of the head and ears.
Key words: virtual acoustic space; receptive field; ferret; linear discriminant analysis; head-related transfer function; sound localization
IntroductionUnderstanding the processes that guide sensory system develop-ment and give rise to adult perceptual abilities represents a majorgoal in neuroscience. Changes at the periphery and in the CNSboth contribute to the development of sensory functions, butisolating their relative contributions has proved to be difficult.This is particularly the case for a function like auditory localiza-tion, which relies on the measurement of physical cues generatedby the auditory periphery: interaural time differences (ITDs),interaural level differences (ILDs) and spectral cues produced bythe acoustic properties of the head and external ears (King et al.,2001). Because the values of these cues depend on the size, shapeand separation of the ears, neural representations of sound-source location cannot become fully mature until the auditoryperiphery has stopped growing. However, this maturational pro-cess also includes refinements in the neural circuits themselves
(King, 1999; Knudsen, 2002; Grothe, 2003; Kubke and Carr,2005), which enable the auditory localization system to be cali-brated by experience of the cues available to individual listeners.
A role for experience in shaping the spatial selectivity of audi-tory neurons has been most clearly demonstrated in the superiorcolliculus (SC), which contains topographically aligned maps ofdifferent sensory modalities. The auditory spatial receptive fields(SRFs) of SC neurons in infant animals are larger than thoserecorded in adults (Withington-Wray et al., 1990a; Wallace andStein, 1997, 2001). The emergence of topographic order and reg-istration with other sensory maps relies on both auditory andvisual inputs (King et al., 1988; Knudsen and Brainard, 1991;Gold and Knudsen, 2000; Wallace et al., 2004; Withington-Wrayet al., 1990b,c). Although these studies highlight the importanceof experience in the development of the auditory SRFs, they havenot considered the possible contribution of changes in the acous-tic localization cues that occur throughout postnatal develop-ment as the head and ears grow. Indeed, using virtual acousticspace (VAS) stimuli, we have shown that sharpening of spatialtuning with age in the ferret primary auditory cortex (A1) isattributable to growth-related changes in the localization cues(Mrsic-Flogel et al., 2003).
Here, we examine the relative contributions of peripheral andcentral factors to the development of the auditory space map inthe ferret SC. We first charted the time course of development ofthe localization cues available to the animal [the “head-relatedtransfer function” (HRTF)] after the onset of hearing. We thenquantified how the SRFs of SC neurons change during develop-ment, and used linear discriminant analysis (LDA) to measurethe degree of similarity between adult and infant response prop-
Received Feb. 6, 2008; revised Aug. 29, 2008; accepted Sept. 25, 2008.This work was supported by the Wellcome Trust through a four-year studentship (R.A.A.C.) and Senior and
Principal Research Fellowships (A.J.K.), by the Lister Institute for Preventive Medicine (A.J.K.), and by Biotechnologyand Biological Sciences Research Council Grant BB/D009758/1 (J.W.H.S; A.J.K.). We thank Andreas Schulz, KerryWalker, Ben Willmore, and Nicolas Heess for useful discussion.
Correspondence should be addressed to Dr. Andrew J. King, Department of Physiology, Anatomy and Genetics,Sherrington Building, University of Oxford, Parks Road, Oxford OX1 3PT, UK. E-mail: [email protected].
R. A. A. Campbell’s present address: Cold Spring Harbor Laboratory, 1 Bungtown Road, Cold Spring Harbor, NY11724.
S. Carlile’s present address: Discipline of Physiology (F13), School of Medical Sciences, University of Sydney, NSW2006 Australia.
T. P. Doubell’s present address: Institute of Medicine, Universiti Brunei Darussalam, Jalan Tungku Link, GadongBE1410, Brunei Darussalam.
DOI:10.1523/JNEUROSCI.0545-08.2008Copyright © 2008 Society for Neuroscience 0270-6474/08/2811557-14$15.00/0
The Journal of Neuroscience, November 5, 2008 • 28(45):11557–11570 • 11557
erties. Finally, by presenting infant SC neurons with virtual adultears, we were able to bypass the developmental changes in theauditory periphery. As in A1 (Mrsic-Flogel et al., 2003), this im-mediately caused the SRFs to become more sharply tuned. How-ever, topographic order in the representation was not improved,suggesting that the construction of a map of auditory space,which is a feature of the SC but not the cortex, relies on postnatalrefinements in neural circuitry.
Materials and MethodsGeneral. All experiments were conducted on pigmented ferrets (Mustelaputorius furo) of different ages, were approved by local ethical reviewcommittee, and were licensed by the UK Home Office in accordance withthe Animal (Scientific Procedures) Act 1986. Twenty-three ferrets agedfrom postnatal day (P) 33 to adulthood (�1 year of age) were used in thefree-field experiments, and a further eight infant animals, aged P32–P39,and seven adults were used for mapping the SC with virtual acousticspace stimuli derived from acoustical measurements from the animals’own ears. Additional acoustical data, collected as part of a previous studyby Mrsic-Flogel et al. (2003), were also reanalyzed for this study.
Surgery and anesthesia. An otoscopic examination and tympanometrywere performed before surgery to ensure the ear canal was clear anddisease free. Animals were anesthetized with alphaxalone/alphadoloneacetate (3 ml/kg, i.p.) (Saffan; Schering-Plough Animal Health) andgiven initial doses of atropine sulfate (30 �g, i.p.; Animal Care) anddoxapram hydrochloride (3 mg, i.m.) (Dopram-V; Fort Dodge AnimalHealth). The left radial vein was cannulated to provide a continuousinfusion of 5% glucose Hartmann’s solution (typical rate 5 ml/h) and foruse as a route of administration for supplementary doses of Saffan andDopram-V. A tracheotomy was performed and the body temperaturewas maintained at �39°C. The animal was then placed in a stereotaxicframe, fitted with blunt ear bars, and the skull exposed. A small steel barwas attached to the skull with screws and dental cement (Simplex Rapid;Austenal Dental), so that the head could be supported from behind with-out using the stereotaxic frame. A craniotomy was performed over theright SC and an additional two holes drilled so that electrodes could beinserted for recording of the electroencephalogram (EEG). The scalp wascarefully reattached with tissue adhesive (Vetbond; SM Animal CareProducts), so that the external ears assumed their preoperative positionsaccording to a series of measurements made before the first scalp inci-sion. For the VAS experiments, we performed acoustical recordings (seebelow) before the craniotomy.
In most cases (all adult recordings and the VAS experiments in infantferrets), the animals were paralyzed with pancuronium bromide (0.2ml/kg; Pavulon; NV Organon) to prevent eye movements. If this was notdone (free-field experiments in infant ferrets), eye movements were min-imized by running a series of sutures through the conjunctiva and fixingthem to the skin surrounding the eye with tissue adhesive. Where possi-ble, eye position was measured by back-projecting the location of theoptic disc using a reversible ophthalmoscope fitted with a corner-cubeprism. The mean � SD azimuth values were 28 � 11° in infant ferrets inwhich the eyes were stabilized mechanically and 24 � 5° under paralysis.We have previously shown that the range of visual best azimuthsrecorded along the rostrocaudal extent of the superficial layers of theSC in these two conditions completely overlap (King et al., 1996). Inall cases, the eyelids were trimmed, the pupils were dilated with atro-pine sulfate, and the eyes were protected with zero refractive powercontact lenses to allow mapping of visual receptive fields. Anesthesiaand paralysis were maintained with a continuous intravenous mix-ture of ketamine (Ketaset, 5 mg � kg �1 � hr �1; Fort Dodge AnimalHealth Ltd) and medetomidine hydrochloride (Domitor 10�g � kg �1 � hr �1; Pfizer) plus pancuronium bromide (0.2ml � kg �1 � h �1) in Hartmann’s solution. The paralyzed animals wereventilated artificially (7025 respirator; Ugo Basile) with oxygen-enriched air and the heart rate, end-tidal CO2, ECG, and EEG weremonitored continuously to ensure a stable level of anesthesia.
Acoustical measurements. All acoustical and electrophysiological mea-surements were performed in a sound-attenuated anechoic chamber. We
recorded the HRTF of each animal so that VAS stimuli could be pre-sented through the animal’s own virtual ears. A damped polythene probetube (length, 30 mm; inner diameter, 0.86 mm; outer diameter, 1.52mm) was passed caudally through each ear canal wall and secured inter-nally with a small flange, which abutted against the canal wall, and exter-nally with a rubber O-ring that was pushed against the skin behind thepinna. The acoustic signals were recorded through condenser micro-phones (miniature KE-4 –211-2 microphone capsules; Sennheiser) at-tached to the probe tubes. Using a speaker (KEF T27) mounted on avertical motorized hoop (radius, 65 cm), broadband signals (512-pointGolay codes) (Zhou et al., 1992) were presented from 66 different direc-tions at 16° intervals in azimuth from �160 to � 160° and at 6 verticalangles from � 80 to �60° elevation. The sampled positions were ar-ranged so that their diagonal separation was 34°. The generation of theGolay codes and the recording of the microphone signals were performeddigitally using TDT system 2 A/D and D/A converters (sample rate of 80kHz; Tucker-Davis Technologies) and 30 kHz anti-aliasing filters. Themicrophone signals were analyzed for each stimulus direction to calcu-late a spectral transfer function containing both the animal’s HRTF andthe transfer characteristics of the loudspeaker and probe microphones.The ITDs were extracted from the microphone signals by cross-correlation of the impulse responses after low-pass filtering (0 – 4 kHz).An in situ calibration to remove the transfer functions of the probe mi-crophones and earphone drivers used for presenting the VAS stimuli wasthen carried out. Minimum phase filters were calculated from the equal-ized amplitude spectra using the Hilbert transform. The VAS stimuliused during recording consisted of short (100 ms) Gaussian noise bursts,which were convolved with the appropriate minimum phase filter foreach direction, and delayed to generate the appropriate ITD. Psycho-physical studies in humans have shown that this “minimum-phase-plus-delay method” (i.e., with frequency-dependent ITDs excluded) ade-quately approximates the HRTF phase spectrum as long as the low-frequency ITD is appropriate (Kulkarni et al., 1999).
Mapping visual responses. In both free-field and VAS experiments neu-ral activity was recorded extracellularly using a tungsten-in-glass micro-electrode that was lowered vertically through the intact cortex into themidbrain via a remotely controlled motorized microdrive. In the free-field experiments, the electrodes had an uninsulated tip length of up to100 �m, to sample multiunit activity at different depths within the SC.Electrodes with a more conventional tip length of 10 –15 �m were used inthe VAS experiments, so that single units could be isolated. As the elec-trode was lowered, we searched for visual activity using a flashing yellowLED (wavelength, 590 nm; interstimulus interval, 1000 ms) located closeto the contralateral eye. The entry of the electrode into the superficiallayers of the SC was indicated clearly by robust visually driven activity.We then determined the best direction of the visual activity by presentingdiscrete light flashes from a 1-cm-diameter LED mounted on the motor-ized hoop.
Free-field auditory experiments. Having mapped the visual responses inthe superficial layers of the SC, the hoop loudspeaker was placed at thecenter of the visual receptive field and the electrode advanced into thedeeper layers while 100 ms white noise bursts (ramped with 5 ms rise/falltimes) were presented at a rate of 0.5– 0.7 Hz. Stimuli were produced bya Bruel and Kjær type 1405 noise generator. The threshold of each audi-tory multiunit cluster encountered was determined either at this loud-speaker position or, if different, at the auditory best azimuth of otherunits previously recorded in the same electrode penetration. At eachrecording site, responses were measured to five noise bursts presented attwo sound levels (near-threshold and suprathreshold, see Results) and at20° intervals in the horizontal plane from directions 160° contralateral to160° ipsilateral to the side of the brain from which the recordings weremade. By convention, contralateral sound directions were denoted bynegative numbers and ipsilateral directions by positive numbers. Theextracellular recordings were amplified, filtered (using a CED 1701 pro-grammable filter) and stored using a CED 1401 laboratory interface andpersonal computer. Recordings were displayed on-line and time win-dows chosen to encompass both the stimulus-evoked response and anequivalent period of spontaneous activity before the stimulus onset. Us-ing methods based on Chung et al. (1987), a fast Fourier transform was
11558 • J. Neurosci., November 5, 2008 • 28(45):11557–11570 Campbell et al. • Auditory Map Development in the Superior Colliculus

applied to the neural activity in these windows, and the increase in totalpower spectral density (PSD) over control noise segments calculatedfrom 200 to 3000 Hz. This frequency range was chosen on the basis of thepower bandwidth of the individual action potentials. We adopted thissignal processing technique, which has been used previously to quantifythe tuning of sensory neurons in a range of species (Chung et al., 1987;Withington-Wray et al., 1990a– c; King and Carlile, 1994), in the free-field experiments, because it did not require single units to be isolatedand therefore allowed preferred sound directions to be rapidly deter-mined. This is particularly advantageous for charting the maturation ofauditory topography across a range of postnatal ages. The activity in theresponse and control windows was monitored carefully during data col-lection to ensure that no bursting or dying units were included in thepower spectral density measurements. At the end of each electrode pen-etration through the SC, one or more electrolytic lesions (�5 �A for 5 s)were made at variable depths below the surface of the nucleus.
Virtual acoustic space experiments. After mapping of the visual bestposition (see above) we searched for auditory responses by presentingclosed-field contralateral broadband noise bursts. In these experiments,stimulus generation and data acquisition were controlled using Brain-ware software (Tucker-Davis Technologies) and TDT System 2 or Sys-tem 3 hardware. Stimuli were delivered through Panasonic earphonedrivers (RP-HV297), coupled to otoscope specula which were insertedinto the ear canals. When an auditory response was identified the thresh-old of the unit was determined by presenting freshly generated, unfilterednoise bursts to the contralateral ear (100 ms duration with an interstimu-lus interval of 1000 ms) at a range of sound levels. Thresholds weredetermined as the lowest sound level to elicit an increase in firing ratesignificantly greater ( p � 0.05) than the unit’s resting level. The SRFs ofmost units were measured at two sound levels, one near (typically 5–15dB above) unit threshold and a second at a level well (typically 25–35 dB)above unit threshold. SRFs were measured by presenting VAS stimuli ina random order with an interstimulus interval of 1000 ms from the same66 sound directions used for measuring the HRTF. This process wasrepeated until 10 –20 responses for each virtual stimulus direction had
been collected. On each presentation freshlygenerated Gaussian noise bursts were con-volved with a pair (one for each ear) ofminimum-phase filters corresponding to a par-ticular virtual space direction.
The implanted probe microphones enabledus to confirm that the VAS stimuli accuratelyreplicated each animal’s own HRTF measuredwith free-field stimuli. This is illustrated in Fig-ure 1, which shows how the gain measured inone ear of one animal varies with stimulus azi-muth and frequency (Fig. 1 B), together withexamples of the amplitude spectrum measuredfor both VAS and free-field stimuli for threedifferent directions in space (Fig. 1 D). A de-tailed comparison of the VAS and free-field am-plitude spectra for numerous sound-source di-rections revealed a very small and consistentdifference in amplitude across frequency of �1dB in 80% of cases and �3 dB in 90%. Largerdifferences were found only at high frequencieson the side contralateral to the microphone,which were due to the attenuating effect of thehead causing the signals to approach the noisefloor of our recording equipment. By compar-ing the SRFs measured for single units in theinferior colliculus (IC) with each form of stim-ulation, we also previously showed that the VASstimuli are capable of evoking very similar neu-ral responses to free-field stimulation (Camp-bell et al., 2006). In addition to using individu-alized (own-ear) VAS stimuli, we presentedvirtual sound directions to infant animals thatwere based on adult HRTF measurements. Toachieve this we simply selected a prerecorded
adult HRTF from an animal of the same sex, applied the in situ calibra-tion, and constructed new minimum-phase filters from these acousticaldata. The order in which the own-ear and adult-ear stimuli were pre-sented was varied from unit to unit.
Electrode signals were bandpass filtered (500 Hz–5 kHz), amplified(up to 15,000�) and digitized at 25 kHz. Individual spike shapes ofmultiunit clusters were sorted off-line using a k-means clustering algo-rithm incorporated into Brainware. Recordings in the VAS experimentswere either single units or small multiunit clusters as judged from thespike shapes and the presence of a refractory period in the autocorrela-tion histogram. The response period for each unit was individually de-termined from the peri-stimulus time histogram. In all cases, firing rateshad returned to spontaneous background levels by 400 ms after stimulusonset. Response magnitude was measured relative to the spontaneousactivity of the neuron, which was obtained from a second window drawnbetween 500 and 1000 ms after stimulus onset.
Matlab (Mathworks) was used for constructing SRF plots, analyzingacoustical data, and preprocessing raw data for further statistical analy-ses. SRFs recorded with VAS stimuli were visualized by producing asmoothed map projection showing the mean evoked spike rate foreach sound direction. Smoothing was done by interpolation of theaveraged responses over a uniform grid of 7.5° resolution. To avoiddiscontinuities because of extrapolation over positions above andbehind the animal, we extended the matrix maps to cover a �200° to� 200° azimuth range by copying values across from the oppositeedge, i.e., from �160° to � 200° and from � 160° to �200°. Thisensured that the algorithm could interpolate smoothly and withoutdiscontinuities across the full � 180° azimuthal range. Statisticalmodeling (linear discriminant analysis and mixed-effects linear re-gression) and the generation of associated plots were performed usingR, an open-source statistical package (www.r-project.org, also seeVenables and Ripley, 1999). Further details are provided in the sup-plemental material, available at www.jneurosci.org.
Figure 1. A–C, Comparison of free-field and VAS stimuli. A, For each animal, broadband noise bursts were presented from arange of sound-source directions with respect to the head using a speaker mounted on a robotic arm. A probe microphone wasplaced in each ear canal to record the animal’s head-related transfer function. B, The surface plot shows how the acoustic gainmeasured in one ear varies as a function of stimulus frequency and azimuth (see also Fig. 3). C, Any desired sound-source directioncan be simulated over earphones by convolving the acoustic stimulus with the appropriate left and right ear filter pairs. D,Amplitude spectra measured in one ear for free-field (black) and VAS (red) stimuli presented at 3 different sound-source direc-tions. Note that the black lines are largely obscured by the red lines, indicating the fidelity with which the VAS stimuli recreated thespectral cues produced by the free-field stimuli.
Campbell et al. • Auditory Map Development in the Superior Colliculus J. Neurosci., November 5, 2008 • 28(45):11557–11570 • 11559

ResultsMaturation of auditory map topographyWe quantified the maturation of the auditory space map in thedeeper layers of the ferret SC by measuring its correlation with thevisual map in the overlying superficial layers at a range of agepoints. Auditory brainstem response (ABR) measurements haveshown that hearing onset occurs at P26 –P30 in this species(Moore and Hine, 1992). This is followed by a rapid decrease inABR threshold and latency, most likely because of improved con-duction through the external and middle ear, with adult-like val-ues reached by P34 –P36. We therefore charted the developmentof auditory topography from P33, after these peripheral changeshave taken place, to P62, around the age at which the animals areweaned, and also recorded from adult animals (�1 year of age).The visual map is a suitable reference for revealing the matura-tion of the auditory representation, because the retinocollicularprojection is topographically ordered at birth (King et al., 1998a),and an adult-like visual map is already present in the superficiallayers at eye opening (King et al., 1996), which occurs at �1month of age.
Figure 2 plots the auditory best azimuth as a function of thevisual best azimuth obtained in the superficial layers of that elec-trode penetration. Data are broken down by age point and soundlevel, with near-threshold levels (mean � SD, 10.5 � 2.7 dBabove threshold) shown by the red symbols and suprathresholdresponses (25.5 � 2.7 dB above threshold) indicated by the bluesymbols. These sound levels were chosen because previous stud-ies in adult mammals have shown that near-threshold responsesare derived primarily from monaural spectral cues provided bythe contralateral external ear (Palmer and King, 1985; King et al.,1994), whereas suprathreshold spatial tuning is based on neuro-nal sensitivity to a combination of ILDs (Wise and Irvine, 1985)and spectral cues (Carlile and King, 1994). In the adult SC (Fig.2E), there is an excellent correlation between the visual and au-ditory best azimuths at both sound levels (see inset panel for Rvalues), indicating the presence of a level-invariant map of audi-tory space. This confirms our previous finding made by countingspikes from isolated single units (King et al., 1994).
In contrast to the highly ordered auditory representationfound in adult animals, the best azimuths in the youngest ferretsrecorded (the so-called “infant” animals) were much more scat-tered throughout the contralateral hemifield, and a few record-ings even showed a preference for ipsilateral sound directions(Fig. 2A). The correlation between the visual and auditory bestazimuths gradually improved with age at both sound levels (Fig.2A–E), as indicated by the steady increase in the correlation co-efficient (Fig. 2E). By P48 –P52 (Fig. 2C), the slope of the regres-sion line for the suprathreshold data (blue) was significantly dif-ferent from zero ( p � 0.05), whereas a few days later, at P53–P62(Fig. 2D), the regression slopes obtained at both sound levelswere significant. Thus, spatial selectivity based on differentacoustical cues appears to emerge at a similar age.
Maturation of acoustical cuesThe data shown in Figure 2 indicate that whereas some auditoryneurons are tuned to directions that lie within the adult range atthe earliest age examined, there is no systematic relationship be-tween auditory and visual best positions until later age points.During development, the head and external ears are growing insize, which alters the localization cue values associated with dif-ferent directions in space (Carlile, 1991; Mrsic-Flogel et al., 2003;Schnupp et al., 2003). This therefore raises the question ofwhether a correlation exists between the maturation of the audi-tory periphery and the time course of map development in theSC.
Figure 3 shows example horizon directionality transfer func-tions (DTFs) from two different adult (Fig. 3A,B) and two dif-ferent infant (P33) ferrets (Fig. 3C,D). These plots indicate thespectrum level gains as a function of sound azimuth at 0° eleva-tion. DTFs are the direction-dependent components of theHRTF, and were calculated by subtracting the mean spectraltransfer function for all measured sound source directions fromthe spectral function for each individual direction. DTFs there-fore remove aspects of the HRTF that are independent of sound-source direction, such as ear canal resonances, and eliminate in-
−150 −50 0
−15
0−
500
5010
015
0 P33−P37A
Aud
itory
azi
mut
h [d
eg.]
Visual azimuth [deg.]
P41−P46B
P48−P52C
P53−P62D
AdultE
00.
51
R v
alue
Age point
Figure 2. Maturation of auditory spatial topography in the ferret SC. A–E, Each panel plots the auditory best azimuth of deep layer SC units as a function of the visual best azimuth of multiunitactivity recorded in the overlying superficial layers. The data were obtained at the postnatal ages indicated at the top of each panel using free-field stimuli. Because adult-like visual topography ispresent in the superficial SC layers throughout this developmental period, the topographic order of the auditory map is reflected in the degree to which it is in register with the visual map. Auditoryresponses recorded at near-threshold sound levels (�10 dB � unit threshold) are shown in red and suprathreshold levels (�25 dB � unit threshold) in blue. A linear regression was fitted to thedata from each sound level at each age group (red and blue lines; the black line is the 45° diagonal indicating perfect alignment of the visual and auditory data). The inset panel in E plots thecorrelation coefficient ( R) of each regression slope as a function of age. At both sound levels there is a steady increase in the R value during development, indicating an improvement in topographicorder in the auditory representation.
11560 • J. Neurosci., November 5, 2008 • 28(45):11557–11570 Campbell et al. • Auditory Map Development in the Superior Colliculus

teranimal variation due to differences in microphone positionwithin the ear canal.
There are marked similarities between individual DTFs withinan age group and clear differences between age groups. The adultDTFs exhibit more spectral “features,” i.e., azimuth-frequencycombinations in which the gain increased or decreased, than didthe infants, particularly for sound-source directions ipsilateral tothe ear from which the recordings were made. The azimuthalextent of the high gain region is also narrower for the adults thanfor the infants (i.e., the infant DTFs are less directional). More-over, where corresponding features could be identified, they areshifted to higher frequencies in the infants. Thus, a notch ispresent in the adult DTFs in which transmission gain is reducedby �10 dB over a narrow range of high frequencies. The fre-quency of this notch moves from �23–28 kHz as the stimulusdirection shifts from the midline to the anterior ipsilateral quad-rant (Fig. 3A,B, indicated by the narrow green region). A corre-sponding spectral notch could be identified in some of the infant
DTFs, but was found at higher frequenciesthan in the adults (Fig. 3C), whereas inother infant DTFs, including the one illus-trated in Figure 3D, these notch frequen-cies appeared to be so high as to fall mostlybeyond the 30 kHz cutoff of our recordingequipment.
We used principal components analy-sis (PCA) to quantify the individual andage-related differences across our popula-tion of horizon DTF recordings. Althoughwe obtained acoustical data from a rangeof elevations, we restricted our PCA anal-ysis to 0° elevation to facilitate comparisonwith the free-field SC data described in theprevious section. We converted the DTF ofeach ear (in total there were n � 40 DTFs,18 from adults, 14 from infants, and 8from juvenile ferrets aged �P50) from atwo-dimensional matrix to a vector; eachDTF was based on 33 azimuth positionsand 190 frequency bins. Every other fre-quency bin was removed to yield a 33 by 95matrix, which was converted to a vector oflength Q � 33 � 95. We conducted a PCAon the population of DTFs by concatenat-ing the vectors to form an n by Q matrix.
Figure 3E shows the position of each ofthe individual DTFs in the space spannedby the first two resultant principal compo-nents. Cumulatively, these first 2 compo-nents explain 56% of the variance in theDTFs. Each point in this figure representsthe data from one ear of one animal, withdifferent color symbols used according tothe age of the animals. The large crossesindicate the mean and its 95% confidenceinterval. There is a very clear distinctionbetween the adult (green) and infant (blue,�P33) animals because their distributionsdo not overlap. However, the distributionof the juvenile (�P50) data, representedby the red symbols, does overlap with thatof the adults, indicating that juvenile DTFsare substantially more similar to adults
than they are to infants. Because a significant relationship be-tween the visual and auditory SRFs first emerges at �P50 (Fig. 2),these data reveal that the development of the auditory map fol-lows a similar time course to the maturation of the acoustic cuesfor sound location. This correlation suggests the possibility thatthe immaturity of the auditory periphery could be preventing theemergence of adult-like auditory topography in the developingSC.
How important is maturation of the periphery to thematuration of the auditory space map?Assessing the relative importance of peripheral and central fac-tors in the development of the SC auditory map requires morethan just looking for parallels between the acoustical and physi-ological changes that take place during postnatal development.By presenting VAS stimuli over earphones, we can recreate theacoustic filtering of an individual’s head and external ears(Wightman and Kistler, 1989a,b; King et al., 2001). The resulting
Figure 3. Maturation of the acoustical properties of the ferret external ear. A–D, Example DTFs from two different adults (A, B)and two different infants (C, D). Each plot shows how pinna gain varies as a function of azimuth (x) and frequency (y) at 0°elevation. The DTFs are each composed of data from 33 different azimuth directions; no smoothing or interpolation has been used.All plots share the same color scale, which indicates gain (in dB) normalized according to the wider dynamic range of the adultanimals. The difference in gain on either side of the midline (0°) is attributable to the acoustic shadowing effect of the head. Thereare marked similarities within age-points and differences between them. Note the high frequency notch found in both adultanimals (arrowed in A); the frequency of the notch changes systematically as a function of azimuth. This is also present, but shiftedup in frequency, in one of the infant ferrets (C). To quantify age differences in the spectral cues, we converted each 2-dimensionalDTF to a vector and performed a PCA on the population of DTF vectors (see text). E, Data plotted along the first two principalcomponents (which cumulatively explain 56% of the variance). Points are labeled according to the age of the animal and eachanimal is represented by two data points, one for each ear. The large crosses indicate the mean and 95% confidence intervals foreach distribution. There is a clear distinction between the infant (blue) and adult points (green) with no overlap between thedistributions. Juvenile animals (�P50, red) have intermediate DTFs that overlap with the adult distribution (note confidencelimits); it is at this age that significant topography in the auditory representation first appears in the SC.
Campbell et al. • Auditory Map Development in the Superior Colliculus J. Neurosci., November 5, 2008 • 28(45):11557–11570 • 11561

stimuli are “externalized” and their appar-ent direction in space can be controlled bythe experimenter. Stimuli can be pre-sented through “virtual ears”, which eitherreproduce the animal’s own ears or mimicthose of another individual by convolvingthe acoustic stimulus with the appropriatefilters derived from prerecorded HRTFs.This enabled us to test the importance ofperipheral maturity directly by recordingSRFs from the SC of infant animalsthrough the virtual ears of an adult ferret.
Using individualized VAS stimuli, weobtained detailed SRFs from 48 units frominfant animals (P32–P39), plus 44 unitsrecorded in the SC of adult ferrets (dataoriginally gathered for Campbell et al.,2006), by measuring the mean evokedspike rate from virtual sound-source di-rections covering a large range of azimuthsand elevations. The overall preferredsound direction of each SRF was deter-mined by calculating the direction of thecentroid vector (see supplemental mate-rial, available at www.jneurosci.org). Fig-ure 4 plots visual best azimuths of multi-unit activity recorded in the superficiallayers of each electrode penetrationagainst the azimuth of the auditory cen-troids for both infants (Fig. 4A) and adults(Fig. 4B). Within each age group we fitteda single linear model to the data from both sound levels. Poolingacross levels introduces correlation to the regression because eachunit was generally recorded at more than one sound level. Wecorrected for correlation (which leads to an overestimate of thenumber of degrees of freedom) by applying mixed-effects linearmodels to these data (Pinheiro and Bates, 2000).
Infant animals showed no clear relationship between thevisual and auditory data (Fig. 4 A; the slope of the linear modelwas not significantly different from zero, p � 0.11, df � 44, r �0.17), indicating a lack of association between auditory cen-troid directions and visual best azimuths. This therefore con-firms the free-field data obtained from other ferrets of this age(Fig. 2 A). Again like the free-field responses (Fig. 2 E), theadult data from the VAS experiments showed a significantrelationship between the visual and auditory representations(Fig. 4 B), although, in this case, a second order model pro-vided a better fit (both first and second order terms weresignificantly different from zero; p[x 1] � 0.001; p[x 2] � 0.02,df � 32, r � 0.69). Because we showed that the VAS stimulifaithfully replicated the spectral cues produced by real free-field sound sources (Fig. 1), this difference in the order of themodel that best fits the auditory topography data are mostlikely to arise from differences in the range of stimulus loca-tions sampled and in the electrophysiological recording andanalytical techniques used in each case. The free-field datawere obtained by varying stimulus azimuth at a fixed elevationand spatial tuning was assessed at different ages using powerspectral density measurements that sample neural activity, re-gardless of signal-to-noise ratio, over a relatively large regionof the SC. In contrast, stimuli were presented from 66 virtualsound directions, varying in azimuth and elevation, with spikecounts from single units or small multiunit clusters, compris-
ing two or more nearby units, used to construct the SRFs.Nevertheless, both approaches clearly show that sound azi-muth is mapped within the SC and that this topographic or-der, and therefore visual-auditory map alignment, emergesduring the course of postnatal development.
Our acoustical analysis revealed a correlation in the timecourses of the development of the localization cues and auditorymap topography, suggesting that the observed order in the audi-tory representation at different ages might simply reflect the val-ues of the localization cues available then. To investigate thispossibility, we recorded infant SRFs through the virtual ears ofadult animals. If the infant auditory system is “prewired” foradult acoustic cues, then presenting closed-field sounds thatfaithfully mimic those cues should lead to more adult-like re-sponses, including improved topographic order, in the auditoryrepresentation in the SC. However, Figure 4C shows that con-ducting this manipulation did not lead to immediate improve-ments in map topography. The black points in this panel aretaken from Figure 4A, showing the data obtained by mappingSRFs in infant ferrets with individualized VAS stimuli, whereas thered points in Figure 4C show the SRF centroids from the same infantSC units, but recorded with VAS stimuli derived from an adult of thesame sex. The black and red lines are from a linear model fitted toeach data set. Replacing the animals’ own ears with mature acousti-cal cues did not produce an adult-like map of space. This is con-firmed by the linear model, which shows that there is no significantdifference in the slopes of the two data sets ( p � 0.56, df � 73). Ittherefore appears that the poor correlation between auditory andvisual responses in early life is probably related more to the imma-turity of the central auditory system than the spatial informationprovided by the head and external ears.
Figure 4. Relationship between auditory centroid azimuth of deep layer single-unit responses and the best azimuth of super-ficial layer visual responses in infant (P32–P39) and adult ferrets measured using VAS stimuli. A, B, Different symbols correspondto near-threshold and suprathreshold sound levels, as indicated in the legends. Regressions have been fitted to data from bothsound levels; dashed lines indicate 95% confidence limits. The correlation coefficient ( R) of the fit is shown in the bottom rightcorner of each plot. A, Data from infant ferrets obtained by presenting stimuli through their own ears; the slope of the linearregression line is not significantly different from zero, indicating that there is no systematic relationship between the visual andauditory responses recorded in the same electrode penetration. B, Data from adult animals. In this case a second-order linearmodel was required to fit the relationship between the visual and auditory responses, as both first and second-order terms hadcoefficients that were significantly different from zero. C, Effect of recording infant auditory SRFs through the ears of an adultanimal. Red symbols indicate infant SRF centroids recorded with adult ears; grey are infant SRFs recorded with their own ears(same data as in A). A linear model showed no significant difference between these data sets ( p � 0.56). The inset panel in Ccompares the R values from the free-field data obtained at different ages and sound levels (black and grey circles, taken from Fig.1 E) with those of the VAS data. The black square shows the R value for adult VAS data averaged over both sound levels. The greytriangle indicates the R value for the infant SRFs recorded with the animals’ own ears, whereas the red square indicates the valuefor the infant SRFs recorded with virtual adult ears. In each case, the R values are very similar to those obtained for age-matchedferrets in the free-field data.
11562 • J. Neurosci., November 5, 2008 • 28(45):11557–11570 Campbell et al. • Auditory Map Development in the Superior Colliculus

Quantifying the development of the spatial receptivefield propertiesSo far, we have focused solely on the preferred sound direction,defined as the SRF centroid direction. However, SRFs can varysubstantially in size and shape even if the measure of preferredsound direction remains the same. Switching from infant to adultears might therefore make the infant SRFs more similar to thosefound in the adult SC in ways that are not captured by consider-ing the centroid directions alone. This possibility is supported bythe representative examples shown in Figure 5. The SRFs re-corded with their own ears from infant ferrets were often larger atboth near-threshold and suprathreshold sound levels than thoserecorded in adult animals. But when adult spatial cues were pro-vided, the infant SRFs tended to become smaller (Fig. 5, compare
middle two columns), a change that was usually associated withan alteration in the mean evoked spike rate of the units (Fig. 5, lastcolumn). To compare the SRFs across age, we measured the max-imum mean evoked spike rate (spikes/s), the area (rad 2) withinwhich the response was �50% of the maximum value, and thelength of the centroid direction vector as a means of assessing the“patchiness” of the response. Centroid vector length can vary invalue from 0 to 0.75, with longer values indicating highly focused(less patchy) SRFs. These parameters are described in greaterdetail in the supplemental text and supplemental Fig. 1, availableat www.jneurosci.org as supplemental material. The distribution ofvalues obtained for each parameter is plotted separately for singleunits and small multiunit clusters in supplemental Fig. 2, available atwww.jneurosci.org as supplemental material. Because we observed
Figure 5. Example spatial receptive fields of units recorded from the right SC with VAS stimuli. The four top rows show suprathreshold data and the bottom four rows show near-threshold data.The left column shows the SRFs of units recorded in adult ferrets. The subsequent two columns show SRFs from infant units recorded with the animal’s own ears (second column) or with the ears ofan adult animal of the same sex (third column). The color scale bars indicate the evoked spike rate (spikes per second). The color scales for each infant SRF pair are the same so as to show wherechanging ears altered the mean evoked spike rate. Crosses indicate the centroid vector direction. The black contour line demarcates the area within which the evoked spike rate exceeded 50% of theunit’s maximum response. Adult and infant SRFs were recorded sequentially and so the right column depicts recording stability. Each point represents the mean evoked spike rate over all VASdirections for a particular stimulus run. The x-axis indicates the mean time (min) of each particular stimulus run. Black symbols are own-ear data and red are adult-ear data. Note that the twoconditions were not always recorded in the same order.
Campbell et al. • Auditory Map Development in the Superior Colliculus J. Neurosci., November 5, 2008 • 28(45):11557–11570 • 11563

no clear differences between them, data werecombined from the single units and multi-units in subsequent analyses.
Figure 6 compares own-ear SRF statis-tics from adult and infant animals with thedata broken down by sound level. The dif-ferences between the two age groups aresummarized using 6 t tests for significantdifferences between the means within eachsound level. The results of these are shownby the array below the box-plots: each ofthe parameters used for characterizing theresponse differed significantly across agefor at least one sound level, with significantdifferences observed in the 50% SRF areabetween infants and adults at both soundlevels. The results of equivalent compari-sons between the responses of infant SCunits recorded with their own virtual earsand with adult virtual ears are depicted inFigure 7. Paired t tests revealed significantchanges in the mean maximum spike ratewhen adult cues were provided. Althoughthe 50% areas were not significantly differ-ent between the two conditions at eithersound level, the box plots neverthelessshow a trend for these values to decreasewith adult ears.
Similar analyses have been used in pre-vious studies with data of this sort (Mrsic-Flogel et al., 2003; Campbell et al., 2006).However, a p value does not address themore pertinent question of how separableor distinct one group (i.e., one distribu-tion) is from the other. Furthermore, con-ducting a series of separate tests is not op-timal for data in which each observation(in this case the SRF) is characterized bymultiple parameters that are unlikely to beindependent. To quantify the degree ofsimilarity between the SRFs recorded inadult and infant ferrets, we therefore useda technique known as linear discriminantanalysis (LDA), which finds the optimallinear separation between groups of data points. The principlebehind LDA is straightforward. Given two groups in ann-dimensional space, LDA seeks to find the single direction, theso-called linear discriminant (LD), which maximally separatesthe two groups. LDA scales to problems involving multiplegroups so that G groups are captured by an LD space comprisedof G � 1 LDs, with each LD separating two groups. The directionof an LD is defined by n coefficients, corresponding to the nvariables, or dimensions, with which the groups were originallydefined (i.e., the original n-dimensional space). If these originalaxes are in the same units, the coefficients of the LD indicate thedegree to which each variable contributes to separating thegroups. More details on LDA, along with a graphical explanation,are provided in the supplemental text and supplemental Figs.3– 6, available at www.jneurosci.org as supplemental material.
Discriminating adults from infantsWe used the distribution of the SRFs in LD space to determine,for any given SRF, the degree of certainty that it could be attrib-
uted to an adult or an infant. We then used the LDA coefficientsto assess which features were best able to distinguish between theage groups. We first performed an LDA by pooling data acrosssound level into two groups (adult and infant SRFs), resulting ina single LD along which the two distributions can be representedas histograms (Fig. 8).
Figure 8A,B shows the LDA performed on the SRFs recordedin adult and infant ferrets using VAS stimuli derived from eachanimal’s own ears. The optimal linear separation of the adult andinfant data is shown in Figure 8A, which plots the distributions ofthe data along the LD direction. The scale of the LD is unit-lesswith the grand mean of the two groups having a value of zero.Infant SRFs had more positive values along the LD comparedwith adult SRFs. Classifying SRFs as adult or infant based solelyon their position along the LDA gives correct results more oftenthan would be expected by chance. On the basis of the observeddata distributions shown in Figure 8A, SRFs could be assigned totheir correct age-point 67% of the time. We assessed the signifi-cance of this value using confidence intervals derived from a
050
100
150
200A
Max
. res
pons
e [s
pike
s/s]
Adult Infant
Near Supra.
24
68
B
50%
Are
a [r
ad^2
]
0.1
0.2
0.3
0.4
0.5
0.6C
Cen
troi
d le
ngth
Max Area Length
Sup
ra N
ear
D
p=0.04 p=0.002 p=0.72
p=0.12 p=0.002 p=0.03
Figure 6. A–C, Box-plots comparing the distributions of SRF parameters from infant (pink) and adult (grey) recordings. Dataare also broken down by sound level, with darker colors indicating suprathreshold levels and lighter colors indicating near-threshold sound levels. The boxplots show the median (horizontal bar), interquartile range (boxes) and spread of non-outlier data(tails). The data values on which the box-plots were based are superimposed (x-axis jittered for clarity). D, Two-by-three matrixsummarizing the results of t tests for significant differences between adult and infant SRFs within each parameter and sound levelcondition. Black boxes highlight significance ( p � 0.05; n �38 in each group). For example, the top left box shows that the meanmaximum spike rate was significantly different ( p � 0.04) between adult and infant SRFs at near-threshold sound levels.
050
100
150
200
250
300A
Max
. res
pons
e [s
pike
s/s]
Own Adult
Near Supra.2
46
810
B50
% A
rea
[rad
^2]
0.0
0.2
0.4
0.6
C
Cen
troi
d le
ngth
Max Area Length
Sup
ra N
ear
D
p=0.06 p=0.61 p=0.66
p<0.001 p=0.45 p=0.84
Figure 7. A–C, Box-plots comparing the distributions of SRF parameters from infant animals recorded with their own ears(pink) and with the ears of an adult animal (grey). As in Figure 6, data are broken down by sound level, with darker colorsindicating suprathreshold levels and lighter colors indicating near-threshold sound levels. D, Two-by-three matrix summarizingthe results of t tests for significant differences between adult and infant SRFs within each parameter and sound level condition.Black boxes highlight significance ( p � 0.05; n �38 in each group).
11564 • J. Neurosci., November 5, 2008 • 28(45):11557–11570 Campbell et al. • Auditory Map Development in the Superior Colliculus

bootstrapping and cross-validation approach. Chance classifica-tion performance was estimated by running the analysis 1000times using randomly assigned group identities. The classifica-tion accuracies of these replicates are shown by the histogram inthe inset plot of Figure 8A. To avoid over-fitting we did not testthe observed value of 67% against this distribution. Instead weran the LDA again using a cross-validation approach, in which
the LD was calculated on a randomly cho-sen subsample of 90% of the data and theclassification performed on the remaining10%. This was repeated 1000 times and re-sulted in a mean classification accuracy of61%, which is plotted as the dashed redline in the inset figure. Only 0.1% of thechance (bootstrapped) values exceededthis value. Hence we derive a p value of0.001 to describe the probability of obtain-ing the observed classification accuracy bychance.
The coefficients of the LD indicate onwhat basis the groups are separated. TheLDA in Figure 8A, along with the otherspresented in the following sections, wasconducted on the z-scored parameter val-ues. In other words, for each of the 3 pa-rameters (maximum firing rate, SRF 50%area and centroid vector length) we sub-tracted the mean and divided by the vari-ance, rendering them unit-less. Hence theLD coefficients shown in Figure 8B indi-cate the relative importance of each vari-able in separating the adult and infantgroups. The largest coefficient was ob-tained for the 50% response area, whichhad a large positive value. This means thatSRFs with more positive values along theLD are those with larger response areas.Because the infant data are skewed to thepositive side of the LD (Fig. 8A), it followsthat infant animals tended to have largerresponse areas than adults. This is furtherillustrated in Figure 9A, which plots foreach unit in the infant and adult groupsthe z-score of the 50% area against that ofthe centroid vector length. These valuesclearly covary, with smaller areas associ-ated with longer centroid lengths. Al-though there is substantial overlap be-tween them, the data from the adultanimals are distributed below the infantdata, indicating that adult SRFs aresmaller. This interpretation is confirmedby the box-plots in Figure 6 and also byexamination of the example SRFs in Figure5. Thus, in addition to the development oftopographic order in the auditory repre-sentation, shown in Figures 2 and 4, thereare also systematic changes in the structureof the SRFs, and particularly in their spa-tial extent, as the ferrets get older.
Recording infant SRFs with virtual adultears
We next asked whether virtual adult ears made infant SRFs moreadult-like. We addressed this by comparing the infant SRFs re-corded with virtual adult ears first to those recorded with theinfants’ own ears and, second, to the SRFs recorded from adultanimals. Figure 8, C and D, shows the results of an LDA whichseparates infant SRFs recorded with the animals’ own ears (red)from those recorded through the virtual ears of an adult animal of
Figure 8. Results of three different linear discriminant analyses of the SRFs recorded from infant and adult ferrets in which thedata were pooled across sound level. Together, these analyses show that infant SRFs become more like those of adult ferrets whenthey are recorded through virtual adult ears. A, C, E, The LDA was performed on each pair of recording conditions, as indicated inthe histograms, which show the distribution of the data along the linear discriminant dimension in each case. These distributionsshow the best linear separation of the two groups based on maximum response, 50% response area, and centroid vector length.Inset plots quantify classification accuracy based on the distribution of the data along the LD. The black inset histograms arebootstrap-derived estimates showing the proportion of correct classifications that would occur by chance. In each case, the dashedred line indicates the observed classification accuracy. A p value is derived by comparing these two (for details see text). B, D, F, Barcharts show the coefficients that define the direction of the LD. The magnitude of the coefficients indicates the relative importanceof each variable for separating the two groups. Error bars show one SEM and are obtained from 1000 bootstrapped simulations ofthe raw data using Monte Carlo resampling. A, B, LDA separating adult ferret SRFs from infant ferret SRFs, in both cases recordedwith individualized VAS stimuli derived from acoustical measurements from the animals’ own ears. Classification accuracy wassignificantly better than chance ( p � 0.001). Infants have the more positive values along the LD, and the coefficients exhibit alarge positive weighting for response area, indicating that this is the most important variable for separating the two groups. C, D,LDA comparing infant SRFs recorded with their own HRTFs and with HRTFs of adult animals. This LD was also successful inseparating the two groups ( p�0.023). The direction of the LD is similar to that which segregated infant from adult data, with thehighest weighting for area and the next highest for centroid length. This suggests that switching to adult ears makes the SRFsmore adult-like because these groups are separated by an LD with a similar direction to that in A and B. E, F, LDA comparing SRFsfrom infant ferrets recorded with adult HRTFs to adult SRFs recorded with the animals’ own ears. The LDA was not able to separatethe groups ( p � 0.64), indicating that, on the basis of centroid length, maximum response strength and response area, adultown-ear SRFs are indistinguishable from infant SRFs recorded with adult ears.
Campbell et al. • Auditory Map Development in the Superior Colliculus J. Neurosci., November 5, 2008 • 28(45):11557–11570 • 11565
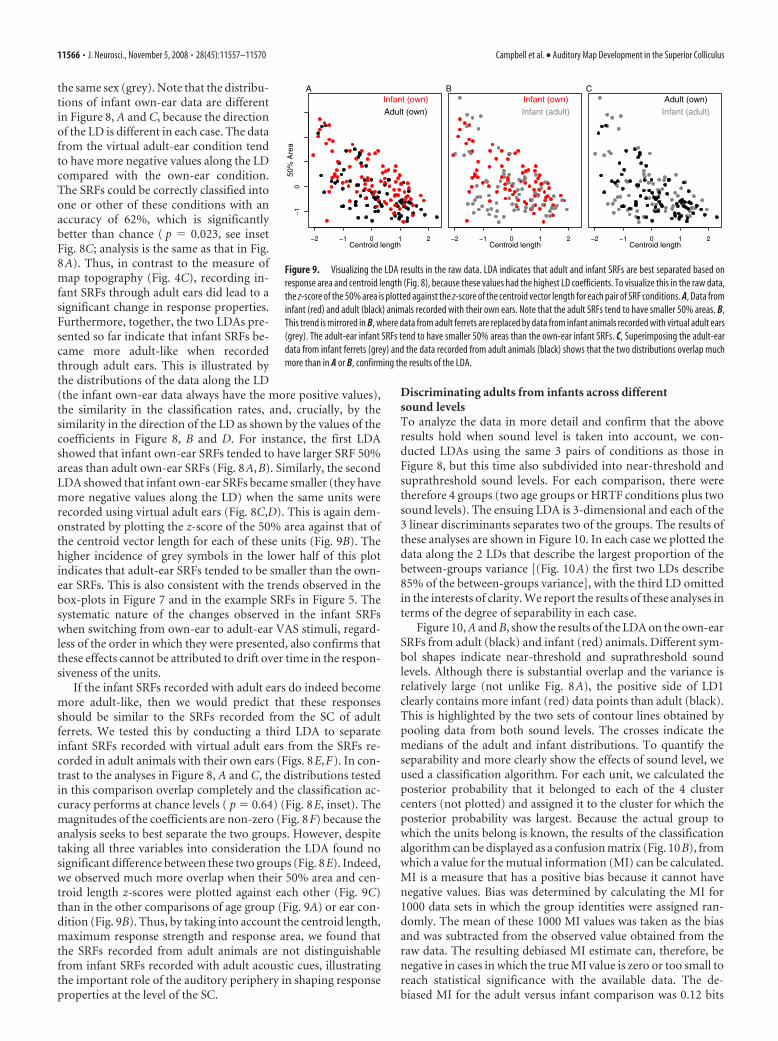
the same sex (grey). Note that the distribu-tions of infant own-ear data are differentin Figure 8, A and C, because the directionof the LD is different in each case. The datafrom the virtual adult-ear condition tendto have more negative values along the LDcompared with the own-ear condition.The SRFs could be correctly classified intoone or other of these conditions with anaccuracy of 62%, which is significantlybetter than chance ( p � 0.023, see insetFig. 8C; analysis is the same as that in Fig.8A). Thus, in contrast to the measure ofmap topography (Fig. 4C), recording in-fant SRFs through adult ears did lead to asignificant change in response properties.Furthermore, together, the two LDAs pre-sented so far indicate that infant SRFs be-came more adult-like when recordedthrough adult ears. This is illustrated bythe distributions of the data along the LD(the infant own-ear data always have the more positive values),the similarity in the classification rates, and, crucially, by thesimilarity in the direction of the LD as shown by the values of thecoefficients in Figure 8, B and D. For instance, the first LDAshowed that infant own-ear SRFs tended to have larger SRF 50%areas than adult own-ear SRFs (Fig. 8A,B). Similarly, the secondLDA showed that infant own-ear SRFs became smaller (they havemore negative values along the LD) when the same units wererecorded using virtual adult ears (Fig. 8C,D). This is again dem-onstrated by plotting the z-score of the 50% area against that ofthe centroid vector length for each of these units (Fig. 9B). Thehigher incidence of grey symbols in the lower half of this plotindicates that adult-ear SRFs tended to be smaller than the own-ear SRFs. This is also consistent with the trends observed in thebox-plots in Figure 7 and in the example SRFs in Figure 5. Thesystematic nature of the changes observed in the infant SRFswhen switching from own-ear to adult-ear VAS stimuli, regard-less of the order in which they were presented, also confirms thatthese effects cannot be attributed to drift over time in the respon-siveness of the units.
If the infant SRFs recorded with adult ears do indeed becomemore adult-like, then we would predict that these responsesshould be similar to the SRFs recorded from the SC of adultferrets. We tested this by conducting a third LDA to separateinfant SRFs recorded with virtual adult ears from the SRFs re-corded in adult animals with their own ears (Figs. 8E,F). In con-trast to the analyses in Figure 8, A and C, the distributions testedin this comparison overlap completely and the classification ac-curacy performs at chance levels ( p � 0.64) (Fig. 8E, inset). Themagnitudes of the coefficients are non-zero (Fig. 8F) because theanalysis seeks to best separate the two groups. However, despitetaking all three variables into consideration the LDA found nosignificant difference between these two groups (Fig. 8E). Indeed,we observed much more overlap when their 50% area and cen-troid length z-scores were plotted against each other (Fig. 9C)than in the other comparisons of age group (Fig. 9A) or ear con-dition (Fig. 9B). Thus, by taking into account the centroid length,maximum response strength and response area, we found thatthe SRFs recorded from adult animals are not distinguishablefrom infant SRFs recorded with adult acoustic cues, illustratingthe important role of the auditory periphery in shaping responseproperties at the level of the SC.
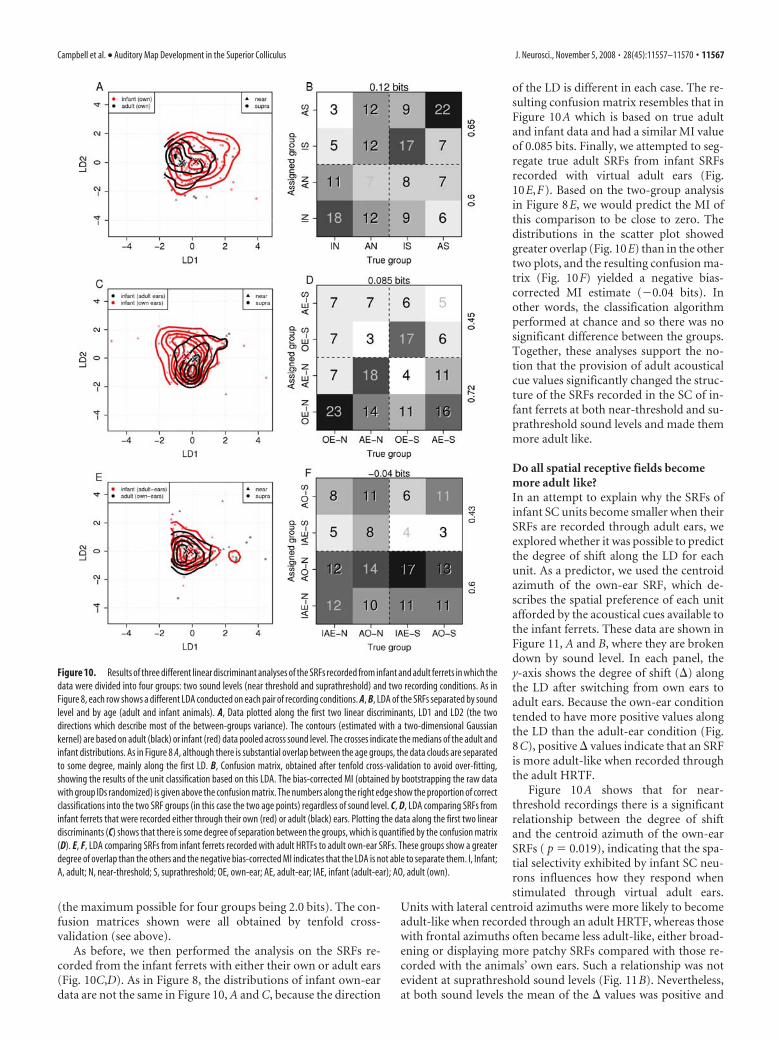
Discriminating adults from infants across differentsound levelsTo analyze the data in more detail and confirm that the aboveresults hold when sound level is taken into account, we con-ducted LDAs using the same 3 pairs of conditions as those inFigure 8, but this time also subdivided into near-threshold andsuprathreshold sound levels. For each comparison, there weretherefore 4 groups (two age groups or HRTF conditions plus twosound levels). The ensuing LDA is 3-dimensional and each of the3 linear discriminants separates two of the groups. The results ofthese analyses are shown in Figure 10. In each case we plotted thedata along the 2 LDs that describe the largest proportion of thebetween-groups variance [(Fig. 10A) the first two LDs describe85% of the between-groups variance], with the third LD omittedin the interests of clarity. We report the results of these analyses interms of the degree of separability in each case.
Figure 10, A and B, show the results of the LDA on the own-earSRFs from adult (black) and infant (red) animals. Different sym-bol shapes indicate near-threshold and suprathreshold soundlevels. Although there is substantial overlap and the variance isrelatively large (not unlike Fig. 8A), the positive side of LD1clearly contains more infant (red) data points than adult (black).This is highlighted by the two sets of contour lines obtained bypooling data from both sound levels. The crosses indicate themedians of the adult and infant distributions. To quantify theseparability and more clearly show the effects of sound level, weused a classification algorithm. For each unit, we calculated theposterior probability that it belonged to each of the 4 clustercenters (not plotted) and assigned it to the cluster for which theposterior probability was largest. Because the actual group towhich the units belong is known, the results of the classificationalgorithm can be displayed as a confusion matrix (Fig. 10B), fromwhich a value for the mutual information (MI) can be calculated.MI is a measure that has a positive bias because it cannot havenegative values. Bias was determined by calculating the MI for1000 data sets in which the group identities were assigned ran-domly. The mean of these 1000 MI values was taken as the biasand was subtracted from the observed value obtained from theraw data. The resulting debiased MI estimate can, therefore, benegative in cases in which the true MI value is zero or too small toreach statistical significance with the available data. The de-biased MI for the adult versus infant comparison was 0.12 bits
−2 −1 0 1 2
−1
0
Centroid length
50%
Are
a
AInfant (own)
Adult (own)
−2 −1 0 1 2Centroid length
BInfant (own)
Infant (adult)
−2 −1 0 1 2Centroid length
CAdult (own)
Infant (adult)
Figure 9. Visualizing the LDA results in the raw data. LDA indicates that adult and infant SRFs are best separated based onresponse area and centroid length (Fig. 8), because these values had the highest LD coefficients. To visualize this in the raw data,the z-score of the 50% area is plotted against the z-score of the centroid vector length for each pair of SRF conditions. A, Data frominfant (red) and adult (black) animals recorded with their own ears. Note that the adult SRFs tend to have smaller 50% areas. B,This trend is mirrored in B, where data from adult ferrets are replaced by data from infant animals recorded with virtual adult ears(grey). The adult-ear infant SRFs tend to have smaller 50% areas than the own-ear infant SRFs. C, Superimposing the adult-eardata from infant ferrets (grey) and the data recorded from adult animals (black) shows that the two distributions overlap muchmore than in A or B, confirming the results of the LDA.
11566 • J. Neurosci., November 5, 2008 • 28(45):11557–11570 Campbell et al. • Auditory Map Development in the Superior Colliculus
(the maximum possible for four groups being 2.0 bits). The con-fusion matrices shown were all obtained by tenfold cross-validation (see above).
As before, we then performed the analysis on the SRFs re-corded from the infant ferrets with either their own or adult ears(Fig. 10C,D). As in Figure 8, the distributions of infant own-eardata are not the same in Figure 10, A and C, because the direction
of the LD is different in each case. The re-sulting confusion matrix resembles that inFigure 10A which is based on true adultand infant data and had a similar MI valueof 0.085 bits. Finally, we attempted to seg-regate true adult SRFs from infant SRFsrecorded with virtual adult ears (Fig.10E,F). Based on the two-group analysisin Figure 8E, we would predict the MI ofthis comparison to be close to zero. Thedistributions in the scatter plot showedgreater overlap (Fig. 10E) than in the othertwo plots, and the resulting confusion ma-trix (Fig. 10F) yielded a negative bias-corrected MI estimate (�0.04 bits). Inother words, the classification algorithmperformed at chance and so there was nosignificant difference between the groups.Together, these analyses support the no-tion that the provision of adult acousticalcue values significantly changed the struc-ture of the SRFs recorded in the SC of in-fant ferrets at both near-threshold and su-prathreshold sound levels and made themmore adult like.
Do all spatial receptive fields becomemore adult like?In an attempt to explain why the SRFs ofinfant SC units become smaller when theirSRFs are recorded through adult ears, weexplored whether it was possible to predictthe degree of shift along the LD for eachunit. As a predictor, we used the centroidazimuth of the own-ear SRF, which de-scribes the spatial preference of each unitafforded by the acoustical cues available tothe infant ferrets. These data are shown inFigure 11, A and B, where they are brokendown by sound level. In each panel, they-axis shows the degree of shift () alongthe LD after switching from own ears toadult ears. Because the own-ear conditiontended to have more positive values alongthe LD than the adult-ear condition (Fig.8C), positive values indicate that an SRFis more adult-like when recorded throughthe adult HRTF.
Figure 10A shows that for near-threshold recordings there is a significantrelationship between the degree of shiftand the centroid azimuth of the own-earSRFs ( p � 0.019), indicating that the spa-tial selectivity exhibited by infant SC neu-rons influences how they respond whenstimulated through virtual adult ears.
Units with lateral centroid azimuths were more likely to becomeadult-like when recorded through an adult HRTF, whereas thosewith frontal azimuths often became less adult-like, either broad-ening or displaying more patchy SRFs compared with those re-corded with the animals’ own ears. Such a relationship was notevident at suprathreshold sound levels (Fig. 11B). Nevertheless,at both sound levels the mean of the values was positive and
Figure 10. Results of three different linear discriminant analyses of the SRFs recorded from infant and adult ferrets in which thedata were divided into four groups: two sound levels (near threshold and suprathreshold) and two recording conditions. As inFigure 8, each row shows a different LDA conducted on each pair of recording conditions. A, B, LDA of the SRFs separated by soundlevel and by age (adult and infant animals). A, Data plotted along the first two linear discriminants, LD1 and LD2 (the twodirections which describe most of the between-groups variance). The contours (estimated with a two-dimensional Gaussiankernel) are based on adult (black) or infant (red) data pooled across sound level. The crosses indicate the medians of the adult andinfant distributions. As in Figure 8 A, although there is substantial overlap between the age groups, the data clouds are separatedto some degree, mainly along the first LD. B, Confusion matrix, obtained after tenfold cross-validation to avoid over-fitting,showing the results of the unit classification based on this LDA. The bias-corrected MI (obtained by bootstrapping the raw datawith group IDs randomized) is given above the confusion matrix. The numbers along the right edge show the proportion of correctclassifications into the two SRF groups (in this case the two age points) regardless of sound level. C, D, LDA comparing SRFs frominfant ferrets that were recorded either through their own (red) or adult (black) ears. Plotting the data along the first two lineardiscriminants (C) shows that there is some degree of separation between the groups, which is quantified by the confusion matrix(D). E, F, LDA comparing SRFs from infant ferrets recorded with adult HRTFs to adult own-ear SRFs. These groups show a greaterdegree of overlap than the others and the negative bias-corrected MI indicates that the LDA is not able to separate them. I, Infant;A, adult; N, near-threshold; S, suprathreshold; OE, own-ear; AE, adult-ear; IAE, infant (adult-ear); AO, adult (own).
Campbell et al. • Auditory Map Development in the Superior Colliculus J. Neurosci., November 5, 2008 • 28(45):11557–11570 • 11567
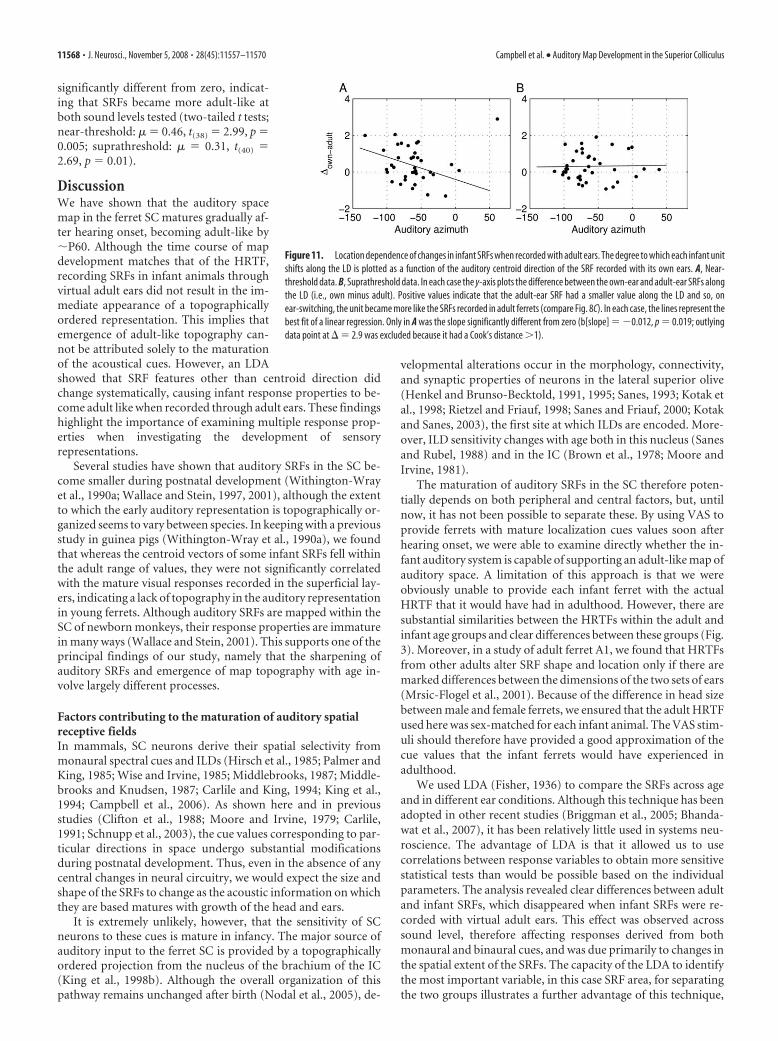
significantly different from zero, indicat-ing that SRFs became more adult-like atboth sound levels tested (two-tailed t tests;near-threshold: � � 0.46, t(38) � 2.99, p �0.005; suprathreshold: � � 0.31, t(40) �2.69, p � 0.01).
DiscussionWe have shown that the auditory spacemap in the ferret SC matures gradually af-ter hearing onset, becoming adult-like by�P60. Although the time course of mapdevelopment matches that of the HRTF,recording SRFs in infant animals throughvirtual adult ears did not result in the im-mediate appearance of a topographicallyordered representation. This implies thatemergence of adult-like topography can-not be attributed solely to the maturationof the acoustical cues. However, an LDAshowed that SRF features other than centroid direction didchange systematically, causing infant response properties to be-come adult like when recorded through adult ears. These findingshighlight the importance of examining multiple response prop-erties when investigating the development of sensoryrepresentations.
Several studies have shown that auditory SRFs in the SC be-come smaller during postnatal development (Withington-Wrayet al., 1990a; Wallace and Stein, 1997, 2001), although the extentto which the early auditory representation is topographically or-ganized seems to vary between species. In keeping with a previousstudy in guinea pigs (Withington-Wray et al., 1990a), we foundthat whereas the centroid vectors of some infant SRFs fell withinthe adult range of values, they were not significantly correlatedwith the mature visual responses recorded in the superficial lay-ers, indicating a lack of topography in the auditory representationin young ferrets. Although auditory SRFs are mapped within theSC of newborn monkeys, their response properties are immaturein many ways (Wallace and Stein, 2001). This supports one of theprincipal findings of our study, namely that the sharpening ofauditory SRFs and emergence of map topography with age in-volve largely different processes.
Factors contributing to the maturation of auditory spatialreceptive fieldsIn mammals, SC neurons derive their spatial selectivity frommonaural spectral cues and ILDs (Hirsch et al., 1985; Palmer andKing, 1985; Wise and Irvine, 1985; Middlebrooks, 1987; Middle-brooks and Knudsen, 1987; Carlile and King, 1994; King et al.,1994; Campbell et al., 2006). As shown here and in previousstudies (Clifton et al., 1988; Moore and Irvine, 1979; Carlile,1991; Schnupp et al., 2003), the cue values corresponding to par-ticular directions in space undergo substantial modificationsduring postnatal development. Thus, even in the absence of anycentral changes in neural circuitry, we would expect the size andshape of the SRFs to change as the acoustic information on whichthey are based matures with growth of the head and ears.
It is extremely unlikely, however, that the sensitivity of SCneurons to these cues is mature in infancy. The major source ofauditory input to the ferret SC is provided by a topographicallyordered projection from the nucleus of the brachium of the IC(King et al., 1998b). Although the overall organization of thispathway remains unchanged after birth (Nodal et al., 2005), de-
velopmental alterations occur in the morphology, connectivity,and synaptic properties of neurons in the lateral superior olive(Henkel and Brunso-Becktold, 1991, 1995; Sanes, 1993; Kotak etal., 1998; Rietzel and Friauf, 1998; Sanes and Friauf, 2000; Kotakand Sanes, 2003), the first site at which ILDs are encoded. More-over, ILD sensitivity changes with age both in this nucleus (Sanesand Rubel, 1988) and in the IC (Brown et al., 1978; Moore andIrvine, 1981).
The maturation of auditory SRFs in the SC therefore poten-tially depends on both peripheral and central factors, but, untilnow, it has not been possible to separate these. By using VAS toprovide ferrets with mature localization cues values soon afterhearing onset, we were able to examine directly whether the in-fant auditory system is capable of supporting an adult-like map ofauditory space. A limitation of this approach is that we wereobviously unable to provide each infant ferret with the actualHRTF that it would have had in adulthood. However, there aresubstantial similarities between the HRTFs within the adult andinfant age groups and clear differences between these groups (Fig.3). Moreover, in a study of adult ferret A1, we found that HRTFsfrom other adults alter SRF shape and location only if there aremarked differences between the dimensions of the two sets of ears(Mrsic-Flogel et al., 2001). Because of the difference in head sizebetween male and female ferrets, we ensured that the adult HRTFused here was sex-matched for each infant animal. The VAS stim-uli should therefore have provided a good approximation of thecue values that the infant ferrets would have experienced inadulthood.
We used LDA (Fisher, 1936) to compare the SRFs across ageand in different ear conditions. Although this technique has beenadopted in other recent studies (Briggman et al., 2005; Bhanda-wat et al., 2007), it has been relatively little used in systems neu-roscience. The advantage of LDA is that it allowed us to usecorrelations between response variables to obtain more sensitivestatistical tests than would be possible based on the individualparameters. The analysis revealed clear differences between adultand infant SRFs, which disappeared when infant SRFs were re-corded with virtual adult ears. This effect was observed acrosssound level, therefore affecting responses derived from bothmonaural and binaural cues, and was due primarily to changes inthe spatial extent of the SRFs. The capacity of the LDA to identifythe most important variable, in this case SRF area, for separatingthe two groups illustrates a further advantage of this technique,
Figure 11. Location dependence of changes in infant SRFs when recorded with adult ears. The degree to which each infant unitshifts along the LD is plotted as a function of the auditory centroid direction of the SRF recorded with its own ears. A, Near-threshold data. B, Suprathreshold data. In each case the y-axis plots the difference between the own-ear and adult-ear SRFs alongthe LD (i.e., own minus adult). Positive values indicate that the adult-ear SRF had a smaller value along the LD and so, onear-switching, the unit became more like the SRFs recorded in adult ferrets (compare Fig. 8C). In each case, the lines represent thebest fit of a linear regression. Only in A was the slope significantly different from zero (b[slope] � �0.012, p � 0.019; outlyingdata point at � 2.9 was excluded because it had a Cook’s distance �1).
11568 • J. Neurosci., November 5, 2008 • 28(45):11557–11570 Campbell et al. • Auditory Map Development in the Superior Colliculus
which would be hard to derive from visual inspection of theindividual parameter distributions.
These findings suggest that changes in the spatial extent of thereceptive fields during development can be attributed to matura-tion of the auditory periphery. A similar result has been found inA1, where mapping infant ferret SRFs with near-threshold stim-uli presented through virtual adult ears resulted in significantlysharper tuning than when the animals’ own ears were used(Mrsic-Flogel et al., 2003). Because the spatial selectivity of A1units at these sound levels is determined principally by the gainprovided by the contralateral external ear (Middlebrooks andPettigrew, 1981; Rajan et al., 1990; Schnupp et al., 2001), thissharpening can be explained by the fact that the HRTF becomesmore directional with age. However, SC neurons show level-independent azimuth selectivity that spans a much larger spatialregion, indicating that their SRFs cannot arise simply by integrat-ing acoustic power, which reaches a maximum just in front of theinteraural axis. Indeed, the presence of a near-threshold spacemap in monaurally deafened animals indicates that SC neuronsare differentially sensitive to direction-dependent spectral cues(Palmer and King, 1985; King et al., 1994).
In view of this, the immediate sharpening of the infant SRFsproduced by recording them with virtual adult ears is perhapssurprising. However, the changes seen depended on the units’centroid direction and therefore on the cue values to which theywere most sensitive. The near-threshold SRFs that became adult-like were those with lateral direction vectors (Fig. 11). There isrelatively little structure in the DTF in this region of space (Fig. 3,broad red regions in the vicinity of the interaural axis, �90°),suggesting that, as in A1, pinna directionality is predominantlyresponsible for shaping these SRFs. In contrast, a preference forother directions depends on sensitivity to specific spectral fea-tures, such as the high-frequency notch found near the anteriormidline, which, in cats, contributes to accurate sound localiza-tion in the frontal sound field (Huang and May, 1996). As ex-pected, the relatively few anterior SRFs found at near-thresholdlevels tended not to sharpen when recorded with adult ears andinstead behaved unpredictably.
Emergence of auditory topographyAlthough providing adult ears made many of the infant SRFsmore adult like, this did not improve the topographic order in theauditory representation. This suggests that the neural circuitryunderlying the map of auditory space is immature just after hear-ing onset and that the gradual emergence of topography duringthe second postnatal month cannot be attributed solely togrowth-related changes in the localization cue values. The devel-oping auditory representation is shaped by experience so thattopographically aligned maps of auditory and visual spaceemerge even when highly abnormal information is provided byone or other of these modalities (King et al., 1988; Knudsen andBrainard, 1991; Gold and Knudsen, 2000). Visual activity in thesuperficial SC layers appears to guide the developing auditoryresponses (King et al., 1998a), although experience-dependentrefinement of auditory brainstem circuits is also likely to beinvolved.
Previous studies suggest that experience is also involved in thedevelopmental sharpening of auditory SRFs in the SC. Rearinganimals in omni-directional noise (Withington-Wray et al.,1990c) or in the dark (Withington-Wray et al., 1990b; Wallace etal., 2004) results in large SRFs that resemble those seen in infancy.But our results indicate that the reduction in SRF size over devel-opment primarily reflects the growth of the head and ears. Con-
sequently, the abnormally large SRFs observed in adult animalsthat have been deprived of experience during infancy are morelikely to result from a reorganization of the neural circuits ratherthan maintenance of the immature state.
ReferencesBhandawat V, Olsen SR, Gouwens NW, Schlief ML, Wilson RI (2007) Sen-
sory processing in the Drosophila antennal lobe increases reliability andseparability of ensemble odor representations. Nat Neurosci10:1474 –1482.
Briggman KL, Abarbanel HD, Kristan WB Jr (2005) Optical imaging of neu-ronal populations during decision-making. Science 307:896 –901.
Brown PE, Grinnel AD, Harrison JB (1978) The development of hearing inthe pallid bat, Antrozous pallidus. J Comp Physiol 126:169 –182.
Campbell RA, Doubell TP, Nodal FR, Schnupp JW, King AJ (2006) Inter-aural timing cues do not contribute to the map of space in the ferretsuperior colliculus: a virtual acoustic space study. J Neurophysiol95:242–254.
Carlile S (1991) The auditory periphery of the ferret: postnatal developmentof acoustic properties. Hear Res 51:265–277.
Carlile S, King AJ (1994) Monaural and binaural spectrum level cues in theferret: acoustics and the neural representation of auditory space. J Neu-rophysiol 71:785– 801.
Chung SH, Jones LC, Hammond BJ, King MC, Evans RJ, Knott C, KeatingMJ, Anson M (1987) Signal processing technique to extract neuronalactivity from noise. J Neurosci Methods 19:125–139.
Clifton RK, Gwiazda J, Bauer JA, Clarkson MG, Held RM (1988) Growth inhead size during infancy: implications for sound localization. Dev Psychol24:477– 483.
Fisher RA (1936) The use of multiple measurements in taxonomic prob-lems. Ann Eugenics 7:179 –188.
Gold JI, Knudsen EI (2000) A site of auditory experience-dependent plas-ticity in the neural representation of auditory space in the barn owl’sinferior colliculus. J Neurosci 20:3469 –3486.
Grothe B (2003) New roles for synaptic inhibition in sound localization. NatRev Neurosci 4:540 –550.
Henkel CK, Brunso-Bechtold JK (1991) Dendritic morphology and devel-opment in the ferret lateral superior olivary nucleus. J Comp Neurol313:259 –272.
Henkel CK, Brunso-Bechtold JK (1995) Development of glycinergic cellsand puncta in nuclei of the superior olivary complex of the postnatalferret. J Comp Neurol 354:470 – 480.
Hirsch JA, Chan JC, Yin TCT (1985) Responses of neurons in the cat’s su-perior colliculus to acoustic stimuli. I. Monaural and binaural responseproperties. J Neurophysiol 53:726 –745.
Huang AY, May BJ (1996) Spectral cues for sound localization in cats: ef-fects of frequency domain on minimum audible angles in the median andhorizontal planes. J Acoust Soc Am 100:2341–2348.
King AJ (1999) Sensory experience and the formation of a computationalmap of auditory space in the brain. Bioessays 21:900 –911.
King AJ, Carlile S (1994) Responses of neurons in the ferret superior collicu-lus to the spatial location of tonal stimuli. Hear Res 81:137–149.
King AJ, Hutchings ME, Moore DR, Blakemore C (1988) Developmentalplasticity in the visual and auditory representations in the mammaliansuperior colliculus. Nature 332:73–76.
King AJ, Moore DR, Hutchings ME (1994) Topographic representation ofauditory space in the superior colliculus of adult ferrets after monauraldeafening in infancy. J Neurophysiol 71:182–194.
King AJ, Schnupp JWH, Carlile S, Smith AL, Thompson ID (1996) Thedevelopment of topographically-aligned maps of visual and auditoryspace in the superior colliculus. Prog Brain Res 112:335–350.
King AJ, Schnupp JWH, Thompson ID (1998a) Signals from the superficiallayers of the superior colliculus enable the development of the auditoryspace map in the deeper layers. J Neurosci 18:9394 –9408.
King AJ, Jiang ZD, Moore DR (1998b) Auditory brainstem projections tothe ferret superior colliculus: anatomical contribution to the neural cod-ing of sound azimuth. J Comp Neurol 390:342–365.
King AJ, Schnupp JWH, Doubell TP (2001) The shape of ears to come:dynamic coding of auditory space. Trends Cogn Sci 5:261–270.
Knudsen EI (2002) Instructed learning in the auditory localization pathwayof the barn owl. Nature 417:322–328.
Campbell et al. • Auditory Map Development in the Superior Colliculus J. Neurosci., November 5, 2008 • 28(45):11557–11570 • 11569
Knudsen EI, Brainard MS (1991) Visual instruction of the neural map ofauditory space in the developing optic tectum. Science 253:85– 87.
Kotak VC, Sanes DH (2003) Gain adjustment of inhibitory synapses in theauditory system. Biol Cybern 89:363–370.
Kotak VC, Korada S, Schwartz IR, Sanes DH (1998) A developmental shiftfrom GABAergic to glycinergic transmission in the central auditory sys-tem. J Neurosci 18:4646 – 4655.
Kubke MF, Carr CE (2005) Development of the auditory centers responsi-ble for sound localization. In: Sound source localization (Popper AN, FayRR, eds), pp 179 –237. New York: Springer.
Kulkarni A, Isabelle SK, Colburn HS (1999) Sensitivity of human subjects tohead-related transfer-function phase spectra. J Acoust Soc Am105:2821–2840.
Middlebrooks JC (1987) Binaural mechanisms of spatial tuning in the cat’ssuperior colliculus distinguished using monaural occlusion. J Neuro-physiol 57:688 –701.
Middlebrooks JC, Knudsen EI (1987) Changes in external ear positionmodify the spatial tuning of auditory units in the cat’s superior colliculus.J Neurophysiol 57:672– 687.
Middlebrooks JC, Pettigrew JD (1981) Functional classes of neurons in pri-mary auditory cortex of the cat distinguished by sensitivity to sound lo-cation. J Neurosci 1:107–120.
Moore DR, Hine JE (1992) Rapid development of the auditory brainstemresponse threshold in individual ferrets. Dev Brain Res 66:229 –235.
Moore DR, Irvine DRF (1979) A developmental study of the sound pressuretransformation by the head of the cat. Acta Otolaryngol 87:434 – 440.
Moore DR, Irvine DRF (1981) Development of responses to acoustic inter-aural intensity differences in the cat inferior colliculus. Exp Brain Res41:301–309.
Mrsic-Flogel TD, King AJ, Jenison RL, Schnupp JWH (2001) Listeningthrough different ears alters spatial response fields in ferret primary au-ditory cortex. J Neurophysiol 86:1043–1046.
Mrsic-Flogel TD, Schnupp JWH, King AJ (2003) Acoustic factors governdevelopmental sharpening of spatial tuning in the auditory cortex. NatureNeurosci 6:981–988.
Nodal FR, Doubell TP, Jiang ZD, Thompson ID, King AJ (2005) Develop-ment of the projection from the nucleus of the brachium of the inferiorcolliculus to the superior colliculus in the ferret. J Comp Neurol485:202–217.
Palmer AR, King AJ (1985) A monaural space map in the guinea-pig supe-rior colliculus. Hear Res 17:267–280.
Pinheiro JC, Bates DM (2000) Mixed-effects models in S and S-plus. NewYork: Springer.
Rajan R, Aitkin LM, Irvine DR, McKay J (1990) Azimuthal sensitivity of
neurons in primary auditory cortex of cats. I. Types of sensitivity and theeffects of variations in stimulus parameters. J Neurophysiol 64:872– 887.
Rietzel HJ, Friauf E (1998) Neuron types in the rat lateral superior olive anddevelopmental changes in the complexity of their dendritic arbors.J Comp Neurol 390:20 – 40.
Sanes DH (1993) The development of synaptic function and integration inthe central auditory system. J Neurosci 13:2627–2637.
Sanes DH, Friauf E (2000) Development and influence of inhibition in thelateral superior olivary nucleus. Hear Res 147:46 –58.
Sanes DH, Rubel EW (1988) The ontogeny of inhibition and excitation inthe gerbil lateral superior olive. J Neurosci 8:682–700.
Schnupp JWH, Mrsic-Flogel TD, King AJ (2001) Linear processing of spa-tial cues in primary auditory cortex. Nature 414:200 –204.
Schnupp JWH, Booth J, King AJ (2003) Modeling individual differences inferret external ear transfer functions. J Acoust Soc Am 113:2021–2030.
Venables WN, Ripley BD (1999) Modern applied statistics with S. NewYork: Springer.
Wallace MT, Stein BE (1997) Development of multisensory neurons andmultisensory integration in cat superior colliculus. J Neurosci17:2429 –2444.
Wallace MT, Stein BE (2001) Sensory and multisensory responses in thenewborn monkey superior colliculus. J Neurosci 21:8886 – 8894.
Wallace MT, Perrault TJ Jr, Hairston WD, Stein BE (2004) Visual experi-ence is necessary for the development of multisensory integration. J Neu-rosci 24:9580 –9584.
Wightman FL, Kistler DJ (1989a) Headphone simulation of free-field lis-tening. I: Stimulus synthesis. J Acoust Soc Am 85:858 – 867.
Wightman FL, Kistler DJ (1989b) Headphone simulation of free-field lis-tening. II: Psychophysical validation. J Acoust Soc Am 85:868 – 878.
Wise LZ, Irvine DRF (1985) Topographic organization of interaural inten-sity difference sensitivity in deep layers of cat superior colliculus: impli-cations for auditory spatial representation. J Neurophysiol 54:185–211.
Withington-Wray DJ, Binns KE, Keating MJ (1990a) The developmentalemergence of a map of auditory space in the superior colliculus of theguinea pig. Dev Brain Res 51:225–236.
Withington-Wray DJ, Binns KE, Keating MJ (1990b) The maturation of thesuperior collicular map of auditory space in the guinea pig is disrupted bydevelopmental visual deprivation. Eur J Neurosci 2:682– 692.
Withington-Wray DJ, Binns KE, Dhanjal SS, Brickley SG, Keating MJ(1990c) The maturation of the superior collicular map of auditory spacein the guinea pig is disrupted by developmental auditory deprivation. EurJ Neurosci 2:693–703.
Zhou B, Green DM, Middlebrooks JC (1992) Characterization of externalear impulse responses using Golay codes. J Acoust Soc Am 92:1169 –1171.
11570 • J. Neurosci., November 5, 2008 • 28(45):11557–11570 Campbell et al. • Auditory Map Development in the Superior Colliculus