virginia’s licensed pharmacist workforce: 2011€¦ · virginia’s licensed pharmacist...
TRANSCRIPT

Virginia’s Licensed Pharmacist Workforce: 2011
Healthcare Workforce Data Center
June 2012
Virginia Department of Health Professions Healthcare Workforce Data Center
Perimeter Center 9960 Mayland Drive, Suite 300
Richmond, Virginia 23233 804‐367‐2115, 804‐527‐4471(fax)
E‐mail: [email protected]
Follow us on Tumblr: www.vahwdc.tumblr.com

Healthcare Workforce Data Center Advisory Council Jeffrey S. Cribbs, Sr., Chair President & CEO Richmond Memorial Health Foundation Christopher Bailey Senior Vice President, Virginia Hospital and Healthcare Association The Honorable George Barker Senate of Virginia Peter Blake Vice Chancellor for Workforce Services Virginia Community College System Arthur Garson, Jr., MD, MPH Vice President and Provost University of Virginia JoAnne Kirk Henry, EdD, RNC Emerita Faculty Virginia Commonwealth University School of Nursing Michael Jurgensen Senior VP, Health Policy & Planning Medical Society of Virginia Timothy O. Kestner, MLA Economist, Virginia Employment Commission Daniel G. LeBlanc Senior Advisor to the Governor for Workforce William L. Lukhard Executive Council, AARP P. J. Maddox Professor and Chair, Health Administration and Policy George Mason University Tod Massa Director of Policy Research and Data Warehousing State Council of Higher Education in Virginia Susan Motley, CEO Virginia Nurses Association The Honorable John O’Bannon, III Virginia House of Delegates Sandra Whitley Ryals Director, Virginia Department of Health Professions David C. Sarrett, DMD, MS Program Director, Area Health Education Centers (AHEC) Associate Vice President for Health Sciences Virginia Commonwealth University The Honorable Marilyn Tavenner Secretary of Health and Human Resources Kathy H. Wibberly, Ph.D. Director, Division of Primary Care and Rural Health
Office of Minority Health and Public Health Policy Virginia Department of Health

Pharmacy Workforce Advisory Committee
J. E. Hill Hopper NeighborCare Richmond Pharmacist in Charge
Caroline D. Juran Virginia Board of Pharmacy
Executive Director Rusty Maney Virginia Chain Drug Store Association Pharmacy Supervisor, Walgreens Tim Musselman Virginia Pharmacists Association Executive Director Elizabeth Scott “Scotti” Russell National Assoc. of Boards of Pharmacy Government Affairs Manager Rebecca Snead National Alliance of State Pharmacy Assoc. Executive Vice President & CEO Bob Stoneburner, RPh, MBA SBHR- Pharmacy-Administrative Director MMC Pharmacy-Site Manager Victor Yanchik, PhD VCU School of Pharmacy Dean Brandon Yi Pharmacy Supervisor CVS Caremark
Virginia Department of Health Professions
Dianne L. Reynolds-Cane, M.D.
Director
Arne W. Owens Chief Deputy Director
HWDC Staff:
Dr. Elizabeth Carter, Ph.D. Executive Director
Justin Crow, MPA Research Analyst
Laura Jackson Operations Manager
Christopher Coyle Research Assistant

Contents
HEALTHCARE WORKFORCE DATA CENTER ..................................................................................................... 1
Overview .................................................................................................................................................................................... 1 HWDC Survey Timetable ................................................................................................................................................................ 1
The 2011 Pharmacist Workforce Survey ..................................................................................................................................... 2 Methodology .................................................................................................................................................................................. 2 Response Rates .............................................................................................................................................................................. 2
Virginia’s Licensed Pharmacists .................................................................................................................................................. 3 Virginia’s Pharmacist Workforce .................................................................................................................................................... 3 Weighted Estimates ....................................................................................................................................................................... 4
VIRGINIA’S PHARMACIST WORKFORCE ............................................................................................................ 5
Demographics ............................................................................................................................................................................. 5 Age & Gender ................................................................................................................................................................................. 5 Diversity .......................................................................................................................................................................................... 5 High School Location ...................................................................................................................................................................... 6 Post-Secondary Degree Location ................................................................................................................................................... 6 Pharmacy Education ....................................................................................................................................................................... 7 Post-graduate Credentials .............................................................................................................................................................. 7 Post-Graduate Residency, Year 1 ................................................................................................................................................... 8 Post-Graduate Residency, Year 2 ................................................................................................................................................... 8 Board Certifications ........................................................................................................................................................................ 9 Other Certifications ........................................................................................................................................................................ 9 Professional Tasks .......................................................................................................................................................................... 9
Employment characteristics...................................................................................................................................................... 10 Number of Work Locations .......................................................................................................................................................... 10 Distribution of Work Locations .................................................................................................................................................... 10 Compensation .............................................................................................................................................................................. 11 Benefits......................................................................................................................................................................................... 11 Educational Debt .......................................................................................................................................................................... 12 Turnover ....................................................................................................................................................................................... 13 Establishment Type ...................................................................................................................................................................... 13 Work Roles ................................................................................................................................................................................... 14
Work Hours .............................................................................................................................................................................. 15 Total Hours ................................................................................................................................................................................... 16 Work Hours and Age .................................................................................................................................................................... 16 Work Hours and Gender ............................................................................................................................................................... 17 Full Time Equivalency Units (FTEs) ............................................................................................................................................... 17 Work Hours and Type of Establishment ....................................................................................................................................... 18 Work Hours by Location ............................................................................................................................................................... 19
Future Plans ............................................................................................................................................................................. 20 Expected Retirement Age ............................................................................................................................................................. 20 Retirement Plans .......................................................................................................................................................................... 21 Future Plans .................................................................................................................................................................................. 21 Plans to Enter Virginia’s Pharmacist Workforce ........................................................................................................................... 22 Reasons for Not Working ............................................................................................................................................................. 22

Maps ........................................................................................................................................................................................ 24 Council on Virginia’s Future Regions ............................................................................................................................................ 26 Health Services Areas ................................................................................................................................................................... 27 Workforce Investment Area ......................................................................................................................................................... 28 Local Health District ..................................................................................................................................................................... 29 Heat Maps .................................................................................................................................................................................... 30
Appendices ............................................................................................................................................................................... 31 Appendix A: Weights ................................................................................................................................................................... 31 Appendix B: Hours Worked Imputation ...................................................................................................................................... 32 Appendix C: The 2011 Pharmacist Workforce Survey ................................................................................................................. 35 Appendix D: The 2012 Pharmacist Workforce Survey ................................................................................................................. 46

1
Healthcare Workforce Data Center
Overview
The Virginia Department of Health Profession’s Healthcare Workforce Data Center (HWDC) collects and
disseminates workforce information on Virginia’s licensed healthcare practitioners. The 2007 report of the Governor’s Health Reform Commission recommended that the HWDC be established within the Department of Health Professions (DHP) due to its existing repository of licensure information for over 80 professions. In the spring of 2008, HWDC was launched with Workforce Investment Act grant funding and continues with support from the Department and shared grant funding from the U.S. Health Resources Services Administration on behalf of the new Virginia Health Workforce Development Authority and other partner organizations.
With significant input and collaborative effort from key stakeholders and experts, HWDC has developed initial supply
and demand forecasts for physicians and nurses, published results from existing physician and nursing workforce surveys originally developed by the Board of Medicine and Board of Nursing, updated and launched revised surveys as well as developed new workforce surveys as listed in the “Current Collection” in the HWDC Survey Timetable below. Beginning in winter 2012, HWDC began development of audiology & speech language pathology surveys and long term care administrator surveys which are poised for rollout later this fiscal year.
HWDC Survey Timetable
In Current Collection: Medical Doctors Doctors of Osteopathy Registered Nurses and Licensed Practical Nurses Certified Nurse Aides Physician Assistants Nurse Practitioners Licensed Professional Counselors Clinical Psychologists Licensed Clinical Social Workers Pharmacists Pharmacy Technicians Dentists Dental Hygienists
Projected 2012 Rollout: Speech-Language Pathologists Audiologists Long-Term Care Administrators
Proposed: Physical Therapists Physical Therapy Assistants Occupational Therapists Occupational Therapy Assistants
2
The 2011 Pharmacist Workforce Survey
Methodology
The Pharmacist Workforce Survey is administered to Licensed Pharmacists through the Department of Health
Professions online renewal process. The Board of Pharmacy has an annual renewal cycle, with licenses expiring Dec. 31 of each year. Currently, HWDC surveys are only available to those renewing their licenses online. New Virginia licensees and those returning from a long absence did not have access to the online survey.1 Additionally, paper renewals were available. The survey was not offered to students or new applicants. This survey was conducted during the 2011 renewal period ending December 31, 2011. The survey text is available in Appendix C.
Response Rates
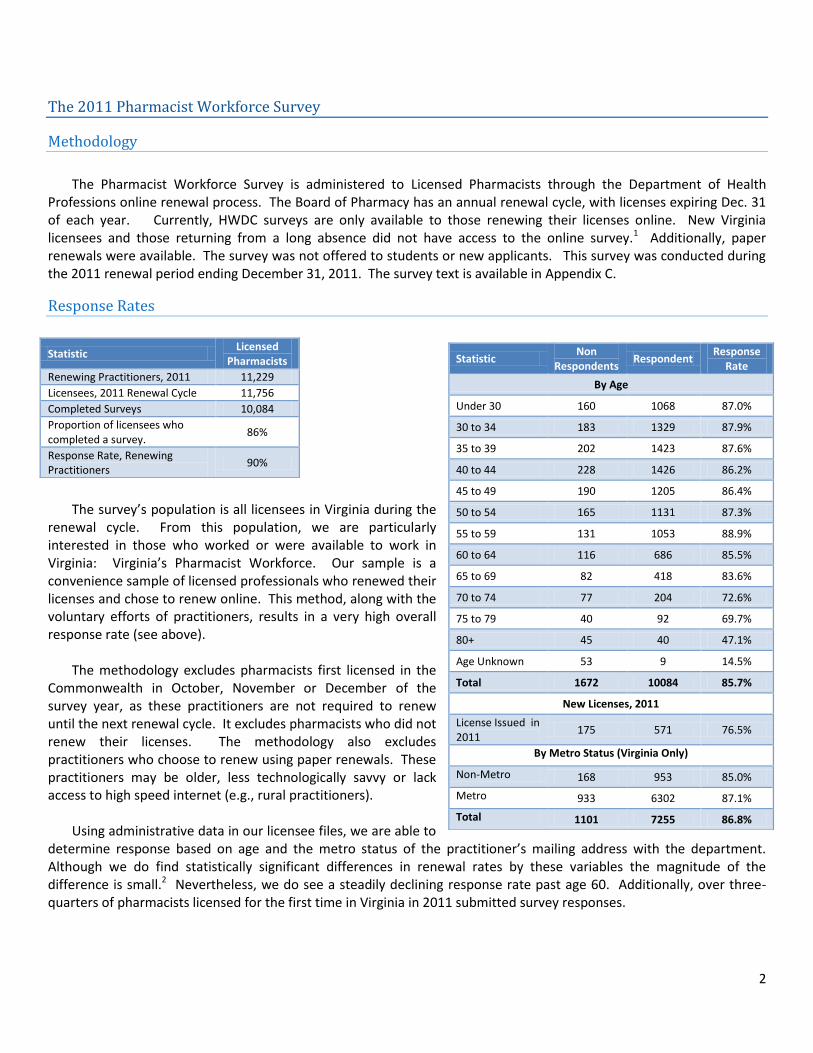
The survey’s population is all licensees in Virginia during the
renewal cycle. From this population, we are particularly interested in those who worked or were available to work in Virginia: Virginia’s Pharmacist Workforce. Our sample is a convenience sample of licensed professionals who renewed their licenses and chose to renew online. This method, along with the voluntary efforts of practitioners, results in a very high overall response rate (see above).
The methodology excludes pharmacists first licensed in the
Commonwealth in October, November or December of the survey year, as these practitioners are not required to renew until the next renewal cycle. It excludes pharmacists who did not renew their licenses. The methodology also excludes practitioners who choose to renew using paper renewals. These practitioners may be older, less technologically savvy or lack access to high speed internet (e.g., rural practitioners).
Using administrative data in our licensee files, we are able to
determine response based on age and the metro status of the practitioner’s mailing address with the department. Although we do find statistically significant differences in renewal rates by these variables the magnitude of the difference is small.2 Nevertheless, we do see a steadily declining response rate past age 60. Additionally, over three-quarters of pharmacists licensed for the first time in Virginia in 2011 submitted survey responses.
Statistic Licensed
Pharmacists
Renewing Practitioners, 2011 11,229
Licensees, 2011 Renewal Cycle 11,756
Completed Surveys 10,084
Proportion of licensees who completed a survey.
86%
Response Rate, Renewing Practitioners
90%
Statistic Non
Respondents Respondent
Response Rate
By Age
Under 30 160 1068 87.0%
30 to 34 183 1329 87.9%
35 to 39 202 1423 87.6%
40 to 44 228 1426 86.2%
45 to 49 190 1205 86.4%
50 to 54 165 1131 87.3%
55 to 59 131 1053 88.9%
60 to 64 116 686 85.5%
65 to 69 82 418 83.6%
70 to 74 77 204 72.6%
75 to 79 40 92 69.7%
80+ 45 40 47.1%
Age Unknown 53 9 14.5%
Total 1672 10084 85.7%
New Licenses, 2011
License Issued in 2011
175 571 76.5%
By Metro Status (Virginia Only)
Non-Metro 168 953 85.0%
Metro 933 6302 87.1%
Total 1101 7255 86.8%
3
Virginia’s Licensed Pharmacists
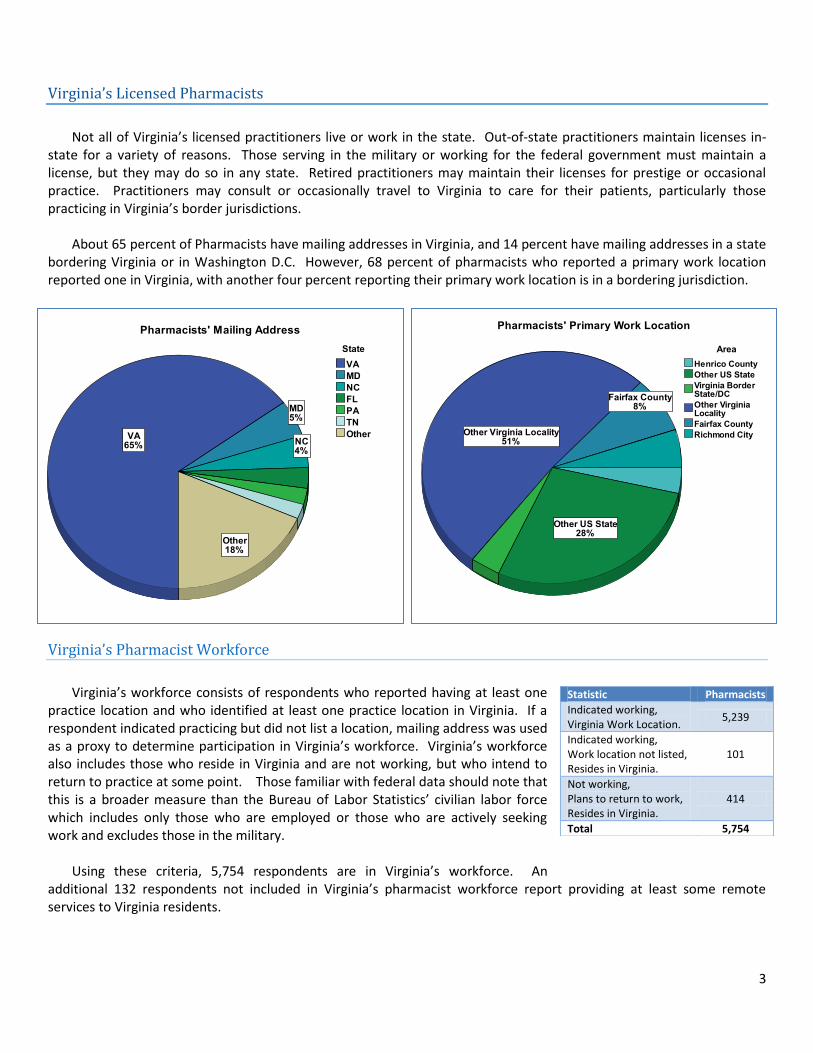
Not all of Virginia’s licensed practitioners live or work in the state. Out-of-state practitioners maintain licenses in-
state for a variety of reasons. Those serving in the military or working for the federal government must maintain a license, but they may do so in any state. Retired practitioners may maintain their licenses for prestige or occasional practice. Practitioners may consult or occasionally travel to Virginia to care for their patients, particularly those practicing in Virginia’s border jurisdictions.
About 65 percent of Pharmacists have mailing addresses in Virginia, and 14 percent have mailing addresses in a state
bordering Virginia or in Washington D.C. However, 68 percent of pharmacists who reported a primary work location reported one in Virginia, with another four percent reporting their primary work location is in a bordering jurisdiction.
Virginia’s Pharmacist Workforce
Virginia’s workforce consists of respondents who reported having at least one
practice location and who identified at least one practice location in Virginia. If a respondent indicated practicing but did not list a location, mailing address was used as a proxy to determine participation in Virginia’s workforce. Virginia’s workforce also includes those who reside in Virginia and are not working, but who intend to return to practice at some point. Those familiar with federal data should note that this is a broader measure than the Bureau of Labor Statistics’ civilian labor force which includes only those who are employed or those who are actively seeking work and excludes those in the military.
Using these criteria, 5,754 respondents are in Virginia’s workforce. An
additional 132 respondents not included in Virginia’s pharmacist workforce report providing at least some remote services to Virginia residents.
Statistic Pharmacists
Indicated working, Virginia Work Location.
5,239
Indicated working, Work location not listed, Resides in Virginia.
101
Not working, Plans to return to work, Resides in Virginia.
414
Total 5,754

4
Weighted Estimates
To account for differences in response rates by key characteristics this report uses weighted estimates. The HWDC
assigns a weight to each response based on the overall response rate of pharmacists based on two characteristics: 1) The age of the respondent, in five year categories, and, 2) The rural status of the respondent’s mailing address.
For the latter, the HWDC uses a measure of rurality developed by the US Department of Agriculture known as the Rural-Urban Continuum Code. More information on these codes is available on the USDA website here: http://www.ers.usda.gov/Briefing/Rurality/RuralUrbCon/. Response rates may vary on other important characteristics such as race/ethnicity, gender, specialty or worksite characteristics. However, the HWDC does not have population level data on these characteristics to generate response rates and weights. For information on weights, see Appendix A. Due to the rounding of weighted data in HWDC’s statistical software, weighting may result in some minor anomalies in tables and other presented data (e.g., data may not add totals in tables).
Using these weighted estimates, the HWDC estimates there are 6,605 pharmacists in Virginia’s pharmacist
workforce. The remainder of this document presents weighted estimates of Virginia’s pharmacist workforce.

5
Virginia’s Pharmacist Workforce
Demographics
Age & Gender
The median age of Virginia’s pharmacist
workforce, as of December 31, 2011, was 43. For both the nation as a whole and the Commonwealth of Virginia, the median age of the civilian labor force was 42 years of age in 2010.3 Almost 30 percent were age 35 or younger, and 42 percent were under age 40. However, a third were over age 50. The survey excludes some new applicants and students, so the pharmacist workforce was likely somewhat younger than the survey results indicate.
Just over 60 percent of Virginia’s pharmacists
were female, compared to about 51 percent of Virginia’s population. Additionally, men appear to be making up a declining share of the pharmacist workforce. Among pharmacists under age 40, only 27 percent were male.
Diversity4
Non-Hispanic whites accounted for almost
three quarters of Virginia’s pharmacists, compared to 65 percent of Virginia’s population, while Asians accounted for thirteen percent of Virginia’s pharmacists and six percent of the population. Non-Hispanic blacks and Hispanics are underrepresented compared to Virginia’s population. Underrepresented groups are not making significant gains in younger cohorts. Among pharmacists under age 40, Hispanics, non-Hispanic blacks and persons identifying two or more races made some gains in representation. However the largest gains in representation were made by Asians.
Race/ Ethnicity
2010 Virginia Population
Virginia Pharmacists
Virginia Pharmacists
under 40
Weighted Estimate
% Weighted Estimate
% Weighted Estimate
%
Hispanic of any race
631,825 8% 71 1% 39 2%
White, non-Hispanic
5,186,450 65% 4262 74% 1393 63%
Black, non-Hispanic
1,523,704 19% 527 9% 249 11%
American Indian or Alaskan
Native 20,679 0% 9 0% 2 0%
Asian 436,298 6% 762 13% 479 22%
Native Hawaiian or Pacific Islander
5,061 0% 16 0% 8 0%
Other Race 15,338 0% 23 0% 9 0%
Two or more races
181,669 2% 77 1% 42 2%
Percentages many not add to 100% due to rounding. 371 persons selected “prefer not to respond”, including 146 persons under age 40.
6
High School Location
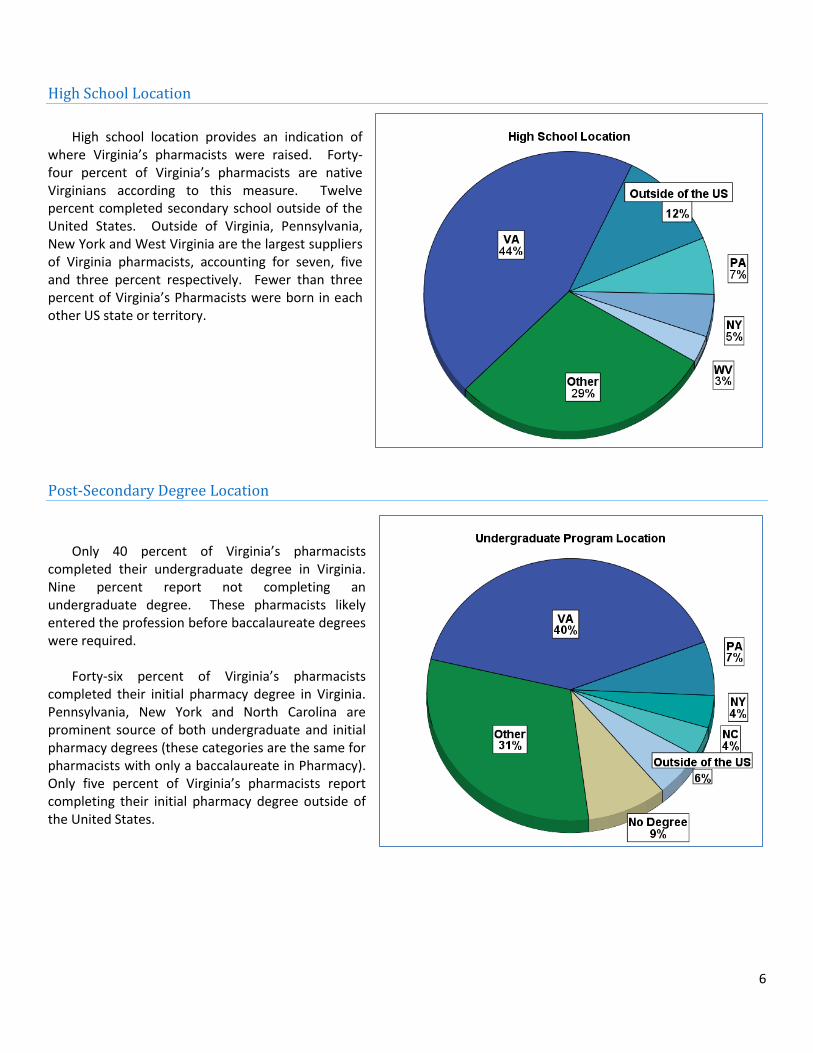
High school location provides an indication of
where Virginia’s pharmacists were raised. Forty-four percent of Virginia’s pharmacists are native Virginians according to this measure. Twelve percent completed secondary school outside of the United States. Outside of Virginia, Pennsylvania, New York and West Virginia are the largest suppliers of Virginia pharmacists, accounting for seven, five and three percent respectively. Fewer than three percent of Virginia’s Pharmacists were born in each other US state or territory.
Post-Secondary Degree Location
Only 40 percent of Virginia’s pharmacists completed their undergraduate degree in Virginia. Nine percent report not completing an undergraduate degree. These pharmacists likely entered the profession before baccalaureate degrees were required.
Forty-six percent of Virginia’s pharmacists
completed their initial pharmacy degree in Virginia. Pennsylvania, New York and North Carolina are prominent source of both undergraduate and initial pharmacy degrees (these categories are the same for pharmacists with only a baccalaureate in Pharmacy). Only five percent of Virginia’s pharmacists report completing their initial pharmacy degree outside of the United States.

7
Pharmacy Education
Forty-six percent of pharmacists had obtained a
PharmD, including six percent who also obtained a baccalaureate in pharmacy. The remaining 53 percent obtained a baccalaureate in Pharmacy.
Post-graduate Credentials
In addition to their pharmacy degrees, 2,006
pharmacists obtained post-graduate credentials. This includes 851 who obtained post-graduate certifications, 850 who completed post-graduate residencies and 539 with post-graduate masters. 283 Virginia pharmacists have two or more post-graduate credentials.
8
Post-Graduate Residency, Year 1
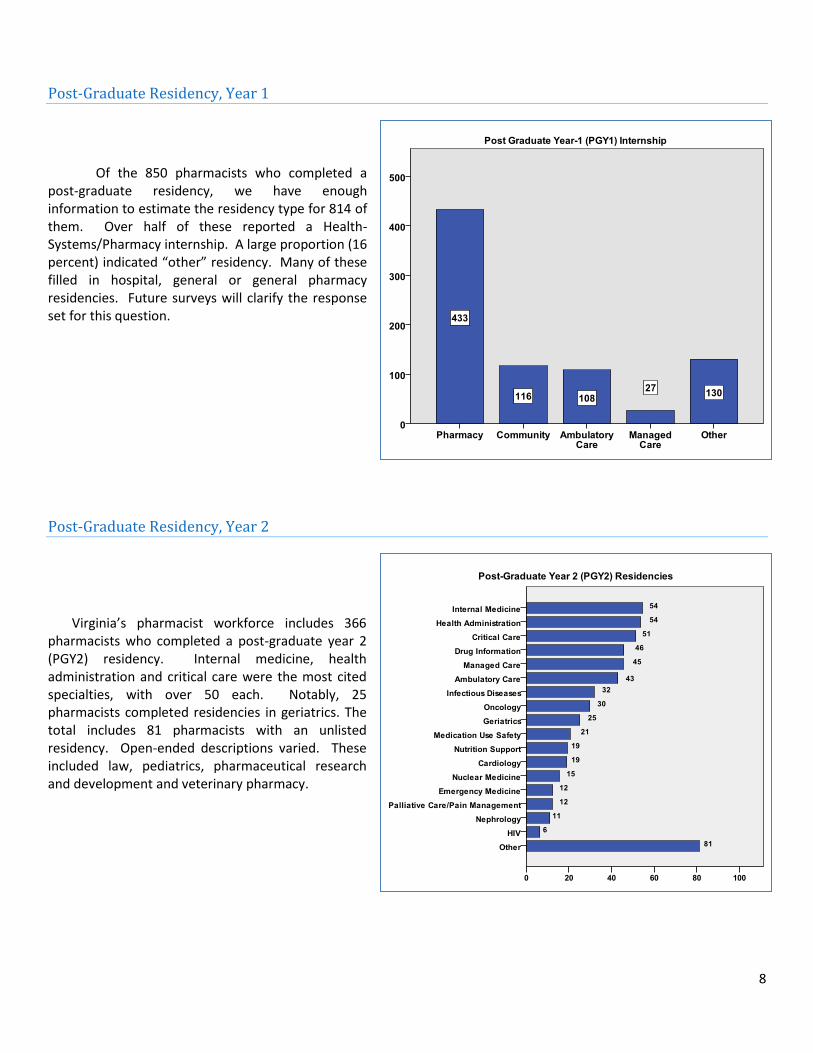
Of the 850 pharmacists who completed a
post-graduate residency, we have enough information to estimate the residency type for 814 of them. Over half of these reported a Health-Systems/Pharmacy internship. A large proportion (16 percent) indicated “other” residency. Many of these filled in hospital, general or general pharmacy residencies. Future surveys will clarify the response set for this question.
Post-Graduate Residency, Year 2
Virginia’s pharmacist workforce includes 366
pharmacists who completed a post-graduate year 2 (PGY2) residency. Internal medicine, health administration and critical care were the most cited specialties, with over 50 each. Notably, 25 pharmacists completed residencies in geriatrics. The total includes 81 pharmacists with an unlisted residency. Open-ended descriptions varied. These included law, pediatrics, pharmaceutical research and development and veterinary pharmacy.
9
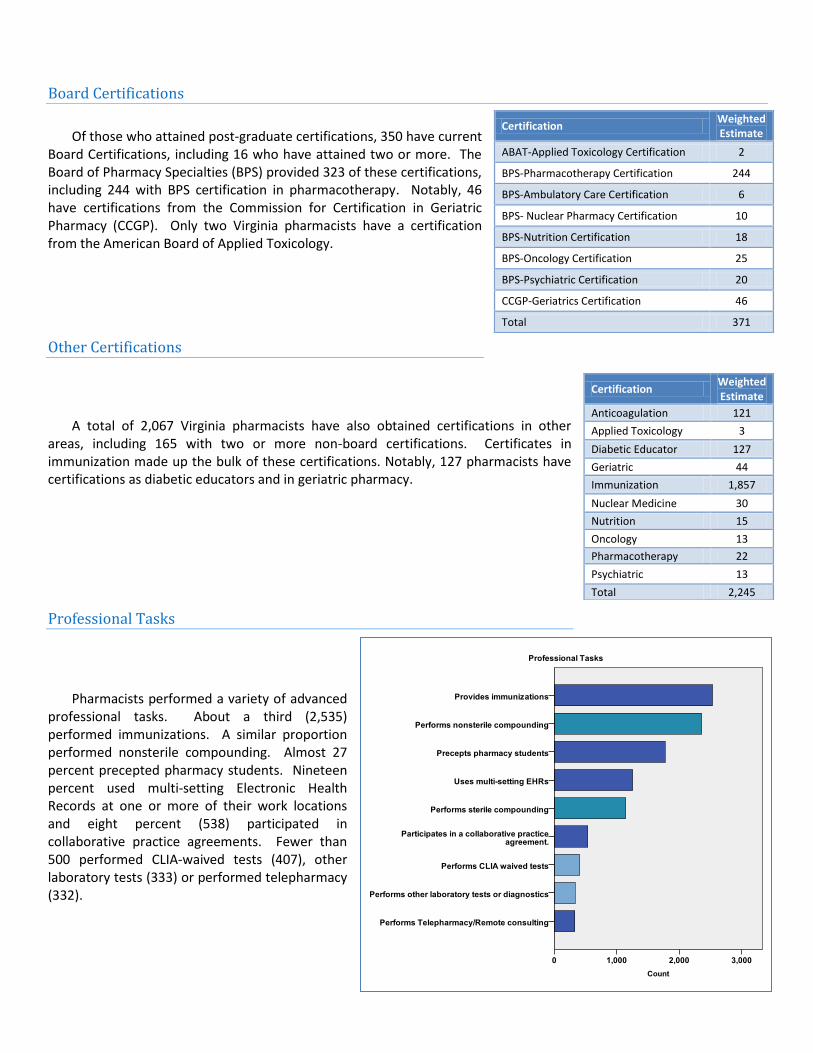
Board Certifications
Of those who attained post-graduate certifications, 350 have current
Board Certifications, including 16 who have attained two or more. The Board of Pharmacy Specialties (BPS) provided 323 of these certifications, including 244 with BPS certification in pharmacotherapy. Notably, 46 have certifications from the Commission for Certification in Geriatric Pharmacy (CCGP). Only two Virginia pharmacists have a certification from the American Board of Applied Toxicology.
Other Certifications
A total of 2,067 Virginia pharmacists have also obtained certifications in other
areas, including 165 with two or more non-board certifications. Certificates in immunization made up the bulk of these certifications. Notably, 127 pharmacists have certifications as diabetic educators and in geriatric pharmacy.
Professional Tasks
Pharmacists performed a variety of advanced
professional tasks. About a third (2,535) performed immunizations. A similar proportion performed nonsterile compounding. Almost 27 percent precepted pharmacy students. Nineteen percent used multi-setting Electronic Health Records at one or more of their work locations and eight percent (538) participated in collaborative practice agreements. Fewer than 500 performed CLIA-waived tests (407), other laboratory tests (333) or performed telepharmacy (332).
Certification Weighted Estimate
ABAT-Applied Toxicology Certification 2
BPS-Pharmacotherapy Certification 244
BPS-Ambulatory Care Certification 6
BPS- Nuclear Pharmacy Certification 10
BPS-Nutrition Certification 18
BPS-Oncology Certification 25
BPS-Psychiatric Certification 20
CCGP-Geriatrics Certification 46
Total 371
Certification Weighted Estimate
Anticoagulation 121
Applied Toxicology 3
Diabetic Educator 127
Geriatric 44
Immunization 1,857
Nuclear Medicine 30
Nutrition 15
Oncology 13
Pharmacotherapy 22
Psychiatric 13
Total 2,245

10
Employment characteristics
Number of Work Locations
Survey respondents provided detailed information on up to two work locations the respondent had worked at over the 12 months prior to the survey, and estimates of weekly hours worked at any additional work locations. Respondents also indicated the number of weeks they worked at the first two locations. Using this data, we were able to estimate the number of locations each pharmacist worked, and separate out those who appear to have switched jobs or locations over the course of the year. This provides an indication of the number of locations worked by each pharmacist concurrently. More specific information about turnover appears later in this report. Over 80 percent of pharmacists maintained one work location, including the 289, or 4.4 percent, of Virginia’s pharmacists we estimate switched locations during the year. Less than ten percent worked at two or more locations concurrently. About eight percent did not have a work location, indicating they did not work in 2011.
Distribution of Work Locations
The HWDC uses the eight regions defined by the Council of
Virginia’s Future to give a general idea of how Virginia’s Pharmacist workforce is distributed across the state (for information on COVF regions see the Virginia Performs website: http://vaperforms.virginia.gov/extras/regions.php). To get a better sense of the geographic distribution of pharmacists, see the Map section on page 23.
Almost all pharmacists (99%) with a work location had their
primary work location in Virginia. The rest had a secondary location in Virginia. Most work locations were in Virginia’s major metropolitan regions: Northern Virginia, Hampton Roads and Central Virginia (which includes both the Richmond and Charlottesville metro areas). A total of 154 pharmacists in Virginia’s Workforce had at least one work location in another state or outside of the United States in addition to having a work location in Virginia. Less than a third (47) of these were located in a state bordering Virginia or the District of Columbia.
Locations Weighted Estimate
%
0 538 8.1%
1 5,436 82.3%
1 Location 5,147 77.9%
Switched Locations
289 4.4%
2 415 6.3%
3 + 216 3.3%
Average* 1.14
*Those with at least one location, and including switched locations as one
location. Does not account for those with more than three locations.
COVF Region
Primary Work Location
Secondary Work Location
Weighted Estimate
Percent Weighted Estimate
Percent
Central 1459 24.4% 123 16.0%
Eastern 112 1.9% 21 2.7%
Hampton Roads
1078 18.0% 116 15.0%
Northern 1536 25.7% 183 23.7%
Southside 217 3.6% 29 3.8%
South-west
347 5.8% 65 8.4%
Valley 380 6.4% 54 7.0%
West Central
698 11.7% 80 10.4%
Several Localities
76 1.3% 31 4.0%
Virginia 5903 98.8% 702 91.0%
Border State/DC
26 0.4% 21 2.7%
Other US State
57 0.9% 48 6.3%
Outside of the US
2 0.0% 0 0.0%
Total 5988 100.0% 771 100.0%
Percentages may not add to 100% due to rounding

11
Compensation
Over 86 percent of pharmacists earned, on average, between $48.01
per hour and $72.00 per hour, including 60 percent who earned between $48.01 and $60.00 per hour. An estimated 35 pharmacists provided volunteer services only. Very few pharmacists earned incomes outside of this range. Due to the clustering of responses in only two response categories, further parsing or statistical tests on the data are inappropriate. Future pharmacist surveys will use a more refined response set.
Benefits
Almost 85 percent of Virginia’s pharmacists
received at least some employer provided benefits. Almost 75 percent received paid vacation while only 61 percent received paid sick leave. Almost two-thirds received health insurance and 60 percent received dental insurance. Almost two-thirds received retirement benefits. A little over seven percent received no benefits from their employer and eight percent did not work in 2012.
Note that this question referred to benefits
received by any current employer at the time the survey was completed (December 2011).
Hourly Compensation
Weighted Estimate
Percent
Volunteer work only 35 0.7%
$12/hr or less 13 0.2%
$12.01-$24.00/hr 55 1.1%
$24.01-$36.00/hr 47 0.9%
$36.01-$48.00/hr 292 5.6%
$48.01-$60.00hr 3136 60.0%
$60.01-$72.00/hr 1402 26.8%
$72.01-$84.00/hr 105 2.0%
$84.01-$96.00/hr 33 0.6%
$96.01-$108.00/hr 31 0.6%
$108.01-$120.00/hr 30 0.6%
$120.01-$132.00/hr 23 0.4%
$132.01-$144.00/hr 7 0.1%
>$144.00/hr 19 0.4%
Total 5228 100.0%
Missing 1377

12
Educational Debt
Virginia’s pharmacists owed an average of about
$28,000 in educational debt. The amount of debt varied widely by degree type, with those holding a Doctor of Pharmacy degree owing substantially more in educational debt.
Since the Doctor of Pharmacy became the minimum
standard in 2006, we are likely to see the debt load of Virginia’s pharmacist’s increase. Among pharmacists age 30 to 39, more of those with Doctor of Pharmacy carried educational debt. Additionally, they carried far higher amounts of debt (see table below). This is likely the result of higher educational costs combined with lost income while pursuing additional years of schooling.
Almost seventeen percent of pharmacists aged 30 to
39 with a Doctor of Pharmacy degree owed over $120,000 in educational debt, compared to less than one percent in the same age range holding a Bachelor in Pharmacy only. Almost 90 percent of pharmacists age 30 to 39 with a Bachelor in Pharmacy degree have no educational debt, compared to less than a quarter with a Doctor of Pharmacy having no debt.
BS Pharm PharmD
Weighted Estimate
% Weighted Estimate
%
None 257 87.0% 265 23.1%
$10,000 or less 15 5.0% 36 3.1%
$10,001-$20,000 * * 29 2.6%
$20,001-$30,000 6 1.9% 47 4.1%
$30,001-$40,000 6 1.9% 55 4.8%
$40,001-$50,000 * * 51 4.4%
$50,001-$60,000 * * 53 4.6%
$60,001-$70,000 * * 56 4.9%
$70,001-$80,000 * * 73 6.4%
$80,001-$90,000 * * 69 6.0%
$90,001-$100,000 * * 79 6.9%
$100,001-$110,000 * * 75 6.6%
$110,001-$120,000 * * 66 5.8%
$120,000 or more * * 190 16.6%
*Less than 4 per cell. Total for all cells is 11.
Note: Means assume uniform distribution within response categories in $10,000 increments. See table for category list.

13
Turnover
Almost 12 percent of Virginia’s pharmacists had some
change in employment in the 12 months prior to completing the survey. This includes persons who may have taken on or left a second or third job during the course of the year.
Establishment Type
Almost a third of pharmacists worked
primarily in large chain community pharmacies, while 10 percent worked in independent pharmacies consisting of one to four stores. Few pharmacists worked in mid-sized chains ranging from five to ten stores. Another 12 percent worked primarily in super market or mass merchandiser based pharmacies. Twenty-seven percent worked primarily in hospitals or health systems, mainly (20.4% of pharmacists) in non-governmental hospitals in inpatient settings.
Secondary work locations exhibited a
similar pattern. However a slightly smaller proportion of pharmacists who had a second workplace worked in large chains, or in supermarket or mass merchandise based pharmacies. Independent pharmacies, non-profits and clinics make proportional gains in the secondary work location category, as do long-term care facilities, academic institutions and for-profit corporations.
Action Weighted Estimate
Rate
Began working for a new employer or practice. 364 5.5%
Ceased working for an employer or practice. 161 2.4%
Ceased working for an employer or practice and began working for a new one.
240 3.6%
Total 765 11.6%
Numbers may not add due to rounding.
Establishment Type
Primary Work Location
Secondary Work Location
Weighted Estimate
% Weighted Estimate
%
Large Chain Community Pharmacy (11+ stores)
1818 30.9% 188 25.5%
Non-government Hospital / Health System, Inpatient
1199 20.4% 111 15.1%
Independent Community Pharmacy (1-4 stores)
564 9.6% 109 14.8%
Supermarket Pharmacy 496 8.4% 35 4.8%
Mass Merchandiser (i.e. Big Box Store)
288 4.9% 30 4.1%
Nursing Home, Long Term Care 221 3.8% 39 5.3%
Government Hospital / Health System, Inpatient
188 3.2% 16 2.2%
Other Non-profit Corporation / Organization
176 3.0% 58 7.9%
Other For-profit Corporation / Organization
167 2.8% 30 4.1%
Government Hospital / Health System, Outpatient
160 2.7% 11 1.5%
Academic Institution 138 2.3% 33 4.5%
Clinic-Based Pharmacy 104 1.8% 34 4.6%
Home Health / Infusion 101 1.7% 9 1.2%
Non-government Hospital / Health System, Outpatient
96 1.6% 15 2.0%
Pharmacy Benefit Administration (e.g. PBM, managed care)
93 1.6% 8 1.1%
Mail Service Pharmacy 48 0.8% 7 1.0%
Small Chain Community Pharmacy (5-10 stores)
23 0.4% 5 0.7%
Total 5881 100.0% 736 100.0%
Missing 181
92
Total With Location 6062
828
Ineligible (Do not have location) 543
5776
Total 6605
6605

14
Work Roles
The survey asked respondents to report the percentage of time spent working in each of six roles at their primary
work location, as well as an “other” category. Proper analysis of these questions requires valid combined responses for all of the roles. We obtained valid responses for 4,945 of Virginia’s pharmacists (weighted), excluding those without a primary work location.
About 50 percent of Virginia’s pharmacists spent most or almost all, or all of their time on medication dispensing,
including 30 percent who spent all or almost all of their time. Only 50 percent of Virginia’s pharmacists spent any time educating pharmacists. Of those that did, over three quarters spent less than 20 percent of their time on education, while only 4 percent spent 80 percent or more of their time. Even fewer pharmacists (22%) spent any time on research, and three quarters of these spent less than 20 percent of their time on research. Only 21 percent of Virginia’s pharmacists spent more than 20 percent of their time on non-billing business & administration, and a third spent no time on non-billing business and administration. However, 44 percent spent more than 20 percent of their time on billing, including 11 percent who spent all or almost all of their time on billing.

15
Work Hours
The pharmacist workforce survey asked respondents to
estimate the average weekly hours provided at any primary and secondary work location and the number of weeks worked at each location in the past twelve months. As with all surveys, and particularly online surveys, our responses suffered from some item-missing data. To get a more complete look at the pharmacist labor supply, we imputed missing data on these variables. Although these changes had little effect on aggregate descriptive statistics, they may have a larger effect on estimates when examining small groups (e.g. estimates for rural counties.) Details of our methodology appear in Appendix B.
The tables on this page show the results of the imputation.
Respondents were asked to provide average hours for the weeks worked at each location. Note, respondents reported individual work locations rather than employers. About 19 percent of those who had a second work location worked at that location for 48 or more weeks, and indication of those who worked the entire year at two locations. About two thirds worked at a secondary location for less than half the year. By contrast, over two-thirds of those with a work location worked 48 weeks or more at their primary work location. Only 15 percent worked less than 26 weeks at a primary location. Over 80 percent of persons worked 30 or more hours per week at their primary work locations, including almost two-thirds who worked 40 hours or more. Over 70 percent worked fewer than 20 hours at a secondary work location.
Ave. Hours per Week Worked
Primary Location Secondary Location
Frequency % Frequency %
1 to 9 hours 229 3.8% 328 39.7%
10 to 19 hours 268 4.4% 263 31.8%
20 to 29 hours 488 8.1% 74 9.0%
30 to 39 hours 1276 21.0% 52 6.3%
40 to 49 hours 3271 54.0% 88 10.7%
50 to 59 hours 305 5.0% 10 1.2%
60 to 69 hours 81 1.3% 7 0.8%
70 to 79 hours 91 1.5% 1 0.1%
80 or more hours
53 0.9% 3 0.4%
Total 6062
826
Ineligible 543
5776
Weeks Worked
Primary Location Secondary Location
Weighted Estimate
% Weighted Estimate
%
10 weeks or less
211 3.5% 308 37.3%
11 to 20 weeks
393 6.5% 166 20.1%
21 weeks 15 0.2% 5 0.6%
22 weeks 30 0.5% 14 1.7%
23 weeks 18 0.3% 5 0.6%
24 weeks 93 1.5% 19 2.3%
25 weeks 46 0.8% 15 1.8%
26 weeks 134 2.2% 37 4.5%
27 weeks 15 0.2% 5 0.6%
28 weeks 53 0.9% 8 1.0%
29 weeks 10 0.2% 3 0.4%
30 weeks 62 1.0% 21 2.5%
31 weeks 4 0.1% 0 0.0%
32 weeks 55 0.9% 4 0.5%
33 weeks 12 0.2% 3 0.4%
34 weeks 9 0.1% 4 0.5%
35 weeks 14 0.2% 3 0.4%
36 weeks 58 1.0% 7 0.8%
37 weeks 13 0.2% 0 0.0%
38 weeks 27 0.4% 0 0.0%
39 weeks 12 0.2% 0 0.0%
40 weeks 153 2.5% 15 1.8%
41 weeks 12 0.2% 1 0.1%
42 weeks 40 0.7% 3 0.4%
43 weeks 18 0.3% 0 0.0%
44 weeks 90 1.5% 6 0.7%
45 weeks 78 1.3% 5 0.6%
46 weeks 140 2.3% 6 0.7%
47 weeks 120 2.0% 7 0.8%
48 weeks 607 10.0% 14 1.7%
49 weeks 461 7.6% 10 1.2%
50 weeks 970 16.0% 50 6.1%
51 weeks 128 2.1% 6 0.7%
52 weeks 1962 32.4% 75 9.1%
Total 6063 100.0% 825 100.0%
Ineligible 543
5776

16
Total Hours
According to our estimates, a total 6066 Virginia pharmacists worked an average of 1,825 hours in 2011 providing over 11 million man-hours of labor. An additional 539 Virginia pharmacists did not work in 2011. The average of 1,825 hours is equivalent to about 46 weeks at 40 hours per week, or 50 weeks at 36.5 hours per week. The median is 2,070 hours, just short of 40 hours a week over all 52 weeks.
The distribution is skewed towards lower hours, with a quarter of workers working 1,300 or fewer hours in 2011, the equivalent of 32.5 weeks at 40 hours per week or 26 hours a week over 50 weeks. Only 1.5% worked twice the average (3,650 hours) or more. That equates to 70 hours per week with no weeks off.
Work Hours and Age
Annual hours worked varied by age, although the affect seems
to be small.5 The number of annual hours worked peaked from age 50 to 64, although persons age 30 to 34 also worked a high number of hours. For most age groups the mean is lower than the median, in these cases indicating a significant number of persons working a low number of hours in the year. For pharmacists age 70 and over, a small number of pharmacists working a large number of hours pulled up the average.
Age Total Annual Hours
Mean Median
Under 30 1,695 1,820
30 to 34 1,941 2,205
35 to 39 1,774 1,820
40 to 44 1,852 2,070
45 to 49 1,881 2,070
50 to 54 1,947 2,160
55 to 59 1,933 2,160
60 to 64 1,953 2,160
65 to 69 1,541 1,715
70 to 74 1,056 840
75 to 79 862 750
80 and over
1,211 780

17
Work Hours and Gender
Due to the changing demographics of many health
professions, the HWDC examines work participation by gender. Except for those under age 30, male pharmacists appear to work more hours than female pharmacists. However, statistical tests failed to confirm this difference. Age appears to have a stronger effect on total hours than gender.
Full Time Equivalency Units (FTEs)
Researchers and human resources professionals often refer to Full Time Equivalency
units (or FTEs) when discussing labor market participation. Conceptually, an FTE represents one full time worker or one full time position. One FTE may be provided by two part-time workers or one full time worker. Alternatively, one worker with one full time job and one part time job may provide 1.5 FTEs. FTEs provide an easy way to compare labor or job supply while accounting for differing levels of work from individuals.
FTEs are defined using a variety of methods. Human resources professionals (and
employees) often think in terms of positions or jobs, with one full time position equivalent to one FTE and one part time position equivalent to 0.5 FTEs. Economists (and payroll professionals), however, often need more precise measures of hours worked. Researchers often use, simply, hours worked (as we did in the previous section). Using FTEs, however, provides a human scale for examining data and provides for easy benchmarking across data sources.
When using FTEs, readers are cautioned to look closely at how FTEs are defined. Does FTE refer to positions, or is it
derived from hours worked (or some other measure of services provided, such as surgeries performed)? How many hours equates to one FTE? Unless defined equivalently, direct comparisons of FTEs require caution. In many cases, direct comparisons are not appropriate. The HWDC defines one FTE as 2,000 hours worked per year. That equates to someone working 40-hours per week for 50 weeks (2-weeks off).6 Other common methods, such as a full 52 week schedule, or a 35-hour work week can be calculated using the HWDC’s raw figures.
FTEs by age, along with the FTE per individual in the age group, are reported in the table above. The distribution
(proportion by age group) is equivalent to the distribution by hour. All told, the 6,066 Virginia pharmacists who worked in 2011 provided approximately 5,536 FTEs at their primary and secondary locations, or about 0.91 FTEs per pharmacist. FTEs are reported alongside hours in the charts and maps on the following pages.
Age Total FTEs
Mean Sum
Under 30 0.85 689.26
30 to 34 0.97 854.09
35 to 39 0.89 693.8
40 to 44 0.93 738.91
45 to 49 0.94 676.55
50 to 54 0.97 632.11
55 to 59 0.97 585.86
60 to 64 0.98 398.96
65 to 69 0.77 164.96
70 to 74 0.53 55.59
75 to 79 0.43 21.46
80 and over 0.61 20.61
Total 0.91 5532.17

18
Work Hours and Type of Establishment
About 30 percent of all work hours provided by pharmacists were provided at large chain community pharmacies.
Another 21 percent were provided at non-governmental inpatient hospitals or health systems. Combined, about 13 percent were provided at pharmacies located in supermarkets or mass merchandisers. Only 9.1 percent were provided at independent pharmacies. Less than 4 percent of all hours were provided at all other establishment types.
Establishment Type
Primary Location Secondary Locations Combined Locations
Average Hours
Total Hours
Average Hours
Total Hours
Total FTEs Percent of all Hours
(Valid)
Large Chain Community Pharmacy (11+ stores)
1,720 3,125,747 475 89,419 3,215,166 1607.6 30.0%
Non-government Hospital / Health System, Inpatient
1,858 2,227,398 456 49,804 2,277,202 1138.6 21.2%
Independent Community Pharmacy (1-4 stores)
1,666 940,484 306 32,769 973,253 486.6 9.1%
Supermarket Pharmacy 1,792 888,409 333 11,512 899,921 450.0 8.4%
Mass Merchandiser (i.e. Big Box Store) 1,812 522,601 247 7,363 529,965 265.0 4.9%
Nursing Home, Long Term Care 1,639 362,945 458 17,809 380,753 190.4 3.5%
Government Hospital / Health System, Inpatient
1,960 368,045 741 11,886 379,931 190.0 3.5%
Other For-profit Corporation / Organization 1,832 306,630 336 9,978 316,608 158.3 3.0%
Government Hospital / Health System, Outpatient
1,898 303,175 203 2,320 305,495 152.7 2.8%
Other Non-profit Corporation / Organization 1,607 283,529 262 15,166 298,695 149.3 2.8%
Academic Institution 1,913 264,204 476 15,656 279,860 139.9 2.6%
Pharmacy Benefit Administration (e.g. PBM, managed care)
2,051 190,691 787 6,423 197,114 98.6 1.8%
Home Health / Infusion 1,831 185,397 397 3,630 189,026 94.5 1.8%
Clinic-Based Pharmacy 1,645 171,639 296 10,132 181,771 90.9 1.7%
Non-government Hospital / Health System, Outpatient
1,723 164,895 528 7,761 172,657 86.3 1.6%
Mail Service Pharmacy 1,826 87,286 440 3,058 90,344 45.2 0.8%
Small Chain Community Pharmacy (5-10 stores)
1,644 37,691 786 3,564 41,254 20.6 0.4%
Total Valid
10,430,768
298,249 10,729,017 5364.5 100.0%
Establishment Type Missing 1,660 300,890 466 42,037 342,928 171.5
Total 1,770 10,731,658 413 340,286 11,071,945 5536.0

19
Work Hours by Location
As noted earlier, the HWDC uses the eight regions defined by the Council of Virginia’s Future to give a general idea of how Virginia’s Pharmacist workforce is distributed across the state (for information on COVF regions see the Virginia Performs website: http://vaperforms.virginia.gov/extras/regions.php). For more detailed information of the geographic distribution of pharmacists, see the Map section on page 24.
Not surprisingly, the distribution of work hours tends to follow the distribution of work locations. Over half of
pharmacist work hours were provided to the Central and Northern Virginia regions combined. An additional 19 percent were provided in the Hampton Roads region. The remaining 30 percent were divided among the remaining five regions, with Eastern Virginia receiving the lowest share. Only 1.6 percent of pharmacist work hours are provided in Eastern Virginia. Pharmacists in Virginia’s workforce provide almost all of their services in Virginia, with only 1.9 percent of work hours occurring in other states.
Locality Primary Location
Secondary Location
Combined Locations
FTEs by Location
% of Valid Total
% of Virginia
Total
In Virginia
Central 2,681,583 47,611 2,729,193 1,364.6 25.0% 25.5%
Eastern 165,832 5,813 171,645 85.8 1.6% 1.6%
Hampton Roads 1,969,500 38,200 2,007,700 1,003.8 18.4% 18.8%
Northern 2,592,334 69,014 2,661,348 1,330.7 24.4% 24.9%
Southside 394,033 9,897 403,929 202.0 3.7% 3.8%
Southwest 627,206 24,207 651,413 325.7 6.0% 6.1%
Valley 677,026 14,261 691,287 345.6 6.3% 6.5%
West Central 1,238,423 21,321 1,259,743 629.9 11.6% 11.8%
Several Localities 109,225 13,402 122,627 61.3 1.1% 1.1%
Virginia Total 10,455,160 243,725 10,698,886 5,349.4 98.1% 100.0%
Outside of Virginia
Virginia Border State/DC
43,389 13,836 57,225 28.6 0.5%
Other US State 113,456 32,139 145,596 72.8 1.3%
Outside of the US 2,648 . 2,648 1.3 0.0%
Total outside Virginia
159,493 45,975 205,469 102.7 1.9%
Totals & Missing
Total Valid 10,614,653 289,700 10,904,355 5452.2 100.0%
Location Unknown 117,004 50,586 167,590 83.8
Total, Virginia Phamacist Workforce
10,731,658 340,286 11,071,945 5536.0

20
Future Plans
Expected Retirement Age
Almost 60 percent of pharmacists
expected to retire between the ages of 60 to 69, including almost 40 percent who expected to retire between ages 65 and 69. The proportions remain relatively stable across the generations, with the exception that the proportion of Virginia pharmacists expecting to retire under age 60 is highest in younger cohorts, but diminishes as pharmacists approach age 50.
After that age it is difficult to tell if
expectations of early retirement change due to circumstances, or because people who wish to retire younger do so and thus drop out of our sample. Over time, we will be able to examine whether pharmacists who seek to retire early are successful in doing so, whether retirement expectations change as people age, and whether intergenerational differences in retirement expectations exist.

21
Retirement Plans
By comparing pharmacist’s retirement expectations to
their actual age, we can estimate how many pharmacists plan to retire within the near future. Pharmacists also provide information on their near-term plans, including plans to retire, allowing us to make more definitive estimates of retirement rates within the next five years. Almost 13% of Virginia’s pharmacists planned to retire within the next 5 years, including 5.3 percent who planned to retire within two years of completing the survey.
Future Plans
Overall, Virginia’s pharmacists
planned to increase their involvement in the workforce over the next two years. 712 pharmacists planned to increase patient care hours in the next two years. However, 426 planned to decrease patient care hours. 509 planned to begin precepting and 323 planned to increase hours spent teaching. Few planned to cease precepting or decrease hours teaching. A total of 584 planned to cease participating in Virginia’s pharmacy workforce, including 84 who plan to cease working in pharmacy, 239 who plan to leave Virginia and 261 who plan to retire.
Weighted Estimate
% Cumulative
%
Within 2 Years 277 5.3 5.3
Within 3 -5 Years 386 7.4 12.8
Within 6 -10 Years 329 6.3 19.1
Within 7-14 Years 475 9.1 28.2
Within 11-19 Years 582 11.2 39.4
Within 16-25 Years 684 13.2 52.6
Within 21-30 Years 681 13.1 65.7
Within 26-35 Years 669 12.9 78.6
Within 31-40 Years 552 10.6 89.2
Within 36-45 Years 395 7.6 96.8
Within 41-50 Years 121 2.3 99.1
Within 46-55 Years 38 0.7 99.8
Within 51-60 Years 9 0.2 100
Total 5199 100
Missing 1406
Total 6605

22
Plans to Enter Virginia’s Pharmacist Workforce
A total of 421 licensed pharmacists currently NOT in Virginia’s workforce
planned to return to Virginia’s workforce, including 74 who planned to return within the next year. These figures include only licensed pharmacists whose mailing address is not in Virginia.
Reasons for Not Working
An estimated 543 pharmacists in Virginia’s pharmacist
workforce did not work in pharmacy in 2011. These pharmacists had mailing addresses in Virginia and indicated plans to return to Virginia’s workforce. Of these, an estimated 359 provided information on why they did not work and what they did. Some provided multiple responses (e.g. experienced voluntary unemployment, pursued specialty education). Only 16 percent indicated they did not work due to involuntary unemployment, while 30 percent experienced voluntary unemployment (including for medical reasons) and 18 percent worked in another profession.
A quarter are retired but plan to return to the
workforce in some capacity, and a fifth provided some occasional charity or consulting services. About six percent pursued additional education, including two percent who pursued non-pharmacy education.
1 Military personnel may renew within 60 days of returning from an overseas deployment, as long as renewal occurs within five
years of license expiration. All others must renew licenses biennially. 2 For Age, χ2 is significant at the 99% confidence level, with a Cramer’s V of 0.131 indicating small effect size. Spearmans’ Rho is
also significant at the 99% confidence level, with a value of -0.050. For Metro Status, χ2 is significant at the 10% confidence level
(p=0.054) with a phi coefficient of .021. 3 National workforce information is provided by the Current Population Survey, administered by the US Bureau of Labor
Statistics and the US Census Bureau. Age information appears in “Table 15: Employed persons by detailed occupation, sex and age, Annual Average 2010” for the 2010 Survey. Due to issues with sample size, median age information at the state level is not generally available, but was estimated at the request of the HWDC. Special thanks to Steve Hipple and Thomas Krolik of the Bureau of Labor Statistics for their assistance.
4 All Healthcare Workforce Data Surveys follow Federal OMB standards for data collection on race and ethnicity. This allows
valid comparisons with data collected by the US Census Bureau and other sources. For more information on these standards see: http://www.whitehouse.gov/omb/inforeg_statpolicy.
Plans to Return Weighted Estimate
Within 1 year 74
Within 1-2 years 50
Within 3-5 years 42
In more than 5 years 27
Yes, but do not know when
228
Total 421
Weighted Estimate
%
Experienced involuntary unemployment
58 16%
Experienced voluntary unemployment 109 30%
Retired 89 25%
Performed occasional charity or consultant services
75 21%
Pursued specialty education 14 4%
Pursued non-pharmacy education 6 2%
Worked in another profession 66 18%
Total number reporting 359
Figures do not add due some respondents providing multiple responses.

5 Confirmed using Kolmogov-Smirov Test. Mean hours worked for persons age 70 and over were affected by a few persons
working a high number of hours. The K-S test was run twice, once with and once without these categories. Both tests were significant at the 99.9% level. Follow-up with Mann-Whitney U tests also revealed differences on key categories, but with small or very small effect sizes.
6 There does not seem to be a common method for estimating FTEs. The method described here is used by the US Bureau of
Labor Statistics when calculating accident rates in the workforce. Readers should note that previous reports of FTEs by the HWDC referred to positions, not a derivation of hours worked, usually by asking directly whether employees worked full time or part time. Since HWDC surveys are not monthly “snapshot” surveys this method caused some confusion. The pharmacy survey, for instance, occurs annually, with practitioners generally renewing in December. Pharmacists report their activities for the prior 12 month period and work participation can change drastically over this time period.

24
Maps

25

26
Council on Virginia’s Future Regions

27
Health Services Areas

28
Workforce Investment Area

29
Local Health District
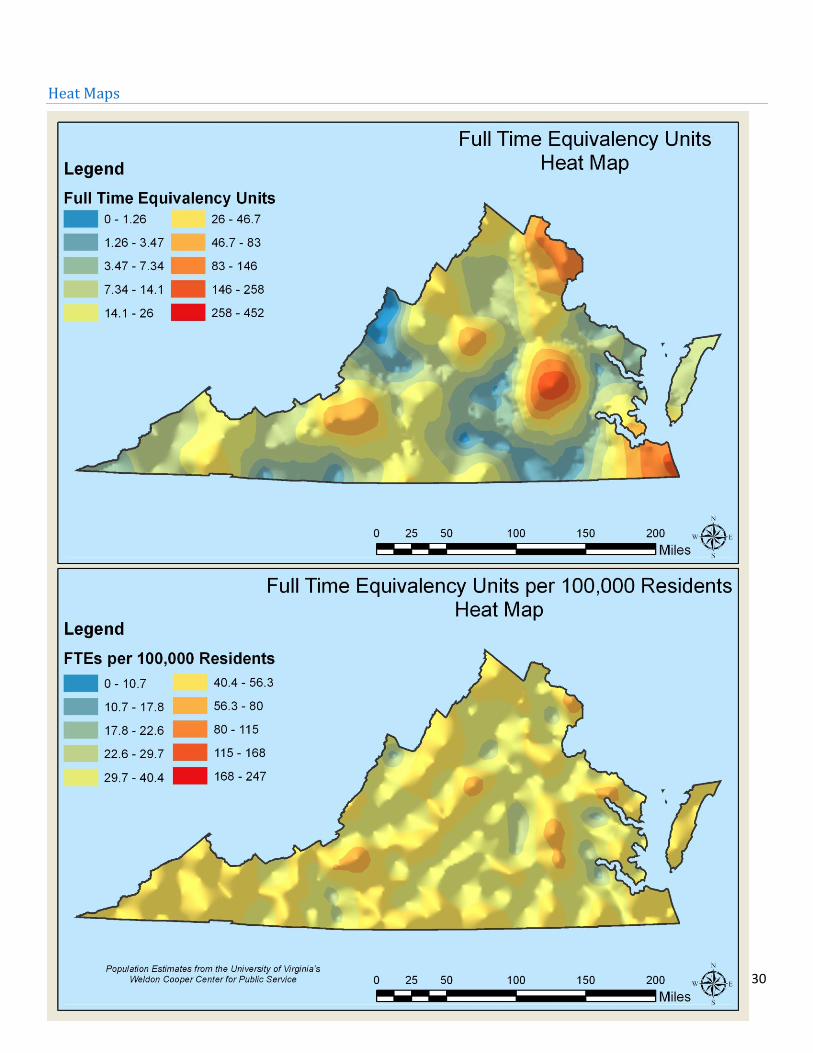
30
Heat Maps

31
Appendices
Appendix A: Weights
Final weights were calculated by multiplying the two weights and the overall response rate: ageweight x ruralweight
x responserate = final weight. Note: No pharmacists had mailing addresses in counties with rural status “Urban pop 20,000+, nonadj”.
Age Response Rate Weight
Under 30 87.00% 1.149425287356320
30 to 34 87.90% 1.137656427758820
35 to 39 87.60% 1.141552511415530
40 to 44 86.20% 1.160092807424590
45 to 49 86.40% 1.157407407407410
50 to 54 87.30% 1.145475372279500
55 to 59 88.90% 1.124859392575930
60 to 64 85.50% 1.169590643274850
65 to 69 83.60% 1.196172248803830
70 to 74 72.60% 1.377410468319560
75 to 79 69.70% 1.434720229555240
80 and over 47.10% 2.123142250530790
Rural Status Response Rate Weight
Metro, 1 million+ 87.10% 1.148105625717570
Metro, 250,000 to 1 million 88.80% 1.126126126126130
Metro, 250,000 or less 86.70% 1.153402537485580
Urban pop 20,000+, Metro adj 90.90% 1.100110011001100
Urban pop 20,000+, nonadj NA NA
Urban pop, 2,500-19,999, Metro adj 85.40% 1.170960187353630
Urban pop, 2,500-19,999, nonadj 87.10% 1.148105625717570
Rural, Metro adj 75.00% 1.333333333333330
Rural, nonadj 85.60% 1.168224299065420
Not in Virginia 83.20% 1.201923076923080
32
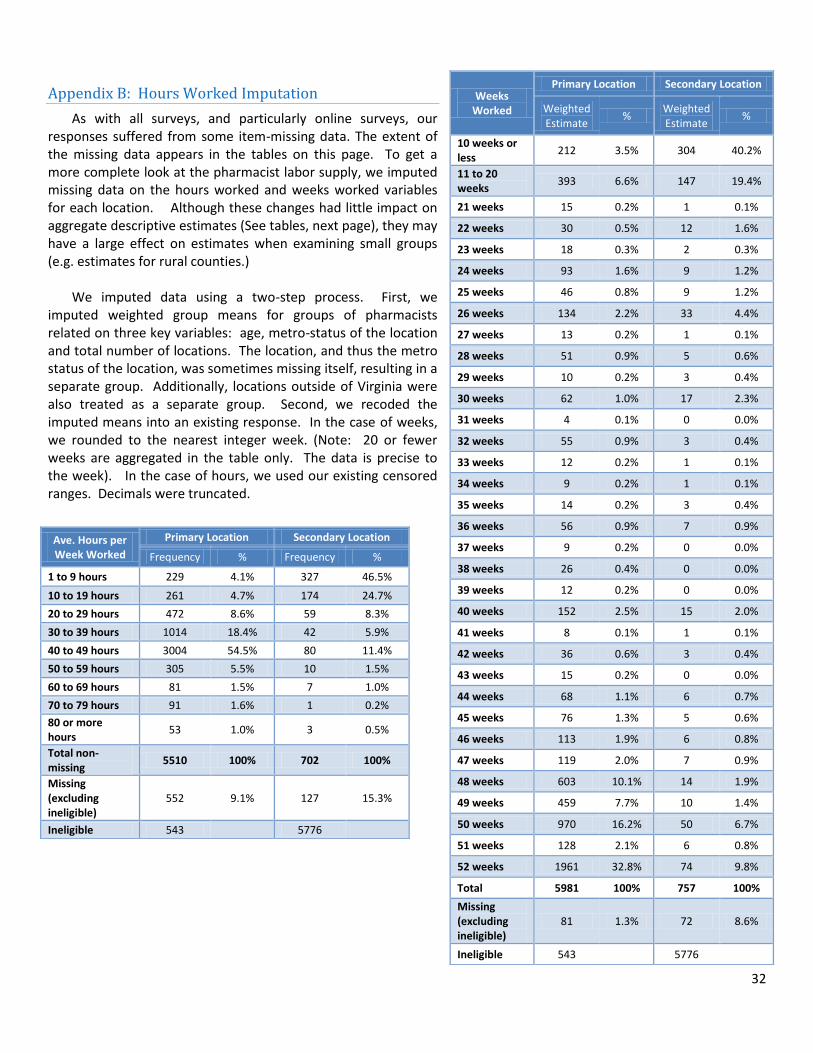
Appendix B: Hours Worked Imputation
As with all surveys, and particularly online surveys, our responses suffered from some item-missing data. The extent of the missing data appears in the tables on this page. To get a more complete look at the pharmacist labor supply, we imputed missing data on the hours worked and weeks worked variables for each location. Although these changes had little impact on aggregate descriptive estimates (See tables, next page), they may have a large effect on estimates when examining small groups (e.g. estimates for rural counties.)
We imputed data using a two-step process. First, we imputed weighted group means for groups of pharmacists related on three key variables: age, metro-status of the location and total number of locations. The location, and thus the metro status of the location, was sometimes missing itself, resulting in a separate group. Additionally, locations outside of Virginia were also treated as a separate group. Second, we recoded the imputed means into an existing response. In the case of weeks, we rounded to the nearest integer week. (Note: 20 or fewer weeks are aggregated in the table only. The data is precise to the week). In the case of hours, we used our existing censored ranges. Decimals were truncated.
Weeks Worked
Primary Location Secondary Location
Weighted Estimate
% Weighted Estimate
%
10 weeks or less
212 3.5% 304 40.2%
11 to 20 weeks
393 6.6% 147 19.4%
21 weeks 15 0.2% 1 0.1%
22 weeks 30 0.5% 12 1.6%
23 weeks 18 0.3% 2 0.3%
24 weeks 93 1.6% 9 1.2%
25 weeks 46 0.8% 9 1.2%
26 weeks 134 2.2% 33 4.4%
27 weeks 13 0.2% 1 0.1%
28 weeks 51 0.9% 5 0.6%
29 weeks 10 0.2% 3 0.4%
30 weeks 62 1.0% 17 2.3%
31 weeks 4 0.1% 0 0.0%
32 weeks 55 0.9% 3 0.4%
33 weeks 12 0.2% 1 0.1%
34 weeks 9 0.2% 1 0.1%
35 weeks 14 0.2% 3 0.4%
36 weeks 56 0.9% 7 0.9%
37 weeks 9 0.2% 0 0.0%
38 weeks 26 0.4% 0 0.0%
39 weeks 12 0.2% 0 0.0%
40 weeks 152 2.5% 15 2.0%
41 weeks 8 0.1% 1 0.1%
42 weeks 36 0.6% 3 0.4%
43 weeks 15 0.2% 0 0.0%
44 weeks 68 1.1% 6 0.7%
45 weeks 76 1.3% 5 0.6%
46 weeks 113 1.9% 6 0.8%
47 weeks 119 2.0% 7 0.9%
48 weeks 603 10.1% 14 1.9%
49 weeks 459 7.7% 10 1.4%
50 weeks 970 16.2% 50 6.7%
51 weeks 128 2.1% 6 0.8%
52 weeks 1961 32.8% 74 9.8%
Total 5981 100% 757 100%
Missing (excluding ineligible)
81 1.3% 72 8.6%
Ineligible 543
5776
Ave. Hours per Week Worked
Primary Location Secondary Location
Frequency % Frequency %
1 to 9 hours 229 4.1% 327 46.5%
10 to 19 hours 261 4.7% 174 24.7%
20 to 29 hours 472 8.6% 59 8.3%
30 to 39 hours 1014 18.4% 42 5.9%
40 to 49 hours 3004 54.5% 80 11.4%
50 to 59 hours 305 5.5% 10 1.5%
60 to 69 hours 81 1.5% 7 1.0%
70 to 79 hours 91 1.6% 1 0.2%
80 or more hours
53 1.0% 3 0.5%
Total non-missing
5510 100% 702 100%
Missing (excluding ineligible)
552 9.1% 127 15.3%
Ineligible 543
5776
33
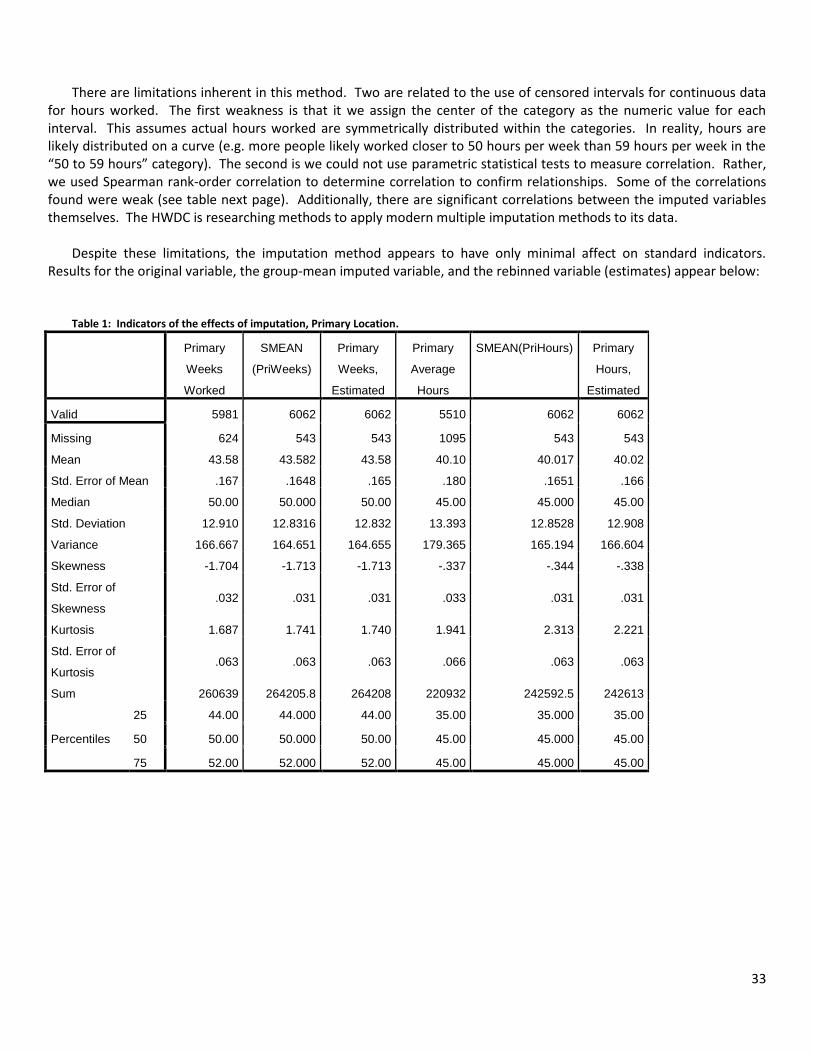
There are limitations inherent in this method. Two are related to the use of censored intervals for continuous data for hours worked. The first weakness is that it we assign the center of the category as the numeric value for each interval. This assumes actual hours worked are symmetrically distributed within the categories. In reality, hours are likely distributed on a curve (e.g. more people likely worked closer to 50 hours per week than 59 hours per week in the “50 to 59 hours” category). The second is we could not use parametric statistical tests to measure correlation. Rather, we used Spearman rank-order correlation to determine correlation to confirm relationships. Some of the correlations found were weak (see table next page). Additionally, there are significant correlations between the imputed variables themselves. The HWDC is researching methods to apply modern multiple imputation methods to its data.
Despite these limitations, the imputation method appears to have only minimal affect on standard indicators.
Results for the original variable, the group-mean imputed variable, and the rebinned variable (estimates) appear below:
Table 1: Indicators of the effects of imputation, Primary Location.
Primary
Weeks
Worked
SMEAN
(PriWeeks)
Primary
Weeks,
Estimated
Primary
Average
Hours
SMEAN(PriHours) Primary
Hours,
Estimated
Valid 5981 6062 6062 5510 6062 6062
Missing 624 543 543 1095 543 543
Mean 43.58 43.582 43.58 40.10 40.017 40.02
Std. Error of Mean .167 .1648 .165 .180 .1651 .166
Median 50.00 50.000 50.00 45.00 45.000 45.00
Std. Deviation 12.910 12.8316 12.832 13.393 12.8528 12.908
Variance 166.667 164.651 164.655 179.365 165.194 166.604
Skewness -1.704 -1.713 -1.713 -.337 -.344 -.338
Std. Error of
Skewness .032 .031 .031 .033 .031 .031
Kurtosis 1.687 1.741 1.740 1.941 2.313 2.221
Std. Error of
Kurtosis .063 .063 .063 .066 .063 .063
Sum 260639 264205.8 264208 220932 242592.5 242613
Percentiles
25 44.00 44.000 44.00 35.00 35.000 35.00
50 50.00 50.000 50.00 45.00 45.000 45.00
75 52.00 52.000 52.00 45.00 45.000 45.00

34
Table 2: Indicators of the effects of imputation, Secondary Location.
Secondary
Weeks
Worked
SMEAN
(SecWeeks)
Secondary
Weeks,
Estimate
Secondary
Average
Hours
SMEAN
(SecHours)
Secondary
Hours,
Estimated
Valid 757 825 825 702 826 826
Missing 5848 5780 5780 5903 5778 5778
Mean 21.61 21.741 21.74 17.29 17.624 17.65
Std. Error of Mean .666 .6152 .615 .601 .5245 .526
Median 15.00 17.690 18.00 15.00 15.000 15.00
Std. Deviation 18.312 17.6706 17.671 15.930 15.0784 15.117
Variance 335.343 312.249 312.254 253.752 227.358 228.538
Skewness .580 .576 .576 1.391 1.392 1.390
Std. Error of
Skewness .089 .085 .085 .092 .085 .085
Kurtosis -1.194 -1.089 -1.089 1.455 1.694 1.660
Std. Error of
Kurtosis .177 .170 .170 .184 .170 .170
Sum 16358 17937.8 17936 12143 14564.1 14588
Percentiles 25 6.00 6.000 6.00 5.00 5.000 5.00
50 15.00 17.690 18.00 15.00 15.000 15.00
75 40.00 35.000 35.00 25.00 25.000 25.00
Table 3: Correlations.
Spearman's rho Location
Count
Primary
Average
Hours
Primary
Weeks
Worked
Secondary
Average
Hours
Secondary
Weeks
Worked
Age 5 yr
Correlation Coefficient -.086** -.151
** .088
** -.132
** .065
Sig. (2-tailed) .000 .000 .000 .001 .095
N 5776 4832 5241 613 661
Location Count
Correlation Coefficient 1.000 -.049** -.061
** -.079 -.062
Sig. (2-tailed) . .001 .000 .052 .110
N 5782 4834 5247 613 661

35
Appendix C: The 2011 Pharmacist Workforce Survey
Question and Question Choices 2011 Pharmacist (0202) Survey
question question_choice
Education and Background
1) Where did you attend high school (secondary school)? Outside Of The U.S. or Canada
Canada
57 US States and Territories
2) Where did you complete your undergraduate degree? Did not obtain an undergraduate degree
Outside of the US or Canada
Canada
57 US States and Territories
3) Where did you obtain your initial pharmacy degree? Outside of the US or Canada
Canada
57 US States and Territories
4a) Which pharmacy degrees have you attained as of today? Check all that apply BS Pharm
PharmD
4b) Which post-graduate programs have you completed as of today? Check all that apply
Residency
Fellowship
Certification Program
Masters
PhD
If you completed a residency, please indicate your area:5a) PGY1: Check all that apply
Health Systems
Managed Care
Community Settings
Ambulatory Care
Other
5b) PGY2: Check all that apply Ambulatory
Cardiology
Critical Care
Drug Information
Emergency Medicine
Geriatric
Health Administration Pharmacy
HIV
Infectious Disease
Internal Medicine
Managed Care Pharmacy Systems
Medication Use Safety
Nephrology
Nuclear
Nutrition Support
Oncology
Palliative Care/Pain Management
Other
5c) If you chose “other” for either PGY1 or PGY2 residency, please provide a brief description of your specialty area:
Open-ended
6a) Please indicate any Board Certifications for pharmacy you have attained as of today: Check all that apply
BPS-Ambulatory Care

36
BPS-Nuclear Pharmacy
BPS-Nutrition
BPS-Oncology
BPS- Pharmacotherapy
BPS-Psychiatric
CCGP-Geriatrics
ABAT-Applied Toxicology
6b) Please indicate any other (non-Board) certifications for pharmacy you have attained as of today: Check all that apply
Ambulatory Care
Nuclear Pharmacy
Nutrition
Oncology
Pharmacotherapy
Psychiatric
Geriatrics
Applied Toxicology
Diabetic Educator
Anticoagulation
Immunization
7) Within the past 12 months, have you worked, volunteered, taught or practiced, in any environment related to pharmacy or in any position that drew on your knowledge of pharmacy? (if only occasional practice--less than 100 hrs--please select "No")<i>Please note: Answer "yes" for any pharmacy-related activities, including administrative, educational, regulatory or other activities.</i>If you answered "No" to Question 7, please go to Question 33 in the Demographics section. If you answered "Yes", please continue.
Yes/no
Primary Work Location<i>Question 8 through Question 15 refer to your primary place of employment, work or practice. This is the place where you spend the most work hours during an average workweek, or where you spent the most weeks working in the past 12 months. Please use these questions to describe a particular work location, not an employer. Temporary or traveling workers who spend or spent a significant amount of time at a particular location should use that location as his or her primary work location. Persons who consistently work in multiple locations (i.e. temporary workers, locum tenens) should indicate this in Question 8.</i> 8) Please select the location of your primary place of employment, work or practice:
List of VA counties
Several localities (temporary, mobile clinic, etc.)
Outside of US
Virginia Border State/DC
Other US State
9) Approximate number of weeks at which at least some time was spent at this work location within the past twelve months (exclude vacation, medical leave, etc.)
1 - 52 weeks
10a) Please select the type of practice setting: Independent Community Pharmacy (1-4 stores)
Small Chain Community Pharmacy (5-10 stores)
Large Chain Community Pharmacy (11+ stores)
Mass Merchandiser (i.e. Big Box Store)
Supermarket Pharmacy
Clinic-Based Pharmacy
Mail Service Pharmacy
Government Hospital / Health System,
37
Inpatient
Government Hospital / Health System, Outpatient
Non-government Hospital / Health System, Inpatient
Non-government Hospital / Health System, Outpatient
Nursing Home, Long Term Care
Home Health / Infusion
Pharmacy Benefit Administration (e.g. PBM, managed care)
Academic Institution
Other For-profit Corporation / Organization
Other Non-profit Corporation / Organization
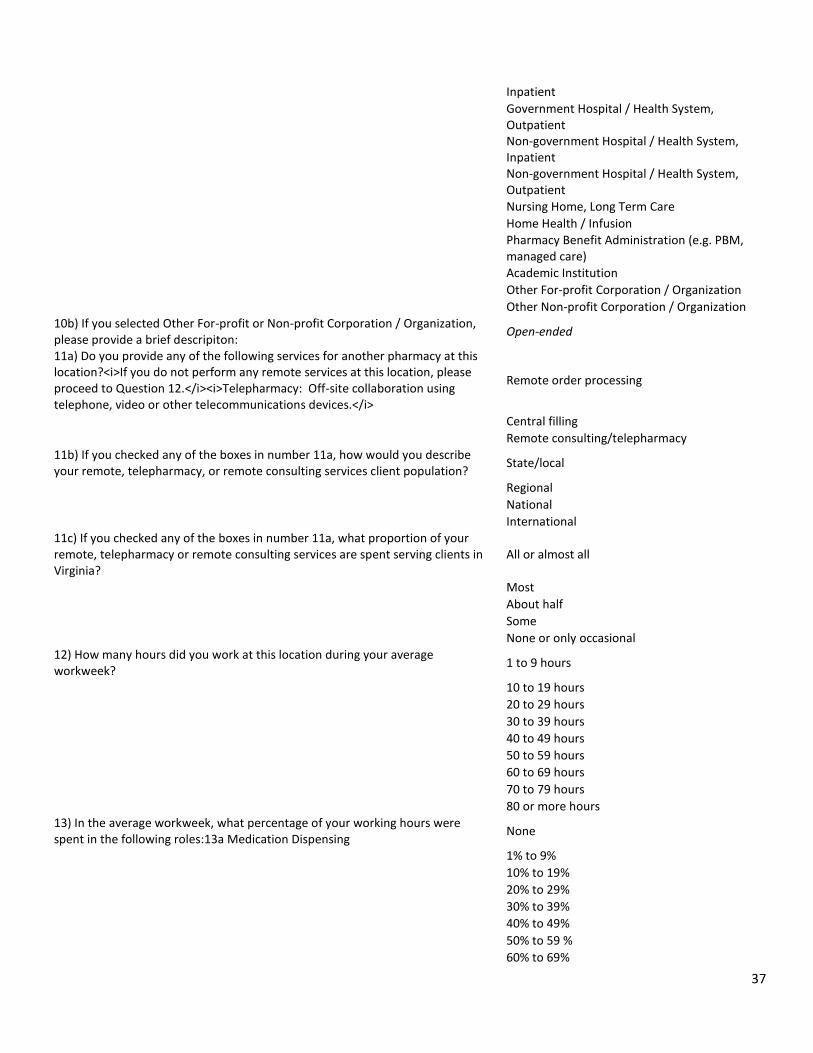
10b) If you selected Other For-profit or Non-profit Corporation / Organization, please provide a brief descripiton:
Open-ended
11a) Do you provide any of the following services for another pharmacy at this location?<i>If you do not perform any remote services at this location, please proceed to Question 12.</i><i>Telepharmacy: Off-site collaboration using telephone, video or other telecommunications devices.</i>
Remote order processing
Central filling
Remote consulting/telepharmacy
11b) If you checked any of the boxes in number 11a, how would you describe your remote, telepharmacy, or remote consulting services client population?
State/local
Regional
National
International
11c) If you checked any of the boxes in number 11a, what proportion of your remote, telepharmacy or remote consulting services are spent serving clients in Virginia?
All or almost all
Most
About half
Some
None or only occasional
12) How many hours did you work at this location during your average workweek?
1 to 9 hours
10 to 19 hours
20 to 29 hours
30 to 39 hours
40 to 49 hours
50 to 59 hours
60 to 69 hours
70 to 79 hours
80 or more hours
13) In the average workweek, what percentage of your working hours were spent in the following roles:13a Medication Dispensing
None
1% to 9%
10% to 19%
20% to 29%
30% to 39%
40% to 49%
50% to 59 %
60% to 69%
38
70% to 79%
80% to 89%
90% to 99%
100%
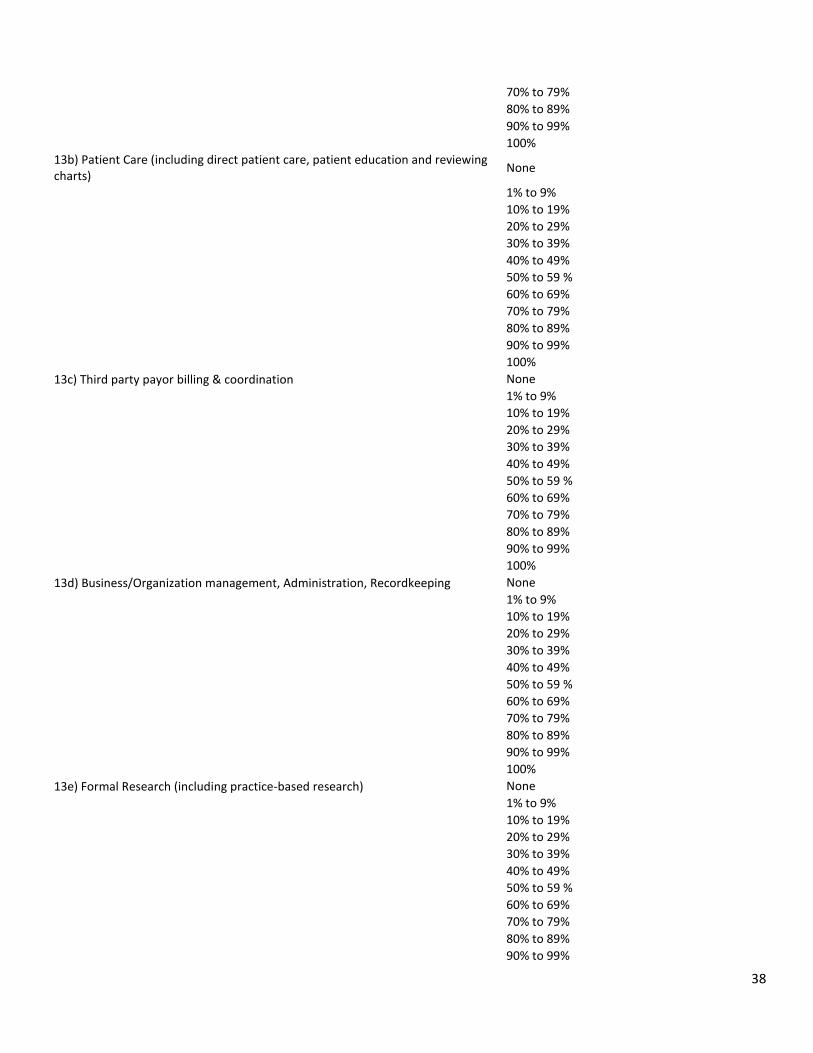
13b) Patient Care (including direct patient care, patient education and reviewing charts)
None
1% to 9%
10% to 19%
20% to 29%
30% to 39%
40% to 49%
50% to 59 %
60% to 69%
70% to 79%
80% to 89%
90% to 99%
100%
13c) Third party payor billing & coordination None
1% to 9%
10% to 19%
20% to 29%
30% to 39%
40% to 49%
50% to 59 %
60% to 69%
70% to 79%
80% to 89%
90% to 99%
100%
13d) Business/Organization management, Administration, Recordkeeping None
1% to 9%
10% to 19%
20% to 29%
30% to 39%
40% to 49%
50% to 59 %
60% to 69%
70% to 79%
80% to 89%
90% to 99%
100%
13e) Formal Research (including practice-based research) None
1% to 9%
10% to 19%
20% to 29%
30% to 39%
40% to 49%
50% to 59 %
60% to 69%
70% to 79%
80% to 89%
90% to 99%

39
100%
13f) Education (including preceptoring) None
1% to 9%
10% to 19%
20% to 29%
30% to 39%
40% to 49%
50% to 59 %
60% to 69%
70% to 79%
80% to 89%
90% to 99%
100%
13g) Other None
1% to 9%
10% to 19%
20% to 29%
30% to 39%
40% to 49%
50% to 59 %
60% to 69%
70% to 79%
80% to 89%
90% to 99%
100%
14) How are you paid for your services at your primary work location? Check all that apply
Salary
Hourly wage
Profits (owner/part owner)
Volunteer/Not paid
15) Do you currently receive reimbursements for non-dispensing services such as medication therapy management at this location? If you only have one practice location, please skip to question 25. If you have additional practice locations, please continue.
Open-ended
Secondary Practice Setting<i>Question 16 through Question 23 refer to your secondary place of employment, work or practice. This is the place where you spend the second most work hours during an average workweek, or where you spent the second most weeks working in the past 12 months. Please use these questions to describe a particular work location, not an employer. Temporary or traveling workers who can identify a second location where he or she spends or spent a significant amout of time should use this as his or her secondary work location. Persons who consistently work in multiple locations (i.e. temporary workers, locum tenens) should indicate this in Question 16.</i> 16) Please select the location of your secondary place of employment, work or practice:
List of VA counties
Several localities (temporary, mobile clinic, etc.)
Outside of US
Virginia Border State/DC
Other US State
17) Approximate number of weeks at which at least some time was spent at this work location within the past twelve months (exclude vacation, medical leave, etc.)
1 - 52 weeks
18a) Please select the type of practice setting: Independent Community Pharmacy (1-4 stores)
Small Chain Community Pharmacy (5-10
40
stores)
Large Chain Community Pharmacy (11+ stores)
Mass Merchandiser (i.e. Big Box Store)
Supermarket Pharmacy
Clinic-Based Pharmacy
Mail Service Pharmacy
Government Hospital / Health System, Inpatient
Government Hospital / Health System, Outpatient
Non-government Hospital / Health System, Inpatient
Non-government Hospital / Health System, Outpatient
Nursing Home, Long Term Care
Home Health / Infusion
Pharmacy Benefit Administration (e.g. PBM, managed care)
Academic Institution
Other For-profit Corporation / Organization
Other Non-profit Corporation / Organization
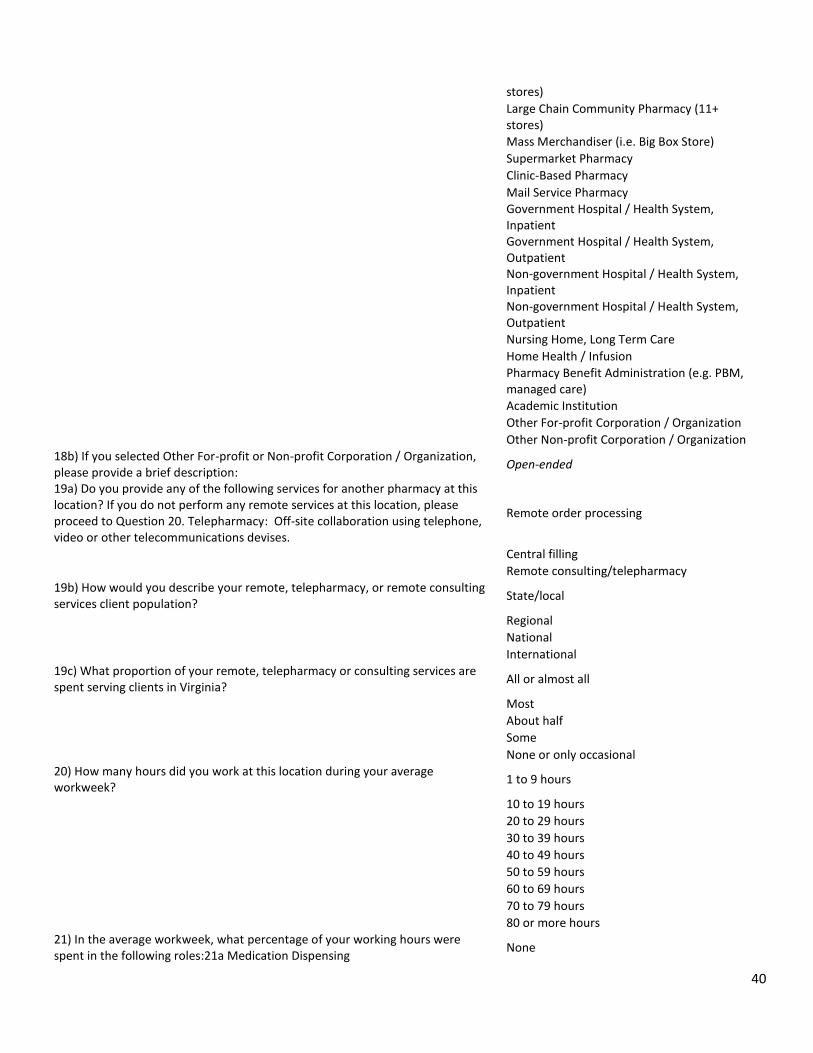
18b) If you selected Other For-profit or Non-profit Corporation / Organization, please provide a brief description:
Open-ended
19a) Do you provide any of the following services for another pharmacy at this location? If you do not perform any remote services at this location, please proceed to Question 20. Telepharmacy: Off-site collaboration using telephone, video or other telecommunications devises.
Remote order processing
Central filling
Remote consulting/telepharmacy
19b) How would you describe your remote, telepharmacy, or remote consulting services client population?
State/local
Regional
National
International
19c) What proportion of your remote, telepharmacy or consulting services are spent serving clients in Virginia?
All or almost all
Most
About half
Some
None or only occasional
20) How many hours did you work at this location during your average workweek?
1 to 9 hours
10 to 19 hours
20 to 29 hours
30 to 39 hours
40 to 49 hours
50 to 59 hours
60 to 69 hours
70 to 79 hours
80 or more hours
21) In the average workweek, what percentage of your working hours were spent in the following roles:21a Medication Dispensing
None

41
1% to 9%
10% to 19%
20% to 29%
30% to 39%
40% to 49%
50% to 59 %
60% to 69%
70% to 79%
80% to 89%
90% to 99%
100%
21b) Patient Care (including direct patient care, patient education and reviewing charts)
None
1% to 9%
10% to 19%
20% to 29%
30% to 39%
40% to 49%
50% to 59 %
60% to 69%
70% to 79%
80% to 89%
90% to 99%
100%
21c) Third party payor billing & coordination None
1% to 9%
10% to 19%
20% to 29%
30% to 39%
40% to 49%
50% to 59 %
60% to 69%
70% to 79%
80% to 89%
90% to 99%
100%
21d) Business/Organization management, Administration, Recordkeeping None
1% to 9%
10% to 19%
20% to 29%
30% to 39%
40% to 49%
50% to 59 %
60% to 69%
70% to 79%
80% to 89%
90% to 99%
100%
21e) Formal Research (including practice-based research) None
1% to 9%
10% to 19%
20% to 29%
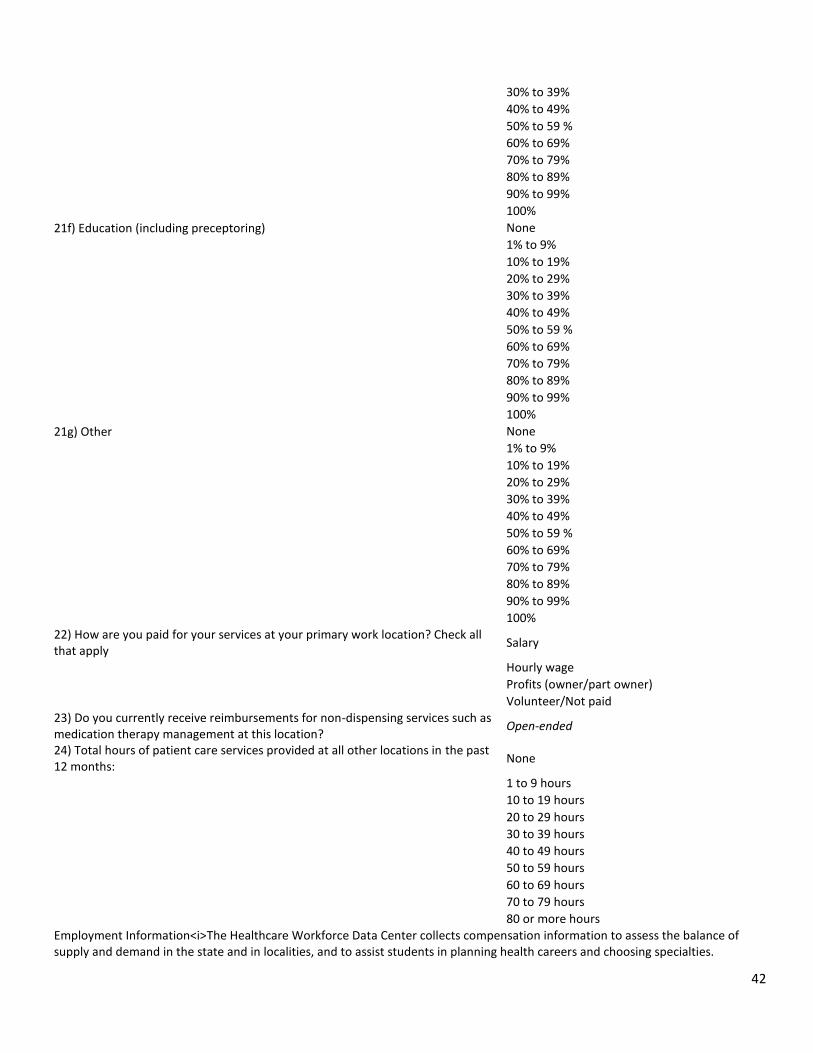
42
30% to 39%
40% to 49%
50% to 59 %
60% to 69%
70% to 79%
80% to 89%
90% to 99%
100%
21f) Education (including preceptoring) None
1% to 9%
10% to 19%
20% to 29%
30% to 39%
40% to 49%
50% to 59 %
60% to 69%
70% to 79%
80% to 89%
90% to 99%
100%
21g) Other None
1% to 9%
10% to 19%
20% to 29%
30% to 39%
40% to 49%
50% to 59 %
60% to 69%
70% to 79%
80% to 89%
90% to 99%
100%
22) How are you paid for your services at your primary work location? Check all that apply
Salary
Hourly wage
Profits (owner/part owner)
Volunteer/Not paid
23) Do you currently receive reimbursements for non-dispensing services such as medication therapy management at this location?
Open-ended
24) Total hours of patient care services provided at all other locations in the past 12 months:
None
1 to 9 hours
10 to 19 hours
20 to 29 hours
30 to 39 hours
40 to 49 hours
50 to 59 hours
60 to 69 hours
70 to 79 hours
80 or more hours
Employment Information<i>The Healthcare Workforce Data Center collects compensation information to assess the balance of supply and demand in the state and in localities, and to assist students in planning health careers and choosing specialties.

43
Information from the questions will only be presented in the aggregate. The confidentiality of information for these and all questions is protected by law. All questions are voluntary.</i>
25) Within the past 12 months, have you: Check all that apply Ceased working for an employer or practice?
Begun working for a new employer or practice?
Transferred to a new work location with the same employer or practice?
26) Do you perform or participate in any of the following activities? Check all that apply
Provide immunizations
Participate in a collaborative practice agreement
Precept pharmacy students
Use multi-setting Electronic Health Records
Participate in Virginia’s Prescription Monitoring Program
CLIA waived laboratory tests
Other laboratory tests or diagnostics
Sterile compounding
Nonsterile compounding
Telepharmacy/Remote Consulting
27) What is your estimated hourly income from your work as a Pharmacist over the past 12 months?
Volunteer work only
$12/hr or less
$12.01-$24.00/hr
$24.01-$36.00/hr
$36.01-$48.00/hr
$48.01-$60.00hr
$60.01-$72.00/hr
$72.01-$84.00/hr
$84.01-$96.00/hr
$96.01-$108.00/hr
$108.01-$120.00/hr
$120.01-$132.00/hr
$132.01-$144.00/hr
>$144.00/hr
28) Do you receive any of the following benefits from your current employer(s)? Check all that apply
Paid Vacation
Paid Sick Leave
Paid Disability Leave
Health Insurance
Dental Insurance
Stock options
Retirement (401k, Pension, etc.)
Group Life Insurance
Signing/retention bonus
No Benefits
29) What is your estimated current educational debt? None
$10,000 or less
$10,001-$20,000
$20,001-$30,000
$30,001-$40,000
$40,001-$50,000

44
$50,001-$60,000
$60,001-$70,000
$70,001-$80,000
$80,001-$90,000
$90,001-$100,000
$100,001-$110,000
$110,001-$120,000
>$120,000
30) At what age do you predict you will retire? Under age 50
50 to 54
55 to 59
60 to 64
65 to 69
70 to 74
75 to 79
80 or over
I do not intend to retire
31) Within the next two years do you plan to do any of the following: Check all that apply
Retire
Cease working in the field of Pharmacy.
Continue working or teaching in the field of Pharmacy, but cease doing so in Virginia
Increase hours working in patient care and/or medical dispensing
Decrease hours working in patient care and/or medical dispensing
Increase time spent teaching pharmacy students in an academic setting
Decrease time spent teaching pharmacy students in an academic setting
Pursue additional pharmacy-related education
Begin precepting pharmacy students
Cease precepting pharmacy students
32) Within the next five years do you plan to do any of the following: Check all that apply
Retire
Cease working in the field of Pharmacy.
Continue working or teaching in the field of Pharmacy, but cease doing so in Virginia
Increase hours working in patient care and/or medical dispensing
Decrease hours working in patient care and/or medical dispensing
Increase time spent teaching pharmacy students in an academic setting
Decrease time spent teaching pharmacy students in an academic setting
Pursue additional pharmacy-related education
Begin precepting pharmacy students
Cease precepting pharmacy students
Demographic Questions33) Year of Birth 1996 --> 1920
34) Sex Male

45
Female
Please select the items that best describe your race/ethnicity. Please answer both question 35a about Hispanic origin and 35b about race/ethnicity.35a) Select One:
Hispanic, Latino or Spanish origin
Not Hispanic, Latino or Spanish origin
Prefer not to respond
35b) Select all that apply: American Indian of Alaska Native
Asian
Black or African American
Native Hawaiian or Other Pacific Islander
White
Some other race
Prefer not to respond
35c) If some other race, please describe: Fill in the blank
End of Questionnaire for active Pharmacists. Please click the “submit” button below to complete the survey. Thank you! If you answered "No" to Question 7, please continue. 36 If you did not practice or teach pharmacy within the past twelve months, did/are you. . .? Check all that apply:
I am retired.
Practice occasionally for charity/consultation/special patients?
Pursue specialty education?
Pursue non-pharmacy education?
Work in another profession?
Experience temporary voluntary unemployment (including for medical reasons)?
Experience temporary involuntary unemployment?
37) Do you expect to begin working in the pharmacy field in Virginia? If so, when?
Not currently planning to practice/work in Virginia.
Yes, within the next year
Yes, within 1-2 years
Yes, within 3-5 years
Yes, in more than 5 years
Yes, do not know when

46
Appendix D: The 2012 Pharmacist Workforce Survey
While striving to maintain continuity, the HWDC continuously improves its surveys based on results of previous surveys. The HWDC has adopted a standard survey template to serve as the basis of all of its workforce surveys. The 2012 Pharmacy Survey incorporates standard survey template and includes elements specific to the Pharmacist survey. Please note that the survey appears online through our licensing renewal system. The final appearance of the survey for practitioners is dictated by this system. The HWDC may make additional changes before implementing the 2012 survey.
Pharmacist Survey Instructions:
The following survey will assist policymakers at the state, federal and local levels assess the adequacy of the current pharmacist workforce and project future workforce trends in relation to Virginia's changing population and health needs. It will help us advance the practice of pharmacy and to improve the health of all Virginians. By law, information collected as part of this survey is confidential. License numbers and other individually identifying information are removed from Healthcare Workforce Data Center data sets. The Healthcare Workforce Data Center only releases information in the aggregate or to qualified research organizations who meet our strict confidentiality standards. Participation in this survey is voluntary.
The survey questions are designed to allow comparisons across professions, and among state and federal data collection efforts. Some of the questions, particularly demographic questions, match Federal data collection standards.
Education and Background
1) Year of Birth: Dropdown: 1996 to 1920 (reverse order)
2) Sex: Dropdown: Male/Female
Please select the items that best describe your race/ethnicity. Please answer both question 3a about Hispanic origin and 3b about race/ethnicity.
3a) Select one: Check one
Hispanic, Latino or Spanish Origin
Not Hispanic, Latino or Spanish Origin
3b) Select all that apply: Check all that apply
White
Black or African American
American Indian or Alaska Native
Asian
Native Hawaiian or Pacific Islander
Some other race
3c) If some other race, please specify: Fill in the blank
4) Where did you graduate from high school (Secondary School)? Dropdown
Outside of the US or Canada
Canada
57 US States and Territories
5) Was your childhood spent mostly in rural, urban or suburban areas? Dropdown: urban, rural, suburban

47
6 Where did you obtain your undergraduate degree? Dropdown
Did not obtain an undergraduate degree
Outside of the US or Canada
Canada
57 US States and Territories
7) Where did you obtain the degree that initially qualified you to practice pharmacy? Dropdown
Outside of the US or Canada
Canada
57 US States and Territories
8) Please indicate the highest level of pharmacist education you have completed as of today: Dropdown
BS Pharm
PharmD
9) Do you hold an active license to practice pharmacy in any other jurisdiction? Check all that apply
District of Columbia
Kentucky
Maryland
North Carolina
Tennessee
West Virginia
One or more other US states
Please indicate any residencies you have completed as of today:
Note: The list here is structured to match the current ASHP residency structure. General and clinical residencies were consolidated in 1993 into "pharmacy practice". The current PGY1/PGY2 structure was adopted in 2005. For those who completed residencies prior to these dates, please select the residency from either PGY1 or PGY2 that best matches your residency.
10a) PGY1: Dropdown
Community Pharmacy
Managed Care Pharmacy
Pharmacy Practice (Post 1993)
Pharmacy Practice (Pre-1993--Health Systems, Ambulatory Care, Clincal, etc.)
Other
10b) PGY2: Dropdown
Ambulatory Care
Cardiology
Critical Care
Drug Information
Emergency Medicine

48
Geriatrics
Health-system Pharmacy Administration
Infectious Disease
Informatics
Internal Medicine
Managed Care Pharmacy Systems
Medication Safety
Nuclear
Nutrition Support
Oncology
Palliative Care
Pediatrics
Pharmacogenetics
Pharmacotherapy
Psychiatry
Solid Organ Transplant
Other
10c) If you selected "other" for either residency, please provide a brief description and indicate whether the residency was PGY1 or PGY2: Open-ended
11a) Please indicate any Board Certifications for pharmacy you have attained as of today: Check all that apply
BPS-Ambulatory Care
BPS-Nuclear Pharmacy
BPS-Nutrition
BPS-Oncology
BPS- Pharmacotherapy
BPS-Psychiatric
CCGP-Geriatrics
ABAT-Applied Toxicology
11b Please indicate any other (non-Board) certifications for pharmacy you have attained as of today: Check all that apply
Ambulatory Care
Nuclear Pharmacy
Nutrition
Oncology
Pharmacotherapy
Psychiatric
Geriatrics
Applied Toxicology
Diabetic Educator
Anticoagulation
Immunization
Current Employment Status
12 Which choice best describes your current employment or Dropdown

49
work situation?
I am currently employed in a pharmacy related capacity.
I am currently employed, but not in a pharmacy related capacity.
I am retired.
I am currently voluntarily unemployed (including for medical reasons).
I am currently involuntarily unemployed.
13) Overall, and taking into account all positions you fill, how satisfied are you with your current employment or work situation? Dropdown
Very satisfied
Somewhat satisfied
Somewhat dissatisfied
Very dissatisfied
14) How many positions do you currently hold? Dropdown
One part-time position
One full-time position
Two part-time positions
One full-time position & one part-time position
Two full-time positions
More than two positions
15) Considering all postions you currently fill, how long is your average workweek? Dropdown
I am not currently working
1 to 9 hours
10 to 19 hours
20 to 29 hours
30 to 39 hours
40 to 49 hours
50 to 59 hours
60 to 69 hours
70 to 79 hours
80 or more hours
Unless otherwise noted, the rest of the questions draws on your experiences over the past 12 months. If you did not work in the past 12 months in a capacity that drew on your pharmacy background, please skip to question 41.
Primary Work Location

50
Question 16 through Question 23 refer to your primary place of employment, work or practice, including volunteer work, over the past 12 months. This is the location where you spend the most work hours during an average workweek, or where you spent the most weeks working in the past 12 months. You do not need to currently work at this location. These questions describe a particular work location, not an employer. Temporary or traveling workers who spend or spent a significant amount of time at a particular location should use that location as his or her primary work location. Persons who consistently work in multiple locations (i.e. temporary workers, locum tenens) should choose the location where they spent the most time or where they are based. When answering these question, please consider the entire 12 month period.
16) Please select the location of your primary place of employment, work, volunteer work or practice:
Dropdown:
Outside of US
Virginia Border State/DC
Other US State
List of Virginia's Cities and Counties
17) How long have you worked at this particular location? Dropdown
I do not currently work at this location
Less than 6 months
6 months to 1 year
1 to 2 years
3 to 5 years
6 to 10 years
More than 10 years
18a) Approximate number of weeks at which at least some time was spent at this work location within the past twelve months (exclude vacation, medical leave, etc):
Dropdown: 1 week - 52 weeks
18b) How many hours do you (or did you) work in an average workweek at this location? Dropdown
1 to 9 hours
10 to 19 hours
20 to 29 hours
30 to 39 hours
40 to 49 hours
50 to 59 hours
60 to 69 hours
70 to 79 hours
80 or more hours
19)
In the average workweek at this location, roughly what percentage of your working hours were spent in the following roles: (Answers should roughly equate to 100%).
Dropdown: (for each sub-question)
19a) Medication Dispensing None
19b) Patient Care (including direct patient care, patient education and reviewing charts) 1% to 9%
19c) Third party payor billing & coordination 10% to 19%
19d) Business/Organization management, Administration, Recordkeeping 20% to 29%
19e) Formal Research (including practice-based research) 30% to 39%

51
19f) Education (including preceptoring) 50% to 59 %
19g) Other 60% to 69%
70% to 79%
80% to 89%
90% to 99%
100%
20a) Please select the choice that best describes this location's organizational sector: Dropdown
For-profit (e.g. private, corporate)
Non-profit (including religious affiliated)
State/local-government
US military
Veteran's Administration
Other federal government
20b) Please select the choice that best describes this practice setting: Dropdown:
Independent Community Pharmacy (1-4 stores)
Small Chain Community Pharmacy (5-10 stores)
Large Chain Community Pharmacy (11+ stores)
Mass Merchandiser (i.e. Big Box Store)
Supermarket Pharmacy
Clinic-Based Pharmacy
Mail Service Pharmacy
Hospital / Health System, Inpatient
Hospital / Health System, Outpatient
Nursing Home, Long Term Care
Home Health / Infusion
Pharmacy Benefit Administration (e.g. PBM, managed care)
Academic Institution
Other
20c)
If you selected "other practice setting" please provide a brief description: Open-ended
21) Please indicate how you are (were) personally compensated for activities at this location: Dropdown
Salary
Hourly wage
Per Diem
Business/contractor profits
Volunteer, unreimbursed
22) Do you currently receive reimbursements for non-dispensing services such as medication therapy management at this location? Dropdown yes/no

52
23a)
Do you provide any of the following services for another pharmacy at this location? If you do not perform any remote services at this location, please proceed to Question 24. Telepharmacy: Off-site collaboration using telephone, video or other telecommunications devices. Remote order processing
Central filling
Remote consulting/telepharmacy
23b) If you checked any of the boxes in Question 23a, how would you describe your remote, telepharmacy, or remote consulting services client population? State/local
Regional
National
International
23c) If you checked any of the boxes in Question 23a, what proportion of your remote, telepharmacy or remote consulting services are spent serving clients in Virginia? All or almost all
Most
About half
Some
None or only occasional
If you only had one practice location in the past 12 months, please skip to question 35. If you had additional practice locations, please continue.
Secondary Work Location
Question 24 through Question 32 refer to your secondary place of work or practice, including volunteer work, over the past 12 months. This is the location where you spend the second most work hours during an average workweek, or where you spent the second most weeks working in the past 12 months. You do not need to currently work at this location. These questions describe a particular work location, not an employer. Temporary or traveling workers who spend or spent a significant amount of time at a secondary location should use that location as his or her secondary work location. Persons who consistently worked in multiple locations (i.e. temporary workers, locum tenens) in addition to a primary location should choose the secondary location where they spent the most time or where they are based. When answering these question, please consider the entire 12 month period.
24) Is this location with the same employer or practice as your primary location, or a different employer/practice? Dropdown
Same employer or practice
Different employer or practice
25) Please select the location of your primary place of employment, work, volunteer work or practice:
Dropdown:
Outside of US
Virginia Border State/DC
Other US State
List of Virginia's Cities and Counties
26) How long have you worked at this particular location? Dropdown

53
I do not currently work at this location
Less than 6 months
6 months to 1 year
1 to 2 years
3 to 5 years
6 to 10 years
More than 10 years
27a) Approximate number of weeks at which at least some time was spent at this work location within the past twelve months (exclude vacation, medical leave, etc):
Dropdown: 1 week - 52 weeks
27b) How many hours do you (or did you) work in an average workweek at this location? Dropdown
1 to 9 hours
10 to 19 hours
20 to 29 hours
30 to 39 hours
40 to 49 hours
50 to 59 hours
60 to 69 hours
70 to 79 hours
80 or more hours
28)
In the average workweek at this location, roughly what percentage of your working hours were spent in the following roles: (Answers should roughly equate to 100%).
Dropdown: (for each sub-question)
28a) Medication Dispensing None
28b) Patient Care (including direct patient care, patient education and reviewing charts) 1% to 9%
28c) Third party payor billing & coordination 10% to 19%
28d) Business/Organization management, Administration, Recordkeeping 20% to 29%
28e) Formal Research (including practice-based research) 30% to 39%
28f) Education (including preceptoring) 50% to 59 %
28g) Other 60% to 69%
70% to 79%
80% to 89%
90% to 99%
100%
29a) Please select the choice that best describes this location's organizational sector: Dropdown
For-profit (e.g. private, corporate)
Non-profit (including religious affiliated)
State/local-government
US military
Veteran's Administration
Other federal government
29b) Please select the choice that best describes this practice Dropdown:

54
setting:
Independent Community Pharmacy (1-4 stores)
Small Chain Community Pharmacy (5-10 stores)
Large Chain Community Pharmacy (11+ stores)
Mass Merchandiser (i.e. Big Box Store)
Supermarket Pharmacy
Clinic-Based Pharmacy
Mail Service Pharmacy
Hospital / Health System, Inpatient
Hospital / Health System, Outpatient
Nursing Home, Long Term Care
Home Health / Infusion
Pharmacy Benefit Administration (e.g. PBM, managed care)
Academic Institution
Other
29c) If you selected "other practice setting" please provide a brief description: Open-ended
30) Please indicate how you are (were) personally compensated for activities at this location: Dropdown
Salary
Hourly wage
Per Diem
Business/contractor profits
Volunteer, unreimbursed
31) Do you currently receive reimbursements for non-dispensing services such as medication therapy management at this location? Dropdown yes/no
32a)
Do you provide any of the following services for another pharmacy at this location? If you do not perform any remote services at this location, please proceed to Question 33. Telepharmacy: Off-site collaboration using telephone, video or other telecommunications devices. Remote order processing
Central filling
Remote consulting/telepharmacy
32b) If you checked any of the boxes in Question 32a, how would you describe your remote, telepharmacy, or remote consulting services client population? State/local
Regional
National
International

55
32c) If you checked any of the boxes in Question 32a, what proportion of your remote, telepharmacy or remote consulting services are spent serving clients in Virginia? All or almost all
Most
About half
Some
None or only occasional
If you had only two locations in the past 12 months, please skip to question 35. If you had additional practice locations, please continue.
33) How many total work locations have you had over the past 12 months? Dropdown
3
4
5
6 or more
34) How many work locations do you have currently? Dropdown
3
4
5
6 or more
Employment Information
The Healthcare Workforce Data Center collects compensation information to assess the balance of supply and demand in the state and in localities, and to assist students in planning health careers and choosing specialties. Information from these questions will only be presented in the aggregate. The confidentiality of information for these and all questions is protected by law. All questions are voluntary.
35) Within the past 12 months, have you experienced any of the following: Check all that apply
Voluntary unemployment (including for medical reasons)?
Involuntary unemployment (including for medical reasons)?
Switched employers/practices?
Worked part-time or temporary positions, but would have preferred a full-time or permanent position?
Worked two or more positions at the same time?
36) What is your estimated annual net income from pharmacy-related activities? Dropdown:
Volunteer work only
$20.00/hr or less
$20.01 to $30.00/hr
$30.01 to $40.00/hr
$40.01 to $45.00/hr
$45.01 to $50.00/hr
$50.01 to $55.00/hr

56
$55.01 to $60.00/hr
$60.01 to $65.00/hr
$65.01 to $70.00/hr
$70.01 to $75.00/hr
$75.01 to $80.00/hr
More than $80.00/hr
37) Do you receive any of the following benefits from any current employer? Check all that apply:
Paid Vacation Leave
Paid Sick Leave
Health Insurance
Dental Insurance
Retirement (401k, Pension, etc.)
Group Life Insurance
Signing/retention bonus
38) What is your estimated current educational debt? Dropdown:
None
$10,000 or less
$10,001-$20,000
$20,001-$30,000
$30,001-$40,000
$40,001-$50,000
$50,001-$60,000
$60,001-$70,000
$70,001-$80,000
$80,001-$90,000
$90,001-$100,000
$100,001-$110,000
$110,001-$120,000
More than $120,000
39) At what age do you plan to retire from pharmacy? Dropdown
Under age 50
50 to 54
55 to 59
60 to 64
65 to 69
70 to 74
75 to 79
80 or over
I do not intend to retire
40) Within the next two years do you plan to do any of the following: Check all that apply
Retire
Cease working in pharmacy
Continue working in pharmacy, but cease working in Virginia

57
Increase patient care hours
Decrease patient care hours
Increase time spent teaching pharmacy
Decrease time spent teaching pharmacy
Pursue additional pharmacy education
End of Questionnaire for active practitioners-Thank you!
41) If you did not practice, teach or otherwise work in pharmacy within the past twelve months, did/are you. . .? Check all that apply:
I am retired.
Work occasionally for charity/consultation/special patients?
Pursue pharmacy education or certifications?
Pursue education not related to pharmacy?
Work in another profession or field?
Experience temporary voluntary unemployment (including for medical reasons)?
Experience temporary involuntary unemployment?
42) Do you provide any pharmacy-related volunteer, mentoring or other services in Virginia? If so, approximately how many hours in the past year? Dropdown:
None
1-25 hours
26-50 hours
51-75 hours
76-100 hours
Over 100 Hours
43) Do you expect to begin working in Pharmacist in Virginia? If so, when? Dropdown:
Not currently planning to practice/work in Virginia
Plan to practice/work in a volunteer capacity
Yes, within the next year
Yes, within 1-2 years
Yes, within 3-5 years
Yes, in more than 5 years
Yes, do not know when
End of Questionnaire-Thank you!