virginia housing development authority housing’s impact on local government finance meeting of the...
TRANSCRIPT

Virginia Housing Development Authority
Housing’s Impact onHousing’s Impact onLocal Government FinanceLocal Government Finance
Meeting of the Virginia GovernmentFinance Officers Association
Virginia Beach, VirginiaJune 9, 2011

2
vhda.com | 800-227-VHDA
Impact of Home Values on Local Revenue Streams

3
vhda.com | 800-227-VHDA
Housing is a critical directgenerator of local tax revenues.
• In FY08, over half (50.7%) of local revenues in Virginia were derived from real property taxes.*
• In 2009, 71.2 percent of the assessed real property in Virginia was single-family homes and 4.8 percent was multifamily residential property.**
• Together, these data show that the assessed value of residential property accounts for fully 38 percent of local tax bases.
*Staff, Virginia Commission on Local Governments
**John Knapp, Weldon Cooper Center for Public Service, UVA based on unpublished VA Dept. of Taxation data provided by Josh Silverman in Nov. 2010

4
vhda.com | 800-227-VHDA
Local tax bases benefitedsubstantially from the housing boom.
• Rising residential property values drove local revenue increases during the past decade.
• Unfortunately, this short-term increase in local tax bases was unsustainable.
Source: John Knapp, Weldon Cooper Center for Public Service, UVA
Increase in VirginiaTaxable Assessed Value by
Type of Property, 2000 to 2006
149%
92%
68%
61%
Single-Family
Residential
MultifamilyResidential
Commerical
Agricultural

5
vhda.com | 800-227-VHDA
Housing is not leading the economyout of recession as it has in the past.
• Historically, the lowering of interest rates during a recession stimulated housing construction and home purchase, which then led economic recovery by increasing jobs and retail sales.
• This time, the inventory of distressed homes and tightened lending standards are stifling housing construction and home sales.
• In addition, the sharp drop in home equity is putting a damper on retail sales.

6
vhda.com | 800-227-VHDA
Lack of a housing recovery is retarding local economic and revenue growth.
• With housing as a drag rather than a stimulus, the economy is struggling to regain momentum.
• Limited employment growth is reinforcing a vicious cycle in which:
– Loss of income puts more homeowners into foreclosure and increases the inventory of distressed properties.
– Weak home sales reinforce price declines, which in turn put more homeowners “underwater.”
– That increases the risk of loan defaults and foreclosures, and further depresses consumer confidence and willingness to spend.
• Local tax revenues will not revive until more progress is made in a housing recovery.

7
vhda.com | 800-227-VHDA
Current Market Trends

8
vhda.com | 800-227-VHDA
Home sales have fallen to a 13-year low following the end of the federal tax credit.
Source: Virginia Association of Realtors (VAR)
• Existing home sales appear once again to be bottoming out.
• However, sales are unlikely to see any meaningful rebound until employment increases and home prices fully stabilize.
Virginia Existing Home Sales4-Quarter Rolling Average
15,000
20,000
25,000
30,000
35,000
40,000
98-1
99-1
00-1
01-1
02-1
03-1
04-1
05-1
06-1
07-1
08-1
09-1
10-1
11-1
Calendar Year Quarter
3rd Qtr 2005
- 45%
Federal Homebuyer
Tax Credit

9
vhda.com | 800-227-VHDA
Prices are still declining in most markets, and NoVA’s earlier rebound has ended.
Source: Federal Housing Finance Agency (FHFA) Home Price Index
Annual Change in Metropolitan Home Prices1st Qtr 2010 to 1st Qtr 2011
-5.4%
-5.1%
-4.0%
-2.2%
-1.6%
-1.5%
-1.1%
-0.5%
0.7%
-0.9%
Richmond
Harrisonburg
Hampton Roads
Virginia
Washington, Winchester & Lynchburg
Roanoke
Charlottesville
Kingsport-Bristol
Blacksburg
Danville
VIRGINIA

10
vhda.com | 800-227-VHDA
Prices, especially in Northern Virginia,remain significantly below their peak.
Source: Federal Housing Finance Agency (FHFA) Home Price Index
Metropolitan Home Prices Relative to Their Peak1st Quarter 2011
-31%
-23%
-15%
-14%
-13%
-11%
-8%
-6%
-5%
-4%
Winchester
Washington, DC
Richmond
VIRGINIA
Hampton Roads
Harrisonburg
Charlottesville
Blackburg, Danville & Roanoke
Lynchburg
Kingsport-Bristol
VIRGINIA

11
vhda.com | 800-227-VHDA
In most markets, home prices are correcting to historic affordability norms.
Source: MRIS, Virginia Association of Realtors (VAR) and U.S. Census Bureau
Ratio of Median Home Price to Median Household Income
Northern Virginia Localities Downstate Metropolitan Areas
0.0 1.0 2.0 3.0 4.0 5.0 6.0
Spotsylvania
Stafford
Frederick
Pr. William
Fauquier
Loudoun
Fairfax
Arlington
Alexandria
Pre-Boom: April2000
Peak of Boom:May 2006
Current: April 2011
Traditional affordability range
0.0 1.0 2.0 3.0 4.0 5.0
Danville
Roanoke
Richmond
Lynchburg
HamptonRoads
Charlottes-ville
Pre-Boom: April 2000
Peak of Boom:2nd-4th Qtrs2007
Current: 1st Qtr 2011
Traditional affordability range

12
vhda.com | 800-227-VHDA
Experience from past recessions shows that inflation-adjusted prices recover very slowly.
Source: Federal Housing Finance Agency (FHFA) Home Price Index
Current(thru 2011-Q1)
Real Decline in Prices: -20.9% -27.3%
Peak to Trough: 7.8 Yrs. 4.3 Yrs.
Time to Regain Loss: 12.7 Yrs. ?
Real Decline in Prices: -14.5% -15.5%
Peak to Trough: 7.0 Yrs. 4.3 Yrs.
Time to Regain Loss: 15.2 Yrs. ?
Real Decline in Prices: -9.8% -20.6%
Peak to Trough: 5.5 Yrs. 4.0 Yrs.
Time to Regain Loss: 12.1 Yrs. ?
Washington MSA
Late 80's - Early 90'sHousing Downturn:
Hampton Rds MSA
Richmond MSA
13
vhda.com | 800-227-VHDA
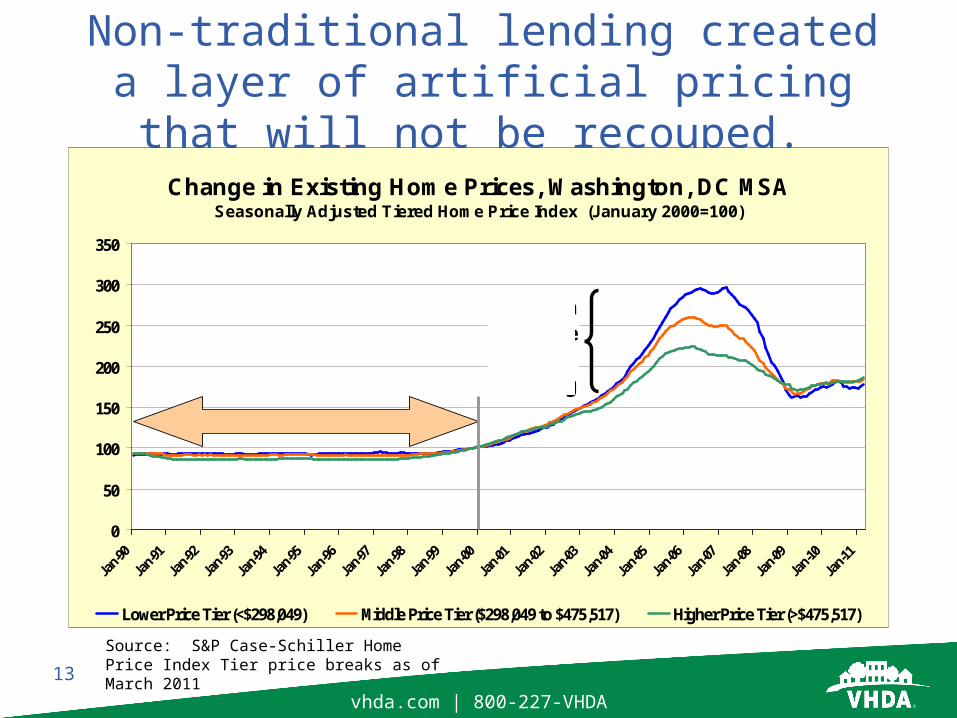
Non-traditional lending created a layer of artificial pricing that will not be recouped.
Source: S&P Case-Schiller Home Price Index Tier price breaks as of March 2011
Change in Existing Home Prices, Washington, DC MSASeasonally Adjusted Tiered Home Price Index (January 2000=100)
0
50
100
150
200
250
300
350
Lower Price Tier (<$298,049) Middle Price Tier ($298,049 to $475,517) Higher Price Tier (>$475,517)
Surge in subprimeand alt-A
lending
Decade of flat home values

14
vhda.com | 800-227-VHDA
Impact of Foreclosures
15
vhda.com | 800-227-VHDA
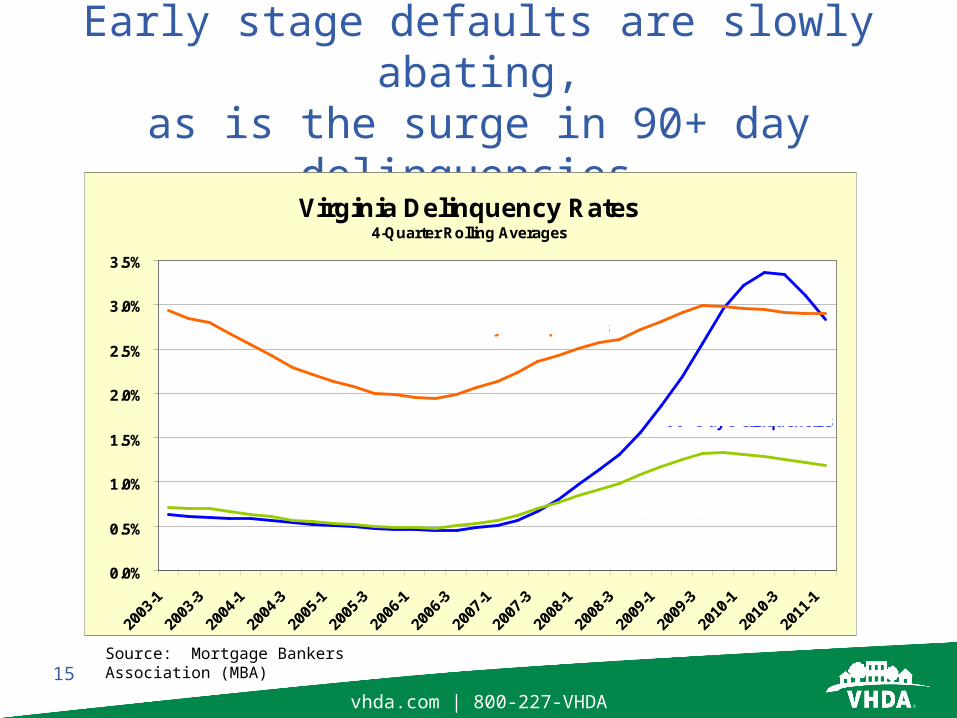
Early stage defaults are slowly abating,as is the surge in 90+ day delinquencies.
Source: Mortgage Bankers Association (MBA)
Virginia Delinquency Rates4-Quarter Rolling Averages
0.0%
0.5%
1.0%
1.5%
2.0%
2.5%
3.0%
3.5%
30 Day Delinquencies
90+ Day Delinquencies
60 Day Delinquencies

16
vhda.com | 800-227-VHDA
In contrast, initial progress in resolving foreclosures has been set back.
Source: Mortgage Bankers Association (MBA)
Virgina Loans in Foreclosureas a Share of Loans Serviced
0.00%
0.50%
1.00%
1.50%
2.00%
2.50%
17
vhda.com | 800-227-VHDA
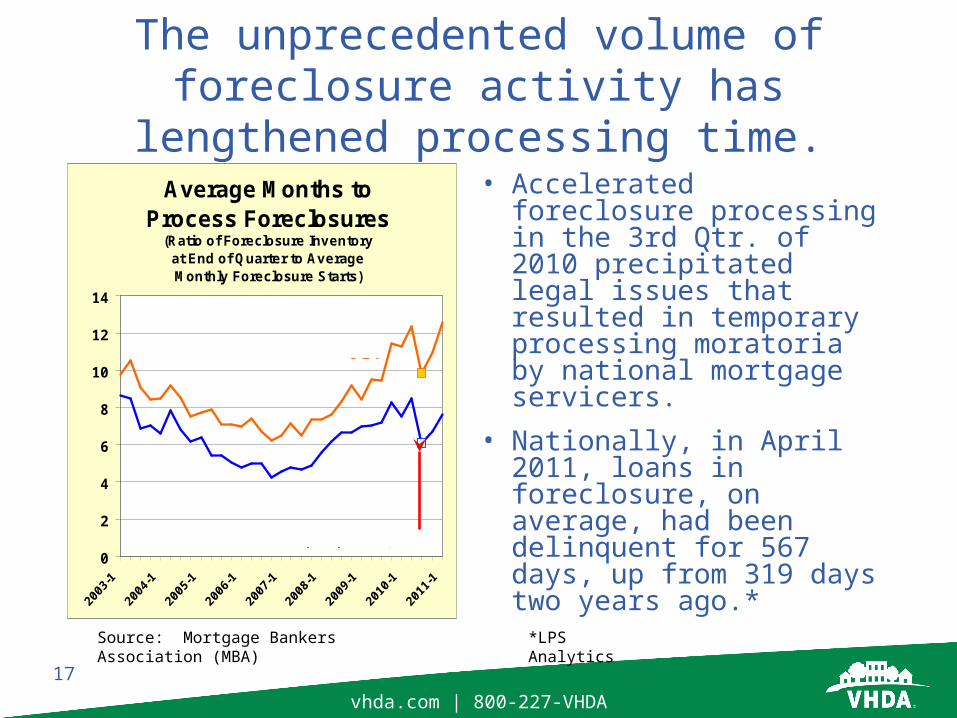
The unprecedented volume of foreclosure activity has lengthened processing time.
Source: Mortgage Bankers Association (MBA)
• Accelerated foreclosure processing in the 3rd Qtr. of 2010 precipitated legal issues that resulted in temporary processing moratoria by national mortgage servicers.
• Nationally, in April 2011, loans in foreclosure, on average, had been delinquent for 567 days, up from 319 days two years ago.*
*LPS Analytics
Average Months to Process Foreclosures
(Ratio of Foreclosure Inventoryat End of Quarter to AverageMonthly Foreclosure Starts)
0
2
4
6
8
10
12
14
U.S.
Virginia
Sharp drop in 3rd Qtr. 2010

18
vhda.com | 800-227-VHDA
Source: RealtyTrac and Census Bureau
Foreclosure completions have moderatedin the inner part of Northern VA (PD8).Now, the highest activity is in theouter part of NoVA, HamptonRoads and Richmond.
Northern Tier
Inner
Outer
Foreclosure Completions* March 2011
0.08%
0.14%
0.15%
0.30%
0.32%
0.38%
0.41%
0.45%
Southern T ier
Charlottesville-Central Valley
Roanoke-Blacksburg-Lynchburg
Northern T ier -- Inner (PD 8)
VIRGINIA
Greater Richmond
Hampton Rds-Chesapeake Bay
Northern T ier -- Outer
Share of Homes with a Mortgage
VIRGINIA
*Trustee sales and lender repossessions
Northern T ier -- Outer
Northern T ier -- Inner (PD 8)
19
vhda.com | 800-227-VHDA
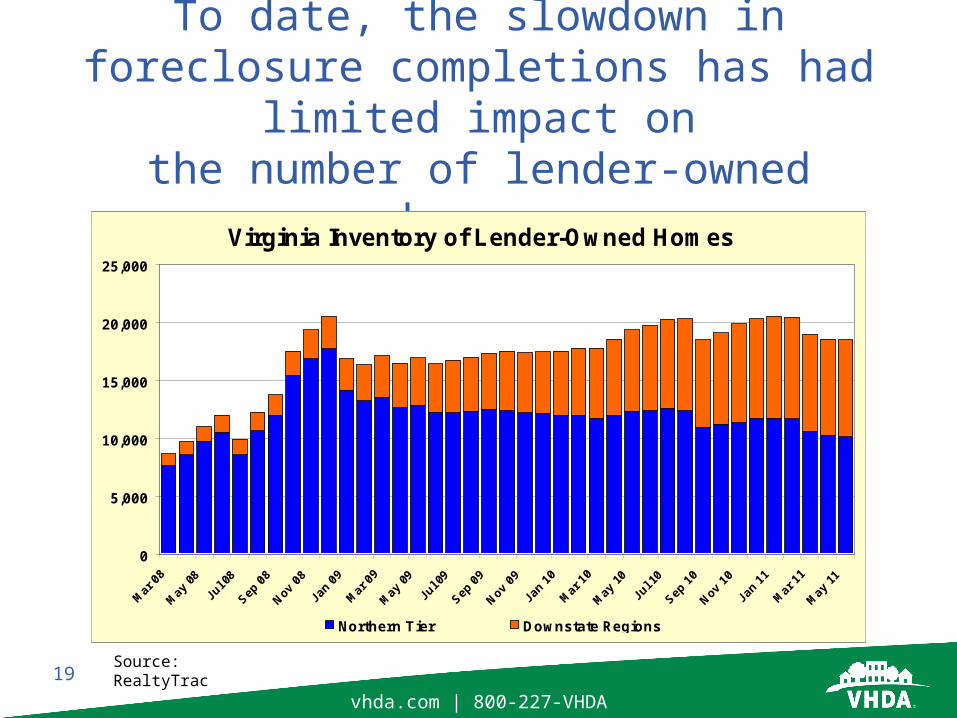
To date, the slowdown in foreclosure completions has had limited impact onthe number of lender-owned homes.
Source: RealtyTrac
Virginia Inventory of Lender-Owned Homes
0
5,000
10,000
15,000
20,000
25,000
Northern T ier Downstate Regions

20
vhda.com | 800-227-VHDA
Timely disposition of the substantiallender-owned inventory is proving difficult,
and is undermining market recovery.
• Investor sales are rising, but remain insufficient to substantially reduce lender-owned inventories.
• The increased market shares of distressed sales is undercutting prices and keeping traditional buyers and sellers on the sidelines.
• A renewed decline in home sales is reinforcing price weakness and keeping large numbers of homeowners “under water.”
• Any substantial further drop in prices would risk renewed increases in mortgage defaults and a set back in the limited progress in reducing foreclosures.

21
vhda.com | 800-227-VHDA
Investor sales are rising, but are not substantially reducing lender inventories.
Source: MRIS
Cash Sales Share of Total Existing Home SalesNorthern T ier Region
0%
5%
10%
15%
20%Feb '11 18.8%
Jan '10 17.1%
Apr '063.1%
Feb '09 15.5%

22
vhda.com | 800-227-VHDA
Inventories have risen year over year except in Northern Tier markets wherethere have been modest reductions.
Source: RealtyTrac and Census Bureau
Inventory of Lender-owned Homes
0.0% 0.5% 1.0% 1.5% 2.0% 2.5%
Southern Tier
Charlottesville-Central Valley
Roanoke-Blacksburg-Lynchburg
Greater Richmond
Virginia
Hampton Rds-Chesapeake Bay
Northern Tier -- Inner
Northern Tier -- Outer
Share of Homes w ith a Mortgage
May 30, 2010
May 30, 2011
VIRGINIA

23
vhda.com | 800-227-VHDA
Future Outlook

24
vhda.com | 800-227-VHDA
Demographic change will play adominate role in housing’s recovery.
• The housing downturn has focused attention on the impact of mortgage lending on home construction and overall market health.
• Less attention has been paid to the critical role that shifting demographics play in shaping the magnitude and nature of housing demand.
• We are now in a new a market cycle that will be heavily influenced by large shifts in housing demand driven by demographic change.
25
vhda.com | 800-227-VHDA
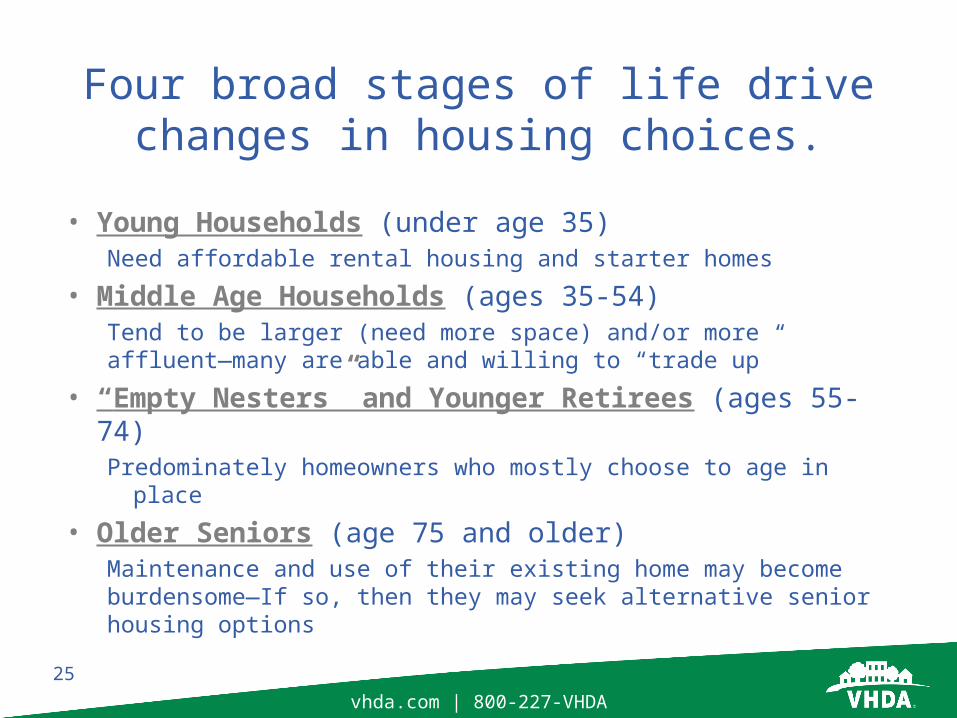
Four broad stages of life drivechanges in housing choices.
• Young Households (under age 35)Need affordable rental housing and starter homes
• Middle Age Households (ages 35-54)Tend to be larger (need more space) and/or more affluent—many are able and willing to “trade up”
• “Empty Nesters” and Younger Retirees (ages 55-74)Predominately homeowners who mostly choose to age in place
• Older Seniors (age 75 and older)Maintenance and use of their existing home may becomeburdensome—If so, then they may seek alternative seniorhousing options
26
vhda.com | 800-227-VHDA
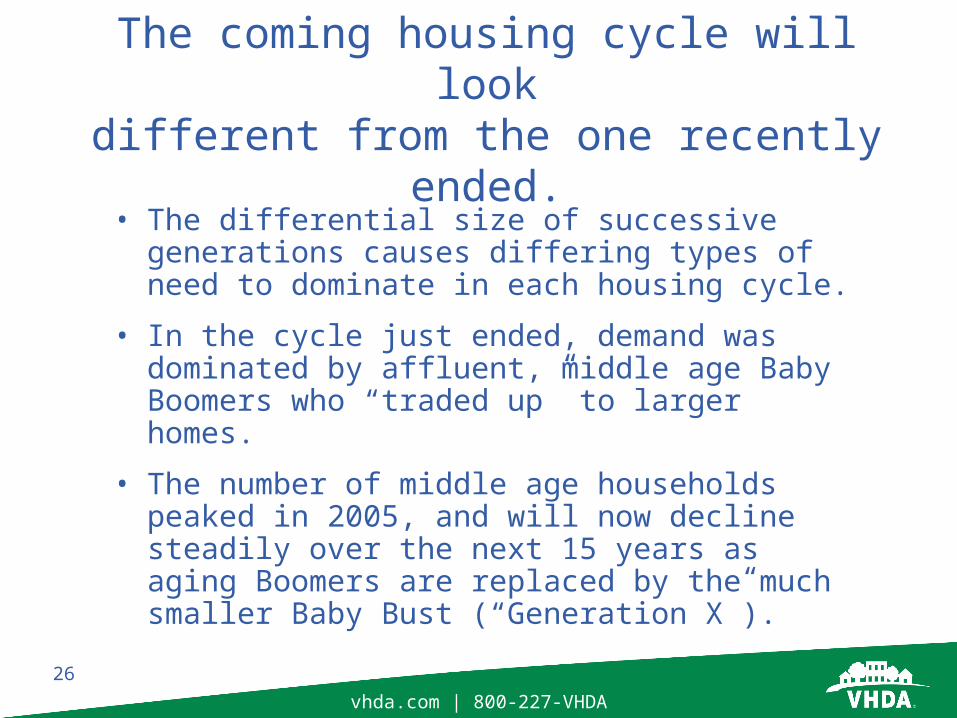
The coming housing cycle will lookdifferent from the one recently ended.
• The differential size of successive generations causes differing types of need to dominate in each housing cycle.
• In the cycle just ended, demand was dominated by affluent, middle age Baby Boomers who “traded up” to larger homes.
• The number of middle age households peaked in 2005, and will now decline steadily over the next 15 years as aging Boomers are replaced by the much smaller Baby Bust (“Generation X”).

27
vhda.com | 800-227-VHDA
The “Trade-Up” Era is Over.
We are now in a new
market cycle in which young households, empty nesters and younger retirees will dominate.
13,878
-71,103-57,707
39,604
140,322
213,561 227,529205,278
99,502
26,828 32,336 32,29748,547 50,599
20-24 25-29 30-34 35-39 40-44 45-49 50-54 55-59 60-64 65-69 70-74 75-79 80-84 85+
Young Renters &1st-Time Homebuyers
Middle AgeTrade-up Homebuyers
Empty Nester & YoungerSenior Homeowners
Older Seniors w/Special Needs
65,937
118,488109,840
17,931
-68,932-53,235
30,955
119,900
189,787 192,947
167,928
42,74732,013
63,409
20-24 25-29 30-34 35-39 40-44 45-49 50-54 55-59 60-64 65-69 70-74 75-79 80-84 85+
Estimated Population Change 1990-2005
Projected Population Change 2005-2020
Source: U.S. Census and estimates based on Census Bureau and VEC Virginia population projections

28
vhda.com | 800-227-VHDA
Today’s housing stock is notadequate to meet emerging needs.
• Relatively little starter home and new rental construction occurred in the recent housing cycle.
• Except in the fastest growing regions, existing apartments and starter homes that were vacated by Baby Boomers “trading up” to newly built larger homes, served much of the needs of Generation X.
• Now, as Generation X replaces Baby Boomers in the “trade up” market, and Generation Y forms independent households, we face an over-supply of larger “trade up” homes and a shortage of smaller affordable units.

29
vhda.com | 800-227-VHDA
Quality, affordable rental housingwill be especially needed.
• A large and growing majority of young households are renters, while middle age and older households are mostly owners.
• In the past housing cycle, a large share of rental investment involved the upgrade of existing properties.
• In the coming cycle, a larger net increase in rental units will be needed in order to accommodate the growth in young households.
Source: American Community Survey
Share of Virginia Households that Rent by Age
58%
26%
17%21%
63%
29%
17%
22%
UnderAge 35 Age 35-54 Age 55-74 Age 75 andOlder
2006 2009

30
vhda.com | 800-227-VHDA
Generation Y will likely have moredifficulty achieving homeownership.
• Over the past two decades, young households have incurred substantial debt compared to previous generations.
• Credit card debt has risen dramatically, and many are burdened by student loans.
• For the Class of 2011, student loan debt is estimated to average $22,900.
• Significant tightening of credit standards and down payment requirements will likely delay home purchase by Generation Y despite lower home prices.
$2,873 $4,358
1989 2004
+52%
Average credit card debt among households age 25 to 34 with credit card debt (2004 dollars)
Source: Survey of Consumer Finance, 1989 and 2004

31
vhda.com | 800-227-VHDA
Housing affordability will continueto be an issue in a housing recovery.
54%
95%
115%
132%
112%
74%
52%
Under 25 25 to 34 35 to 44 45 to 54 55 to 64 65 to 74 75+
Age Group
Overall Median
Median income by age as a shareof overall median household income
• In the past housing cycle, demand was concentrated in the age group with the highest income.
• Now, demand is shifting to age groups with more limited means.
• The current surplus of “trade up” homes is mismatched with future needs.
Source: 2000 Census

32
vhda.com | 800-227-VHDA
We continue to face housing challenges that require strong public/private partnerships.
• Recovery of local housing markets and real estate tax revenues will require new public land use strategies that facilitate the private development of affordable rental and ownership opportunities to meet emerging demand.
• The public sector must also help the private market address the housing inventory imbalances resulting from demographic shifts, the overhang of foreclosed inventories, and the ongoing need to revitalize aging housing stock and neighborhoods.
• Finally, federal, state and local officials will need to work in partnership to ensures the affordability of housing for all people in a manner that is fiscally sound and builds more sustainable local communities.