vii. measurement of progress toward waste reduction goals ... waste/2015draftplan... · jasar...
TRANSCRIPT
Lorain County Solid Waste Management District Draft Plan, April 30, 2015
VII-1
VII. Measurement of Progress Toward Waste Reduction Goals [ORC Section 3734.53(A)]
The Ohio EPA 1995 State Plan establishes seven goals solid waste management districts (SWMDs) are required to achieve in their solid waste management plans. These goals are as follows:
Goal # Description
#1 Ensure the availability of reduction, recycling and minimization alternatives for municipal solid waste by ensuring 90% of residents have access to curbside and drop-off programs. The District must also demonstrate that there are adequate opportunities for industrial businesses to recycle.
#2 Reduce and/or recycle at least 25% of the total waste generated by the residential/commercial sector and 50% of the total waste generated by the industrial sector.
#3 Provide informational and technical assistance on source reduction.
#4 Provide informational and technical assistance on recycling, reuse, and composting opportunities.
#5 Strategies for scrap tires and household hazardous wastes.
#6 Annual reporting of plan implementation.
#7 Market development strategy (optional).
SWMDs are encouraged to meet Goal #1 and Goal #2, but are only required to demonstrate compliance with one goal or the other. Goals #3 through #6 are mandated goals to which SWMDs must demonstrate compliance, and Goal #7 is optional. This section will cover the goal selected by the District, its progress toward achieving the goal, and plans to maintain compliance throughout the planning period.
A. Compliance with Goal #1
The District will continue to comply with Goal #1 of the 1995 State Plan, which states that the District will ensure the availability of recycling and other waste reduction methods that are alternatives to landfilling for residential/commercial solid waste.
B. Demonstration of Compliance with Goal #1
Table VII-1, Materials Designated to Demonstrate Compliance with Goal #1, presents four materials designated for the residential sector and four materials designated for the commercial/industrial sector. The four materials designated for the residential sector are newspaper, steel, aluminum and plastic containers.

Lorain County Solid Waste Management District Draft Plan, April 30, 2015
VII-2
Designated Materials for the Residential Sector
The four materials designated for the commercial/industrial sector are cardboard, office paper, aluminum containers and wooden pallets/ packaging.
Designated Materials for Commercial/Industrial Sector
1. Residential Sector
The Plan Format prescribes a formula for solid waste management districts to use to determine the percentage of the population which has access to curbside and drop-off recycling services. The types of services offered within the District are listed below and include an explanation of the population credit assigned to each type of service.
Residential Sector
Newspaper
Steel Containers
Aluminum
Plastic Containers
Commercial/ Industrial
Sector
Cardboard
Office Paper
Steel Containers
Wood Packaging & Pallets

Lorain County Solid Waste Management District Draft Plan, April 30, 2015
VII-3
Non-Subscription Curbside Recycling
A solid waste district receives 100% population credit when all residential single family households receive curbside recycling service. In order to qualify, all residents must receive the curbside recycling service whether they use the service or not. Typically, payment for the service is made by the resident to the political subdivision or directly to the hauler or by the political subdivision through local taxes.
Subscription Curbside
A solid waste district receives 25% population credit when a subscription service is offered by waste haulers operating in the political subdivision. Subscription curbside recycling is a service that is paid directly by the resident similar to a magazine subscription. The resident chooses to subscribe to a hauler that provides the recycling service. The credit for subscription service can be higher than 25% if the District can demonstrate more homes participate in the subscription service.
Recycling Drop-Offs
Credit may be taken for 2,500 persons served in a rural area and 5,000 persons served in an urban area per full service drop-off.
Rural areas are defined as any municipality or township with less than 5,000 in population. An urban area is defined as any municipality or township equal to or greater than 5,000 in population. A full service drop-off is a site that is open to the public at least 40 hours per week which manages the four materials designated for the residential sector (newspaper, steel, aluminum, and plastic). A part-time drop-off is a site that is open to the public less than 40 hours per week; however, the site is available at a regularly scheduled time at least once per month. The part-time drop-off must also handle the four materials designated for the residential sector. Credit may be taken for 2,500 persons served in a rural or urban area per part-time drop-off.
a. Service Area
The service area includes the entire District, which includes all of Lorain County and the portion of the City of Vermillion in Erie County.
Lorain County Solid Waste Management District Draft Plan, April 30, 2015
VII-4
b. Access
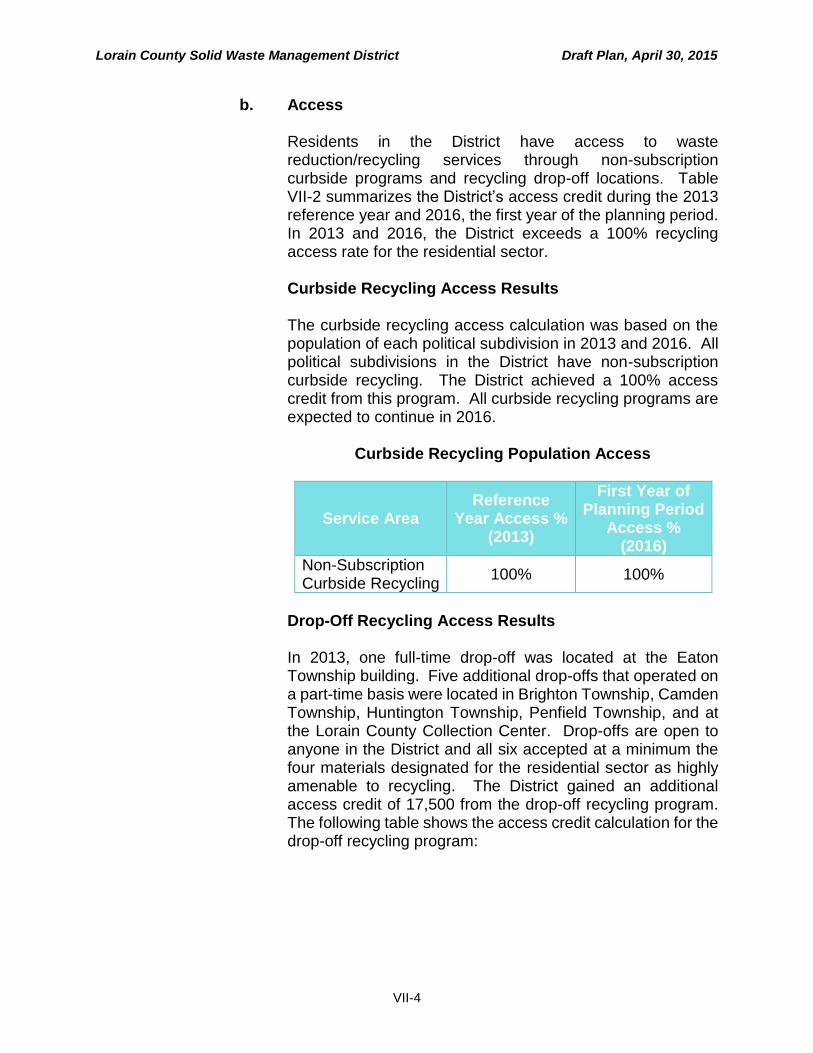
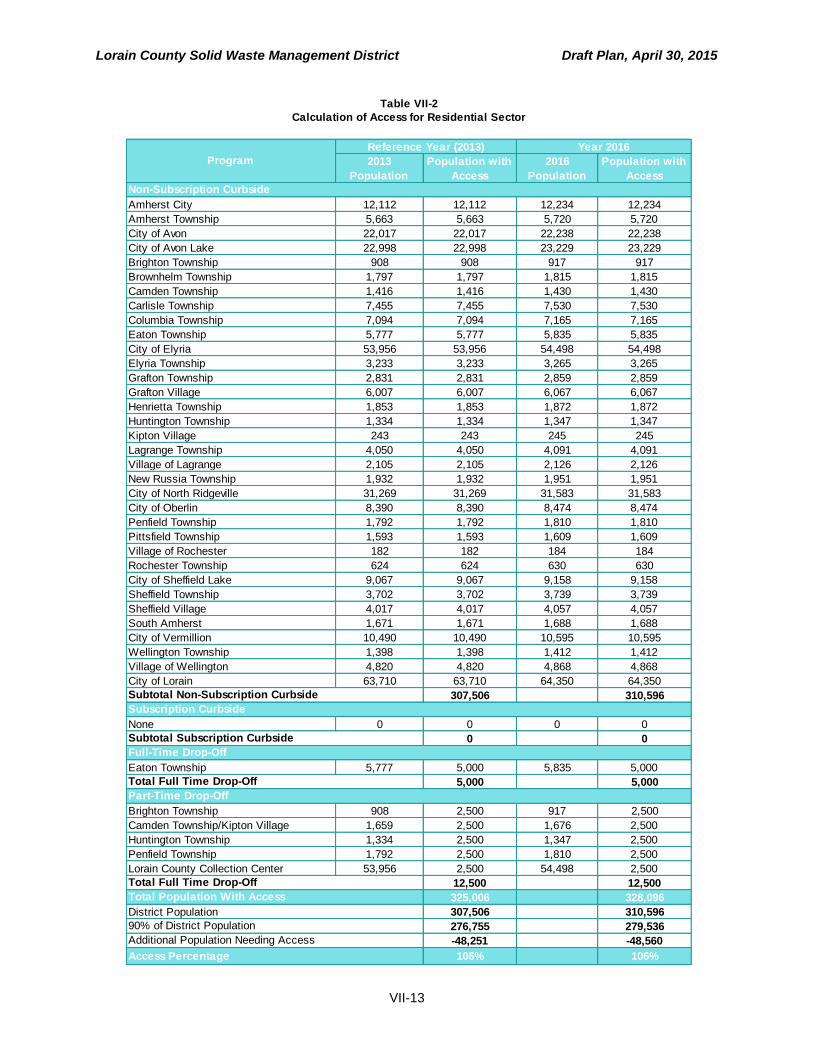
Residents in the District have access to waste reduction/recycling services through non-subscription curbside programs and recycling drop-off locations. Table VII-2 summarizes the District’s access credit during the 2013 reference year and 2016, the first year of the planning period. In 2013 and 2016, the District exceeds a 100% recycling access rate for the residential sector.
Curbside Recycling Access Results
The curbside recycling access calculation was based on the population of each political subdivision in 2013 and 2016. All political subdivisions in the District have non-subscription curbside recycling. The District achieved a 100% access credit from this program. All curbside recycling programs are expected to continue in 2016.
Curbside Recycling Population Access
Service Area Reference
Year Access % (2013)
First Year of Planning Period
Access % (2016)
Non-Subscription Curbside Recycling
100% 100%
Drop-Off Recycling Access Results
In 2013, one full-time drop-off was located at the Eaton Township building. Five additional drop-offs that operated on a part-time basis were located in Brighton Township, Camden Township, Huntington Township, Penfield Township, and at the Lorain County Collection Center. Drop-offs are open to anyone in the District and all six accepted at a minimum the four materials designated for the residential sector as highly amenable to recycling. The District gained an additional access credit of 17,500 from the drop-off recycling program. The following table shows the access credit calculation for the drop-off recycling program:

Lorain County Solid Waste Management District Draft Plan, April 30, 2015
VII-5
Drop-Off Recycling Population Access
Drop-off 2013 2016
Full-Time Population Credit Population Credit
Eaton Twp. 5,777 5,000 5,835 5,000
Part-Time Population Credit Population Credit
Brighton Twp. 908 2,500 917 2,500
Camden Twp./ Kipton Village
1,659 2,500 1,676 2,500
Huntington Twp. 1,334 2,500 1,347 2,500
Penfield Twp. 1,792 2,500 1,810 2,500
Lorain County Collection Center
53,956 2,500 54,498 2,500
Total Access Credit 17,500 17,500
Overall Recycling Access Results The District exceeded a 100% recycling access credit in the reference year. The access calculation for 2013 is as follows:
(Curbside Recycling Credit + Drop-Off Recycling Credit) ÷ District Population = Access Percentage
(307,506 + 17,500) ÷ 307,506 = 106%
All of the curbside recycling programs and drop-off locations that operated during the reference year are expected to continue through the first year in the planning period. The District will maintain an access percentage that exceeds 100% in 2016. The following figure summarizes the total population access credits and access rate in 2013 and 2016.
Overall Recycling Results
Lorain County SWMD
Reference Year (2013)
First Year of Planning
Period (2016)
Population with Access
325,006 328,096
District Population 307,506 310,597
90 Percent of Population
276,755 279,536
Percent Access 106% 106%
Lorain County Solid Waste Management District Draft Plan, April 30, 2015
VII-6
c. Participation
The strategies identified in Sections IV and V address the requirements for education and awareness to demonstrate participation. The District will continue to conduct education and awareness programs as planned. The existing education and community awareness programs meet or exceed State Plan requirements. For example, the District maintains the following:
A web site;
A comprehensive resource guide;
An inventory of available infrastructure; and
An outreach and education coordinator
d. Financial Incentives
In addition to the education and awareness programs articulated in this Plan Update, the District operates the Community Incentive Grant Program (LC-17), which provides political subdivisions with funding to maintain or improve their curbside recycling program. Communities are encouraged to use incentive grant funds to secure higher participation rates through education and awareness programs, social marketing campaigns, and equipment purchases. The District is also developing an incentive grant program for political subdivisions that aims to increase yard waste diversion (LC-35). This program is expected to begin by the first year of the planning period. The District is developing a multi-family housing unit grant (LC-38). This program is to be developed in 2016.
2. Commercial/Industrial Sector
Solid waste management districts must demonstrate that commercial and industrial generators have access to recycling or other alternative management methods for at least four materials identified in the 1995 State Solid Waste Management Plan as being highly amendable to recovery from solid waste generated by commercial and industrial generators.
a. Service Area
The service area includes Lorain County and a portion of the City of Vermilion in Erie County.
Lorain County Solid Waste Management District Draft Plan, April 30, 2015
VII-7
b. Access
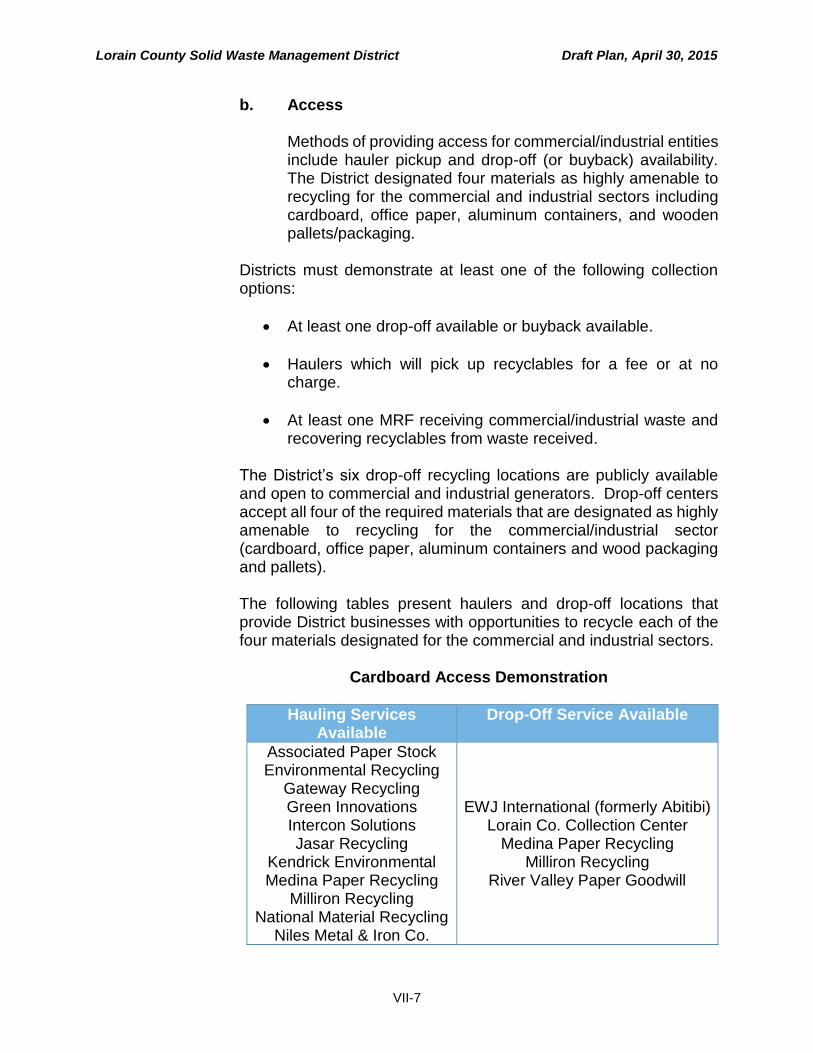
Methods of providing access for commercial/industrial entities include hauler pickup and drop-off (or buyback) availability. The District designated four materials as highly amenable to recycling for the commercial and industrial sectors including cardboard, office paper, aluminum containers, and wooden pallets/packaging.
Districts must demonstrate at least one of the following collection options:
At least one drop-off available or buyback available.
Haulers which will pick up recyclables for a fee or at no charge.
At least one MRF receiving commercial/industrial waste and recovering recyclables from waste received.
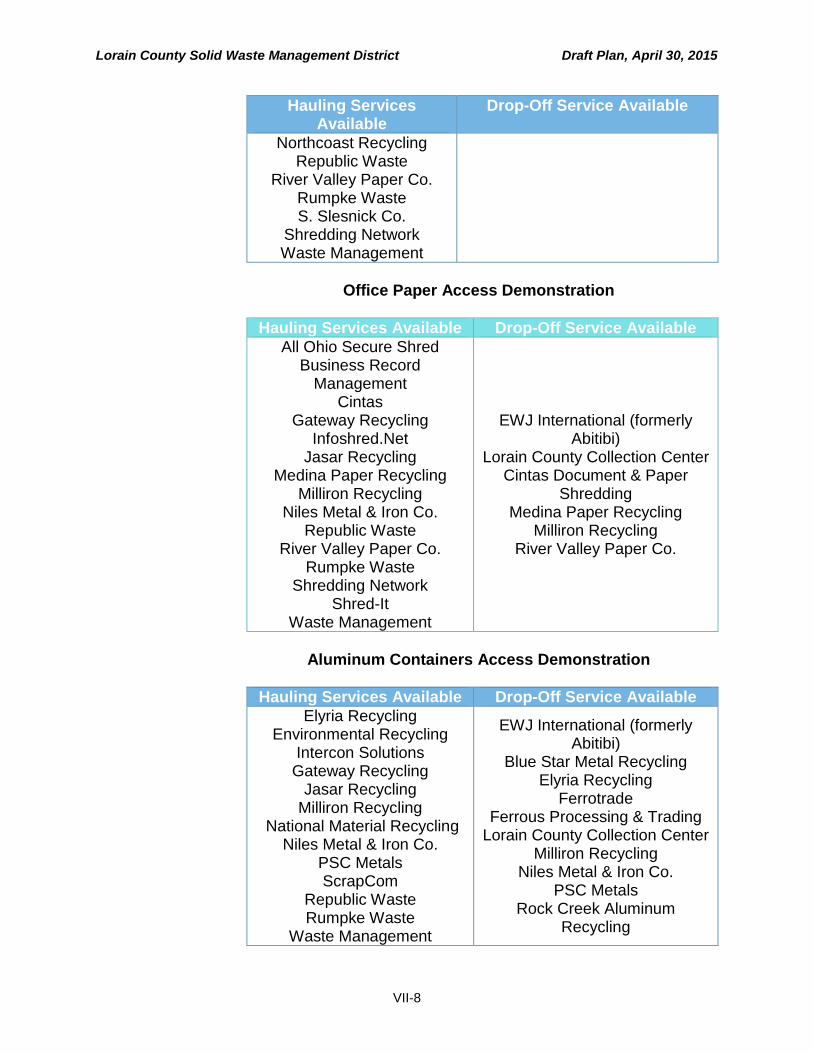
The District’s six drop-off recycling locations are publicly available and open to commercial and industrial generators. Drop-off centers accept all four of the required materials that are designated as highly amenable to recycling for the commercial/industrial sector (cardboard, office paper, aluminum containers and wood packaging and pallets). The following tables present haulers and drop-off locations that provide District businesses with opportunities to recycle each of the four materials designated for the commercial and industrial sectors.
Cardboard Access Demonstration
Hauling Services Available
Drop-Off Service Available
Associated Paper Stock Environmental Recycling
Gateway Recycling Green Innovations Intercon Solutions Jasar Recycling
Kendrick Environmental Medina Paper Recycling
Milliron Recycling National Material Recycling
Niles Metal & Iron Co.
EWJ International (formerly Abitibi) Lorain Co. Collection Center
Medina Paper Recycling Milliron Recycling
River Valley Paper Goodwill
Lorain County Solid Waste Management District Draft Plan, April 30, 2015
VII-8
Hauling Services Available
Drop-Off Service Available
Northcoast Recycling Republic Waste
River Valley Paper Co. Rumpke Waste S. Slesnick Co.
Shredding Network Waste Management
Office Paper Access Demonstration
Hauling Services Available Drop-Off Service Available
All Ohio Secure Shred Business Record
Management Cintas
Gateway Recycling Infoshred.Net
Jasar Recycling Medina Paper Recycling
Milliron Recycling Niles Metal & Iron Co.
Republic Waste River Valley Paper Co.
Rumpke Waste Shredding Network
Shred-It Waste Management
EWJ International (formerly Abitibi)
Lorain County Collection Center Cintas Document & Paper
Shredding Medina Paper Recycling
Milliron Recycling River Valley Paper Co.
Aluminum Containers Access Demonstration
Hauling Services Available Drop-Off Service Available
Elyria Recycling Environmental Recycling
Intercon Solutions Gateway Recycling
Jasar Recycling Milliron Recycling
National Material Recycling Niles Metal & Iron Co.
PSC Metals ScrapCom
Republic Waste Rumpke Waste
Waste Management
EWJ International (formerly Abitibi)
Blue Star Metal Recycling Elyria Recycling
Ferrotrade Ferrous Processing & Trading
Lorain County Collection Center Milliron Recycling
Niles Metal & Iron Co. PSC Metals
Rock Creek Aluminum Recycling
Lorain County Solid Waste Management District Draft Plan, April 30, 2015
VII-9
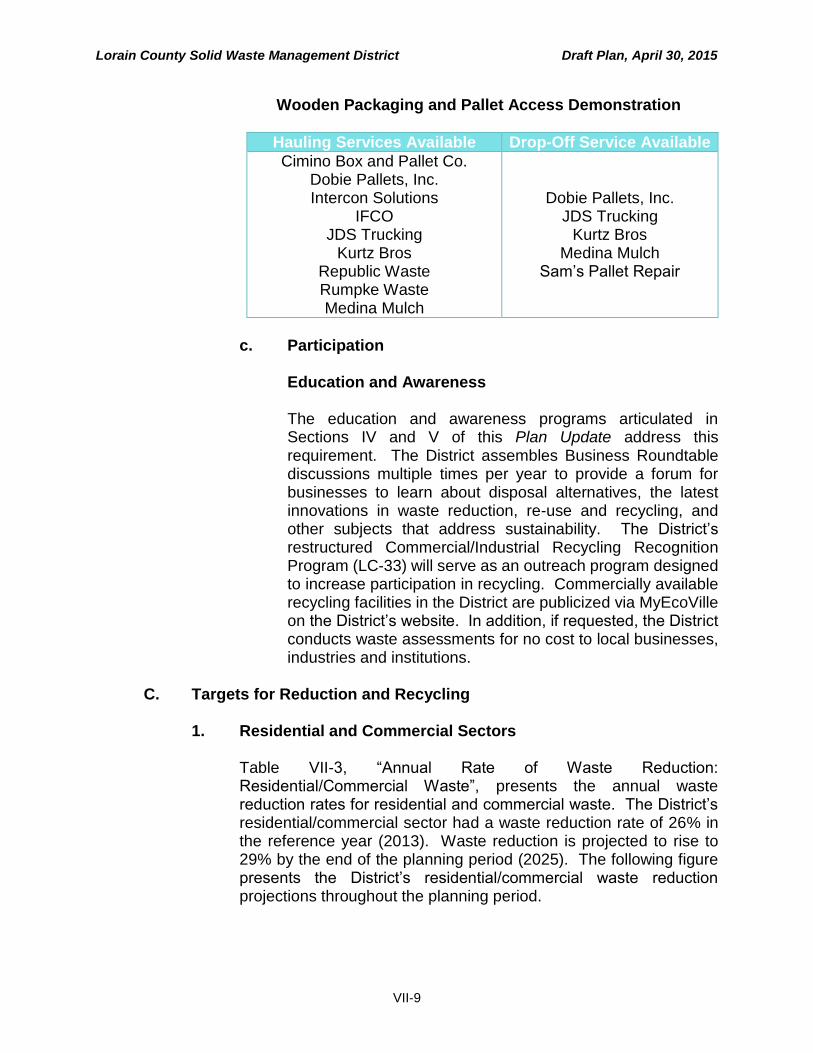
Wooden Packaging and Pallet Access Demonstration
Hauling Services Available Drop-Off Service Available
Cimino Box and Pallet Co. Dobie Pallets, Inc. Intercon Solutions
IFCO JDS Trucking
Kurtz Bros Republic Waste Rumpke Waste Medina Mulch
Dobie Pallets, Inc. JDS Trucking
Kurtz Bros Medina Mulch
Sam’s Pallet Repair
c. Participation
Education and Awareness
The education and awareness programs articulated in Sections IV and V of this Plan Update address this requirement. The District assembles Business Roundtable discussions multiple times per year to provide a forum for businesses to learn about disposal alternatives, the latest innovations in waste reduction, re-use and recycling, and other subjects that address sustainability. The District’s restructured Commercial/Industrial Recycling Recognition Program (LC-33) will serve as an outreach program designed to increase participation in recycling. Commercially available recycling facilities in the District are publicized via MyEcoVille on the District’s website. In addition, if requested, the District conducts waste assessments for no cost to local businesses, industries and institutions.
C. Targets for Reduction and Recycling
1. Residential and Commercial Sectors
Table VII-3, “Annual Rate of Waste Reduction: Residential/Commercial Waste”, presents the annual waste reduction rates for residential and commercial waste. The District’s residential/commercial sector had a waste reduction rate of 26% in the reference year (2013). Waste reduction is projected to rise to 29% by the end of the planning period (2025). The following figure presents the District’s residential/commercial waste reduction projections throughout the planning period.

Lorain County Solid Waste Management District Draft Plan, April 30, 2015
VII-10
District Residential/Commercial Waste Reduction (2013 – 2025)
The initial decrease in waste reduction from 2013 to 2014 is due to a projected decrease in yard waste. Reported yard waste totals in 2013 were higher than usual and the District projects that in 2014 the total tons managed will likely return to the County’s typical range. Programs like Zero Waste Planning (LC-31), the Yard Waste Incentive Grant (LC-35), and the Bar/Restaurant Glass Recycling program will contribute significantly to the residential/commercial sector’s increasing waste reduction percentage. The District believes the projected increase in the waste reduction rate is modest and perhaps even understated. As a point of reference, the District’s residential/commercial waste reduction rate has increased from 19% to 26% from the reference year of the last Plan Update in 2008 to the current reference year (2013).
2. Industrial Sector
Table VII-4, “Annual Rate of Waste Reduction: Industrial Waste,” presents the annual waste reduction rate for industrial waste. The District’s industrial sector had a waste reduction rate of 66% in the reference year (2013). The waste reduction rate target for industrial waste is projected to rise to 70% by the end of the planning period (2025). The following figure presents the District’s industrial waste reduction projections throughout the planning period.

Lorain County Solid Waste Management District Draft Plan, April 30, 2015
VII-11
District Industrial Waste Reduction (2013 – 2025)
The District projects that industrial sector disposal will decrease and recycling will increase throughout the planning period. The projections are based on trends identified from totals reported in recent ADRs.
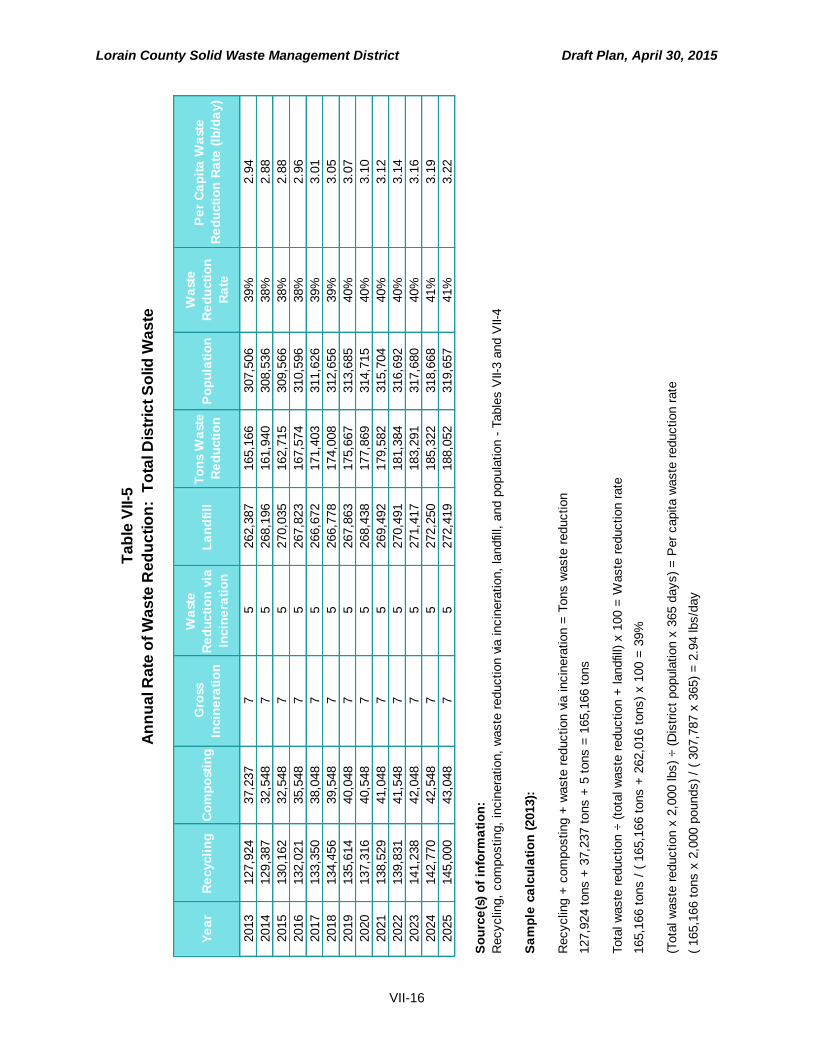
3. District Total
Table VII-5, “Annual Rate of Waste Reduction: Total District Solid Waste”, presents annual waste reduction rates for the residential/commercial and industrial sectors. The District’s annual waste reduction rate for the reference year (2013) was 39%. The waste reduction rate is expected to increase to 41% by the end of the planning period. Daily per capita waste reduction rates are expected to increase from 2.94 pounds in 2013 to 3.22 pounds in 2025. The following figure presents the District’s total waste reduction throughout the planning period.
District Total Waste Reduction Percentage (2013 – 2025)

Lorain County Solid Waste Management District Draft Plan, April 30, 2015
VII-12
Table VII-1
Materials Designated to Demonstrate Compliance with Goal #1
Materials Highly
Amenable to Recycling
Four Materials
Designated for the
Residential Sector
Four Materials
Designated for the
Commercial/Industrial
Sector
Number of Times
Materials are
Designated
Corrugated cardboard X 1
Office paper X 1
Newspaper X 1
Glass containers
Steel containers X 1
Aluminum containers X X 2
Plastic containers X 1
Wood packaging & pallets X 1
Lead-acid batteries
Major appliances
Yard wastes
Totals 4 4 8
Lorain County Solid Waste Management District Draft Plan, April 30, 2015
VII-13
Table VII-2
2013
Population
Population with
Access
2016
Population
Population with
Access
Amherst City 12,112 12,112 12,234 12,234
Amherst Township 5,663 5,663 5,720 5,720
City of Avon 22,017 22,017 22,238 22,238
City of Avon Lake 22,998 22,998 23,229 23,229
Brighton Township 908 908 917 917
Brownhelm Township 1,797 1,797 1,815 1,815
Camden Township 1,416 1,416 1,430 1,430
Carlisle Township 7,455 7,455 7,530 7,530
Columbia Township 7,094 7,094 7,165 7,165
Eaton Township 5,777 5,777 5,835 5,835
City of Elyria 53,956 53,956 54,498 54,498
Elyria Township 3,233 3,233 3,265 3,265
Grafton Township 2,831 2,831 2,859 2,859
Grafton Village 6,007 6,007 6,067 6,067
Henrietta Township 1,853 1,853 1,872 1,872
Huntington Township 1,334 1,334 1,347 1,347
Kipton Village 243 243 245 245
Lagrange Township 4,050 4,050 4,091 4,091
Village of Lagrange 2,105 2,105 2,126 2,126
New Russia Township 1,932 1,932 1,951 1,951
City of North Ridgeville 31,269 31,269 31,583 31,583
City of Oberlin 8,390 8,390 8,474 8,474
Penfield Township 1,792 1,792 1,810 1,810
Pittsfield Township 1,593 1,593 1,609 1,609
Village of Rochester 182 182 184 184
Rochester Township 624 624 630 630
City of Sheffield Lake 9,067 9,067 9,158 9,158
Sheffield Township 3,702 3,702 3,739 3,739
Sheffield Village 4,017 4,017 4,057 4,057
South Amherst 1,671 1,671 1,688 1,688
City of Vermillion 10,490 10,490 10,595 10,595
Wellington Township 1,398 1,398 1,412 1,412
Village of Wellington 4,820 4,820 4,868 4,868
City of Lorain 63,710 63,710 64,350 64,350
307,506 310,596
None 0 0 0 0
0 0
Eaton Township 5,777 5,000 5,835 5,000
5,000 5,000
Brighton Township 908 2,500 917 2,500
Camden Township/Kipton Village 1,659 2,500 1,676 2,500
Huntington Township 1,334 2,500 1,347 2,500
Penfield Township 1,792 2,500 1,810 2,500
Lorain County Collection Center 53,956 2,500 54,498 2,500
12,500 12,500
325,006 328,096
307,506 310,596
276,755 279,536
-48,251 -48,560
106% 106%Access Percentage
Full-Time Drop-Off
Total Full Time Drop-Off
Part-Time Drop-Off
Total Full Time Drop-Off
District Population
Total Population With Access
Additional Population Needing Access
90% of District Population
Calculation of Access for Residential Sector
Non-Subscription Curbside
Subtotal Non-Subscription Curbside
Subscription Curbside
Subtotal Subscription Curbside
Year 2016Reference Year (2013)
Program

Lorain County Solid Waste Management District Draft Plan, April 30, 2015
VII-14
Ta
ble
VII-3
An
nu
al R
ate
of
Wa
ste
Re
du
cti
on
: R
es
ide
nti
al/C
om
me
rcia
l W
as
te
Ye
ar
Re
cycli
ng
Co
mp
ost
ing
Gro
ss
Incin
era
tio
n
Wa
ste
Re
du
cti
on
via
Incin
era
tio
n
La
nd
fill
To
tal
Wa
ste
Re
du
cti
on
Po
pu
lati
on
Wa
ste
Re
du
cti
on
Ra
te (
%)
Pe
r C
ap
ita
Wa
ste
Re
du
cti
on
Ra
te
(lb
/da
y)
2013
37,3
36
37,2
37
75
214,5
29
74,5
77
307,5
06
26%
1.3
3
2014
38,4
37
32,5
48
75
220,9
12
70,9
89
308,5
36
24%
1.2
6
2015
38,8
47
32,5
48
75
223,3
19
71,4
00
309,5
66
24%
1.2
6
2016
40,3
41
35,5
48
75
221,6
67
75,8
94
310,5
96
26%
1.3
4
2017
41,3
04
38,0
48
75
221,0
71
79,3
56
311,6
26
26%
1.4
0
2018
42,0
41
39,5
48
75
221,7
24
81,5
93
312,6
56
27%
1.4
3
2019
42,8
30
40,0
48
75
223,3
49
82,8
82
313,6
85
27%
1.4
5
2020
44,1
60
40,5
48
75
224,4
58
84,7
13
314,7
15
27%
1.4
7
2021
45,0
01
41,0
48
75
226,0
40
86,0
54
315,7
04
28%
1.4
9
2022
45,9
29
41,5
48
75
227,5
60
87,4
81
316,6
92
28%
1.5
1
2023
46,9
60
42,0
48
75
229,0
01
89,0
13
317,6
80
28%
1.5
4
2024
48,1
15
42,5
48
75
230,3
44
90,6
67
318,6
68
28%
1.5
6
2025
49,9
66
43,0
48
75
231,0
15
93,0
18
319,6
57
29%
1.5
9
So
urc
e(s
) o
f in
form
ati
on
:
Recyclin
g,
com
posting,
incin
era
tion,
and landfil
l to
nnage -
Table
VI-2
Gro
ss incin
era
tion a
nd w
aste
reduction v
ia incin
era
tion -
Table
VI-1
Popula
tion -
Table
V-1
Sa
mp
le c
alc
ula
tio
ns
(2013):
Recyclin
g +
com
posting +
waste
reduction v
ia incin
era
tion =
Tota
l w
aste
reduction
37,3
36 t
ons +
37,2
37 t
ons +
5 t
ons =
74,5
77 t
ons
Tota
l w
aste
reduction ÷
(to
tal w
aste
reduction +
landfil
l) x
100 =
Waste
reduction r
ate
74,5
77 t
ons /
( 7
4,5
77 t
ons +
214,5
29 t
ons)
x 1
00 =
26%
(Tota
l w
aste
reduction x
2,0
00 lbs)
÷ (
Dis
tric
t popula
tion x
365 d
ays)
= P
er
capita w
aste
reduction r
ate
( 74,5
77 t
ons x
2,0
00 p
ounds)
/ (
307,5
06 x
365)
= 1
.33 lbs/d
ay

Lorain County Solid Waste Management District Draft Plan, April 30, 2015
VII-15
Year Recycling Landfill Population
Waste
Reduction
Rate (%)
Per Capita Waste
Reduction Rate
(lb/day)
2013 90,589 47,858 307,506 65% 1.61
2014 90,951 47,284 308,536 66% 1.62
2015 91,315 46,716 309,566 66% 1.62
2016 91,680 46,156 310,596 67% 1.62
2017 92,047 45,602 311,626 67% 1.62
2018 92,415 45,055 312,656 67% 1.62
2019 92,785 44,514 313,685 68% 1.62
2020 93,156 43,980 314,715 68% 1.62
2021 93,528 43,452 315,704 68% 1.62
2022 93,902 42,931 316,692 69% 1.62
2023 94,278 42,415 317,680 69% 1.63
2024 94,655 41,906 318,668 69% 1.63
2025 95,034 41,404 319,657 70% 1.63
Source(s) of information:
Recycling and landfill data - Table VI-3
Population - Table V-1
Sample calculation (2013):
Recycling ÷ (recycling + landfill) x 100 = Waste reduction rate
90,589 tons ÷ ( 90,589 tons + 47,503 tons) x 100 = 66%
( 90,589 tons x 2,000 pounds) ÷ ( 307,787 x 365) = 1.61 lbs/day
Annual Rate of Waste Reduction: Industrial Waste
Table VII-4
Recycling x 2,000 pounds ÷ (district population x 365 days) = Per capita waste
Lorain County Solid Waste Management District Draft Plan, April 30, 2015
VII-16
Ta
ble
VII-5
An
nu
al R
ate
of
Wa
ste
Re
du
cti
on
: T
ota
l D
istr
ict
So
lid
Wa
ste
Ye
ar
Re
cycli
ng
Co
mp
ost
ing
Gro
ss
Incin
era
tio
n
Wa
ste
Re
du
cti
on
via
Incin
era
tio
n
La
nd
fill
To
ns
Wa
ste
Re
du
cti
on
Po
pu
lati
on
Wa
ste
Re
du
cti
on
Ra
te
Pe
r C
ap
ita
Wa
ste
Re
du
cti
on
Ra
te (
lb/d
ay)
2013
127,9
24
37,2
37
75
262,3
87
165,1
66
307,5
06
39%
2.9
4
2014
129,3
87
32,5
48
75
268,1
96
161,9
40
308,5
36
38%
2.8
8
2015
130,1
62
32,5
48
75
270,0
35
162,7
15
309,5
66
38%
2.8
8
2016
132,0
21
35,5
48
75
267,8
23
167,5
74
310,5
96
38%
2.9
6
2017
133,3
50
38,0
48
75
266,6
72
171,4
03
311,6
26
39%
3.0
1
2018
134,4
56
39,5
48
75
266,7
78
174,0
08
312,6
56
39%
3.0
5
2019
135,6
14
40,0
48
75
267,8
63
175,6
67
313,6
85
40%
3.0
7
2020
137,3
16
40,5
48
75
268,4
38
177,8
69
314,7
15
40%
3.1
0
2021
138,5
29
41,0
48
75
269,4
92
179,5
82
315,7
04
40%
3.1
2
2022
139,8
31
41,5
48
75
270,4
91
181,3
84
316,6
92
40%
3.1
4
2023
141,2
38
42,0
48
75
271,4
17
183,2
91
317,6
80
40%
3.1
6
2024
142,7
70
42,5
48
75
272,2
50
185,3
22
318,6
68
41%
3.1
9
2025
145,0
00
43,0
48
75
272,4
19
188,0
52
319,6
57
41%
3.2
2
So
urc
e(s
) o
f in
form
ati
on
:
Recyclin
g,
com
posting,
incin
era
tion,
waste
reduction v
ia incin
era
tion,
landfil
l, a
nd p
opula
tion -
Table
s V
II-3 a
nd V
II-4
Sa
mp
le c
alc
ula
tio
n (
2013):
Recyclin
g +
com
posting +
waste
reduction v
ia incin
era
tion =
Tons w
aste
reduction
127,9
24 t
ons +
37,2
37 t
ons +
5 t
ons =
165,1
66 t
ons
Tota
l w
aste
reduction ÷
(to
tal w
aste
reduction +
landfil
l) x
100 =
Waste
reduction r
ate
165,1
66 t
ons /
( 1
65,1
66 t
ons +
262,0
16 t
ons)
x 1
00 =
39%
(Tota
l w
aste
reduction x
2,0
00 lbs)
÷ (
Dis
tric
t popula
tion x
365 d
ays)
= P
er
capita w
aste
reduction r
ate
( 165,1
66 t
ons x
2,0
00 p
ounds)
/ (
307,7
87 x
365)
= 2
.94 lbs/d
ay