· web viewthe subsequent flushing of the soil columns with distilled water, following the...
TRANSCRIPT
Mobilization of arsenic, lead, and mercury under conditions of sea water intrusion and road
deicing salt application
Hongbing Suna,1 , John Alexandera, Brita Govea, Manfred Kochb
aDepartment of Geological, Environmental, and Marine Sciences, Rider University,
Lawrenceville, New Jersey, USA. 1Corresponding Author’s Email: [email protected] of Geotechnology and Geohydraulics, University of Kassel, Kurt-Wolters Str.
34109 Kassel, Germany
ABSTRACT
Water geochemistry data from complexly designed salt-solution injection experiments in the
laboratory, coastal aquifers of Bangladesh and Italy, taken from the literature, and two salted
watersheds of New Jersey, US were collected and analyzed to study the geochemical
mechanisms that mobilize As, Pb, and Hg under varied salting conditions. Overall, increased
NaCl-concentrations in aquifers and soil are found to increase the release of Pb and Hg into the
water. Reducing environments and possible soil dispersion by hydrated Na+ are found to lead to
an increase of As-concentration in water. However, the application of a pure NaCl salt solution
in the column injection experiment was found to release less As, Pb, and Hg initially from the
soil and delay their concentration increase, when compared to the application of CaCl2 and
NaCl mixed salts (at 6:4 weight ratio). The concentration correlation dendrogram statistical
analyses of the experimental and field data suggest that the release of As, Hg, and Pb into
groundwater and the soil solution depends not only on the salt level and content, but also on
the redox condition, dissolved organic matter contents, competitiveness of other ions for
exchange sites, and source minerals. With the ongoing over-exploration of coastal aquifers from
increased pumping, continued sea-level rise, and increased winter deicing salt applications in
salted watersheds of many inland regions, the results of this study will help understand the
complex relation between the concentrations of As, Pb, and Hg and increased salt level in a
coastal aquifer and in soils of a salted watershed.
1
Keywords: Mobilization mechanism of As, Pb, Hg; groundwater, sea water intrusion; deicing
salt.
1. Introduction
Arsenic(As), lead (Pb), and Mercury (Hg ) are three of the most concerned toxic metals in
a water system. High As-concentrations in water can cause permanent damage to the
ecosystem and are carcinogenic to people (Barringer et al. 2007; Smedley and Kinniburg 2002).
Pb accumulation in the food chain can result in a negative neurocognitive outcome for animals
and people (Datko-Williams et al. 2014). Elevated concentrations of Hg also have detrimental
effects on microbes and invertebrates (Rundgren et al. 1992; Tipping et al. 2010).
With increased salt encroachment into the coastal aquifer due to the rising sea levels as
well as groundwater over-pumping, and increased winter deicing salt applications in northern
watersheds, many previous studies have expressed concerns with regard to the release of the
overall prevalent trace metals Cd, Cu, Pb, Hg, and Zn to the supply of drinking water, owing to
the elevated salt concentration in a coastal aquifer and growing use of deicing salt in
watersheds in northern US, Europe, and Canada (Grassi and Netti 2000; Protano et al., 2000;
Barringer et al. 2007; Amrhein et al. 1994; Amrhein and Strong 1990; Backstrom et al. 2004;
Bauske and Goetz 1993; Kelly et al., 2008; Nelson et al. 2009; Norrström and Jacks 1998). The
causes of elevated trace metal concentrations, in response to the increased salt concentrations,
have been attributed to cation exchange, and the presence of Cl and organic complexes
(Amrhein et al. 1994; Nelson et al. 2009; Brady and Weil, 2008).
Previous studies generally separated the water quality change due to salt water
intrusion and deicing salt application. Those studies largely focused on the concentration
changes of Cd, Cu, Pb, and Zn in groundwater and soil solution in response to varied salt
conditions (Backstrom et al. 2004; Menzies and Jacks 1998; Nelson et al. 2009; Norrstrom and
Jacks 1998). There is an apparent lack of studies on the combined geochemical mechanisms
that mobilize As, Pb, Hg, and other trace metals from a coastal aquifer and soils of a salted
watershed.
2
The purpose of this study is to examine the aqueous geochemical conditions that
mobilize As, Pb, and Hg from coastal aquifers and from soils in response to the seawater salt
encroachment and deicing salt applications. Our examination will include analyses of
geochemical data from the leachates of complexly designed column experiments, geochemical
data from brackish groundwater of published articles, and of our own geochemical data from
highway runoff, soil solutions, and stream water in two salted watersheds of New Jersey, US.
Complexly designed column experiments compensate the regular NaCl-salt-only-scenario with a
mixed CaCl2- and NaCl- salting scenario as it is common in coastal aquifers and is increasingly
common in inland regions of the northern hemisphere where deicing salt is applied.
Arsenopyrite (FeAsS) and galena (PbS) minerals were added into two of the experimental soil
columns to mimic an elevated source of As and Pb in an aquifer.
The results of this study will help to understand the geochemistry of As, Pb, and Hg
release from coastal aquifers into groundwater and from salted watersheds to stream water. As
such, the results of this study hopefully will provide further crucial evidence for recognizing the
increased threat of As, Pb, and Hg to the health of a water system in a salting environment
(Nelson et al. 2009; Rundgren et al. 1992; Tipping et al. 2010).
The paper is structured as follows. It will start with the presentation of the laboratory set-
ups and the experimental results. Then tt will proceeded with the statistical analysis of the
coastal-water-quality data of Bangladesh and Italy taken from the literature , followed by the
presentation of our field methods applied to the analysis of of runoff water samples, off the I-95
interstate, stream water from the Delaware river at Trenton, and soil solutions from lysimeters
installed along the banks of the sampled stream sections. The paper concludes with a discussion
on the mechanism of the As-, Pb-, and Hg-mobilizations under varied salting conditions in a
natural water system, as related to the data presented.
2. As, Pb, and Hg Chemistry in the Salt Injection Laboratory Experiment
The salt injection batch experiment with regular and arsenopyrite and galena enhanced
soil columns under controlled condition can help better understand the relations between
concentrations of As, Pb, and Hg and varied salt environments.
3

2.1. Injection of pure NaCl into regular and mixed arsenopyrite and galena soil columns
NaCl is the most common salt in ground water in a coastal aquifer and the most
common winter de-icing salt used in the northern hemisphere due to its effectiveness and low
cost.
2.1.1 Experimental setup
Four columns with a diameter of 5.08 cm (2 inches) and height of 30.5 cm each were
filled with about 480 grams of loamy soil collected from A and upper B horizons near the
upstream gage at the Centennial Lake Watershed (CLW), New Jersey (Figure 1). The soils used
in the four columns have an average porosity of 0.66, average hydraulic conductivity of 1.57
m/day, average pore volume of 298 cm3, and average organic matter content of 4.2% based on
the loss on ignition (LOI) method.
Two of the four soil columns contained powdered arsenopyrite (~35 grams) and galena
(~70 grams) mixture to initiate the potential elevated sources of As and Pb and to increase the
reaction kinetics. The mineral powder layers were placed at about 1/5 from the bottom of the
columns (at ~6 cm in a 30.5 cm high column). The other two columns were filled with only
regular soils and served as control columns.
The columns used the falling-head apparatus set-up. 0.125 and 0.25 moles of sodium
chloride solutions (1100 ml in volume) were injected into each column, respectively. After the
injection of the solution (pulsed injection) was complete, distilled water was added once or
twice daily (an average of about 300 milliliter daily), with no overflow allowed. The flow velocity
was roughly 0.52 m/day when the solution/water was added initially in all four columns. The
velocity decreases as the hydraulic head drops.
The leachate of each soil column was collected for up to three weeks. Collection of the
leachate ended when a steady linear change of Na- and Cl- concentrations was reached.
Concentrations of the Na, K, Ca, Mg, Al, Fe, Mn, Zn, Cu, Pb, As, Hg, Si, Cl, S, and P in the leachate
and in the background solution were all measured by a SPECTRO Inductively Coupled Plasma
4

(ICP) Spectrometry which can simultaneously measure the emitted light spectrum from 165 to
770 nm. Concentrations reported in this paper are the total elemental concentrations of the
dissolved and colloid adsorbed species of an element in a solution.
2.1.2. Results for injection into regular soil columns
For the injection of 0.125 moles of NaCl into the regular soil column, Na-concentrations
in the leachate ranged from 27.7 to 1392.5 ppm, As-concentrations from 2.26 to 15.79 ppb, Pb-
concentrations from 0.89 to 20.99 ppb, and Hg concentrations from undetectable to 5.22 ppb
at the peak. For the injection of 0.25 moles of NaCl, the As- concentrations in the leachate
ranged from 2.2 to 55.3 ppb, Pb- concentrations from 0.51 to 84.1 ppb, and Hg- concentrations
from undetectable to 25 ppb (Figure 2a).
The low numbers in the above concentration range are about the background
concentrations of the corresponding element, before the salt injection, whereas the high
numbers are the peak concentrations of the element after the salt injection started
(concentration ranges depicted in the ensuing sections will follow the same convention).
Ca-, Mg-, K-, and Mn- concentrations peaked in a slightly different order, but were
almost in synchronization with the peaks of Na- and Cl- concentrations in both columns, due to
cation exchange (Figure 2b). On the other hand, the concentrations of As, Pb, Hg, Fe, P, S, Al,
and Si had their near lowest values, when the concentrations of Na and Cl peaked. Their
concentrations increased only, once the concentration peaks of Na and Cl had passed.
Concentration-peaks of the non-common elements (Na, Ca, Mg, Ca, S, and Cl are referred as the
common elements in this paper), including Si and Al, arrived later than the concentration peaks
of Na and Cl, which is likely due to the late release from dispersion of organic matter and clay
minerals. The subsequent flushing of the soil columns with distilled water, following the
injection of NaCl, leached soluble salts from the soil column and created a sodic soil condition in
which soil aggregates and soil organic matter breaks up. This break-up of soil particles under
sodic condition is called soil dispersion (defluocculation) (Brady and Weil 2008). A sodic soil is a
soil condition when its sodium ions are disproportionately high and the sodium adsorption ratio
5

(SAR) is larger than 13 in its solution (Brady and Weil 2008). Swarms of loosely absorbed
hydrated Na+ surround the outer-sphere complexes of soil colloids and the poorly balanced
electronegative colloids repel each other under such a sodic soil condition. These processes
cause the soil particles to disperse, increase the reaction surface area, and accelerate the ion
desorption and adsorption in a soil and an aquifer (Brady and Weil 2008). The SAR values in the
leachate were higher than 70 after the first day of the injection and were higher than 13
throughout the experiment time until the last day (Figure 3). Therefore, the soil sodic condition
exists throughout most of the run period of this NaCl injection experiment .
2.1.3. Results for injection into arsenopyrite and galena mixed soil columns
For the injection of 0.125 mole of NaCl solution, the Na- concentrations in the leachate
ranged from 33.3 to 1324.6 ppm (Figure 4a) As- concentrations from 39.5 to 1621.7 ppb, and
Pb- concentrations from 26.68 to 137.27 ppb. The concentration peaks of As, Pb, Ca, Mg, K, Mn,
and S in the leachate were almost in synchronization with that of Na and Cl. However, the
delays of the concentration peaks of Hg, Fe, Al, Si, and P in the leachates were similar to their
delays in the regular soil column injected with NaCl, as discussed in the previous section (Figure
4b). Hg- concentrations ranged from undetectable at the beginning of the experiment to 2.68
ppb near the end of the experimental run. The synchronized increase of the As- and Pb-
concentrations with that of Na and Cl was likely due to the ample supply of As and Pb from the
dissolution of arsenopyrite and galena, facilitated by the influx of NaCl through cation and anion
exchange and soil dispersion. Those late elevated concentrations of Hg, Fe, P, S, Al, and Si,
including that of As and Pb, were likely due to the increased dispersion (deflocculation) of
organic matter under sodic soil condition due to high SAR values (Figure 3), complexation with
Cl, and an increased reducing environment after prolonged water flushing.
2.2. Injection of CaCl2 and NaCl mixed salt into the regular soil column
CaCl2 is a common sea salt in a salty coastal aquifer and the second most common
deicing salt applied in the studied watersheds. Because mixed CaCl2 and NaCl salts have been
6
promoted as a more environmental friendly deicing combination and have gained popularity in
recent years (Breault and Smith, 2010), their effect on the mobilization of the As, Pb and Hg
should be examined separately from that of regular NaCl salt alone.
2.2.1. Experimental setup
Soil column parameters (diameter, height, porosity, conductivity, flow rate, and pore
volumes) are the same as those for the NaCl injection experiment of section 2.1.2. However,
here 0.25 and 0.5 molar solutions (1100 ml in volume) at a 6:4 weight ratio of CaCl 2:NaCl were
injected into the two soil columns, respectively instead of NaCl only salt. The 6:4 CaCl 2:NaCl
weight ratio was to mimic the salt mixing composition mandated since 1990 by the State of
Rhode Island, USA, for its winter deicing road salt (Breault and Smith 2010; Sun et al. 2012). The
injections were followed by a daily flushing with about 300 milliliter of distilled water for three
weeks, except weekends, similar to the injection of the NaCl experiment. The leachate of each
soil column was collected at a regular interval during the injection period. Concentrations of the
elements as listed in the following section were all measured by the ICP.
2.2.2. Results
Concentrations of all elements in the leachate from the injection of both the 0.25 and
0.5 moles solutions of mixed CaCl2 and NaCl at the 6:4 ratio were always higher than those from
the pure NaCl salt experiments discussed previously, and peaked almost in synchronization with
that of Ca and Na (Figure 5). This synchronization of the concentration change was due to the
increased exchange capacity of Ca2+, as it has already been verified in extraction studies of other
metals (Meers et al. 2007; Menzies et al. 2007; Pueyo et al. 2004). Because the stocks of As, Pb,
Hg, P, and Al in the soil columns could be depleted by cation exchange, and because of much
smaller SARs in these mixed salt injection, the delayed concentration increases of As, Pb, and
Hg by the hydrated Na+ induced soil dispersion was not as apparent as that in the pure NaCl
injection experiment of the previous section.
7
For the injections of 0.25 and 0.5 moles of mixed salt solutions, the Ca- concentrations
in the leachates of the respective molar concentration ranged from 24.9 to 893.1 ppm and
13.79 to 3398.9 ppm, Na- concentrations from 9.5 to 2428.5 ppm and 7.42 to 5225.5 ppm, As-
concentrations from 0.96 to 23.14 ppb and 0.847 to 32.23 ppb, Pb-concentrations from 0.79 to
749.2 ppb and 0.063 to 794.5 ppb, and Hg- concentrations from 0.17 to 0.31 ppb and 0.45 to
3.45 ppb.
It is apparent from the results of these mixed salt injection experiments that increased
salt concentrations also increase the release of metals, similar to the results from the single salt
injection (Figure 3). High concentrations of Mn and Fe in the leachate proved that CaCl2 is also
very effective in removing the Mn- and Fe- oxyhydroxides which are effective adsorbents of the
trace metals As, Pb, and Hg in soil particles (Tessier et al. 1979, 1996).
3. Release of As, Pb, and Hg in Response to Salinity Changes in Coastal Aquifers
Arsenic (As) related geochemistry data from three areas: Gangers, Chapai-Nawabgan,
and Meghna rivers across the country of Bangladesh were obtained from Reza et al. (2010a,b),
Halim et al. (2010), and Shamsudduha et al. (2008). The delta area of Bangladesh where these
data were collected is infamous for its high As- concentration in groundwater and As related
health problems. The As- concentrations in some wells of the Chapai-Nawabganj district was as
high as 462 ppb (Reza et al., 2010b).
Linear correlations between the concentrations of As and other elements based on
those data were analysed. Though the linear correlations between the concentrations of As
and Cl are not all statistically significant, based on the t-test for most samples, their negative
correlations are persistent (Table 1). There are also consistent negative correlations between
the concentrations of As and the major common cations Na+, K+ , Ca2+, and Mg2+in the
groundwater of this region which indicate that the generally high alkaline salt water intrusion
into the coastal aquifer usually has an unfavourable influence on the release of As into
groundwater. Further examinations of the data and the conclusions presented by these
researchers (Reza et al. 2010a,b; Halim et al. 2010) also indicate that the As- concentrations are
8

generally positively correlated with that of a reducing environment indicator Mn.
A positive correlation between the As- and Mn- concentrations has also been reported
in studies of other regions (Barringer et al. 2007; Shamsudduha et al. 2008). In addition, Reza
(2010a; b) indicates that an As- release is also facilitated by an increased dissolved organic
matter content. Significant correlations between the concentrations of Si and As (correlation
coefficient=0.46, t=2.93, n=33) in the Manikganj flood plain found by Shamsudduha et al. (2008)
indicate that the very likely source of As in Bangladesh are the aquifers with high As-
concentrations, instead of sea water, as the latter has only relatively low concentrations of
dissolved silica.
From the limited data analyzed in the Chapai Nawabganj region (Reza et al., 2010a), a
positive correlation between the concentrations of Cl and Pb, though not statistically
significant, was observed (Ganges Flood Plain, correlation=0.06, t= 0.14, n=7).
Here we also analyzed the geochemical data collected by Grassi and Netti (2000) for
Ansedonia and Castiglione in the Pescaia region in Italy. Their data showed a clear relationship
between concentrations of Hg and Cl (Figure 6). The correlation coefficient between
concentrations of Cl (salinity of 2 to 34) and Hg (0.5 to 5.5 μg/l) was calculated as 0.88, with a t-
test score of 7.8 for the 18 samples of this dataset. The correlation coefficient between Hg and
all the major cations (Na+, K+, Ca2+, and Mg2+) for groundwater samples collected by Grassi and
Netti (2000)’s study are also larger than 0.88.
4. As, Pb, and Hg Chemistry in a Watershed with Large Deicing Salt Application
4.1 Runoff water samples off an interstate highway
A total of nine runoff water sampling cups were buried right below the surface along
three transects perpendicularly to Interstate highway 95 in the Centennial Lake Watershed
(CLW), New Jersey, US, (Figure 1). The three transects along I-95 are 0.9, 1.8, and 2.7 meters
behind the guardrail of the highway in a grassy area and are approximately 5 meters apart. Five
groups of samples were collected before and after salting periods between 2012 and 2013
(Table 2).
9
Overall, the peaked Na- concentration was more than 266 times (6678 ppm) those of
the pre-salting Na-concentration (25.1 ppm) (Table 2). The SAR was as high as 237 on
2/13/2013 in transect 1 and was larger than 13 in all 18 samples collected in February 2013
(Table 2). This disproportional high Na- concentration created the field sodic soil condition and
caused soil dispersion. Based on Sun et al. (2009, their Table 5), soil organic matter contents in
the top soil at the studied I-95 transects ranged from 2.11% to 4.08% based on the loss on
ignition (LOI) method. Therefore, dispersion of soil organic matter exists as well. The large
surface area of the dispersed soil and soil organic colloids increases the reaction kinetics and so
accelerate the adsorption and desorption processes.
As- concentrations in the runoff water ranged from <0.5 ppb to 3.6 ppb and averaged
1.56 ppb in the three transects, Pb- concentrations from undetectable to 4.4 ppb, with an
average of 2.35 ppb, and Hg- concentrations were undetectable in all the samples. A possible
association of the lowest As- concentrations with the highest Na- concentrations is the masking
of the ICP sensitivity by the high intensity of Na, as discussed in by Pueyo et al. (2004). The
higher As- concentrations (on 2/27/2013 Table 2) obtained after the sodium peak had passed is
likely due to the possible hydrated Na+ induced dispersion of clay and organic matter under the
sodic soil condition as discussed in Section 2.1.2 of the NaCl injection into a regular soil column.
Concentration-decreases with increasing distance away from the edge of the highway were
obvious only for some common elements (Na, K, Ca, Mg, S, and Cl) (Table 2).
4.2. Stream water
Water geochemistry data for the Delaware River at Trenton (Abbreviated as DRT from
here on, Figure 1), New Jersey were obtained from the USGS database between 2002 and 2015
when the As or Pb data were available. The water samples for the stream in the CLW, New
Jersey were collected from two sample sites, one upstream and the other downstream,
between 2011 and 2013.
The As- concentrations at the DRT gage station between 2008 and 2014 ranged from 1.8
to 0.19 ppb, and averaged 0.35 ppb whereas the Pb- concentration between 2003 and 2008
10

ranged from 0.06 to 0.63 ppb, with an average of 0.39 ppb for filtered data (unfiltered max
concentration was 4.12 ppb). The upstream As- concentrations collected in our studied smaller
CLW, during the 2012 to 2013 measuring period ranged from 0.28 to 2.35 ppb, and averaged to
1.08 ppb, with higher concentrations in the off-salting season (Figure 7). Pb- concentrations
ranged from 0.44 to 2.01 ppb, and averaged 0.95 ppb. Hg-concentrations ranged from
undetectable to 2.0 ppb, and averaged 0.593 ppb, with their highest concentrations in the
salting season. Concentrations of these three elements in the downstream water ranged from
0.5 to 1.57 ppb, with an average of 1.04 ppb for As, from 0.48 to 1.1 ppb, with an average of
0.84 ppb for Pb, and from undetectable to 1.78 ppb, with an average of 0.47 ppb for Hg during
the 2012 to 2013 measuring period. These results indicate that the concentration variation of
the downstream water has the same pattern as that of the upstream water.
4.3. Soil solutions from lysimeters
Three suction soil lysimeters were buried at depths of approximately 110 cm from the
surface along the banks of the upstream sample sites, with two lysimeters (#1 and #3) on one
side of the bank and one lysimeter (#2) on the other side of the stream bank (Figure 1).
Lysimters #1 and #2 are near the bank, and lysimeter #3 is approximately 7 meters away from
the bank.
Concentrations of most elements in the soil solutions collected by the lysimeters were
significantly higher than those in the stream water of the CLW, except for that of Na and Cl
(Figure 8). As-concentrations during the 2012 to 2013 measuring period ranged from 0.93 to
3.48 ppb, with an average of 2.88 ppb, for lysimeter #1, which has the most complete record.
Pb-concentrations ranged from 1.21 to 1.85 ppb with an average of 2.01 ppb and Hg-
concentrations from undetectable to 2.55 ppb, with an average of 0.49 ppb. Because the
lysimeters are located in the woods (Figure 1), where there is no input of road salt, elemental
concentrations in the soil solution collected by the lysimeters reflect the elemental
concentrations of the baseflow.
11
5. Mechanism of As, Pb, and Hg release under varied salting conditions
Relationships established between the concentrations of As, Pb, Hg and that of varied
salt contents from the laboratory experiment under defined conditions help to understand the
release mechanism of these three metals from a coastal aquifer and soils under varied salting
conditions.
5.1. Arsenic
In the regular soil column experiment where arsenopyrite and galena were not added
and NaCl-solutions were injected, two elemental groups can be identified in the concentration
correlation dendrogram plotted with STATA program (Figure 9). Correlation dendrogram shows
how closely one cluster/group is correlated with another cluster/group. One group represents
mainly the ion exchange elements Na, Cl, Mg, and Ca, whereas the other group represents the
dispersion-weathering related elements: Fe, As, K, Mn, Si, P, Pb, and Hg. In this second group,
the close correlation of the As- and Fe- concentrations in the dendrogram indicates As’s strong
affinity to Fe oxyhydroxides (Barringer et al. 2007; Smedley and Kinniburg 2002). The positive
correlation between the concentrations of As and P implies a possible substitution of PO 43− and
AsO43− anionic groups in the minerals, because of their chemical similarity (Cornell and
Schwertmann 2003; Tessier et al. 1996). Such as positive relationship between concentrations
of P and As was also reported in other studies (Smedley and Kinniburg, 2002) and in a recent
study for the DRT data by Sun et al. (2015).
In the soil columns with arsenopyrite and galena added and a NaCl- solution injected,
and the soil columns with no minerals added, but mixed-salt injected, increases of the As-
concentrations in their leachates were in synchronization with the increases of Na-, Ca-, Mg-,
and K- concentrations (Figures 4 and 5). The difference between As- sources in the soil columns
with added minerals and the soil columns with injection of mixed salt is that the As source in
the former is arsenopyrite, whereas the As- source in the latter is the As-adsorbents on organic
matter and clay minerals, and the secondary As- minerals are formed by oxidation (Smedley
and Kinniburg 2002).
12
In the leachates of mixed salt columns, the increases of the As-, Pb-, and Hg-
concentrations are initially larger than those of NaCl- only salt experiment and synchronized
with the increases of Na- and Ca- concentrations, because the divalent Ca2+ has a much stronger
desorbing ability than the monovalent Na+ (Meers et al. 2007; Menzies et al. 2007). In fact, due
to this property, moderate to low concentrations of CaCl2 have been used for that reason as a
standard agent for extracting As from soil (Száková et al. 2009).
In the concentration correlation dendrogram of stream water, the As- concentrations
are mostly related to the Fe- representing inducing element group, but less related to those of
Na, Mg, Ca representing the ion exchange element group (Figure 10). The correlations between
the concentrations of As and Na, and As and Cl is also negative (Na and As correlation =-0.38,
t=-2.36, n=85; Cl and As correlation =-0.41, t=-2.54, n=85). This is similar to the relation of the
As- concentrations with those of other elements in the groundwater of Bangladesh’s aquifer
(Table 1). The negative correlation between the As- and S- concentrations in the studied New
Jersey CLW watershed (upstream correlation=-0.167, t= -1.49; downstream correlation =-0.68,
t= -8.38, n=28) is likely due to S being mainly in its oxidized state of SO42- in the stream and
within an oxidizing environment which restricts the release of As. A negative correlation is also
shown between the concentrations of As and SO42- in the DRT, New Jersey (Correlation =-0.33,
t=-2.97, n=84). Two distinct groups in the concentration correlation dendrogram of lysimeter #1
can also be identified (Figure 11). Here the As- concentrations are closely related to the
concentration group of Pb, Mn, Si, and Fe which is affiliated with a release by weathering
processes under reducing conditions.
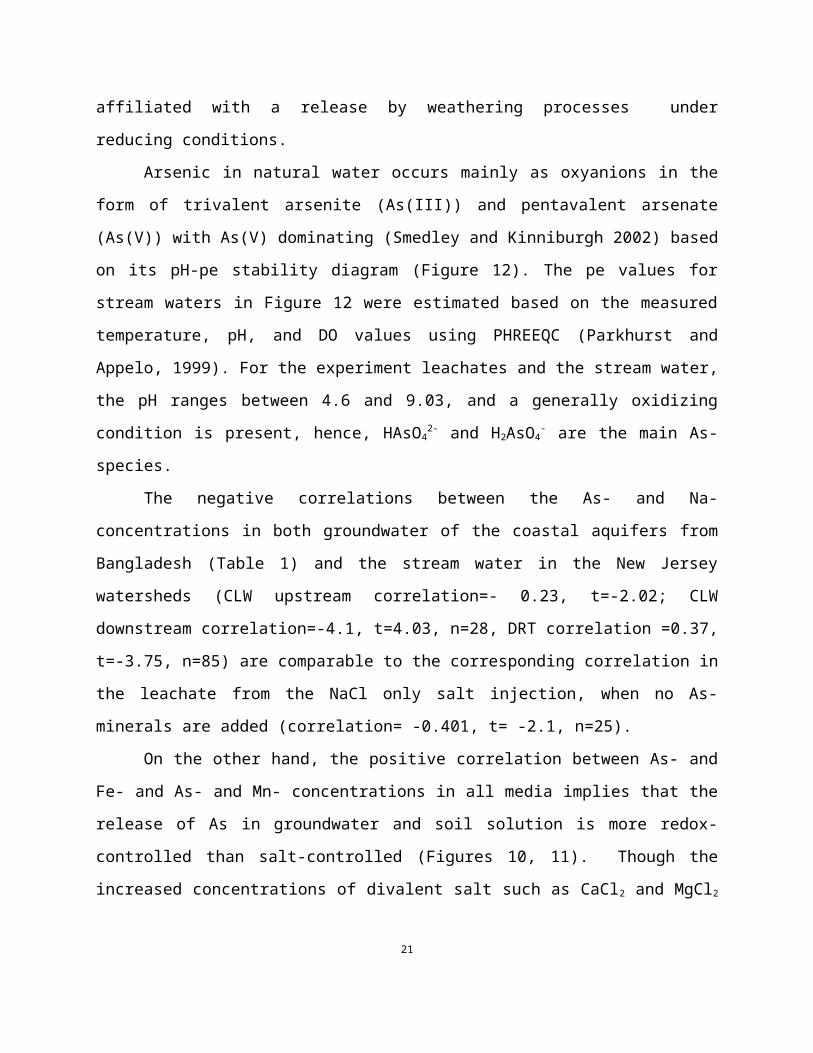
Arsenic in natural water occurs mainly as oxyanions in the form of trivalent arsenite
(As(III)) and pentavalent arsenate (As(V)) with As(V) dominating (Smedley and Kinniburgh 2002)
based on its pH-pe stability diagram (Figure 12). The pe values for stream waters in Figure 12
were estimated based on the measured temperature, pH, and DO values using PHREEQC
(Parkhurst and Appelo, 1999). For the experiment leachates and the stream water, the pH
ranges between 4.6 and 9.03, and a generally oxidizing condition is present, hence, HAsO42- and
H2AsO4- are the main As- species.
13

The negative correlations between the As- and Na- concentrations in both groundwater
of the coastal aquifers from Bangladesh (Table 1) and the stream water in the New Jersey
watersheds (CLW upstream correlation=- 0.23, t=-2.02; CLW downstream correlation=-4.1,
t=4.03, n=28, DRT correlation =0.37, t=-3.75, n=85) are comparable to the corresponding
correlation in the leachate from the NaCl only salt injection, when no As-minerals are added
(correlation= -0.401, t= -2.1, n=25).
On the other hand, the positive correlation between As- and Fe- and As- and Mn-
concentrations in all media implies that the release of As in groundwater and soil solution is
more redox-controlled than salt-controlled (Figures 10, 11). Though the increased
concentrations of divalent salt such as CaCl2 and MgCl2 , and soil dispersion under sodic
condition can increase the release of As in the form of colloid adsorbents and dissolved HAsO 42-
and H2AsO4- species (Figure 12), a positive correlation between the concentrations of NaCl and
As in groundwater and stream water cannot be corroborated based on our laboratory and field
data.
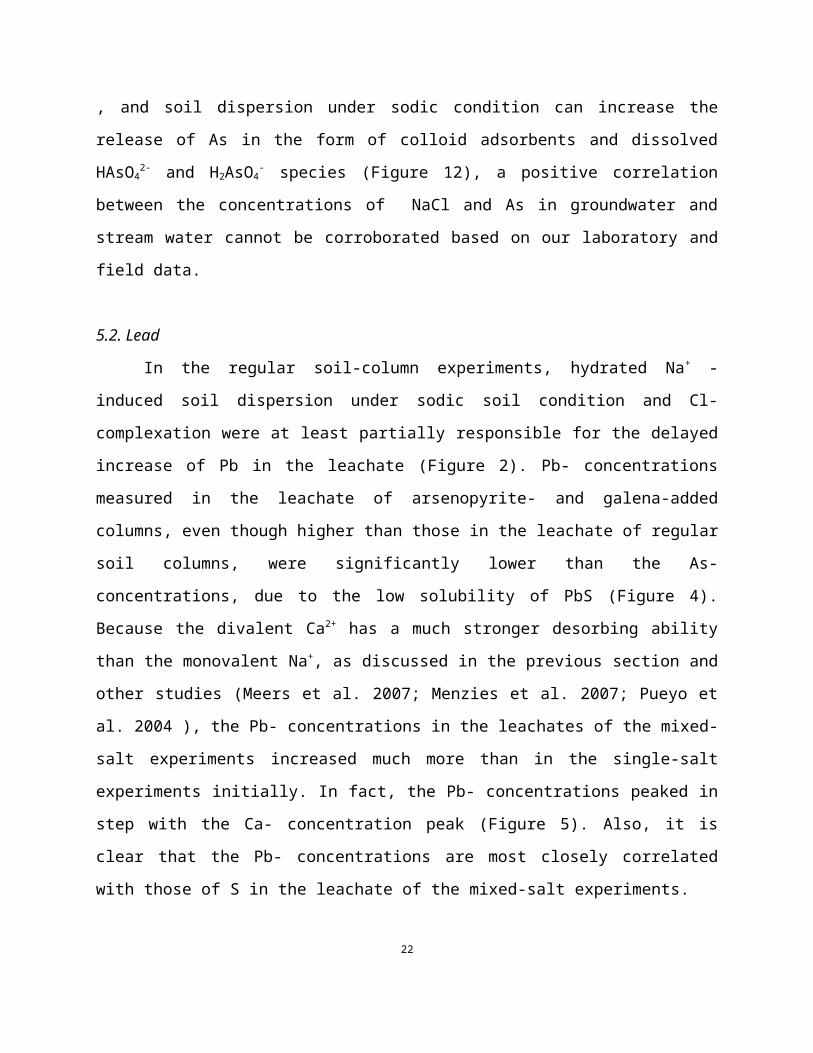
5.2. Lead
In the regular soil-column experiments, hydrated Na+ -induced soil dispersion under
sodic soil condition and Cl- complexation were at least partially responsible for the delayed
increase of Pb in the leachate (Figure 2). Pb- concentrations measured in the leachate of
arsenopyrite- and galena-added columns, even though higher than those in the leachate of
regular soil columns, were significantly lower than the As- concentrations, due to the low
solubility of PbS (Figure 4). Because the divalent Ca2+ has a much stronger desorbing ability than
the monovalent Na+, as discussed in the previous section and other studies (Meers et al. 2007;
Menzies et al. 2007; Pueyo et al. 2004 ), the Pb- concentrations in the leachates of the mixed-
salt experiments increased much more than in the single-salt experiments initially. In fact, the
Pb- concentrations peaked in step with the Ca- concentration peak (Figure 5). Also, it is clear
that the Pb- concentrations are most closely correlated with those of S in the leachate of the
mixed-salt experiments.
14
From the concentration-correlation dendrogram of the CLW stream water of the New
Jersey watershed (Figure 10), one may infer that the Pb- concentrations are most closely
related to those of S (CLW upstream correlation =0.79, t=11.5; CLW downstream
correlation=0.42, t=4.2, n=28), next closely related to those of Na and Cl (CLW upstream
correlations=0.77 and 0.61, t=10.98 and 6.96, n=28; CLW downstream correlation=0.44,
t=4.46, and 0.42, t=4.2, n=28) (Figure 10). The positive correlation between Pb- and Cl-
concentrations was also observed for the water data measured by the USGS from the large DRT
watershed in New Jersey between 2002 and 2008 when the Pb was measured more frequent
(correlation = 0.32, t=1.6, n=25, Figure 13). This indicates that the Pb-concentration is at least
partially controlled by an anthropogenic factor, because S-, Na-, and Cl- concentrations in
stream water are all anthropogenically influenced (Rochelle et al. 1987; Sun et al. 2014). In
addition, the Pb- concentrations are also positively correlated with those of Si in the CLW
upstream water (correlation=0.66, t=7.97, n=28) and in the soil solution from the lysimeter
(correlation=0.6, t=6.84, n=26), where the release of Si is related to the weathering process
(Figure 11).
Different from the natural release of Pb in ground water of coastal aquifers which
originates mainly from the dissolution of Pb-oxide, carbonate, phosphate, sulfide, and sulfate
minerals (Drever 1997), Pb in the stream water and in the soil solutions (Table 2) has a possible
anthropogenic source, such as, likely, the Pb- containing aerosol particles from the past use of
Pb-additives in gasoline (Datko-Williams et al. 2014; Sarwar et al., 2015). Though Pb- emissions
to air have decreased in the U.S. since the phase-out of Pb-containing gasoline in 1995,
amounts of Pb in soils can still remain elevated for hundreds of years (Laidlaw et al. 2012;
Datko-Williams et al. 2014; Sarwar et al. 2015). Atmospheric soil and Pb aerosols can also be re-
suspended due to automotive traffic turbulence and deposited on the soil surface again,
particularly, in the summer and fall, when the weather is dry (Laildlaw et al. 2012). Therefore, it
is most likely that the sources of Pb in the studied New Jersey watersheds are a combination of
natural and anthropogenic factors.
15

The dissolution of various Pb-oxides, carbonate, phosphate, and sulfate minerals and
the desorption of various Pb-species absorbed onto organic matter, Fe and Mn oxyhydroxide,
and on clay particles in topsoil and coastal aquifers can result in diverse Pb-species such as Pb 2+,
PbCO3, PbCl+, PbCl2, PbCl3-, PbOH2+, and Pb(CO3)Cl- in ground- and surface water (Wei et al.
2005; Woosely and Millero 2012) (Figure 12). Because salt water intrusion-accelerated by
over-pumping and/or sea level rising in coastal regions and the application of deicing salt will
likely increase the Cl- concentrations, the amount of PbCln and other dissolved Pb species
related to the salt also will increase in the groundwater of a salty coastal aquifer and soil
solution of a salted watershed (Figure 13).
5.3. Mercury
Sources of Hg in the leachates of the soil column experiments are the soil minerals and
the soil organic matter. Changes of the Hg- concentrations in the leachate, in response to the
injection of a pure NaCl- solution, were similar to those of the Pb- concentrations and were
facilitated by the soil dispersion and Cl- complexation (Figures 2, 3).
There are significant positive correlations between the concentrations of Hg and those
of Fe, Si, and Al. For the soil columns where arsenopyrite and galena were added, the release of
Hg from the soil was similarly to that in the regular soil columns that have no minerals added
(Figure 4). However, the Hg- concentrations do not correlate with those of As and Pb, as it did
in the regular soil columns because of the enhanced As- and Pb- supplies in the mineral-added
columns. For the mixed CaCl2- and NaCl- injection experiments, the changes of the Hg-
concentrations in the leachate synchronized with those of Ca as well, similar to the behavior of
other elements (Figure 5). Compared to the concentrations of other elements measured, the
Hg- concentrations are generally lower in all the leachates, soil solutions, stream water and the
runoff water (Figures 2-7).
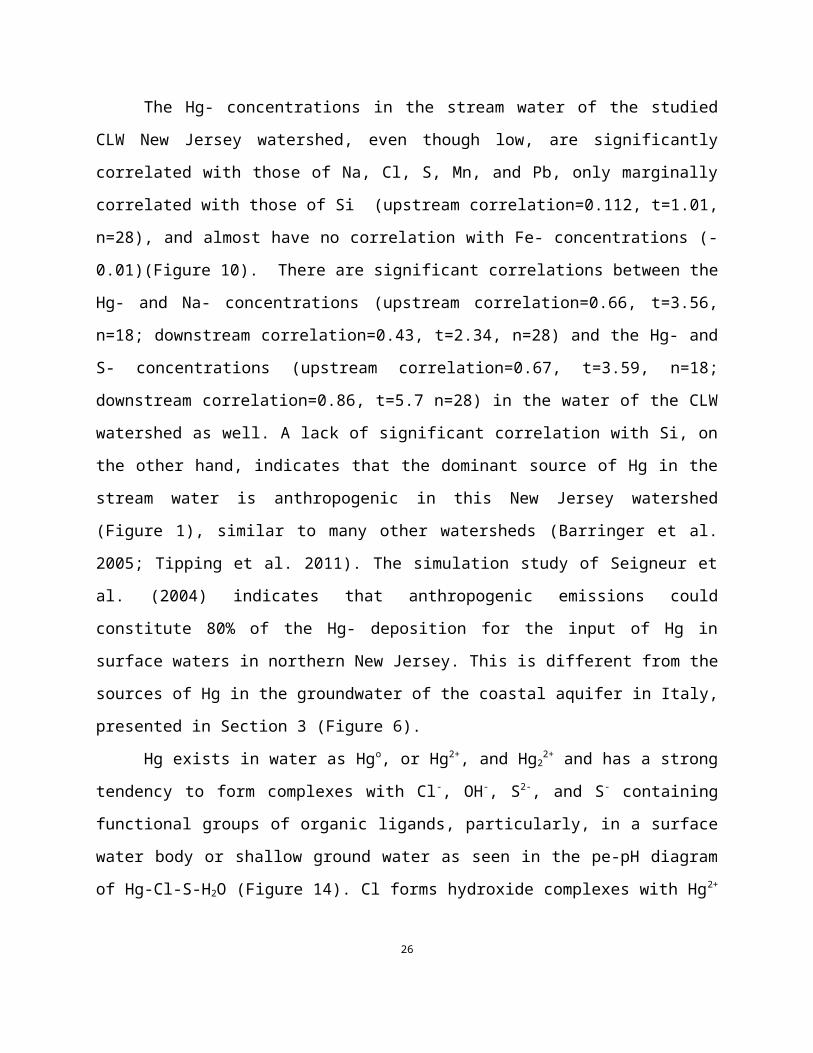
The Hg- concentrations in the stream water of the studied CLW New Jersey watershed,
even though low, are significantly correlated with those of Na, Cl, S, Mn, and Pb, only
marginally correlated with those of Si (upstream correlation=0.112, t=1.01, n=28), and almost
16
have no correlation with Fe- concentrations (-0.01)(Figure 10). There are significant
correlations between the Hg- and Na- concentrations (upstream correlation=0.66, t=3.56, n=18;
downstream correlation=0.43, t=2.34, n=28) and the Hg- and S- concentrations (upstream
correlation=0.67, t=3.59, n=18; downstream correlation=0.86, t=5.7 n=28) in the water of the
CLW watershed as well. A lack of significant correlation with Si, on the other hand, indicates
that the dominant source of Hg in the stream water is anthropogenic in this New Jersey
watershed (Figure 1), similar to many other watersheds (Barringer et al. 2005; Tipping et al.
2011). The simulation study of Seigneur et al. (2004) indicates that anthropogenic emissions
could constitute 80% of the Hg- deposition for the input of Hg in surface waters in northern
New Jersey. This is different from the sources of Hg in the groundwater of the coastal aquifer in
Italy, presented in Section 3 (Figure 6).
Hg exists in water as Hgo, or Hg2+, and Hg22+ and has a strong tendency to form
complexes with Cl-, OH-, S2-, and S- containing functional groups of organic ligands, particularly,
in a surface water body or shallow ground water as seen in the pe-pH diagram of Hg-Cl-S-H2O
(Figure 14). Cl forms hydroxide complexes with Hg2+ when the Cl2- concentration is above 10-9
mol/l (Hahne and Kroontje 1973; Bollen et al. 2008). Bollen et al. (2008) found that 80% of the
Hg in their soil and groundwater samples exists as a reactive, inorganic Hg- species, such as
HgCl2. Schuster (1991) stated that Cl may be regarded as one of the most mobile and persistent
complexing agent for Hg. Since the solubilities of HgCl2 and Hg(OH)2 are rather high, the affinity
of Hg to these ligands leads to an increased mobility of Hg. The relative high correlation
between concentrations of Cl and Hg for both the CLW stream water (upper stream
correlation=0.55, t= 3.23, n=26) and in the samples of the saline ground water from Italy
(correlation=0.88, t=7.78, n=18) (Section 3), support the formation of HgCl2 species in these
water bodies. With an increased Cl- concentration in a water system, there will be an increased
desorption of Hg from the soil mineral and the organic matter, and more Hg being mobilized
from the coastal aquifer and the soil into groundwater and surface water. This indicates that
ongoing exploitation of groundwater, the rising sea level along the coast and the increased
application of road salt can all lead to an increased interaction of Cl with Hg in an aquifer and
17
soil and may, consequently, increase the formation of HgCln complexes in groundwater and
surface water.
Conclusions
Geochemistry data related to As, Pb, and Hg from the leachate of salt injection
experiments, groundwater of coastal aquifers of Bangladesh and Italy, and stream water and
soil solutions from two watersheds in New Jersey, US, with winter deicing salt application, were
examined. In all water systems where NaCl was the main influencing salt, As- concentrations in
the water increased only under a reducing condition and, generally, have a negative correlation
with the chloride concentrations in the medium. However, concentrations of both Pb and Hg
were positively correlated with those of Na and Cl measured in these waters, which, most likely,
is due to chloride complexation of Pb and Hg and soil dispersion related desorption under a
sodic soil condition.
In the mixed-salt injection experiment where CaCl2 and NaCl were mixed at a 6:4 weight
ratio (as mandated by the state of Rhode Island’s deicing salt composition), the As-, Pb-, and
Hg- concentrations all increased quickly after the salt injection which may be due to the high
desorption and cation-exchange capacity of the divalent cation Ca2+.
Salt water intrusion into a freshwater aquifer associated with increased coastal pumping
activities and/or rising sea levels, will likely also increase the salinity and the mobilization of Pb
and Hg from the coastal aquifer, though the effect of sea salt on the release of As is limited. The
increased release of Pb and Hg from soil by NaCl-deicing salt and the increased release of all
three elements, As, Hg, and Pb, when a divalent cation is dominating in a salt will need to be
considered when an environmental policy for selecting an appropriate deicing salt is rendered.
Acknowledgments
The authors thank Nicholas Mazza, Eric Pezzi, Nicole Chakowski, Leeann Sinpatanasakul,
Maria Huffine, and Jonathan Husch from the Department of Geological, Environmental, and
Marine Sciences (GEMS) at Rider University for their field and laboratory assistance during this
18

project. We also acknowledge the critical comments of Kathy Brown from Rider University
which improved the paper significantly. Finally, we acknowledge the financial support of Rider
University and US National Science Foundation grant MRI-0821172.
References
Amrhein, C., Mosher, P. A., Strong, J. E., Pacheco, P. G., 1994. Heavy Metals in the Environment,
Trace Metal Solubility in Soils and Waters Receiving Deicing Salts. J. Environ. Qual. 23, 219-
227.
Amrhein, C., Strong, J. E. ,1990. The Effect of Deicing Salts on Trace Metal Mobility in Roadside
Soils." J. Environ. Qual. 19, 765-772.
Backstrom, M., Karlsson, S., Backman, L., Folkeson, L., Lind, B., 2004. Mobilization of heavy
metals by deicing salts in a roadside environment. Water Res. 38, 720-732.
Backstrom, M., Nilsson, U., Hakansson, K., Allard, B., Karlsson, S., 2003. Speciation of heavy
metals in road runoff and roadside total deposition. Water Air Soil Pollut. 147, 343-366.
Balogh,S. J., Swain,E. B., Nollet, Y. H., 2008. Characteristics of mercury speciation in Minnesota
rivers and streams. Environ. Pollut. 154, 3-11.
Barringer, J. L., Szabo, Z., Kauffman, L. J., Barringer, T. H., Stackelberg, P. E., Ivahnenko, T.,
Rajagopalan, S., & Krabbenhoft, D.P., 2005. Mercury concentrations in water from an
unconfined aquifer system, New Jersey coastal plain. Sci. Total Environ. 346, 169-83.
Barringer, J. J., Bonin, J. L., Deluca, M. J., Romagna,T., Cenno,K., Alebus, M., Kratzer, T., Hirst,
B., 2007. Sources and temporal dynamics of arsenic in a New Jersey watershed, USA. Sci.
Total Environ. 379, 56-74.
Bettinelli, M., Beone, G. M., Spezia, S. , Baffi, C., 2000. Determination of heavy metals in soils
and sediments by microwave-assisted digestion and inductively coupled plasma optical
emission spectrometry analysis. Anal. Chim. Acta. 424,289–296.
Bauske, B., & Goetz, D., 1993. Effects of deicing-salts on heavy metal mobility. Acta
Hydrochim. Hydrobiol. 21, 38 - 42.
19
Bollen, A., Wenke, A., Biester, H. ,2008. Mercury speciation analyses in HgCl2-contaminated
soils and groundwater—Implications for risk assessment and remediation strategies. Water
Res. 42, 91-100.
Brady, N. C., Weil, R. R.,2008. The Nature and Properties of Soils, 14th Ed. Prentice Hall. New
Jersey.
Breault, R. F., Smith, K. P., 2010. Streamflow, Water Quality, and Constituent Loads and Yields,
Scituate Reservoir Drainage Area, Rhode Island, Water Year 2009. USGS Open-File Report
2010-1275.
Chand, V., Prasad, S., 2013. ICP-OES assessment of heavy metal contamination in tropical
marine sediments: A comparative study of two digestion techniques. Microchem. J. 111, 53-
61.
Cornell, R. M. Schwertmann, U., 2003. The Iron Oxides — Structure Properties, Reactions,
Occurrences and Uses. Weinheim: VCH Publishers.
Cremer, M., & Schlocker, J., 1976. Lithium borate decomposition of rocks, minerals, and ores.
Am. Mineral. 61,318-3211.
Datko-Williams, L., Wilkie, A., Richmond-Bryant, J., 2014. Analysis of U.S. soil lead (Pb) studies
from 1970 to 2012. Sci. Total Environ. 468–469, 854-863.
Doner, H.E., 1978. Chloride as a factor in mobilities of Ni (II), Cu (II) and Cd (II) in soil. Soil Sci.
Am. J. 42,882-885.
Drever, J. I., 1997. The Geochemistry of Natural Waters, 3rd Ed., Prentice Hall, New Jersey.
Grassi, S., Netti, R., 2000. Sea water intrusion and mercury pollution of some coastal aquifers in
the province of Grosseto (Southern Tuscany — Italy). J. Hydrol. 237, 198-211.
Hahne, H. C. H., Kroontje, W., 1973. Significance of pH and chloride concentration on behavior
of heavy metal pollutants: Mercury(II), Cadmium(II), Zinc(II), and Lead(II). J. Environ. Qual.
2, 444-450.
Halim, M.A., Majumder, R.K., Nessa, S.A., Hiroshiro, Y., Sasaki, K., Saha, B.B., Saepuloh, A.,
Jinno, K., 2010. Evaluation of processes controlling the geochemical constituents in deep
groundwater in Bangladesh. J. Hazard. Mater. 180, 50-62.
20
Harrison R. M., Laxen D. P., Wilson S. J., 1981. Chemical associations of lead, cadmium, copper,
and zinc in street dusts and roadside soils. Environ. Sci. Technol. 15, 1378-1383.
Kelly, V.R., Lovett, G.M., Weathers, K.C., Findlay, S.E.G., Strayer, D.L., Burns, D.J., Likens, G.E.,
2008. Long-term sodium chloride retention in a rural watershed: legacy effects of road salt
on streamwater concentration. Environ. Sci. Technol. 42, 410–415.
Laidlaw, M. A.S., Zahran, S, Mielke, H.W., Taylor, M.P., Filippelli, G.M., 2012. Re-suspension of
lead contaminated urban soil as a dominant source of atmospheric lead in Birmingham,
Chicago, Detroit and Pittsburgh, USA. Atmos. Environ. 49, 302-310.
Lee, P. K., Touray, J. C., 1998. Characteristics of a polluted artificial soil located along a
motorway and effects of acidification on the leaching behavior of heavy metals (Pb, Zn, Cd).
Water Res. 32, 3425-3435.
Lumsdon, D. G., Evans, L. J., Bolton K. A., 1995. The influence of pH and chloride on the
retention of cadmium, lead, mercury and zinc by soils. J. Soil Contam. 4, 137-150.
Meers, E., Samson, R., Tack, F.M.G., Ruttens, A. , Vandegehuchte, M., Vangronsveld, J. ,
Verloo, M.G., 2007. Phytoavailability assessment of heavy metals in soils by single
extractions and accumulation by Phaseolus vulgaris. Environ. Exper. Bot. 60, 385-396.
Menzies, N. W., Donn, M. J., Kopittke, P.M., 2007. Evaluation of extractants for estimation of
the phytoavailable trace metals in soils. Environmental Pollution, 145, 121-130.
Menzies, A. C., Jacks, G. S., 1998. Concentration and fractionation of heavy metals in roadside
soils receiving de-icing salts. Sci. Total Environ. 218, 161-174.
Mumford, A. C. Barringer, J.L., Benzel, W.M., Reilly, P. A., Young, L. Y., 2012. Microbial
transformations of arsenic: Mobilization from glauconitic sediments to water. Water Res.
46, 2859-2868.
Nelson, S., Yonge, D., Barber, M., 2009. Effects of Road Salts on Heavy Metal Mobility in Two
Eastern Washington Soils. J. Environ. Eng., 135, 505–510.
Norrström, A. C., Jacks, G., 1998. Concentration and fractionation of heavy metals in roadside
soils receiving de-icing salts. Sci. Total Environ. 218, 161–174.
21
Norrström, A. C., Bergstedt, E., 2001. The Impact of Road De-Icing Salts (NaCl) on Colloid
Dispersion and Base Cation Pools in Roadside Soils. Water Air Soil Pollut. 127, 281-299.
Parkhurst, David L.; Appelo, C. A. J., 1999. User's guide to PHREEQC (Version 2) : a computer
program for speciation, batch-reaction, one-dimensional transport, and inverse
geochemical calculations. U.S. Geological Survey : Earth Science Information Center, Open-
File Reports Section, Water-Resources Investigations Report 99-4259, xiv, 312 p.
Protano, G., Riccobono, F., Sabatini, G., 2000. Does salt water intrusion constitute a mercury
contamination risk for coastal fresh water aquifers? Environ. Pollut. 110, 451-458.
Pueyo, M., López-Sánchez, J. F., Rauret G., 2004. Assessment of CaCl2, NaNO3 and NH4NO3
extraction procedures for the study of Cd, Cu, Pb and Zn extractability in contaminated soils.
Anal. Chim. Acta. 504, 217-226
Reza, S. A.H.M. Jean, J.S., Lee, M.-K., Liu, C., Bundschuh, J., Yang, H., Lee, J., Lee Y.C., 2010a,
Implications of Organic Matter on Arsenic Mobilization into Groundwater. Water Res. 44,
5556-5574.
Reza, S. A.H.M., Jean, J. S., Yang, H., Lee, M.-K., Woodall, B., Liu, C., Lee, J., Luo, S., 2010b.
Occurrence of arsenic in core sediments and groundwater in the Chapai-Nawabganj District,
northwestern Bangladesh. Water Res. 44, 2021-2037.
Rochelle, B. P., Church, M. R., David, M. R., 1987. Sulfur retention at intensively studied sites in
the U.S. and Canada. Water Air Soil Pollut. 33, 73-83.
Rundgren, S, Ruhling, A. , Schluter, K., Tyler, G., 1992. Mercury in soil—distribution, speciation
and biological effects. A review of the literature and comments on critical concentrations.
Copenhagen: Nordic Council of Ministers.
Sandroni, V., Smith, C. M. M., 2002. Microwave digestion of sludge, soil and sediment samples
for metal analysis by inductively coupled plasma–atomic emission spectrometry. Anal.
Chim. Acta. 468, 335–344.
Sarwar,M., Panuccio, E., Schwartz, S., and Sun, H., 2015. Lead Concentrations in Soil Profiles of
A Transect Near An Interstate Highway in New Jersey, Geological Society of America.
Abstracts with Programs. Vol. 47, No. 3,p.71.
22

Sauvé, S., McBride, M., Hendershot, W., 1998. Soil solution speciation of lead (II): Effects of
organic matter and pH. Soil Sci. Am. J. 62, 618-621.
Scherbatskoy, T. Shanley, J. B., Keeler, G. J.,1998. Factors controlling mercury transport in an
upland forested catchment. Water Air Soil Pollut. 105, 427-438.
Schuster, E., 1991. The behaviour of mercury in the soil with special emphasis on complexation
and adsorption processes—a review of the literature. Water Air Soil Pollut. 56, 667–680.
Shamsudduha, M., Uddin, A., Saunders, J.A., Lee, M.-K., 2008. Quaternary stratigraphy,
sediment characteristics and geochemistry of arsenic-contaminated alluvial aquifers in the
Ganges–Brahmaputra floodplain in central Bangladesh. J. Contam. Hydrol. 99, 112–136.
Smedley P. L., Kinniburg, D. G., 2002. A review of the source, behavior and distribution of
arsenic in natural waters. Appl. Geochem. 17, 517-568.
Seigneur, C., Vijayaraghavan, K., Lohman, K., Karamchandani, P., Scott, C., 2004. Global source
attribution for mercury deposition in the United States. Environ. Sci. Technol. 38, 555– 69.
Stille, P., Pourcelot, L., Granet, M., Pierret, M.-C. Guéguen, F., Perrone, Th. Morvan, G., &
Chabaux, F., 2011. Deposition and migration of atmospheric Pb in soils from a forested
silicate catchment today and in the past (Strengbach case): Evidence from 210Pb activities
and Pb isotope ratios. Chem. Geol. 289, 140-153.
Sun,H., Barton, A., Sarwar, M., Panuccio, E.,2015. Role of Phosphate in the Mobilization Of
Arsenic from Soil and Aquifer, Geological Society of America Abstracts with Programs. Vol.
47, No. 3, p.72. https://gsa.confex.com/gsa/2015NE/webprogram/Paper252310.html
Sun, H., Alexander, J. Gove, B., Pezzi, E., Chakowski, N. Husch, J., 2014. Mineralogical and
anthropogenic controls of stream water chemistry in salted watersheds. Appl. Geochem.
48,141-154.
Sun, H., Sinpatanasakul, L., Husch, J. M., Huffine, M., 2012. Na/Cl molar ratio changes during a
salting cycle and its application to the estimation of sodium retention in salted watersheds.
J. Contam. Hydrol. 136-137, 96-105.
Sun, H. , Nelson,. M., Chen, F. and Husch, J. 2009. Soil mineral structural water loss during LOI
analyses. Can. J. Soil Sci. 89, 603-610..
23

Száková, J., Tlustos, P., Goessler, W., Frková, Z., Najmanová, J., 2009. Mobility of arsenic and its
compounds in soil and soil solution: the effect of soil pretreatment and extraction methods.
J. Hazard. Mater. 172, 1244-1251.
Tessier, A. Campbell, P. G. C., Blsson, M., 1979. Sequential extraction procedure for the
speciation of particulate trace metals. Anal. Chem., 51, 844–851.
Tessier, A. Fortin, D., Belzile, N., DeVitre, R. R., Leppard, G. G., 1996. Metal sorption to
diagenetic iron and manganese oxyhydroxides and associated organic matter: Narrowing
the gap between field and laboratory measurements. Geochim. Cosmochim. Acta. 60, 387-
404.
Tipping, E., Lofts, S., Hooper, H., Frey, B., Spurgeon, D., Svendsen, C., 2010. Critical limits for
Hg(II) in soils, derived from chronic toxicity data. Environ. Pollut. 158, 2465-2471.
Wei, Y. L., Yang, Y. W., Lee, J. F., 2005. Lead speciation in 0.1N HCl-extracted residue of analog
of Pb-contaminated soil. J. Electron. Spectrosc. Relat. Phenom. 144-147, 299-301.
Woosley, R. J., Millero,F. J., 2013. Pitzer model for the speciation of lead chloride and carbonate
complexes in natural waters. Mar. Chem. 149, 1-7.
24

Table 1. Correlation coefficients of As- and Cl- concentrations from coastal aquifers in
Bangladesh*
Cl and As Mn and As Shared parameters
Corr. coeff t-test Corr.
coeff t-test t-0.05 Sample size
Well depth (m) Sources
GBM Plain* -0.11 -0.22 0.19 1.07 2.04 33 266.7 Halim et al. (2010)
Manikganj flood plain -0.34 -1.03 0.08 0.35 2.26 10 103.2 Reza et al.,
(2010a)
Meghna -0.71 -3.16 -0.56 -1.64 2.23 11 160.6 Reza et al., (2010a)
Chapai-Nawabganj 0.02 0.08 0.24 1.09 2.09 20 82.7 Reza et al.,
(2010a)Chapai-Nawabganj -0.31 -1.44 0.4 1.73 2.09 20 51.9 Reza et al.,
(2010b)Ganges–Brahmaputra -0.16 -1.45 -0.54 0.11 1.99 84 51.9 Shamsudduha
et al. (2008)*GBM Plain is the Ganges–Brahmaputra- Meghna river flood plain and only the As
concentrations larger than 1.0 ppb in Helim et al. (2010) were used to avoid instrumental
inaccuracy. t-0.05 is the t test critical value with 95% confidence level. An absolute t test value
larger than the t-0.05 value indicates that the correlation coefficients are significant with 95%
confidence.
25
ppb ppb ppm ppm ppm ppm ppb ppm ppm ppb ppm ppmSample As Pb Na Ca K Mg Mn Fe Al P S Cl SAR
L3C111/7/2012 1.16 2.50 25.3 21.03 3.66 6.67 - 5.18 0.31 1.03 0.18 11.5 1.711/14/201
2 1.05 2.171185.
7212.3
0 22.34 89.31 - 0.13 0.31 0.30 2.24 4471.6 24.3
2/6/2013 2.59 2.832095.
3116.5
3 11.27 32.66 0.52 0.00 0.31 0.17 3.46 6469.6 62.4
2/12/2013 0.83 3.066678.
0237.8
4 27.21 60.44 2.10 - 0.31 0.9516.6
212762.
6 141.2
2/27/2013 3.14 3.562765.
2 71.10 9.68 13.33 2.86 0.02 0.31 7.52 4.53 9376.9 111.4 L3C3
11/7/2012 1.65 1.71 31.7 3.21 5.90 1.06 1.0866.0
0 0.40 19.81 0.20 11.3 5.511/14/201
2 1.03 2.45 896.3 76.64 21.52 30.8459.8
6 3.04 0.31 2.78 1.31 3048.0 30.8
2/6/2013 2.82 3.23 908.6 45.18 7.88 10.7739.1
4 0.01 0.31 2.84 1.07 2751.7 44.5
2/12/2013 0.83 2.345196.
5169.9
1 19.80 32.5261.8
9 - 0.31 1.4410.4
412419.
9 135.1
2/27/2013 2.65 3.541350.
2 45.62 9.21 9.33 5.74 0.04 0.30 2.60 1.45 4847.6 67.2Table 2. Elemental concentrations of runoff water from two sample sites along a transect of I-
95*
*L3C1 is the nearest sampling site to the edge of Interstate Highway 95. L3C3 is a sampling
site that is 1.8 meters (6 feet) away from L3C1 and the edge of Highway 95.
26
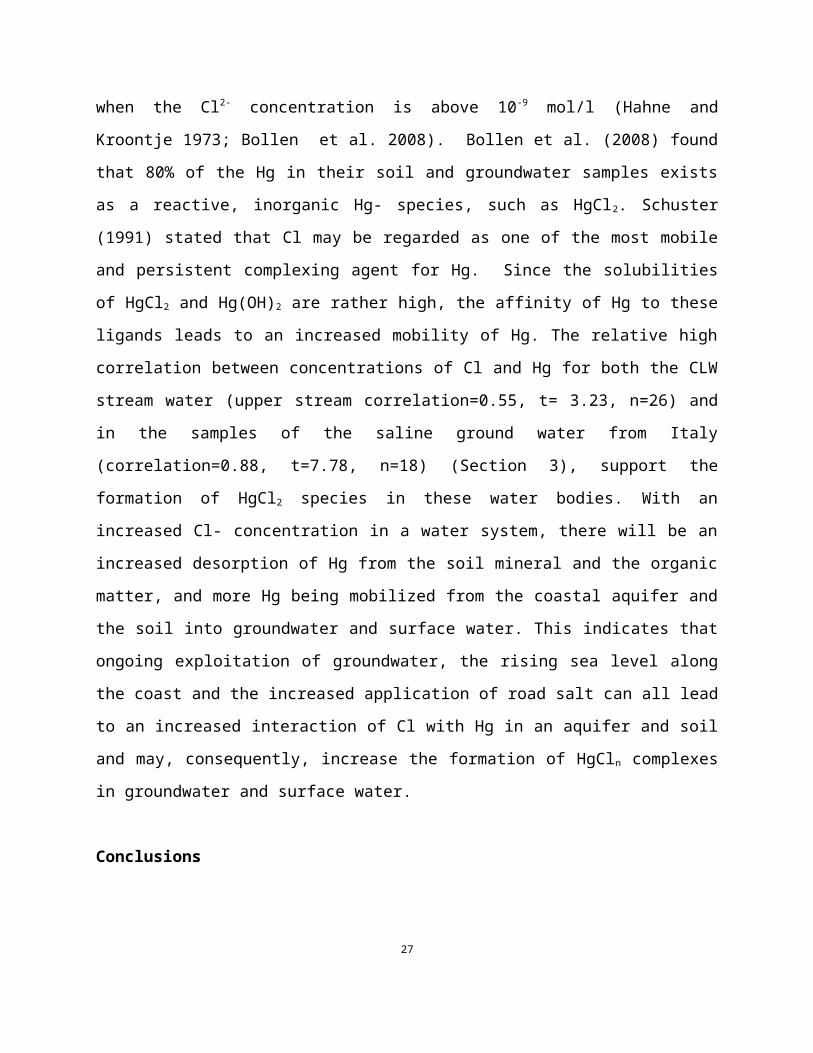
Figure 1. Sample site location map of the studied watersheds. The Centennial Lake watershed (CLW, left) is located in the large Delaware River Watershed (Right). DRT: Delaware River at Trenton station.
27

Figure 2. a) Changes of As, Pb, Hg, and Na- concentrations, b) Changes of Ca, Mg, K, S, Cl, Si, Al,
Mn, P, and Fe, in the leachate of 0.25 moles of NaCl injection into the regular soil column. Note
that in plot b), concentrations of Cl, Ca, Mg, K, and Si are in ppm while concentrations of Fe, S,
Mn, and Al are in ppb.
a).
b).
28
Figure 3. Sodium adsorption ratios (SAR) for the three injection experiments shown in Figures
2,4,5. Notice that the SAR value, which is an indication of the sodic soil condition for soil
dispersion when it is larger than 13, were consistently high in the two 0.25 moles of NaCl
injection experiments, while they only spiked for a short time in 0.25 moles of mixed CaCl2 and
NaCl injection experiment.
29
Figure 4. a) Changes of As, Pb, Hg, and Na- concentrations, b) Changes of Ca, Mg, Cl, Si, Mn, Al
P and Fe, in leachate of the injection experiment of 0.25 moles NaCl into the arsenopyrite and
galena mixed soil.
a).
b).
30
Figure 5. Changes of As, Pb, Hg, and Na- concentrations in the leachate of the injection
experiment of 0.25 moles of mixed CaCl2 and NaCl into the regular soil column.
31

Figure 6. Cl- versus Hg- concentrations from a coastal aquifer of Italy. Data are from Grassi and
Netti (2000).
32

Figure 7. Changes of As-, Pb-, Hg-, and Na- concentrations from the CLW upstream sampling site
between 2012 and 2013.
33
Figure 8. Changes of As, Pb, Hg, and Na- concentrations in soil solution collected by lysimeter #1
from the CLW between 2012 and 2013.
34

Figure 9. Concentration correlation dendrogram for injection experiment of 0.125 moles of NaCl
into the regular soil column.
35
Figure 10. Concentration correlation dendrogram for water samples from the CLW upstream
site in the studied New Jersey watershed.
36
-.50
.51
Cor
rela
tion
Sim
ilarit
y M
easu
re
As Fe Pb S Na Hg Mn Cl Ca Mg Si K P
Dendrogram for upcreek cluster analysis
Figure 11. Concentration correlation dendrogram for soil solutions collected by lysimeter #1 in the studied CLW watershed.
37
Figure 12. Simplified PHREEQC-generated pe-pH diagram for the system of As-O-S-H2O (dash boundary lines) and Pb-Cl-OH (Solid boundary lines) at 25oC and one atmospheric pressure for the estimated pe-pH data from the stream water of DRT gage station, the creek water and soil solution in CLW, and groundwater data from Bangladesh of Reza et al. (2010b).
38
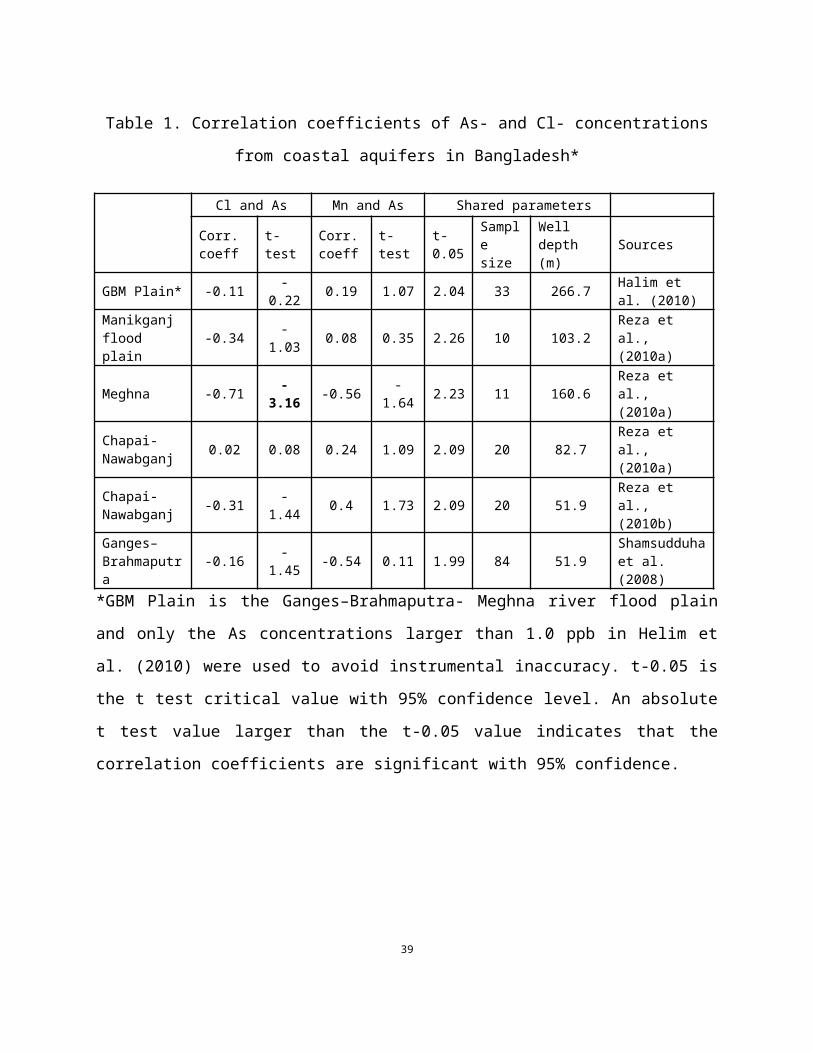
Figure 13. Pb and Cl concentrations measured at the DRT gage station between 2002 and 2008
with a trend line added. Data were obtained from USGS database.
39

Figure 14. Simplified PHREEQC-generated pe-pH diagram for the system of Hg-Cl-S-H2O at 25oC and one atmospheric pressure for the estimated pe-pH data from the stream water of DRT, the creek water and soil solution in the CLW, and groundwater data of Bangladesh of Reza et al. (2010b).
40