viewit: computation of seen areas, slope, and aspect for land-use planning
TRANSCRIPT

8/8/2019 VIEWIT: computation of seen areas, slope, and aspect for land-use planning
http://slidepdf.com/reader/full/viewit-computation-of-seen-areas-slope-and-aspect-for-land-use-planning 1/67
VIEWIT: computation of
seen areas, slope, and aspect
for land-use planning
Michae l R. Travis Gary H, Elsner
W a y n e D. Iverson Christine G . Johnson
"ACIFIC
SOUTHWESTorest and Range
S E R V IC E
S . D E P AR T M E N T O F A G R IC U L TU R E
0 . BO X 245, B ER K ELEY , C A LIFO R N IA 94701
USDA FOREST SERVICE
GENERAL TECHNICAL
R E P OR T P S W - 11 11975

8/8/2019 VIEWIT: computation of seen areas, slope, and aspect for land-use planning
http://slidepdf.com/reader/full/viewit-computation-of-seen-areas-slope-and-aspect-for-land-use-planning 2/67
Travis, Michael R., Gary H. Elsner, Wayne D. Iverson, and Christine G.
Johnson.
1975. VIEWIT: computation of seen areas, slope, and aspect for land-
use planning. USDA Forest Sew. Gen. Tech. Rep. PSW-11, 70 p.,
illus. Pacific Sou thwe st Forest and Range Exp. Stn., Berkeley, Calif.
This user's guide provides instructions for using VIEWIT-a comp uter-ized technique for delineating the terrain visible from a single point or
from multiple observer points, and for doing slope and aspect analyses.
Results are in tabular or in overlay map form. V IEWIT can d o individual
view-area, slope, or aspect analyses or combined analyses, and can produc e
elevation profile charts between any two points in a study area. The guide
explains how to prepare data, select available options, and inte rpre t results.
VIEWIT is designed to operate o n a Univac 110 8 computer w ith Exec-8
operating system. The VIEWIT system is accessible via rem ote terminals to
the USDA Fort Collins Computer Center. For those not having access to
this computer facility, the programs are available on request to: Director,
Pacific Southwest Forest and Range Experiment Station, P. 0. Box 245,
Berkeley, California 94701, Attention, Computer Services Librarian. The
programs will be copied on a magnetic tape to be supplied by th e
requestor.
Oxford: 907.2:U712.01-U681.3
Retrieval Terms: recreation settings, VIEWIT, land-use planning, c om put er
programs, handbooks.
The Authors
MICHAEL R. TR AVIS is a senior programmer in the School of Forestry
and Conservation, University of California, Berkeley, on assignment to this
Pacific Southwest Forest and Range Experiment Station. He was educated
at the University of C alifornia (A.B. degree in physics, 1 96 3 and J.D.
degree, 1968). GARY H. ELSNER is in charge of the Station's forest
recreation research unit, at Berkeley. He received degrees in agricultural
economics at the University o f Arkansas (B.S., 1962 ) and the U niversity o f
California (M.S., 19 64 , and Ph.D., 1966). CHRISTINE G. JOHNSON,
formerly a landscape architect in th e Forest Service's California Region, in
San Francisco, is now with the Federal Highway Administration, in
Boston, Mass. She holds a B.S. degree in landscape architecture (1968)from the University of Massachusetts. WAYNE D. IVERSON is regional
landscape architect, Forest Service California Region, San Francisco. He
earned a B.S. degree (1 955 ) and an M.S. degree (19 56 ) in landsc ape archi-
tecture a t the U niversity of W isconsin.

8/8/2019 VIEWIT: computation of seen areas, slope, and aspect for land-use planning
http://slidepdf.com/reader/full/viewit-computation-of-seen-areas-slope-and-aspect-for-land-use-planning 3/67
CONTENTS Page
Foreword ........................................... 1
1. Identifying Boundaries an d Cell Size . . . . . . . . . . . . . . . . . . . . 4 1.1 Subdivide into Grid Cells .......................... 4 1.2 Decide on Cell Size and Shape ...................... 4
2 . Preparing Terrain Data in Com puter-Rea dable Form ........ 4 2.1 Hand Code Elevation Data . . . . . . . . . . . . . . . . . . . . . . . . . 4 2.2 Digitize Elevation Data . . . . . . . . . . . . . . . . . . . . . . . . . . . . 5
2.3 Obtain Digital Terrain Tapes ....................... 5
2.4 Explore Con tract Digitizing . . . . . . . . . . . . . . . . . . . . . . . . 5
3. Implementing VIEWIT . . . . . . . . . . . . . . . . . . . . . . . . . . . . . . . 5
3.1 Data Definition and Inp ut Commands . . . . . . . . . . . . . . . . 5
3.2 Decide on Data Analysis Options . . . . . . . . . . . . . . . . . . . . 8
3.2.1 Data Specification Com mand s ................. 8
3.2.2 Analysis Com mand s . . . . . . . . . . . . . . . . . . . . . . . . . 10
3.2.3 Display Option Commands .................... 11
3.2.4 Description of Analysis Op tions . . . . . . . . . . . . . . . . 11
3.2.5 Type of Input Expected for Each Command . . . . . . 17
4. Demand Terminal Use ............................... 18

8/8/2019 VIEWIT: computation of seen areas, slope, and aspect for land-use planning
http://slidepdf.com/reader/full/viewit-computation-of-seen-areas-slope-and-aspect-for-land-use-planning 4/67
FOREWORD
VIEWIT is a computerized technique for delineat-
ing the terrain visible from a single point or from
multiple observer points. The results are produced in
either tabular or in overlay map form. VIEWIT can
also be used t o prepare terrain slope and aspect analy-
ses. In addition, the system may be used to do com-bined analyses o f seen area with aspect relative t o the
observer po ints an d weighted by the distance to seen
areas from observer points. The system will also pro-
duce elevation profile charts between any two points
in the study area. Besides these basic capabilities,
VIEWIT has many options for seen-area analyses and
for aspect analyses. The system has been developed
over an eight-year period and the original "seen-area"
program was published in 1968.'
Th e system has been used to help manage and plan
lands which are visually imp ortant. E xamples of ap-
plications include timber harvesting, mining, scenic
tramway routes, bridge proposals, transportation
system alternatives, ski runs, roads, recreation devel-
opments, and fuelbreaks. Additionally, VIEWIT is
being used to determine visual impact, and terrain
slope and aspect inform ation fo r land-use planning.
VIEWIT provides capabilities for several kinds of
analyses o f digital terrain data. The basic inp ut to the
program is a grid of elevation points representing the
area o f interest. A second program input is a series of
user requests that define the form of the elevation
data and cause various operations to be performed.
The system then produces tables and maps showing
the results of these requests.
VIEWIT is designed t o opera te on the Univac 1 108
comp uters w ith Exec-8 operating systems.
What Can VIEWIT Do?
VIEWIT can do these jobs:
1. Verify the consistency of digitized topo-
graphic data through the Data Check option and print
maps in numeric or gray scales as well as tables
showing th ose cells or cell clusters which do n ot m eet
specified tolerances of elevation with their eight
neighboring cells.
2. Expr ess in tables showing square miles, acres,
and hectares the area within the study unit that can
be seen from any single point on the ground or at any
' Amidon, Elliot L., and Gary H. Elsner. 1968. Delineating
landscape view areas . . . a co mputer approach. USDA Forest
S en . Res. Note PSW-180, 5 p., illus. Pacific Southw est Forest
and Range Exp. Stn., Berkeley, Calif.
point above the ground level; map the location of
these seen areas.
3. Express the above information in composite
form from many viewing points within the study area
(viewing points may represent alternative roads, trails,
or other development systems); map these seen areason a numerical printout which indicates the num ber
of times each cell is visible from the viewing points;
map these seen areas on a gray scale printout which
shows all cells visible from 0 to 9 and more than nine
times seen in shades of gray; map these seen areas as a
percentage of times each cell is seen from the total
numb er of observer positions, and print ou t in numer-
ical or gray scale maps or both, thereby providing
further mapping refinement to cells seen more than
10 t imes.
4. Evaluate only a portion of a stud y area (sub-
rectangle) to save time and funds.
5. Evaluate only specified sectors of view suc h
as 0 t o 9 0 , 1 8 0 t o 2 2 0 , or co mbin ations o f
sectors.
6. Evaluate only specified vertical angles of
view.
7. Evaluate only user-specified classes for slope,
aspect and elevation analyses.
8. Develop profile printouts in line with (X,Y)
coordinates or diagonal to these coordinates in any
length specified.
9. Develop tables, numeric maps, and gray shade
maps of elevation values.
10. Develop tables, nume ric maps, and gray shade
maps of slope classes as specified. Slope may be
computed by fitting a plane to the eight neighboring
cells or by finding the maximum slope to these cells.
1 1. Develop tables, nume ric maps, and gray shade
maps of aspects by 36 10-degree classes.
12. Develop tables, nume ric maps, and gray shade
maps of aspect by eight sectors of 4 5 , each centered
on th e principal compass points.
13. Develop tables, nume ric maps, and gray shade
maps of aspect by eight sectors of 4S0, each with
weighting from most desirable to least desirable fro m
any direction which is specified to be mos t desirable.
14. D evelop "aspect relative to the observer"
(vertical tilting and horizontal rotation of the plane
of the grid cell) weighting tables, numeric maps, and
gray shade maps. This weighting is one of the func-
tions of "visual magnitude" weighting. It can be done
for one viewing point or for many.
15. Develop distance-weighting tables, numeric
maps, and gray shade maps. This weighting can be

8/8/2019 VIEWIT: computation of seen areas, slope, and aspect for land-use planning
http://slidepdf.com/reader/full/viewit-computation-of-seen-areas-slope-and-aspect-for-land-use-planning 5/67
adjusted to allow for up t o 20 changes in the distance
weights. Weights may relate to foreground, middle-
grou nd, an d backgro und distances or (e.g.) weights
may be specified to give greater weights to middle-
ground or the middle areas. It can be done for one
viewing point o r for many.
16 . Develop combined distanc e, "aspect relative
to the observer" and times seen tables, num eric maps,
and gray shade maps. These three functions com bined
meas ure the relative visual mag nitude o f each grid cell
or the "visual perce ption sensitivity" of each cell.
Examples of Applications
What are some specific situations and examples in
which VIEWIT has been applied? And what parts or
options of the program would be useful if you were
developing a land-use plan for a visually sensitive
unit?
First, after data collection and preparation you
would perform a Data Check to verify accuracy.
Next, select the key viewing points in the unit and
test a combination of distance weighting, "aspect
relative to observer weighting," and times seen table
which would list the total acreages of each of 10
combined weighting categories and then produce a
gray shade map of these combined weightings. This
provides a map of the "visual perception sensitivity"
of the unit in fine detail. (It would possibly take
months to do this work by manual methods-espe-
cially t o com bine th e weightings of numerous viewing
points.)
In almost every land-use planning situation you
would want to develop a slope class map or perhaps
several types of slope class maps. For areas that could
be logged b y tractors the slope class map and the
tables could be ex amine d t o determine area slopes
less than 35 percent. For potential ski areas, slopes
between 10 percent and 8 0 percent could be deter-
mined by VIEWIT.
Fo r othe r uses the aspect options may be valuable.
T he 4 5 aspect map with eight weighted sectors
might be given highest weighting for northeast expo-sure to map out best ski area or vegetative regenera-
tion potential or selected microclimatic conditions.
Overlay the slope an d aspect maps for ski area poten-
tial, and potential areas would be immediately appar-
ent. If maximum exposure to sunlight were a criteri-
on, the southwest exposure map printout in gray
shades would be mo st useful. These are just a few of
the options that may be helpful.
For an example of project application, consider a
powe r transmission line proposal across a section of
land which yo u manage. If the proposal is of a general
nature in location, you may wish to check its poten-
tial visual impact against the "visual perception sensi-
tivity" ma p prepared in land-use planning (or if this
was not done you may want to select key viewing
points and produce a printout map). If the proposal is
a specific one with tower locations designed, you can
set the viewing point at the top of each tower and
develop tables and maps which show the acreage on
which each tower would visually have imp act, or the
combined visual impact of al l the towers. If the
digitized topogra phic da ta is already available and
you have a computer specialist and a high-speed ter-
minal, this table outp ut and mapping could take just
a matter of minutes to prepare in response t o the
special-use proposal. The same visual impact analysis
could quickly be made of a highway proposal, a
proposed building, electronic relay, a clearcut block,
o r a scen ic t r a r n ~ a y . ~
For fire detection planning, the system can be
used to map the seen area of existing fixed fire
detection stations and t o prepare composite seen area
maps with additional or reduced numbers of stations.
These analyses are then helpful in evaluating the
location and height of new stations in specifying a
system of stations.
Should You Use VIEWIT?
Before investing time and fu nds in using VIEWIT,
the po tential user should answer these questions:
1. Are visual resources of great importan ce in theproposed project or land-use planning activity? Will
they have major effects on decisions?
2. Can the visual analysis be handled through
oth er means with less investment?
3. Does th e user have access t o a high-speed print-
er terminal? If not, can the user work with turn-
around times involved in mailing of inpu t and out pu t
data from other offices; or can work be handled by
sho rt details of individuals t o suc h offices?
4. Is the format of output data compatible with
other data output? If not, can i t be converted to
compatible data by manual graphics (outlining areasor coloring in areas of similar ou tp ut characteristics).
5. If the value of visual analyses is marginal, will
the optional outputs, such as slope and aspect maps
and tables, offset the marginal values in favor of using
VIEWIT?
Elsner, Gary H. 1971. Computing visible areas from pro-
posed recreation developments . . . a case study. USDA
Forest Serv. Res. Note PSW-246, 10 p., illus. Pacific South-
west Forest and Range Exp. Stn., Berkeley, Calif.

8/8/2019 VIEWIT: computation of seen areas, slope, and aspect for land-use planning
http://slidepdf.com/reader/full/viewit-computation-of-seen-areas-slope-and-aspect-for-land-use-planning 6/67
6. Is there high potential for future use of the
input data after its initial usage? For instance, would
there be possibilities of power transmission, road,
timber sale, electronic relay site, etc., proposals with-
in this land unit? If so, visual impacts could be
determined within minutes or hours of the proposal
at negligible costs.
7. Are there possibilities that several slope andaspect classifications will be needed for planning and
design consideration? This program is flexible in pro-
ducing several kinds of slope and aspect classifications
initially or at later dates with no change in stored
data.
8. Will computer-generated output data be ac-
cepted by management and the public as valued infor-
mation for decisionmaking? Will quantitative esti-
mates of visual impacts of alternative land uses be
useful in developing land-use or project plans?This guide provides detailed instructions on how
to use the VIEWIT system. Appendix I lists a sample
deck of punched cards in the form in which they
would be submitted to the computer, and illustrates
the computer printout. Appendix I1 illustrates the use
of a preprocessor program with data in a form that
cannot be read directly by VIEWIT.The VIEWIT system is accessible via remote terrni-
nals to the USDA Fort Collins Computer Center. For
those not having access to this computer facility, the
programs are available on request to: Director, Pacific
Southwest Forest and Range Experiment Station,
P. 0. Box 245, Berkeley, California 94701, Atten-
tion, Computer Services Librarian. The programs will
be copied on a magnetic tape to be supplied by the
requestor.

8/8/2019 VIEWIT: computation of seen areas, slope, and aspect for land-use planning
http://slidepdf.com/reader/full/viewit-computation-of-seen-areas-slope-and-aspect-for-land-use-planning 7/67
1 . IDENTIFYING BOUNDARIES AND CELL SIZE
The f i r s t s t ep i n us i ng VIEWIT i s t o
deci de on the area bounda ries. The area
boundary may be determined by the boundary
o f t he u n i t p l a n and i t s v i s u a l i n f lu e n c e
area . For ins tance , a u n i t p lan o r p ro jec t
boundary may be l im i te d t o p r i ma r i l y t he
Nat ional Forest land on the face of a moun-
t a i n , b u t a c t i v i t i e s on t h a t u n i t co ul d
v i su a l l y impac t a community i n t he va l le ybelow. Ther efor e, th e VIEWIT boundary should
extend beyond the p lan ning u n i t boundary so
that the system can accommodate viewing
po in t s and a l lo w fo r any sc reen ing te r ra in
t h a t l i m i t s t he v i s i b i l i t y o f t h e p r oj e ct
a r ea o r l and un i t .
The second st ep i s t o mark the boundary
on a USGS map (same s ca le as l a t e r used i n
da t a c o l l e c t i o n such as 1 i nch = 1 mi le ,
1 i n c h = 2 m i l e s ) .
1 . 1 Subd iv ide I n t o Gr id Ce l l s
Subd iv ide the rec ta ng le enc los ing the
a re a o f i n t e r e s t i n t o c e l l s . Each c e l l i s
a minimum element fo r analys i s . The c e l l s
may be rec tangular rather than square.
Smal le r c e l l s a l l ow a more accura te ana lys s
o f seen areas, s lop e and aspect, bu t requi r e
more data c ol le c t io n ef f o r t and more computer
c o s t s f o r a n a l y s i s .
1.2 Decide on Ce ll Si ze and Shape
Dec ide on the ce l l s i ze needed fo r t he
p l an n in g e f f o r t . I f the computer output
map i s t o be used as an over lay the topo-
gr aph ic map at l a t e r stages and a high-speed
l i n e p r i n t e r i s t h e o u t pu t method, t h e c e l l s
should be rec tangular t o conform t o the
1/5 inch x 1/6 inch char acte r type o f ap r i n t e r now .
For example:
C e l l S i z e =
1 i nch = 1 m il e 2 1.33 acres @
1/5 inch x 1/6 nc h
2 inches = I m il e 5.4 acres @
1/5 i nch x 1/6 nch
1 :24,000 3.1 acre s @
(7$-min. quad.) 1/5 in ch x 1/6 nc h
1 :62,500 20.6 acr es @
(15-min. quad.) 1/5 inc h x 1/6 nch
To dec ide on map scale t o ce l l s ize ,
cons ider (a) the amount of de ta i l requ i red
f o r t he s tudy ; (b ) t he var ia t i on o r complex-
i t y o f t e r r a i n ; ( c ) t im e and d o l l a r s a v a i l -
able; and (d) whether the data w i l l be used
aga in f o r more de ta i le d s tud ies w i th VIEWIT.
The map sca le chosen f o r th e VIEWIT an al-
yses should be compat ib le wi th th at used f o r
o t he r p l ann i ng v a r i ab l es . I t may a l s o be
impor tan t t o choose a ce l l s i z e and sca le
which i s the same as adjacent p lann ing uni ts .
Not enough experience has been gained as
y e t t o p i n down f i r m l y t he c o st s o f d i g i t -ized t e r r a i n data, but we have found th at
the work may be done on a con tr ac t ba sis f o r
approx imately I+ t o 2 cents per ce l l t h rough
the use o f au tomat ic d i g i t i z in g equ ipment .
The cost may go as high as 4 cents per cel I.
Manual d i g i t i z a t i on ( i n - s e r v i c e by ex pe ri -
enced pe rson nel) has been done a t cos ts o f
up t o 8 c e nt s p er c e l l . This cost data
should change r a p id ly once more expe rien ce
i s ga ined bo th w i t h in -serv ice automatedd i g i t i z i n g and c on tr ac te d d i g i t i z i n g o f
topographic data.
2. PREPARING TERRAIN DATA IN COMPUTER-
READABLE FORM
Once the e le va t io n g r i d loca t ion and
si ze have been chosen, the el ev at io ns must
be pu t i n machine-readable form. This form
w i l l usu al l y be punched cards but could be
magnetic tape i f storage space i s a consid-
era t ion . F requent ly , t he e lev a t io n da ta
w i l l be permanentl y s to red i n card form i n
t he o f f i c e w i t h a t ape o f t h i s i n f o r m a t ion
be ing used a t t he computer f a c i l i t y .
No one spe c i f i c format i s requi red fo r
the ele va t i on data. The user should choose
a form at th a t i s compact, co nvenient, and
has the require d amount o f pre cis ion . For
example, i t may be he lp fu l t o omi t t he la s t
( un i t s ) d i g i t o f e l ev a t i ons t o save space on
the da ta medium and t o record o nly the m ini -
mum necessary row and column i nf or ma ti on on
each data card.
Many a l ternat ive procedures are avai l -
ab le fo r ob ta in in g computer readab le d i g i t a l
topographic data (DTD) . Topographic maps
should be obta ined t o the same scale f o r the
ent i re s tudy a rea . The USGS 74-m in ute maps
are o f ten the most accura te ava i lab le .
Obta inin g these topograph ic maps i s an
i m po r tan t f i r s t s t ep f o r any p rocedu re .
Some o f the ba s ic d i g i t i z a t i o n procedures
are:
I. Overlaying a topographic map on a
I i qh t t ab l e w i t h a dat a g r i d and c odi ng e l e -
v a t i o n va lu es d i r e c t l y i n t o each c e l l .
2 . Us ing automat ic d i g i t i z e r equipment
t o record con tours and th e i r e leva t ion
v al ue s i n l i n e f or m and u t i l i z i n g a d d i t i o n al
s o f tw a r e t o c onve r t and i n t e r po l a t e t o a
un i f o r m g r i d .
3 . O b ta i ni n g t h e d i g i t a l t e r r a i n d a ta
on magnetic tapes from the U. S. Defense
Mapping Agency and usi ng ad di t i on al sof tw aret o a s s i s t i n da t a v e r i f i c a t i o n and i n t er p r e -
t a t i on f o r t he s t udy a r ea .
4. Use o f outs ide consul tant cont ra c t
f o r p r epa r a t i on o f d i g i t i z ed t opog raph ic
data tapes either by manual or automat ic
d i g i t i z i n g e qu ip me nt.
2.1 Hand Code El ev at io n Data
Th is method invo lves us ing a l i g h t t ab le
and t opo grap hic map t o obt ai n computer-

8/8/2019 VIEWIT: computation of seen areas, slope, and aspect for land-use planning
http://slidepdf.com/reader/full/viewit-computation-of-seen-areas-slope-and-aspect-for-land-use-planning 8/67
readab le te r r a i n da ta . This procedure may
b e p re fe ra b l e if the s tudy a rea i s sma ll ,
and ind iv idua ls w i th cod ing exper t i se a re
a va i l a b l e .
I. Prepare a gridde d map ove rl ay
( se l e c t a r e cta n gu l a r g r i d , w i t h a r a t i o o f :
1/5 by 1/6 inch i f output i s by h igh-speed
1 i n e p r i n t e r ) .
2. Pla ce 76-minute o r 15-minute map on
Ii g h t t a b l e and o ve r l a y w i t h d a ta g r i d ( t ap e
b o th t o t a b le ) .
3. Code tw o- di gi t (hundreds o f fe et )
e l e va t i o n va lu es i n each ce l l .
4. Have data sheets cardpunched and
v e r i f i e d (OCR forms are a pos sib le opt io n) .
5. Use sim ple computer programs t o read,
f i l l the da ta mat r i x , and t o p r i n t an over lay
da ta map t o ass is t i n check ing o f the da ta
f o r accuracy .
2 .2 D i g i t i ze E l e va t i on D ata
Use d i g i t i z e r s t o reco rd con tou rs and
e le va t ion va lues . Th is procedure i s fas te r
and more complex than the procedure ju s t
descr ibed . I t i s more appropr ia te i f ala rge area i s t o be modeled. I t i nvo lves
hand l in g the infor mat ion on computer-
reada ble tapes, and thus th e ope rat or
should have exper ience i n wr i t in g programs
f o r r e a di n g and w r i t i n g l a rg e d a ta s tora g e
tapes. The fo l l ow in g basic s teps are
invo lved i n us ing t h i s p rocedure.
1 . D i g i t i z e c on to ur s
2. Check readabi l i t y o f co nto ur t ap es
3. Prepare un i form gr id data f rom con-
tour tapes: (a) check a sample of po in ts by
ove r la y in g coded e le va t i on map on or ig in a l
t o p 0 map; ( b) se l e c t ce l l s i ze ca r e fu l l y i norder t o produce one-to-one ove rla y maps
(1/5 by 1/6 in ch i f outp ut i s by h igh-speed
1 n e p r i n t e r ) .
4. I f necessary d i g i t i z e more contours
and add t o data base
5. Complete data ma tr ix by in te rp o l a t io n
6. Check accuracy o f da ta ma tr ix
7 . Cor rec t da ta mat r i x i f necessary
2 .3 Obta in D ig i ta l Te r ra in Tapes
D i g i t a l t e r r a i n tap es a re a v ai l a b l e f o r
the con t inen t a l Un i ted S ta tes and pa r ts o f
Alaska. The inf orm ati on has been d i g i t i z e d
fr om 1/250,000-scale USGS to po gr ap hi c maps
and i n te rp o l a te d t o prod uce a d a ta p r i n t f o r
about ever y 208.33 f e e t on the ground. The
magnetic tape used i s $-inc h IBM compatible,
reco rded i n odd pa r i ty , b ina r y a t 556 bp i
us in g an int er- rec ord gap o f 0.75 inch. Two
2,400 fe et ree ls o f tape conta in the DTD f o r
one 1/250,000-scale to po gr ap hi c map she et.
Tapes are prov ided t o users f o r them t o copy
and re tu rn o r i g i n a l s t o t h e U. S. Defense
Mapping Agency. The DMA d at a are accur ate
w i th in abou t 6 400 fe e t h o r i zo n ta l l y and *100 fe e t ve r t i ca l l y . Map indexes o f ava i l -
abl e DTD tapes are av ai la bl e from the Nat ional
Cartographic Info rmat ion Center, U.S. Geological
Survey, 507 Nat ion al Center, Reston, Vi r g i n i a
22092. Ob tai nin g the tapes from the Center may
tak e several weeks o r a few months. The VIEWIT
system provides automatic user-oriented access
t o these tapes.
2 .4 Exp lo re Con trac t D i g i t i z i ng
Using consu l tant computer f i rm s f o r d ig-
i t i z i n g t o po gr ap hi c da t a has t h e p o s s i b i l i t y
o f being more economical than th e oth er two
methods. The la rg er the area, th e more
l i ke l y t h a t t h i s method w i l l be th e b e s t
a l te rn at iv e. The fo l l ow in g steps are recorn-
mended:
1. Develop spe ci f ica t io ns or modi fy
e x i s t i n g sp e c i f i ca t i o n s f o r t o po gra ph ic
d i g i t i z a t i o n .
2. Develop a coord inate system gr id on
the topographic map t o be suppl ied t o th e
con t rac to r .
3 . Prepare and execute contract action.
3 . IMPLEMENTING VIEWIT
The f i r s t f o l l o w i n g se c t i o n on d a ta
d e f i n i t i o n and i n p u t i s i nten de d fo r t h e
members o f the an al ys is team w i t h program-
ming knowledge and re sp on si bi l i t i es . Those
u se rs n o t i n vo l ved d i r e c t l y w i t h t h e com-
p u te r a p p l i ca t i o n may w ish t o r e f e r t o t h e
second sect ion on ana lys is op tio ns i n more
d e t a i l and o n l y r ev i ew th e f i r s t s e c t io n .
3 .1 Data De f i n i t i on and Inpu t Cma ndsThe system assumes t h a t the area o f
in te re st has been def in ed by a rect angle
drawn on a map. The recta ngl e i s or ie nt ed
so th a t i t s l ow er edge i s t h e X a x is , i t s
l e f t edge th e Y a x i s , w i th +Y p o i n t i n g n o r t h
and +X p o i n t i n g e as t ( f i g . 1 ).
( I f t he +Y a x i s o f t h e d a t a g r i d i s n ot
a l igne d wi th nor t h , the program can be t o l d
t o compensate f o r t h is , see th e ROTATE
opt io n i n the fo l l ow ing tab le o f commands
and f o l l ow i ng d i scuss ion . )
T h is r e c t a ng l e i s d i v i de d i n t o c e l l s o f
a convenient s ize, and each c e l l has been
assigned an ele va ti on by one o f th e methods
discussed i n Sect ion 2 . The lower le f tmos t
c e l l i s c e l l (1 , l ) . The number o f ce l 1s
across the rec tan gle i s th e number of
columns, NCOLS, and the number o f c e l ls f rom
8/8/2019 VIEWIT: computation of seen areas, slope, and aspect for land-use planning
http://slidepdf.com/reader/full/viewit-computation-of-seen-areas-slope-and-aspect-for-land-use-planning 9/67
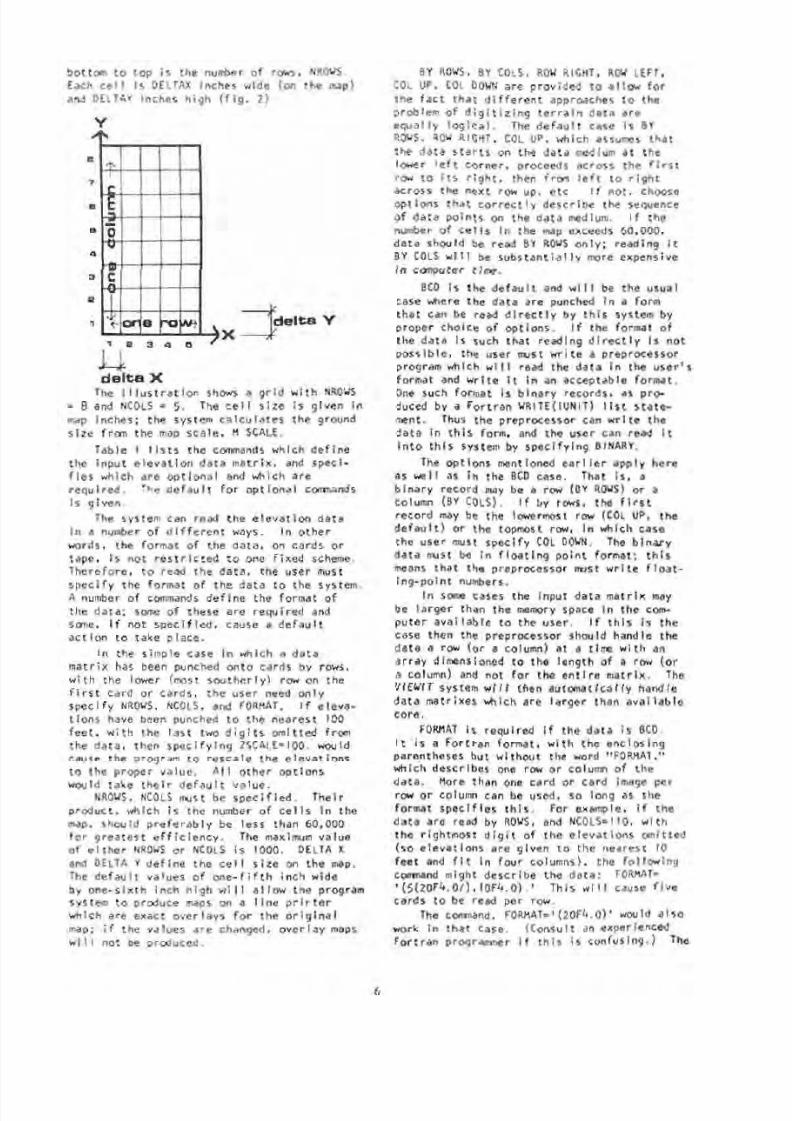
bot tom t o to p i s t he number o f rows, NROWS.Each c e l l i s DELTAX i nches wid e (on th e map)and DELTAY inches h ig h ( f i g . 2 ) .
Y
2 elta V
delta X
The i 1 l u s t r a t i o n shows a gr i d wi t h NROWS= 8 and NCOLS = 5. The c e l l s i ze i s g i ven i n
map inches; th e system ca lc ul at es t he ground
s i z e fr om t he map scal e, M SCALE.
Table I l i s t s the commands which def i nethe inpu t e l eva t io n da ta mat r ix , and spec i -f i es wh ich a re op t i ona l and wh ich a re
requ ired . The de fa u l t fo r opt i ona l commandsi s g i ve n .
The system can read the e le va t i on datai n a number o f d i f fe re n t ways. I n o t h e rwords, the format o f th e data, on cards ortape , i s no t r es t r i c te d t o one f i xe d scheme.Therefore, t o read the data, the user must
spec i f y the fo rmat o f the da ta t o the system.A number o f commands de f i ne the form at ofthe data; some o f these are r equ ir ed andsome, i f no t spec i f ied , cause a de f au l ta c t i o n t o t a k e p l ac e .
In the s imp le case i n wh ich a da tama t r i x has been punched on to cards by rows,wi th the lower (most southe r ly ) row on thef i r s t ca rd o r ca rds , the user need on l ys p e c i f y NROWS, NCOLS, and FORMAT. I f eleva-t i on s have been punched t o th e near est 100
f e e t, w i t h t he l a s t t wo d ig i t s o m i t t e d f romthe data, the n s pe c i f yi n g ZSCALE=I00. wouldcause the program t o r esca le the e l evat i ons
t o t h e p rop er va lu e. A l l o t h e r o p t i o n s
w o u ld t a ke t h e i r d e f a u l t va lu e .NROWS, NCOLS must be s p e c i f i e d . Th e i r
p rod uc t , w hi ch i s t h e number o f c e l l s i n t h emap, should pr ef er ab ly be less than 60,000f o r g r ea t es t e f f i c i e n c y . The maximum valueo f ei t h e r NROWS o r NCOLS i s 1000. DELTA X
and DELTA Y d e f i n e t h e ce l l s i ze o n t h e m a p .The d e f a u l t va lu es o f o n e - f i f t h i n ch w id eb y on e -s ix t h i n ch h ig h w i l l a l l o w t h e programsystem t o produce maps on a l i n e p r i n t er
w h i ch a re e xa c t o ve r l a ys f o r t h e o r i g i n a lmap; i f the values ar e changed, ov er la y mapsw i l l not be produced.
BY ROWS, BY COLS, RO W RIGHT, ROW LEFT,COL UP, COL DOWN ar e pr ov id ed t o al l o w f o r
t h e f a c t t h a t d i f f e re n t a pproaches t o t h epr ob lem o f d i g i t i z i n g t e r r a i n da t a ar eequa l ly l og i ca l . The de f au l t case is BYROWS, ROW RIGHT, COL UP, w hich assumes t h a t
the data s ta r t s on the data medium a t th elower l e f t co rner , p roceeds across the f i r s trow t o i t s r i g h t , t hen from l e f t t o r i g h t
across the next row up, et c.I f
not, chooseop t ions t ha t co r r ec t l y descr ibe the sequenceof data points on the data medium. I f thenumber o f c e l l s i n th e map exceeds 60,000,da ta shoul d be read BY ROWS onl y; re ad in g i t
BY COLS w i l l be su b st an t i al l y more expensivei n computer t ime.
BCD i s the de fa u l t and w i l l be the usual
case where the d ata a re punched i n a formtha t can be read d i rec t ly by th is sys tem byproper cho ice o f op t ions . I f t he fo rmat o ft h e d a t a i s su ch t h a t re ad ing d i re c t l y i s n o tpossib le , the user must wr i t e a preprocessorp rogram which w i l l read the da ta i n the user ' sformat and write i t i n an acceptab le format .
One such form at i s bi na ry rec ords, as pro-duced by a Fort ran WRITE(IUNIT) l i s t st ate -ment. Thus the preprocessor can w r i t e thedat a i n th i s form, and the user can read i t
i n t o th i s system by spec ify ing BINARY.
The opt ions ment ioned ear l ier apply hereas we l l as i n th e BCD case. That i s, abinary record may be a row (B Y ROWS) o r acolumn (BY COLS). I f by rows, the f i r s tre co rd may be th e l owermost row (COL UP, t hede fa u l t ) or the topmost row, i n which case
the us er must spec i f y COL DOWN. The binaryd a t a must be i n f l o a t i n g p o in t f o rm at ; t h i smeans tha t the preprocessor must wr i t e f l oa t -ing-point numbers.
I n some cases the inp ut da ta ma tr ix maybe l ar ge r th an t he memory space i n the com-p u t e r a va i l a b l e t o t h e user . I f t h i s i s t hecase then the preprocessor should handle thedata a row (or a co lumn) a t a t ime wi t h anarr ay d imensioned t o the length o f a row (ora column) and not fo r the en t i r e mat r i x . The
VIEWIT system wi l l then automat ica l ly handleda ta mat r ixes which are la rg e r than ava i l ab lecore.
FORMAT i s r equ i red i f the d ata i s BCD.I t i s a F o r tr a n fo rm at , w i t h t h e e nc l o s in gparentheses bu t wi th ou t the word "FORMAT,"which describes one row o r column o f the
data. More than one card o r card image perrow o r column can be used, so lo ng as t heformat spe ci f i es th is . For example, i f t he
da ta ar e read by ROWS and NCOLS=llO, w i t ht h e r i g ht mo s t d i g i t o f t h e e l e v at i o n s o mi t te d(so e leva t ions a re g iven t o the neares t 10
feet and f i t i n fou r co lumns) , the fo l l ow ingcommand might describe the data: FORMAT=
(5 (20F4 .0/ ) ,10F4 .0 ) . ' Th is w i l l cause f i vecards t o be read per row.
The command, F OR MA T =' ( ~O F ~, O ) 'ould alsowork i n th at case. (Consult an experienced
Fo r t ra n programmer i f t h is i s confusing. ) The

8/8/2019 VIEWIT: computation of seen areas, slope, and aspect for land-use planning
http://slidepdf.com/reader/full/viewit-computation-of-seen-areas-slope-and-aspect-for-land-use-planning 10/67
T a b l e 1 --C om ma nd s d e f i n i n g i n p u t e l e v a t i o n d a t a m a t r i x , o p t i o n a l co mm an ds , a nd d e f a u l t s
Command MeaningRequ i r e d o r
o p t i o n a lD e f a u l t
NROWS Number of rows Requ i r e d
NCOLS Number of co lum ns Requ i r e d
DELTA X X s i z e o f c e l l ( o n m ap ) O p t i o n a l OELTAX = 1 / 5 i n c h
DELTA Y
BY ROWS
BY COLS
BCD
BINARY
Y s i z e of c e l l
D a t a ap p e a rs o n e r o w p e r r e c o r d o r r e c o r d s o nt h e d a t a m e di um
D a t a a p p e a rs b y c o l um n s , o n e c o l . p e r r e c o r d
o r r e c o rd s
T he d a t a i s i n c o de d fo r m ( c a r d s , o r c a r di m ag e s o n t a p e o r d r u m )
Th e d a t a a p p e a r s ( o n t a p e o r d ru m ) w i t h o neb i n a r y r e c o r d p e r r o w ( o r p e r c o lu m n i f BYCO LS was s pec i f i ed )
O p t i o n a l
O p t i o n a l
O p t i o n a l
IO p t i o n a l
O p t i o n a lIDELTAY = 1 / 6 i n c h
BY ROWS i s ass um edi f n e i t h e r BY ROWS
no r BY COLS i ss p e c i f i e d
BCD i s assumed
i f n e i t h e r i ss p e c i f i e d
ROW RIGHT
ROW LEFT
E ac h r ow a p p ea r s o n t h e d a t a m e diu m fr o m l e f t t or i g h t ( f r o m w e st t o e a s t, a s o n t h e map )
Rows a p p e a r o n t h e d a t a m e d iu m w i t h t h e d a t a f r o m
r i g h t t o l e f t ( e a s t t o w e st )
O p t i o n a l
O p t i o n a lI ROW RIGHT i s
assumed i f n e i t h e ri s s o e c i f i e d
COL UP
COL DOWN
E ac h c o lum n ap
b o tt om t o t o p
Columns appears o u t h )
pea r s on t( s o u th t o
f r o m t o p
h en o
t o
d a t a mr t h )
b o t t o m
ed ium f r om
( n o r t h t o
O p t i o n a l
O p t i o n a l1CDL UP i s a ss um e d
i f n e i t h e r i s
s p e c i f i e d
M SCALE M a p s c a l e O p t i o n a l M SCALE = 24000
FORMAT A l e g a l F o r t r a n fo r m a t w h ic h w i l l r e a d on e r o w
( o r o ne c o l u m n i f BY COLS ) o f t h e e l e v a t i o n d a t af r o m t h e i n p u t m ed iu m . T he d a t a m u s t b e re a d b yF s p e c i f i ca t i o n s , n o t I ( t h a t i s , 3 - d i g i t f i e l d s
m us t be r ead as F 3 . 0 , no t as 13 )
R e q u i r e d ifd a t a i s BOC,
i g n o r e d i f
d a t a i sB INARY
-- -
Z SCALE A m u l t i p l i e r w h i ch w i l l b e a p p l i ed t o e ac he l e v a t i o n v a l u e r ea d i n
O p t i o n a l ZSCALE = I.0
F I LE
ROTATE
T he nam e o f t h e E x ec -8 f i l e o n w h i c h t h e e l e v a -t i o n d a t a w i l l b e f ou n d. T h i s m u st b e c a t a l o g e d
o r t e mp o ra r y f i l e a t t a c h ed t o t h e r u n e x e c u ti n gt h i s s ys te m .
T he a n g l e t h a t N o r t h m ake s c l o c k w i s e o f t h e + Y
a x i s
O p t i o n a l
O p t i o n a l
The d e f a u l t f i l ename i s ZDATA
ROTATE = 0
MEMORY The max imum amount o f e x t r a memory th e V IEWIT
s y s te m s h o u l d a s k f o r f r om t h e E x e c- 8 o p e r a t i n gs ys te m i n o r d e r t o r e ad i n t h e d a ta
O p t i o n a l MEMORY = 60000
format can be up t o 120 char acte rs long i f
necessary.
Z SCALE al l ows omission of le s s- si gn if i
can t d i g i t s f rom the da ta . I n the example
j us t desc r i bed , Z SCALE = 10. would be
spec i f i ed to resca le the da ta. T ha t i s ,
l l .4 1 7 f e e t would be punched as 1142, read
as 1142. and sc al ed t o 11420. ZSCALE app lis
t o bo th b i na ry and BCD data.
FILE i s p rovi ded t o a l l ow the user t o
have several data f i l e s i n the same run. I n
the usua l case, the user w i l l s imp ly c rea tea temporary f i l e named ZDATA and p lace h i s
dat a cards thereon.
MSCALE i s t he re ci pr oc al o f the map
rep resen ta t i ve f r ac t i on . The de fau l t o f
24000 i s cor rec t f o r 74-minute maps.
ROTATE i s prov ided i n case the dat a g r i d
i s no t a l igned w i th the compass d i rec t io ns .
The d e f a u l t va lu e (ROTATE=0) means t h a t t he
p o s i t i v e Y ax i s o f the g r i d i s no r th . For
example, i f t he d i r e c t i o n n o r t h a c t u a l l y
points between + Y and +X , as the draw ing
shows, then the user would so ec if v
( f i g
VIEWIT can handle data g ri ds o f any size .
However, th e computer has a l i m i t e d amount o f
memory available. I f t he da ta f i t i n t o t h i s,
then they are a l l kept i n memory. I f not,
por t i ons o f the da ta (ca l l ed 'pages ' ) a re
kept i n memory, and other p or ti on s are store d
on auxi 1 ia ry storage (d i sk or drum storage).
This mode o f op era tio n invo lves g rea ter
cos ts f o r t r ans fe r r i ng da ta to and f rom
memory, b ut le ss er memory co st s. VIEWIT
assumes, as a de fa ul t value, t h a t i t can ask
the Exec-8 ope rat ing system f o r up t o 60,000
8/8/2019 VIEWIT: computation of seen areas, slope, and aspect for land-use planning
http://slidepdf.com/reader/full/viewit-computation-of-seen-areas-slope-and-aspect-for-land-use-planning 11/67
w or ds o f e x t r a memory t o s t o r e t he da t a g r i d .I f the data gr i d has more than 60,000 ce l l s ,the pagi ng mode i s used. Depending on th e
t o t a l amount of memory ava i l ab le on the com-pu t e r f o r t he us er and on t he r e l a t i v e c os t so f computat ion, in pu t/o utp ut , and memory, i t
w i l l somet imes be less expens ive t o processl a r g e d a t a g r i d s b y s e t t i n g t h e v a lu e o f
MEMORY t o some l a r g e r number. MEMORY ca nnotbe s e t l a r ge r t han t he t o t a l amount o f us e r
memory ( i f t h e da t a g r i d i s t h i s l a rg e ), o rt h e Exec-8 s ys te m w i l l k i l l t h e u s e r ' s jo b .
The f i n a l command re la t i ng t o read ingel ev at io n da ta i s READ. Thi s command i s
g i ve n a f t e r a l l d a t a fo rm at s p e c i f i c a t i o n shave been prov ide d and causes the system t oask f o r s u f f i c i en t memory spac e f o r t he da t afrom the Exec V I I I sup er vis or y system. Whenth i s space i s made ava i lab le , t he da ta a rer ead i n as s pec i f i ed . T h i s p r oc ess o f speci -
f y i n g and read in g da ta can on l y be done once
per program execut ion. O f course, the pro-gram system can be re-executed as many t imesas des i red .
The user should, t o summarize, de f i ne thee x t e n t o f t h e e l e v a t i o n a r r a y and i t s f or ma ton th e da ta medium, the n cause i t t o be read .
A t t h i s p o i n t i t becomes pos s ib l e t o exerc ise
t h e a n a l y t i c a l o p t i o n s .
3.2 Dec ide on Data Analys i s Opt ions
Two pr in c i pa l c lasses o f ana lys i s can beperform ed w i t h the dat a. Each has a number
o f v a r i a t i o n s . I n a d d i t i o n , s ev e ra l o t h e rk ind s o f ana lyses a re ava i lab le . The two
p r i n c i p a l o p ti on s a re ( a) v i s i b i l i t y and
(b) s lope/aspec t analyses. To understand theuse o f t hese op t ions and the var ious d isp layso f t h e i r r es u l t s , t he us e r m us t unde rs tand
the method used by the system.Two f i e l ds o r v a l ues a r e as s oc i a t ed w i t h
eac h c e l l o f t he map. One f i e l d i s e l ev a t i on ,which i s read usi ng t he commands discusse de a r l i e r . The o t he r f i e l d i s a v ai l ab l e f o reach ana ly s is op t ion t o p lace a number in ;t he s i gn i f i can ce o f t he number var i es depend-in g on t he o p t i on chosen.
The user can d isp lay a table showing thef requenc y o f oc cu r rence o f eac h v a l ue f o r a l lc e l l s b y th e TABLE command. A numeri c map
s howi ng t he c on t en ts o f t he num er ic f i e l d f o reach c e l l can be pr i n t e d by t he MAP command.A gray-sca le map o f t he same in form at io n i s
pr oduc ed b y t he GMAP command.
The c on ten t s o f t he numeri c f i e l d f o reach c e l l i s i n i t i a l l y z er o. I t can be r es et
t o z er o by th e u ser by th e CLEAR command.This i s somet imes necessary.
The sequence t o be fo l l owe d i s : Per formt he des i r ed ana l y s i s . Then p r i n t a t ab l e , o r
a numeric map, o r a gr ay- sca le map, o r two o fthese, or a1 1 t h r e e i f des i red , i n any o rder .
Then erase the numeric in for ma t io n and per-fo rm the nex t ana lys i s . The excep t io n t ot h i s i s v i s i b i l i t y a na ly si s; i t may be desir-
ab l e t o per f o r m s ev e ra l o f t hes e be f o r ep r i n t i n g a t a b l e o r map.
3.2. 1 Data Sp ec if ic at io n Commands
The f o l l o w i n g i s a l i s t o f t h e d a ta
sp ec i f ic at io n commands assoc iated w i th dataana l y s i s :
Command Meanin q
X MIN These fo ur c m a n d s taken
toge ther de f ine a subrec tang le
X MAX w i t h i n th e da ta upon whichana lys is w i l be perfor med, and
Y MIN maps and tabl es w i l l be l i mi te d
t o th i s subrec tang le . TheY MAX d e f a u l t va lues a r e X MIN=I,
Y MIN=I, X MAX=NCOLS, Y MAX=
NROWS, so t h a t t he d e f a u l t sub-r e c t an g l e i s t h e e n t i r e d a t aarra y. The subrect angle can bechanged a t any t ime, bu t chang-i n g i t a f t e r an ana l y si s bu t
be f o r e p r i n t i n g a map o r t ab l ew i l l p r oduc e us el ess r e s u l t s .Wel l thought out use of thesecommands w i l l save many d o l l a r s
i n comput ing when th e da tam a t r i x i s l a r ge .
T ITLE S p ec i fi e s a ru n t i t l e o f up t o120 charac te rs which w i l l bep r i n t ed a t t he t op o f each page.
The d e f a u l t i s a b la nk t i t l e .
(An example is: TITLE = 'MOUNTRUSHMORE PLANNING UNIT')
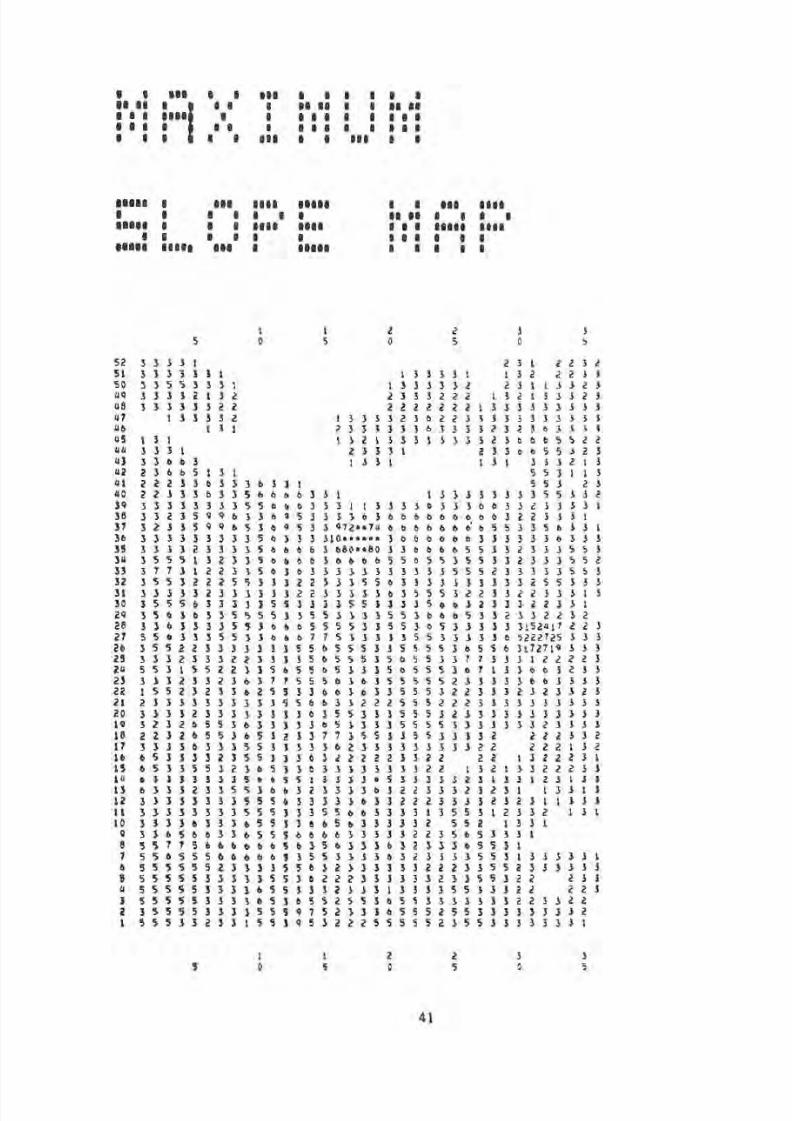
M TITLE Spec i f i e s a map t i t l e o f up t o24 characters which wi l l bep r i n t e d i n l a rg e b l oc k l e t t e r sbefore each map. I t i s p r i n te d
i n two l i ne s o f 12 charac te rseach in cl ud in g blanks. The de-f a u l t i s 24 b l ank s. Bo th TITLEand MTITLE can be changed when-
ever desi red . (An example o fMTITLE i s : MTITLE = 'TRUCKEEUNITSLOPE MAP.' T h i s i n st ru c -
t i o n w i l l r e s u l t i n t he p r in t -i n g o f t h e f i r s t 12 c h ar a ct e rswhich are TRUCKEE UNIT on thef i r s t l i n e and t h e second l i n ew i l l t he n co n t a i n t h e n e x t 9characters which are SLOPE MAP.)
XOBS These t wo commands s e t an
o bs er ve r p o i n t l o c a t i o n f o rYOBS v i s i b i l i t y a n al y si s . Th is
in fo rmat ion mus t be spec i f i eda t l e a s t once . XOBS and YOBSar e i n g r i d c o - o rd i na t es .
OBS Serves as an alt er na t i ve way tospe c i f y t he observer loca t ion .OBS = (22,14) i s equiva lent t oXOBS = 22,Y OBS = 14.
RAD IUS Spec i f i e s t he rad ius t o whichv i s i b i l i t y w i l l be determined.I t i s g i v en i n m i les , and mustbe spec i f i ed .

8/8/2019 VIEWIT: computation of seen areas, slope, and aspect for land-use planning
http://slidepdf.com/reader/full/viewit-computation-of-seen-areas-slope-and-aspect-for-land-use-planning 12/67
APPEND I X IThis appendix shows a simple VIEWIT ru n i n which the data i s read di r ec t ly by the system.
The pr in t out s show f i r s t , a l i s t i n g o f the cards to be submitted to the computer, ju s t as they
would appear i n the inp ut deck. This i s fol lowed by the actual computer output re su lt in g from
the submission o f these cards.
The pr in to ut s demonstrate how the ele vat ion data is placed on a f i l e named ZDATA by the use o f
the @DATA contro l card . The use r commands f o l l o w t he @XQT card which c a l Is the V I EWIT system in to
execution.These commands f i r s t spe cif y th e si ze and form of the el eva tio n data and cause i t t obe read. They then pe rfor m a number o f simple analyses.
OHOG * * * OE MnN S T R AT I ON R U N * * *0 MS G. N O A T A I N P U T I S F RO M CA RO SI0ASG.T ZOATA. . C R E A T E A T EM PO RA RY F I L E , ' l O A T A m t ¥ O A T A , Z O A T A . . I N S E R T O AT A C A R 0 I M A G E S I N T O F I L E ' ZO A TA .'. . . . . . . . . . . . . . . . . . . . . . .* OATA CARf tS GO HERE. . . . . . . . . . . . . . . . . . . . . . . ¥ E N T H y S C A RD I S N E E DE D TO S T O P  ¥ D AT F RO M I N S E R T I N G C AR DS .à ˆ X Q P S W * V I ~ W I T , a N O W R U N T H E V I E N I T S Y S T E MC O M M E N T à ‡ ! F I R S O E F I N E A N 0 R E A D T H E O A T A ' ,N RO WS ç 52 N t O L S x i b , Z S C AL E à ˆ~ O O . F O R M A T = I ( 3 b F i m 0 ) ! , C OL D OW N, R EA D,C OMMEN T =! NOf E U SE OF Z SC ALE T O BR I N G T H E D AT A T O T H E R I GH T R AN GE' ,C O M M E N T ~ ~ O E F A U L T S U CH AS ROW R I G HT , B CD, ~ S C A L E = ~ U O O OAVE BEEN U SED . ' ,C OM ME NT m'N Ow D E F I N E AN OB SE RV ER P O I N T A N 0 0 0 A V I S I B I L I T Y A N A L Y S I S ' ,M T I T L E s ! S E E N A R E A S M A P ' ,O B S a ( Z 2 , 1 8 ) , R A O I U S s l m 5 , V I E W, C O MM E NT = 'N O W P R I N T A N U MER I C MAP ' ,
M AP , C O M M E N f 'A N O A G R EY , S C A L E M A P ' ? M T I T L E Z " ,MESSAGEa ! GR pY SC ALE SSEE N AR EASMAP' , GMAP,C OMMEN T a ' AOn A SEC OND O B S E R V E R ' Ã ˆ O B S = ( ~ O , ~ Q ) , V I â ‚M T I T L E Ã § I T I M p S E E N I M A P ' , M A P ,C O M M E N T s 'N o w W I T H T HE A V E R A GE M AP O P T I O N I N S T E A D , ' ,A V G M A P , M T T T L E S I A V E R A G E MAPSTIMES S E E N ' , M A P , M T I T L E ~ ! ~ ,
M E S S A G E a t G R ~ Y S C A L E I T I M E S S E E N S A V ER A G E M A P ', G MA P, N UM MA P,C O M M E N T S ~ N U M MAP COMMAND SET MAP MODE BACK TO THE DEFAULT OFE S S E E N ' , C O MM E NT * ' C L E A R C O U NT F I E L D A ND D O A NEW SET OF V, M T I T L E a ' e U B R E C T A N G L E ' , C L E A R, X M I N = 1 0 , Y M I N a l O , Y r t A X = 3 0C O M M E N T a l N O w A L L O P T I O N S A F F E C T O N L Y T H I S S U B R E C T A N G L E . ! , V IC O M ME N T a' N O w GO B A C K T O T H E W HO LE D A T A G R I D ' , X M I N r l , Y M I N a lC O M ME N T È I E XA M I N O NL Y C E R T A I N A Z I MU T H SE CT OR S FO R V I S I B I L I T Y
N U MER I C MAPS UF T I M
I S I 6 I L I T Y A N A L Y S E S . '*EW, MAP, TABLE,, X M A X S i b , Y M A X s 5 2 ,
' fC L E A R. M T I T L E = I S E C T O R $ M A P ' , S E C T 0 R ~ ( 9 0 , 1 8 0 ) , S E C TO R = (Z Z 5 ,, 3 1 5. 0 ), V IE W ,MAP, C LEAR , C OMMEN T a ' R ES ET T O SC AN T H E H H OLE C I R C LE ' , N SEC T ,C O M M E N T Ã § ' P R l N A C R O S S - S E C T IO N A L P R O F I L E ' , E N O = ( 3 7 , 5 2 ) , P R O F I L E ,M T I T L E * ' s L O P E $ M A P ' , C O M M E N T a l P R I N T A S L O P E C L A S S M A P ', S L O P E, T A B L E , M AP , GH A P,C OMMEN T = ' F I N O SLOPE C LASSES BY T H E MAXI MU M SLOPE MET H OD R AT H ER T H AN T H E
A V E R A G I N G ME T HO D U S E 0 B E F O R E ' , X S L O PE , T A B L t ,MT I T LE O' M AXT MU M I SL OPE MAP!, MAP, GMAP,C OMMEN T * lAN Q AN ASPEC T MAP BY 1 0 D EGR EE SEC T OR S! , MT I T LE: ' ASPEC T $M AP! ,ASPEC T , MAP. T ABLE, C OMMEN T È~N O C OMPASS PO I N T ASPEC T ! , C ASPEC T , T ABLE,M AP , G V AP , c O M M E N T a !A N O R E L A T I V E A S P E C T ' , R A S P E C T a 1 8 0 m , T A B L E , M AP , G MA P,C O M M E N T a ' C H g C K C E L L S W H I C H D I F F E R F R O M T H E A V E R A G E O F T H E I R N E I G H B O R S B Y M O R E THA N 1 5 0 F EE T, !, M T I T L E a f O A T A C HE C KS M AP ' , 0 C H E C K s l S O . , MAP, GMAP, TABLE,C O M ME N T =' N O TI C E T HA T T HE RE I S ONE E S P E C I A L L Y B A D C t L L AT ( l 7 , 3 6 ) ' ,C O M ME N T =! I TS N E I G H B O R S A P P E A R I N t R R O R A L S O B EC A U SE T H I S O N t C E L L A L T E R S T HE A v ER AGE F OR T H OSE C ELLS, ' ,C O M M E N T = ! P R T N T T H E A C T U A L E L E V A T I O N O A T A ! , M E S S A G E = ! E L E V A T I O N S M A P ' , O P R I N T ,X O B S 8 2 2 , Y O f t S a 1 8 ,C O M M E N T = 1 T HI S I S A N A L T E R N A T I V E WAY T O S E T O B S E RV E R P O S T I O N ! ,C O M M E N T = ~ O E M O N S T R A T EW E I G H T E D V I E W O P T I O N S ' , M T I T L E ~ ~ W E I G H T E D $ M A P ! ,
ANON, V I EW, MAP, T ABLE, AWOFF , C OMM EN T = ' OEF I N E D I S T AN C E WEI G H T I N G F U N C T I ON ' ,N O O W T P t T P O I N T a ( 0 . 5 , 1.1, T PO I N T =( l . O , 0 . 51 , C LEAR , 0 w ON , V I EW , MAP, T ABLE,C LEAR , C OMMENT =! NOW BOT H WEI GH T I N G MET H OD S' ,A W ON,VIEW,MAP,A W OFF, 0 W 0È-FC OMMEN T * ' OEf - I N E SOME SLOPE C LASSES, ' ,C L A S S ( l ) S ( O . , 2 5 m ) , C L A S S ( 2 ) ~ ( 2 5 ~ ~ 5O a ) , C L A S S ( 3 ) = ( 5 0 , 1 0 0 0 ~ ) , C L A S S a 3 ,
C O M M E N T a l F O f t S L O P E, C L A S S E S A RE T A K E N A S S L O P E S I N P E R C E N T ',M T I T L E = l U S E f 4 S L O P E S M A P ' ,U SLOPE, TABL E, MAP,C OMMEN T s 'N Ow C ALC U LAT E SLO PE BY T H E MAXI MU M SLOP E MET H OD ' , U X SLOPE,T ABLE, MAP,M T I T L E Ã ˆ ' E L e V A T I O N S C L A S M AP ',C O M M E N T * ' O E t I N E SO ME E L E V A T I O N C L A S S E S ' , C L A S S C l ) = ( O , t O O O ) , C L A S S ( 2 ) a ( < 1 0 0 0 , 5 0 0 0 )1 C L A S S ( 3 ) * (5 0 0 0 , 6 0 0 0 ) , C L A S S ( 4 ) a ( 6 0 0 0 ~ 7 0 0 0 ) , C L A S S ( 5 ) = ( 7 0 0 0, 1 0 0 0 0 ) , N CL AS SS
5 , U ELEV, t A B L E , M A P ,C O M M E N T ~ ~ O E ~ I N ESPEC T SEC T OR S AN 0 AN ALYZ E ASPEC T BY T H EM1,C L A S S C l ) ~ C 3 f O m , 3 6 0 a ) , C L A S S ( 2 ) = ( 0 , 1 0 1, N CL A SS s 2,C O M M E N T a 'A S p E c T S O U T S I D E T HE D E F I N E D C L A S SE S W I L L B E P U T I N C LA S S Z E RO ' ,M T I T L E ~ ~ U S E R S A S P E C T S ~ ,U ASPEC T , T ABLE, MAP,C O M ME N T m' E N B O F D E M O N S T R A TI O N O F V I E W I T a ' , S T OP ,W F I N0 0

8/8/2019 VIEWIT: computation of seen areas, slope, and aspect for land-use planning
http://slidepdf.com/reader/full/viewit-computation-of-seen-areas-slope-and-aspect-for-land-use-planning 13/67
@ M SG ,N D A T A IN PU T I S F R OM C A R O S I
à ˆ A S G , Z O A T A : . C R E A T E A T E M P OR A R Y F I L E , ' Z DA T A ,'
à ˆ O A T A , Z D A T A . I N S E R T D A T A C A RD I M A G E S I N T O F I L E 1 Z O A TA . IO A T A T 7 R L 7 0 - 9 0 5 / 1 2 - 1 1 8 ~ 5 1 3 3E N D D A T A , I M A G E C O U N T 1 52
8 X Q T P S w * V I E w I T , , NOW R U N TH E V I t W I T S Y S TE M
G E N E R A L V I S y B I L I T Y P R O G R A M
F O R E S T R E C R E A T I O N A ND L A N D S C A P E M A NA G EM E NT P R O J E C TP A C I F I C S O U T H H E S T F O R E S T AN D RA NG E E X P E R I M E N T S T A T I O NU.S. F O R E S T S E R V I C E , B E RK E L E Y , C A L I F O R N I A
R U N ON O S / 1 ~ / 7 5 A T 0 9 1 3 0 t 2 5
== I N P U T C A a O t C O M M E N T a ' F I R S T D E F I N E AN D R E A R T H E D A T A ' ,
=s I N P U T C A R D ) N RO W S= S2 , N C O L S 3 3 6 , Z S C A LE = 1 00 . , F O R M A T a t ( 3 6 F 2 , 0 ~ ~ , C O L DOWN, R EA D ,
U S E R R E Q u E S T I N R O W S = 5 2
N R OW S S E T T O 52
U S E R R E Q u E S T t N C O L S = 3 6N C O L S S E T T O 3 6
U S ER R E Q ~ I E S T ~Z S C A L E a 1 0 0Z S C A L E S E T f 0 1 0 0 . 0 0 0 0 0
U S E R R E Q U E S T ! F O R M A T a( 3 b F B . O )
D A T A F OR M A T W I L L B E 1(36F2 .01--
U S E R R E Q ~ E S TI C O L D O WC O L U M N S A P P E A R O N T H E O A T A M E D I U M F RO M T O P T O B O TT O M ,
USE!( R E Q u E S T i R E A OO A T A H A S B E e N R E A D I N T O 1 8 7 2 A D D I T I O N A L D B A N K L O C A T I O N S
E A C H C E L L I S ,Z O I N C H E S ( . 5 1 CM ,) W I D E A N D, 1 7 I N C H E S ( . U 2 C M.) H I G H O N T H E M A P,
T H I S C O R R E S P O N D S T O A C E L L (1 00 ,O O F E E T ( 1 2 1 . 9 2 M E T E R S) I N I T S E A S T - W t S T D I M E N S I O N AN D5 3 3 . 3 3 F E E T ( 1 0 1 . 6 0 M E T E R S ) I N I T S NO R TH -S O UT H D I M E N S I O N ON T H E G RO UN D,
E A C H C E L L H A S A N A RE A OF , 0 0 U 8 S Q UA R E M I L E S ( 3 . 0 6 A C R E S , 7 . 5 6 M E C T A R k S ) O N T H E G R O U N D *
T H E D A T A R E G I O N I S 7 .2 0 I N C H E S ( 1 8 . 2 9 CM .) W I D EA N D 8 . 6 7 I N C H E S ( 2 2 . 0 1 C M. 1 H I G H O N T H E M A P,
T H I S C O R R E SP O ND S T O A R E G I O N 2 , 7 3 M I L E S ( 4 . 3 9 K M,) E A S T T O K E S T A N D3 ' 2 8 M I L E S t 5 . 2 8 K M ) N O R T H T O S O U T H O N T H E GR OU ND ,
T H E A R ~ A F T H E R E G I O N I S 8 ,9 5 S QU AR E M I L E S( 5 7 3 0 s 0 3 A C R E S > l U l 5 9 a l U H E C T A R E S ) O N T H E G RO UN D*
8/8/2019 VIEWIT: computation of seen areas, slope, and aspect for land-use planning
http://slidepdf.com/reader/full/viewit-computation-of-seen-areas-slope-and-aspect-for-land-use-planning 14/67
8s IN PU T CAftD ) COMMENTx'NO TE USE OF ZSCAL E TO BR IN G THE DATA TO THE RI GH T RANGE.'.
USER REQUEST ) COMMEN aNOTE USE OF ZSCALE TO BRING THE DATA TO THE RIGHT RANGE
ss IN PU T CARD) COMMENTa'OEFAULTS SUCH AS ROW RIGH T, BCD, M S C A L E ~ ~ U O O OAVE BEEN u S E D S ' Ã
USER REQnESTt COMMEN EDEFAU LTS SUCH AS RON RIGH T, BCD, MSC ALf cs2 100 0 HAVE BEEN USED.
x I N P U T C A R D ) C O MK EN T a' NO w D E F I N E AN O BS ER VF R P O I N T AND DO A V I S I B I L I T Y A N A L Y S I S ' ;
USER REQIJESTI COMMEN x
NOW DE FI NE AN OBSERVER P OI NT AND DO A V I S I B I L I T Y A NA LY SI S
8 INP UT CARD1 MTI TLE a 'S EEN AREASMAP ' ,
U S E R R E Q u E S T I M T I T L E xSEEN AREA MAPM A P T I T L E I j l SEEN AREA
MAP
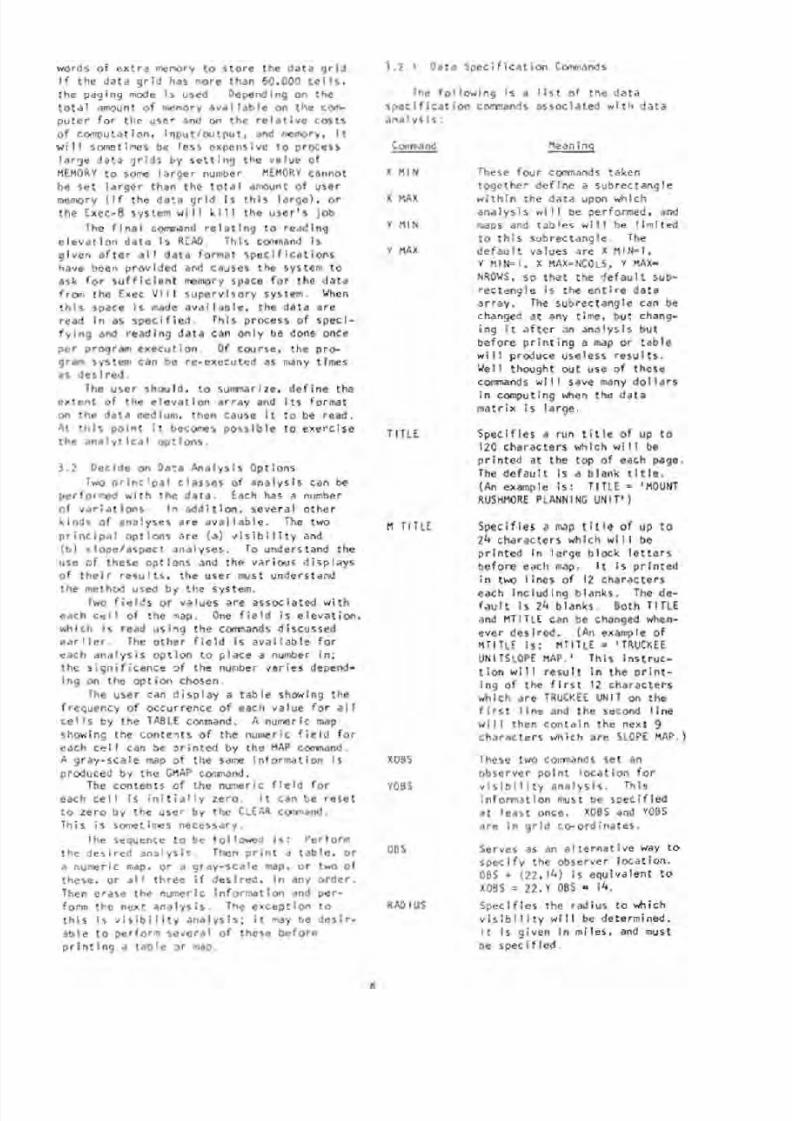
8 s INP UT CARD) OBSx(2 2 , l8 ) , RADIU S=1.5 , V IEW, COMMENTs 'NOW PRI NT A MUMEUIC KA P ' t
USER REQ uES T i OBS x ( 22.00 , 18 .001X OBS SET TO 2 2 AND Y 0138 SET TO 1 8
USER REQuESTI RA DI US 8 1.50R A D I U S S ET TO 1 * 5 0 0 0 0
USER REQUEST# VIEW
V I S I B I L I T Y A N A L Y S I S W I L L B E PER FO RM ED W I TH T HE F O L LO W IN G P A R A M E T E R S )X X ~ ~ X X Ã ‡ X X ~ X ~ X S X X X ~ S X X X ~ B S S ~ ~ ~ ~ X X S X S ~ X S ~ X X X X B ~ ~ S S X Z S S Z X S S X X S X B X S X ~ ~ S
x ons 2 2Y OUS 1 8RADyUS 1 .500 (M IL ES )
2 . 1 1 0 ( K I L O M E T E R S )D ELT A X 2 0
1 7D E L T ACALE 2 4 0 0 0 . 0 0
X M I N 1XMAy 36
Y M I N 1
YMAx 52Z A h L E - 90 .0 0Z B I A S 0SECTORS 0
ANALYSIS COMPLETE.TH IS OBSERVER CAN SEE 1 8 4 CELL S ( .88 SQUARE MILES,
563 .21 ACRES, 139 1.7 1 HECTARES. )
USES REQUEST) COMMEN aNOW PRINT A NUMERIC MAP
INP UT CA f tD) MAP, COMMEMTs 'AKO A GREY SCAL E MAP ', M T IT L E x ' f ,
USER REQIJESTI MAP
MAP OF TIMES SEEN FOR EACH CELL,1 OBSERVFR(S)
MARKS UNOBSERVED CELLS
INVISI~LE CELLS ARE BLANK

8/8/2019 VIEWIT: computation of seen areas, slope, and aspect for land-use planning
http://slidepdf.com/reader/full/viewit-computation-of-seen-areas-slope-and-aspect-for-land-use-planning 15/67

8/8/2019 VIEWIT: computation of seen areas, slope, and aspect for land-use planning
http://slidepdf.com/reader/full/viewit-computation-of-seen-areas-slope-and-aspect-for-land-use-planning 16/67
USER REQUEST: COMMEN x
AND A GREY gCALE M A P
U S E R R E Q ~ I E S T : G M A P
8/8/2019 VIEWIT: computation of seen areas, slope, and aspect for land-use planning
http://slidepdf.com/reader/full/viewit-computation-of-seen-areas-slope-and-aspect-for-land-use-planning 17/67
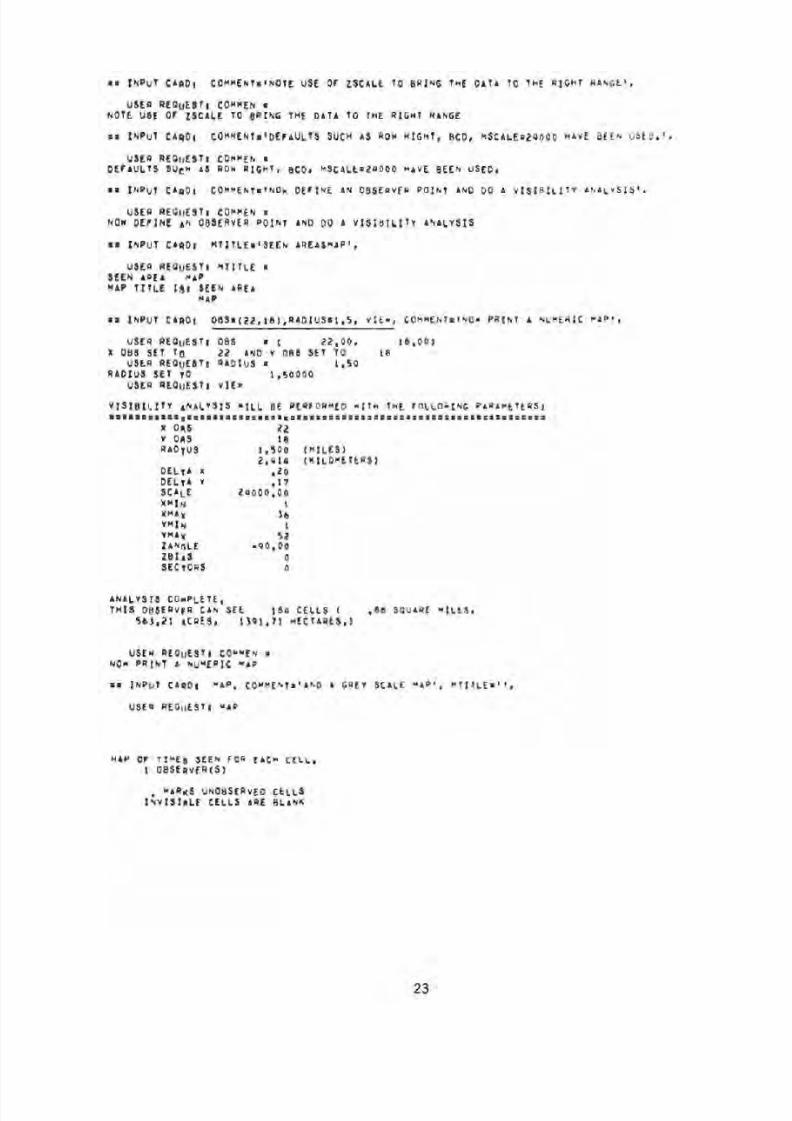
== I N P I J T C A R D # C O M M E N T u I AD O A S E CO N D 08SERVtR~f08S=(20f20),VIEW,
A N A L Y S I S COMPLETE^
T H I S O B S ER V E R C AN S E E 3 0 7 C E L L S ( 1 1 U 7 S Q U A R E M I L E S ,
9 3 9 1 7 0 A C RE S , 2 3 2 2 1 0 4 H E CT AR E Sl )
U S ER RE Q IJ E ST I M T I t L E =
T I M E S S E E N M APM A P T I T L E 1 3 1 TIMES S E E N
MA P
U SER R EQl jEST : MA P
M AP O F T I M E $ S E E N F O R EA C H C E L L ,
2 O ~ S E R V E R ( S )
MARKS UNOBSERVEO CELLSI N V I S I R L E C EL L S ARE B LA N K

8/8/2019 VIEWIT: computation of seen areas, slope, and aspect for land-use planning
http://slidepdf.com/reader/full/viewit-computation-of-seen-areas-slope-and-aspect-for-land-use-planning 18/67

8/8/2019 VIEWIT: computation of seen areas, slope, and aspect for land-use planning
http://slidepdf.com/reader/full/viewit-computation-of-seen-areas-slope-and-aspect-for-land-use-planning 19/67
:S I N P U T C AR D: C O M ME N Ta l N OW W I T H TH E A V E RA G E M AP O P T I O N I N S T E A 0 , I p
USER REQUEST: COPMEN 8
NOW W I T H THE AVE RAG E MAP OPTION IN ST EA D,
USE R REQoESTI AVGMAP
V I S I f l I L I T V M A PS W I L L P R I N T T I M E S S E EN AS A P E RC EN TOF THE NUMBER OF OBSERVERS,
U S E R R E Q UE S T : M T I T L E 8
AVER AGE MAP T I M E S SEENM A P T I T L E I s : AVERAGE MAP
T I M E S S E E NUS ER REQIJESTI MAP
M AP OF T I M E $ S E E N F OR E A C H C E L L *
2 O ~ S E R V E R ( S )
M AR U S U N OBSER VED C ELLSI ~ V I S I ~ L E C E L L S A R E B L A N K
T I M E S S EE N IS D I S P L A Y ED AS A PERCE NT OF THE NUMBER OF OBSERVERS,
L E S S T H A N 1 0 % B L A NK1 0 % TO 2 0 % 12 0 % 1 0 3 0% 2i o i ~ ' l o ( S E E N B V A L L O B S E R V E R S )

8/8/2019 VIEWIT: computation of seen areas, slope, and aspect for land-use planning
http://slidepdf.com/reader/full/viewit-computation-of-seen-areas-slope-and-aspect-for-land-use-planning 20/67

8/8/2019 VIEWIT: computation of seen areas, slope, and aspect for land-use planning
http://slidepdf.com/reader/full/viewit-computation-of-seen-areas-slope-and-aspect-for-land-use-planning 21/67
U S E R R E U u E S T i GM AP
M A P OF T I M E S S E E N F O R E A C H C E L L .
2 O B S E R V E R ( S )
M A R K S U N O B S E R V E D C E L L SI N V I S I B L E C E L L S AR E B LA N K
T I M E S S E E N I S D I S P L A Y E D AS A P E R C E N T O F TH E N UM B ER OF O B S E R V E R S .
L E S S T H A N 1 0 % B LA NK
1 0% T O 2 0 % 12 0 % T O 3 0 % 2
1O ~ X * 1 0 ( S E E N B Y A L L O B S E R V ER S )
G R EY S C A L E p X P L A N A T I O N 1
zzzzzzzzzz zzzzzzzzzz ZZZZZZ2ZZZ zzzzzzzzzz
9 O f t M O R E ~11111WV~W111111111111111111111111111111

8/8/2019 VIEWIT: computation of seen areas, slope, and aspect for land-use planning
http://slidepdf.com/reader/full/viewit-computation-of-seen-areas-slope-and-aspect-for-land-use-planning 22/67
0 wm m
wmm
mD W
- 0
a a wm m m
mw
o mm m
mm
-0
w o o 0 0
0.0 w o- m
8/8/2019 VIEWIT: computation of seen areas, slope, and aspect for land-use planning
http://slidepdf.com/reader/full/viewit-computation-of-seen-areas-slope-and-aspect-for-land-use-planning 23/67
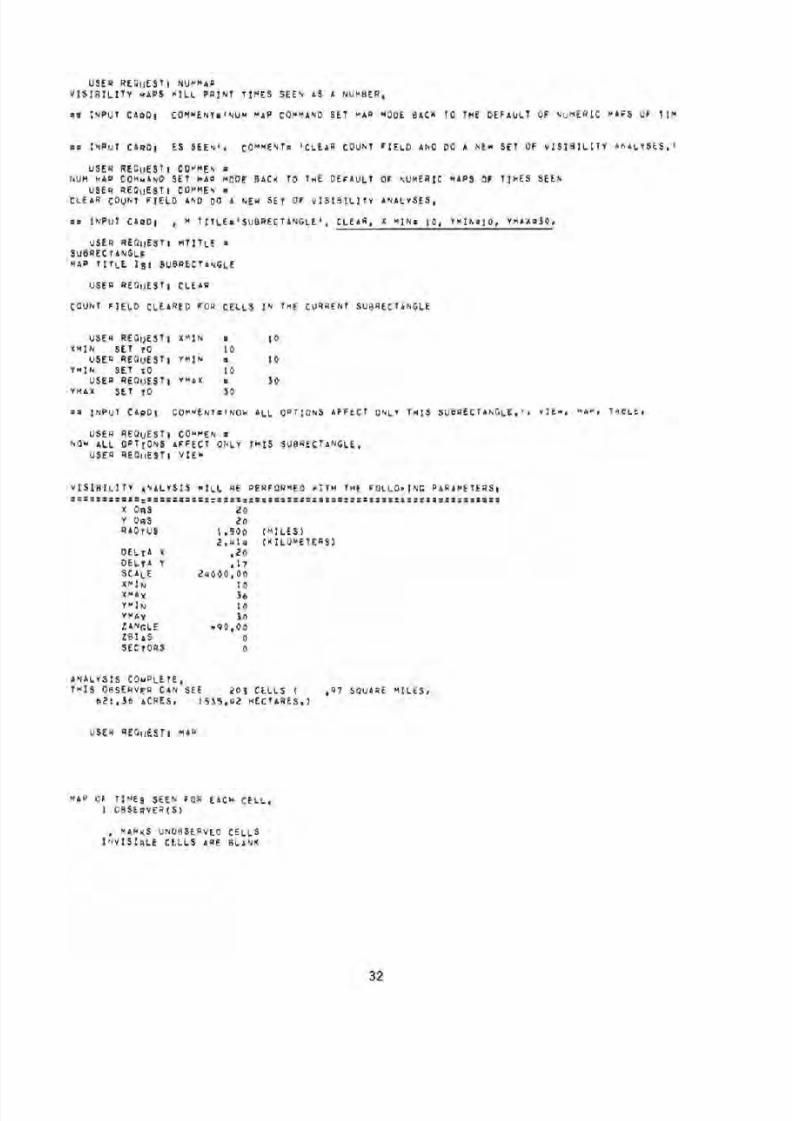
USER REQUEST: NUMMAPVISIBILITY M A P S WILL PRINT TIMES SEEN A S A NUMBER.
=a IN PU T C AA D l COMMENTÇ'NU MAP COMMAND SET MAP MODE BACK TO THE DEFA ULT OF NUM ERIC MAPS OF TI M
aa I N P U T C AR D: E S S E E N ' , C O MM E NT * ' C L E A R CO UN T F I E L D AN D DO A NEW S E T O F V I S I B I L I T Y A N A L Y S E S . '
USER REQUEST: COMMEN *MUM MAP COMMAND SET MAP MODE BACK TO THE D EFAU LT OF NUMERIC MAPS OF T I M E S SEEN
USER REQUEST! COMMEN aC L E AR C OU NT F I E L D A h D D O A NEW S ET O F V I S I B I L I T Y A NA LY SE S .
I N P U T C A R D 1 , M T I T L E Ã ˆ ~ S U B R E C T A N G L E ~ L EA R, X M I N a 1 0 , Y M I N Ã § l o Y MA Xa 30 ,
USER REQIJEST: M TI T LESUBRECTANGLEM A P T I T L E I;! SUBRECTANGLE
USER REQLIEST! CLE AR
C O UN T F I E L D C L EA R E D F OR C E L L S I N T H E C UR R EN T S U B R E CT A N GL E
USER REQUEST: XM IN a 1 0X M I N S E T T O 1 0
USER REQUEST: YM IN = 1 0Y M I N S E T T O 1 0
USER REQUEST! YMAX a 3 0
YMAX SET TO 3 0
I N P U T C AR D: C O M M E N T ~ ~ N O ML L O P T I O N S A F F EC T O NL Y THS S U B RE C T AN G L E. ' t V IE W, MAP, T A BL E ,
USER REQ UEST: C O W M E N *NOW AL L OPTIONS AFF ECT ONLY T H I S SUBR ECTAN GLE.
USER REQUEST! V IE U
V I S I B I L I T Y A N A L Y S I S W I L L B E P ER FO RM ED W I T H T H E F OL LO W IN G P A R AM E T ER S !s = s s s s s s , 3 : 3 a s ~ ~ s a 3 = ~ ~ s ~ : : s s ~ : ~ ~ a ~ ~ ~ s ~ ~ s a a 5 s ~ ~ ~ : x ~ s 3 ~ ~ ~ : ~ s a a : : - - - - - ------%I
X OR S 2 0Y ORS 2 0R A D T U S 1 . 5 0 0 ( M I L E S )
2 . U ( K I L O M E T E R S )D E L T A X a.2 0D E L T A Y 1 7S C A L E 2 1 0 0 0 . 0 0
X M I N 1 0XM Ax 3 6Y MIN 1 0YMAY 3 0Z A N G L E - 9 0 . 0 0Z B I A S 0SECTORS 0
A N A L Y S I S C O M P L E T E ,T H I S O B S E R V ~ R A N S EE 2 0 5 C E LL S ( ."Ã SQUARE MILES,
62 1. 16 ACRES, 1535.412 HECTARES.)
MAP OF T I ME 8 SEEN FOR EACH CELL .1 O B S E R V E R ( S )
, MARKS UN08SERVEo CELLSI ~ J V I S I B L E EL L S ARE B L A NK

8/8/2019 VIEWIT: computation of seen areas, slope, and aspect for land-use planning
http://slidepdf.com/reader/full/viewit-computation-of-seen-areas-slope-and-aspect-for-land-use-planning 24/67
2 3 3
5 0 5
3 0 1 1 1 29 1 1 1 28 1 1 2 7 1 1 1 1 1 1 2 6 1 1 1 1 1 1 2 5 1 1 1 1 I l l 1 24 1 1 1 1 1 1 2 3 1 1 1 1 1 1 1 1 1 1 1 1 2 2 1 1 1 1 1 1 1 1 2 1 1 1 1 1 1 1 1 1 1 1 1 1 2 0 1 1 . 1 1 1 1 1 1 1 1 11 9 1 1 1 1 1 1 1 1 1 1 1 1 ie 1 1 1 1 1 1 1 1 1 1 1 1 1 1 7 1 1 1 1 1 1 1 1 1 1 1 1
1 6 1 1 I l l 1 1 I l l 1 1 1 5 1 1 1 1 1 1 1 1 1 1 1 1 1 1 14 1 1 1 1 1 1 1 1 1 1 1 1 1 1 1 1 1 1 1 1 1 1 1 1 1 1 1 1 1 1 2 1 1 1 1 1 1 1 1 1 1 1 1 1 1 1 1 1 1 1 1 1 1 1 1 1 10 1 1 1 1 1 1 1 1 1 1 1 1
USER REQUEST! TABLE
TABLE OF NUMBERS OF CELLS AN0 AREAS S E E N BY 1 OBSE RVER (S),
* a INP UT CAR0 1 COMMENTB'NOW G O B A C K TO THE WHOLE D A T A G R I D * , XMINs1, V M I N = l , ~ ^ ' A X s 3 b , YP ( l X^52 ,
USER REQUEST! CONMEN =NOW GO BACK T O THE WHOLE DATA GRID
USER REQUEST! XMIN * 1 XM IN SET TO 1
USER REQUEST! VMIN R 1 YMIN SET T O 1
USER REQuESTl X M A X 8 36
X M A X SET t 0 36
USER REQUEST! Y M A X 8 52 Y M A X SET 9 0 5 2
8/8/2019 VIEWIT: computation of seen areas, slope, and aspect for land-use planning
http://slidepdf.com/reader/full/viewit-computation-of-seen-areas-slope-and-aspect-for-land-use-planning 25/67
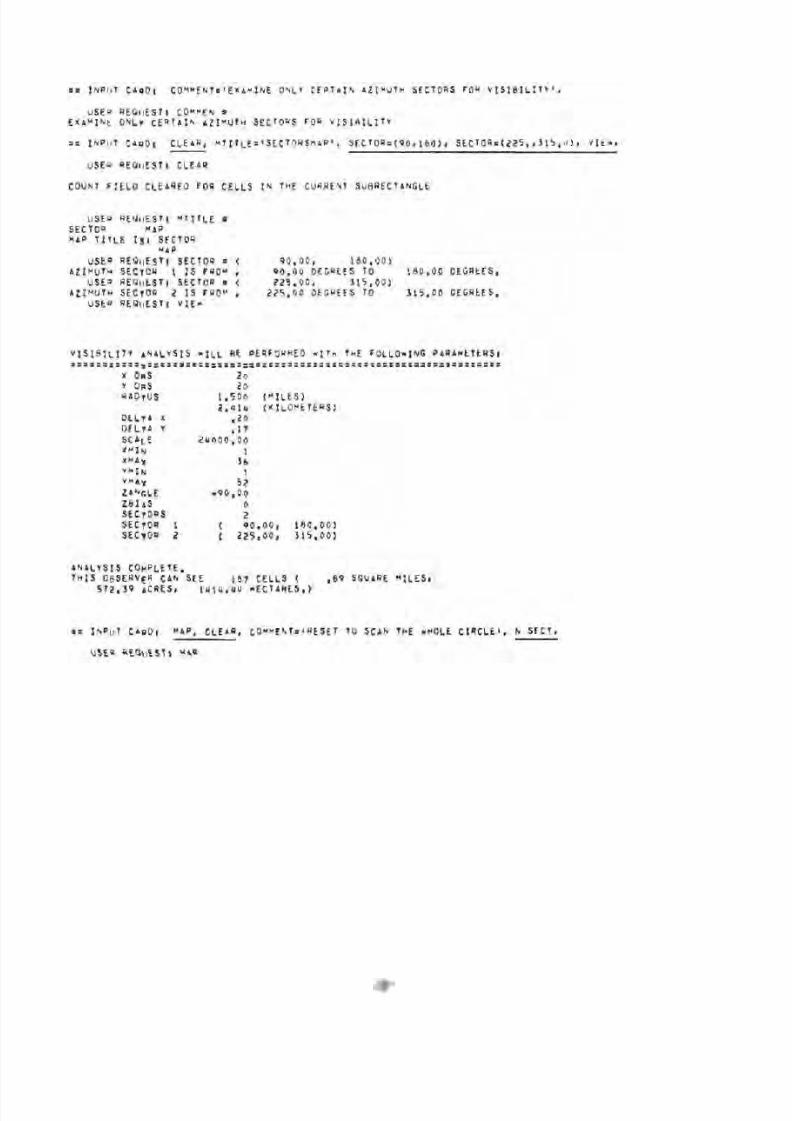
= I N P U T C A f f O l C O MM E NT m tE X AM I NE O NL Y C E R T A I N A Z IM U T H SE CT OR S F OH V I S I B I L I T Y ' ,
U SER R EQt l E ST t C OM MEN a
E X A M I N E O NL Y C E R T A I N A Z I MU T H S EC TO RS FO R V I S I B I L I T Y
U SER R EQU EST! C LEAR
C OU NT F I E L D C L E A R E D FO R C E L L S I N TH E C UR R EN T S U B R E CT A N G L E
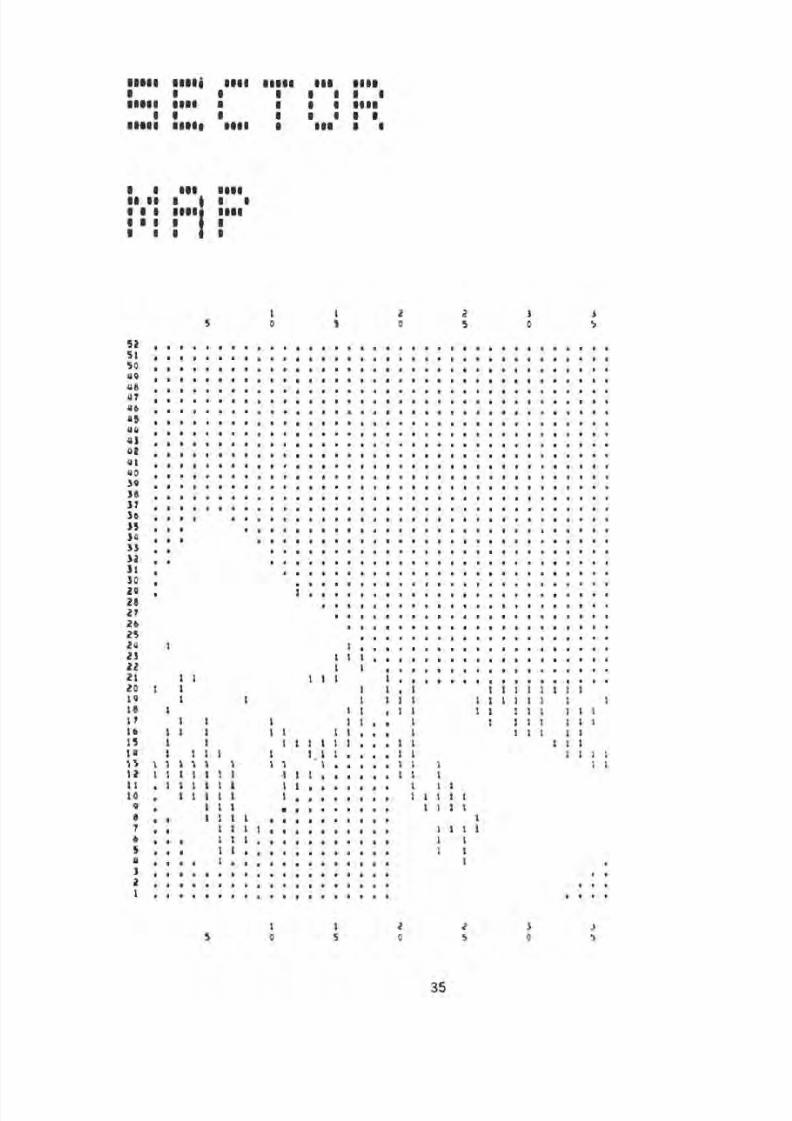
U S E R R EQ IJ ES TI M T I T L E a
SEC T OR M APMA P T I T L E 1 s t S FC TO R
MA P
US ER REQIJEsTI SEC TOR a ( 9 0 . 0 0 , 1 8 0 . 0 0 )
A Z I M U T H S E C T O R 1 I S FROM , 9 0 . 0 0 D E G R L E S TO 1 8 0 . 0 0 O E G R t E S ,
U S E R R E Q u t S T i S E C T O R 8 ( 2 2 5 . 0 0 , 3 l S . 0 0 1A Z I M U T H S E C T O R 2 I S FROM , 22 5 .0 0 D EGR EES TO 31 5 . 00 D EGREES,
U S ER R E Q t l E S T t V I E U
2 02 0
1 5 0 0 ( M I L E S )
2 , U l U ( K I L O M E T E R S )
3 0
. I T2 4 0 0 0 . 0 0
1
A N A L Y S I S C O M P L E T E ,
T H I S O B SE RV E R C A N S E E 1 8 7 C E L L S ( . 8 9 S Q UA R E M I L E S ,
5 7 2 , 3 9 A CR ES , l U l U ~ U 0 E CT AR ES .)
8s I N P u T C A R D ! MAP , C LEAR , C OM M EN T S~ R E SET T O SC AN T H E W HOLE C IR C LE ' , N SEC T ,
U S E R R E Q u E S T l M A P
8/8/2019 VIEWIT: computation of seen areas, slope, and aspect for land-use planning
http://slidepdf.com/reader/full/viewit-computation-of-seen-areas-slope-and-aspect-for-land-use-planning 26/67
@@@@ Il l l a  ¥ @ @11111 # I # IIIII I 1 8 1 1 1 111111 1111 I 8 8 I I 8 I I
1 I I I 8 1 1 1I 8 1 ###@ In 8 Ill 8 8
5 2 . . . . . . . . . . . . . . . . . . . . . . . . . . . . . . . . . . . .51 . . a m s s . . e s . . . . n . . . m * . . * . . s . . * m m . . m e .
50 ..........................................................................48
. . . . . . . . . . . . . . . . . . . . . . . . . . . . . . . . . . . .47 . . . . . . . . . . . . . . . . . . . . . . . . . . . . . . . . . . . .46 . . . . . . . . . . . . . . . . . . . . . . . . . . . . . . . . . . . .45 ..........................................................................41 . . . . . . . . . . . . . . . . . . . . . . . . . . . . . . . . . . . .42 ....................................41 . . . . . . . . . . . . . . . . . . . . . . . . . . . . . . . . . . . .......................................39 . . . . . . . . . . . . . . . . . . . . . . . . . . . . . . . . . . . .38 . . . . . . . . . . . . . . . . . . . . . . . . . . . . . . . . . . . .37 . . . . . . . . . . . . . . . . . . . . . . . . . . . . . . . . . . . .36 . * . . # * , * * * . * * * # * * 8 * * 9 * * * . * * * * * * * * *
is . a * * * # 8 . . 8 * * 8 # # * 8 * * # * * @ @ 8 # * * * * * *
34 . * a * * * ~ 8 * * S @ * m * m . * * * @ ~ ~ * * * * * * ~ *
33 a 8 ~ a # # ~ * a * ~ e m # ~ # m ~ ~ @ # a # ~ e ~ * *
32 . * ~ * # a * # m * ~ m * * ~ * * 8 * * * ~ @ ~ * * * ~
31 . . . . . . . . . . . . . . . . . . . . . . . . . . .30 * . . * * * * * * * , , . * * * * . * * # . * * *29 . 1 * . . * . . . . * . . . . . . . . . . . . . . .2 * * ~ ~ ~ a * * ~ ~ e ~ w ~ ~ * * ~ *
27 e w * * * e s v * * m * * s s * e * e * * *
26 * * a * * . . * * * * * * * * * * . * * *
25 * * # m * * s * * * + m * * * * * v * *
24 1 ~ S . . . . ~ . * * . V . * ~ * I . * . I
2 I l l , . * . * . . * . . . . . * . . . * .2 1 1 . . . . . . . . . . . . . . . . . .2 1 1 1 1 1 1 * . . * * * * . . . . . . . .20 1 1 1 1 1 i 1 1 1 1 1 1 119 1 1 1 1 1 1 1 1 1 1 1 1 1 118 1 1 1 I l l 1 1 1 1 1 1 1 1
17 1 1 1 1 1 . 1 1 1 1 1 1 1 1 116 1 1 1 1 1 l l . . . 1 I l l 1 115 1 1 1 1 1 1 1 s ~ . 1 1 1 1 1
-rr-{ 1 1 1 1 1 , 1 1 . * . . 1 1 1 1 1 113 11x1 1 1 1 ' 1 . * * * * 1 1 1 I 112 1 1 1 11-1 411...*..11 11 1 . 1 1 1 1 1 1 , / 1 1
. * . . . .1 1 1
1 0 . 1 1 1 1 1 1 . . . . . . . * 1 1 1 1 1
9 * 1 1 1 . . * * * * 1 1 1 18 * a 1 1 1 1 .......... 17 * . 1 1 1 1 . . . * . . . . * . 1 1 1 16 . . a l l l * . . * . . * e . * * 1 15 * . a 1 1 * * . . . . . . . . . . 1 1
I . . . . * . * . . . . . . 1....3 . . e . * e . . . . . * * . . . . . .
2 . . . . . . . . . * . . . . . . . . .1 . I * ~ e m m . . . . . . * . * . . .

8/8/2019 VIEWIT: computation of seen areas, slope, and aspect for land-use planning
http://slidepdf.com/reader/full/viewit-computation-of-seen-areas-slope-and-aspect-for-land-use-planning 27/67
U S E R R E Q u E S T t C L E A R
C O U NT F I E L D C L E A R E D FO R C E L L S I N T HE C U R R EN T S U 8 R E C T A N G LE
USE R REUIJEST: COWMEN :R E S E T T O S C A N TH E K h O L E C I R C L E
U SER R EQ l lEST t N SEC TN O AZ I M U T H SECT O R S.
a: I N P U T C A R D # C O M M E N T U' P R I N T A C R O SS - S E CT I O NA L P R O F I L E ' , E h D = ( 3 7 , 5 2 ) ~ P R O F I L E ,
U S E R R E Q u E S T t C O N P EN 3
P R I N T A C R O g S m S E C T I O N A L P R O F I L E
U S ER R t Q u E S T t EN D = ( 37.00, 5ti.00)X E N D S E T T n 3 6 A ND V EN D SET T O 52
U SE R R E Q lj E S T t P R O F I L
E L E V A T I O N P B O F I L E F R OM P O I N T ( 20, 201 T O P O I N T ( 3 6 , 5 2 ) .
( P O I N T S M A R K E D t A RE . V I S I B L E F R O M TH E. - F I R S T P O I N T )
5 9 0 0 5 8 0 0 5 8 0 0 5 7 0 0
5b0U5 5 0 0 5e0b
5 5 0 0 5 5 0 0 550U5 3 0 0 5 3 0 0 5 3 0 0 5100 5201;5.200SLOG5 0 0 0 5 0 0 0 U900uuoo4800 4800 u s 0 008004900 5 0 0 0 5 0 0 0
5 1 0 0 5 1 0 0 5 1 0 0
5 1 0 0 5 100

8/8/2019 VIEWIT: computation of seen areas, slope, and aspect for land-use planning
http://slidepdf.com/reader/full/viewit-computation-of-seen-areas-slope-and-aspect-for-land-use-planning 28/67
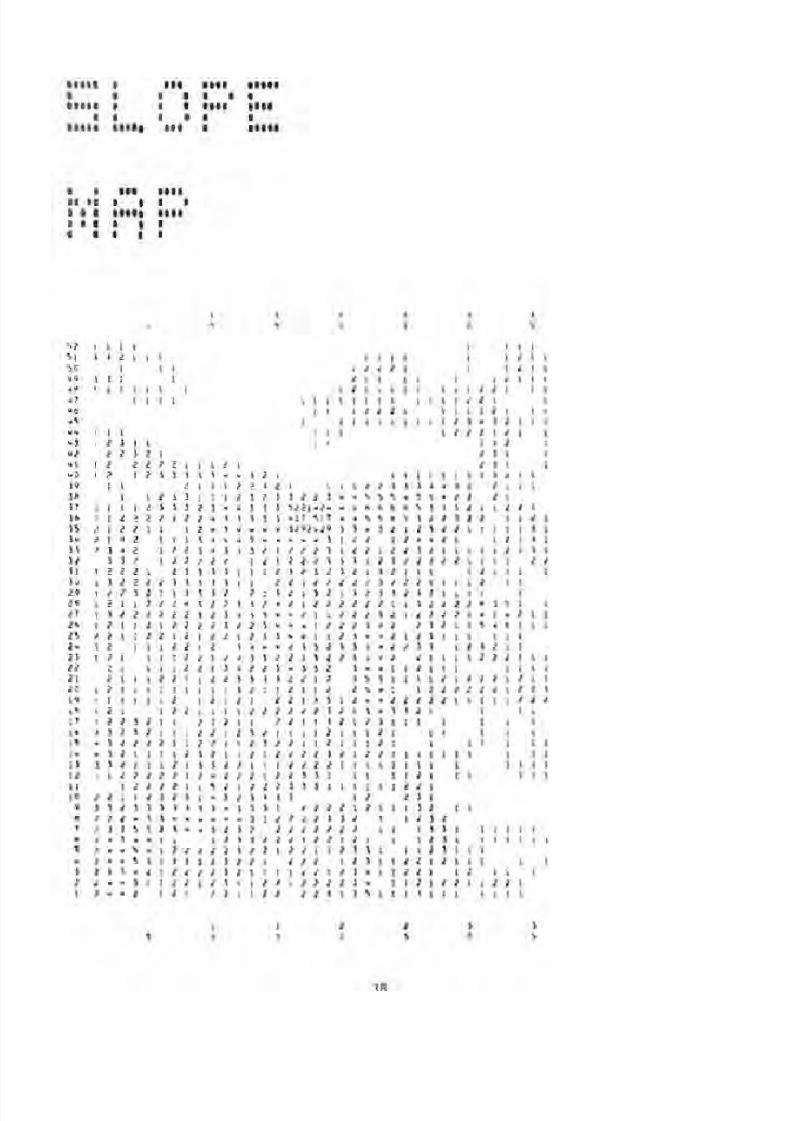
a s I N P U T C A p D t M T I T L E a l S L O P E S M A P @ , C O MM E NT x tP R IN T A SLOPE CLASS MAP', SLOPE, T A H L t ; PAP, G fAP ;
USER REQnESTt MTITLE *SLOPE MAPMAP T I T L E 1 8 1 SL OP E
MAPUSER REQ~IESTI COMMEN a
PRINT A SLOPE CLASS MAPUSER REQnEST i SLOPE
USER REQuEST i TABLE
SLOPE CLASS TABLE,0 MEAN$ 0 TO 10 % SLOPE,1 MEANS 1 0 TO 2 0 % SLOPE,2 MEANS 2 0 TO SOX SLOP â‚ ETC,
USER REQUEST# MAP
SLOPE CLASS MAP,BLANK MEANS 0 TO 10 % SLOPE*1 MEAN$ 1 0 TO 20 % SLOPE,2 MEAN$ 2 0 TO 3 0 % SLOPE, ET C8
8/8/2019 VIEWIT: computation of seen areas, slope, and aspect for land-use planning
http://slidepdf.com/reader/full/viewit-computation-of-seen-areas-slope-and-aspect-for-land-use-planning 29/67
- -NNNNN U W N N N N - N N N N N e N N C = = N N N W N N = W = i n W -N-NNNNNN-NNN W W N N - - - N - - W W W W e ~ N - - - N N N ~ ~ 4 N N

8/8/2019 VIEWIT: computation of seen areas, slope, and aspect for land-use planning
http://slidepdf.com/reader/full/viewit-computation-of-seen-areas-slope-and-aspect-for-land-use-planning 30/67
USER REQUEST: GMAP
SLOPE CLASS MAP.
BLANK MEANS 0 TO 1 0% SLOPE,1 MEAN$ 10 TO 20X SLOPE,2 MEAN8 2 0 TO 30 % SLOPE, ETCn
@Â¥Il I Ill 1111 11111 a I Ill 1111I I Â I 1 1 1 111 1 1111/ !ma@Â¥Il I 1 I 1111 #I11
I l l a II m a I

8/8/2019 VIEWIT: computation of seen areas, slope, and aspect for land-use planning
http://slidepdf.com/reader/full/viewit-computation-of-seen-areas-slope-and-aspect-for-land-use-planning 31/67
BS I N P U T CA R D ) C O M M E N T ~ ~ F I N D L OP E C L A S S E S B Y TH E M AX IM UM SL OP E M ET HOD RA TH ER T H A ~ HE
I N P U T C AR D ) A V E R A G I N G M ET HO D U S E D 0 E F O R E ' t X S L O P E P T A B L E *
USER REQUEST! COWMEN =F I N D S L OP E C L A S S E S B Y THE MA XIMU M SLOPE METHOD RATH ER THAN THE AVERAGING METHOD USED BEFORE
USER REQUEST: XSLOP E
MAXIMUM SLOPE CLASS VALUE S COMPUTED FOR CURRENT SUBRECTANGLE.
USER REQIESTI TAB LE
T A B L E OF M A X I M U M S L O P E C L A S S E S.0 MEAN8 0 TO 10 % SLOPE
1 M E AN S 1 0 % T O 2 0 % S LO PE , E T C i
USER REOIJESTI M T IT L E =MAXIMUM SLOPE MAPM A P T I T L E 1 6 1 M A X I M U M
SLOPE MAP
U S E R R E Q l t E S T t H A P
M A P OF M A X I M U M S L O P E C L A S S E SBLANK MEANS 0 TO 1 0% SLOPE
1 M E AN 3 1 0 % T O 2 0 X t E T C.
8/8/2019 VIEWIT: computation of seen areas, slope, and aspect for land-use planning
http://slidepdf.com/reader/full/viewit-computation-of-seen-areas-slope-and-aspect-for-land-use-planning 32/67

8/8/2019 VIEWIT: computation of seen areas, slope, and aspect for land-use planning
http://slidepdf.com/reader/full/viewit-computation-of-seen-areas-slope-and-aspect-for-land-use-planning 33/67
U S F R R E Q U E S T: G M A P
MAP O F M A X I M U M S L O P E C L A S S E 3
8 L A N K M E A N S 0 T O 1 0% S L O P E
1 MEANS 1 0% T O 20% , E T C ,

8/8/2019 VIEWIT: computation of seen areas, slope, and aspect for land-use planning
http://slidepdf.com/reader/full/viewit-computation-of-seen-areas-slope-and-aspect-for-land-use-planning 34/67
S 8 IN PU T CARD # ASPECT, MAP, T ABLE , COMMENTSINOW COMPASS PO IN T ASP ECT I, C A S P E C T , T A 6 L E t
USER REQUEST# ASPECT
ASPECT CLASb VALUES COMPUTED FOR CURRENT SUBRECTANGLE,
USER REQUEST# MAP
ASPECT CLAS9 MAP,
3 6 A S p k C T C L A S S E S#1 MEAN6 0 TO 1 0 DEGREES,2 MEAN9 1 0 TO 20 DEGREES,
ETC +
BLANK &EL LS HAVE NO ASPECT (ARE F LA T) ,
8/8/2019 VIEWIT: computation of seen areas, slope, and aspect for land-use planning
http://slidepdf.com/reader/full/viewit-computation-of-seen-areas-slope-and-aspect-for-land-use-planning 35/67
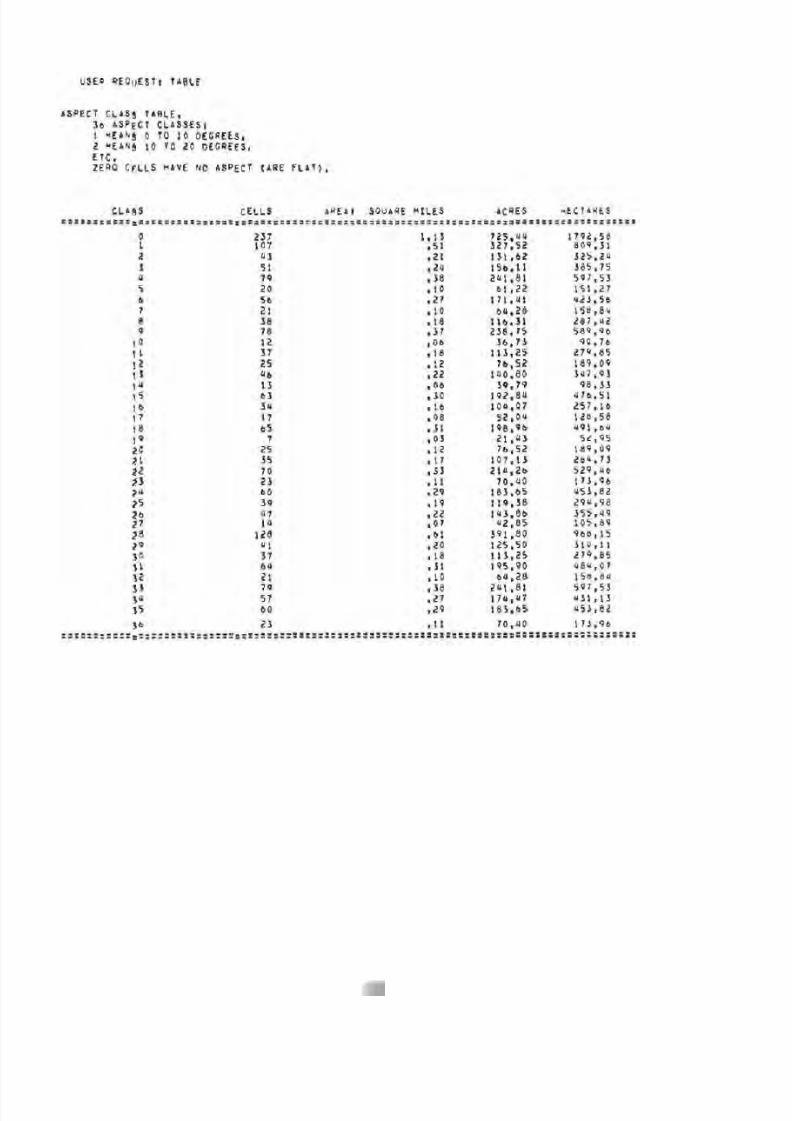
USER REQuESTt TABLE
ASPECT CLAS* TABLEm
3 6 ASPECT CLASSES81 MEAN$ 0 TO 10 DEGREES,2 MEAN$ 1 0 TO 2 0 DEGREES,
E T C *ZERO CELLS HAVE NO ASPECT CARE FL AT )*
CLA$S CELLS AREA1 SQUARE MI LE S ACRES HECTAUES. . . . . . . . . . . . . . . . . . . . . . . . . . . . . . . . . . . . . . . . . . . . . . . . . . . . . . . . . . . . . . . . . . . . . . . . . . .

8/8/2019 VIEWIT: computation of seen areas, slope, and aspect for land-use planning
http://slidepdf.com/reader/full/viewit-computation-of-seen-areas-slope-and-aspect-for-land-use-planning 36/67
USER REQ IJE ST~ COWMENNOW COMPASS POINT ASPECT
USER REQuEsTI CASPE C
A S P E C T C L A ~ $ E SB v P R I N C I P A L COMPASS O I ~ E C T I O N SCALCLILATEDFOR THE CURRENT SUBRECTANGLE*
U S E R R E Q u E S T t T A B L E
TABLE OF ASPECTS B Y PRINCIPAL COMP ASS DI RE CT IO NS ,
THERE ARE 8 4SPkC T CLASSES* EACH REPRESEhTS A u5 DEGREEWIDE RANGE CENTERED ON A COMPASS POINT I
1 t - 2 2 a 5 O t G * FR OM NOR TH2 +*2 2,5 OEGn FROM NE3 +-22. 5 OEG* FROM EASTU +- 22 *5 DEG* FROM SE5 + -2 2* 5 DEG* FROM SOUTH6 +-22. 5 DEG * FROM SN7 t - 2 2 * 5 D EG. F RO M W E S T8 + - 22 *5 OEG* FROM NW
ZERO NO ASPECT (F LA T)
=a I N P U T C A~ OI MAP, G MAP, c O MM E h T= ' A NO R E L A T I V E A S P E C T ' t R A s P ~ c T = 1 8 0 * , T A B LE , f l4pt G F A F t
USER REQIJESTI MAP
MAP OF ASPEeT BY PRINCIP4L COMPASS OIRECTIONS.THERE ARE 8 ASPECT CLASSES, EACH REPRESENTS A US DEGREE
WIDE RANGE CENTERED ON A COMPASS POIN TI1 +- 22 *5 OEGn FROM NORTH2 + - ~ 2 ~ sEG* F ROM NE3 + - 2 2 * 5 O E G * F RO M E A S T4 +-22. 5 DEG * FROM SE5 + *2 2* 5 OEG* FROM SOUTM6 +- 22 *5 DEG* FROM SW7 +-2.?*5 DEG * FROM WEST8 +-2 2.5 DE G* FROM NW
B L A N K N o A S P E C T ( F L A1 )

8/8/2019 VIEWIT: computation of seen areas, slope, and aspect for land-use planning
http://slidepdf.com/reader/full/viewit-computation-of-seen-areas-slope-and-aspect-for-land-use-planning 37/67
Command Meanin q
NSECT Disables the az imuth sector
f e at u re o f v i s i b i l i t y a n al ys is .
I t sh ou ld b e g i ve n t o t u r n t h i s
f e a t u r e o f f o r t o d e f i n e a new
s e t o f sec tor s . The de f au l t i s
t o examine t h e f u l l c i r c l e .
SECTOR Spec i f ies the s t ar t and end, i n
degrees c lockwise f rom Nor th, o f
an az imuth sector i n which
v i s i b i l i t y a na ly si s i s t o be
performed . Up t o 20 such
sectors may be defined by
successive sector commands.
For example, t o l i m i t the
v i s i b i l i t y a na ly si s t o t he
d i r ec t ion s f rom NE t o SE,
spec i fy :
N SECT, SECTOR = (45,135)
( f i g . 4)
t o r e t u r n t o e xa mi ni ng t h e
whole c i rc le , spe c i f y N SECT
alone.
Z ANGLE S p e ci f i e s a v e r t i c a l a ng le i n
d eg re es r e l a t i v e t o t h e h o r i -
zont al below which i t i s
assumed that the observer
cannot see or which i s no t
a p p ro p r ia t e f o r t h i s a n a l ys i s.
For example, st a t i ng Z ANGLE =
0 w i l l hav e t he e f f e c t o f mak-
i n g a l l c e l l s a t a l owe r
e le vat ion than the observer
v i s i b l e . Z ANGLE can be f rom
-go0 to +go0. The de fa ul t
v a lue i s -go0, which places no
r e s t r i c t i o n on v i s i b i l i t y .
Z BIAS S p e ci f i es a d i s ta n c e i n f e e t
which i s added t o the observer
p o i nt el e va t io n f o r v i s i b i l i t y
an aly sis . This can be used,
f o r example, t o s imu la te f i r e
towers, tops o f tramways, tops
o f power tran smis sion towers,
a i r p lane o r he l i c op te r v iews .
The Z BIAS may be ne ga ti ve t o
ind ica te sur face excavat ion .
The de fa u l t va lue i s zero .
Command Meaning
X END These commands specify the end
p o i n t o f t h e l i n e a l o ng w hi ch
Y END p r o f i l e s w i l l be drawn by t h e
PROFILE command. P r o f i l e s
END beg in a t t he c u r r en t obse r ve r
p o in t as se t by OBS ( or X OBS,
Y OBS). To dr aw a p r o f i l e
( c ro s s -s e c ti o n o f t h e e l e v a t i o n
data) f rom po i n t (13.43) t o
po in t (51,20), the user could
spec i fy :
0BS=(13,43), END=(51,20),
PROFILE,
NO D W T P Sets the dis t ance weight func-
t i o n t o a s t an da rd w e ig h t o f
1.0 f o r a l l d i st a nc e s. I t
would normal l y on ly be needed
t o r ede f i ne t he d i s tanc e weigh t
f unc t i on .
T POINT Spe cif ies a p a i r o f numberswhich represent a " tu rn ing
po in t " o f t he d i s tanc e we ight
curve. The f i r s t number is the
d is tanc e i n m i l es fr om the
observer, and the second i s a
we igh t between 0. and 1.0. The
user can de f in e d is tance
we igh t i ng f unct i ons w i t h up t o
20 tu rn in g poi nts . The program
connects these poi nts wi th
s t ra ig h t l i n e segments. A
we igh t o f 1 .0 a t a d i stanc e o f
0. from the obser ver and a
we igh t equal t o t he l a s t g i v en
w ei gh t a t a d i s ta n c e o f i n f i n -i t y are assumed. Turning
po in ts mus t be spec i f ie d i n
o r de r o f i nc r eas ing d i s tanc e .
A W ON Enables we igh t i ng by r e la t iv e
a sp ect i n v i s i b i l i t y maps.
Normally , c e l l s a re s imply
counted as seen or not seen.
Wi th we ighted v i s i b i l i t y (by
aspec t o r d is tance o r bo th) ,
c e l l s wh ich are seen are g iven
from 0 t o 10 point s depending
on the we ight ing fu nc t io n .
A W OFF Tur ns o f f we igh t i ng by r e l a t i v e
aspect.
D W ON Enables we i gh t in g v i s i b i l i t y
by d is tance, accord ing t o the
cur rent d is tance we ight
f unc t i on .
D W OFF Turns o f f d is tance we ight ing .
( I n i t i a l l y bo th r e l a t i v e
aspect and dis ta nce weig ht in g
a re o f f . )

8/8/2019 VIEWIT: computation of seen areas, slope, and aspect for land-use planning
http://slidepdf.com/reader/full/viewit-computation-of-seen-areas-slope-and-aspect-for-land-use-planning 38/67
Command Mean inq
CLEAR Sets t o zero the conten ts o f
the numeri c f i e l d f o r each ce l l
i n the cu r ren t subrec tangl e .
The CLEAR command should be
used between each type o f a nal -
ys is i n the same run. (For
example, the numeric f i e l d
should be cleared between aSLOPE an a lys is and a VIEW
ana lys is . )
CLASS Defines a r b i t r a r y classes
ca l led 'user c lasses ' tha t can
be used t o do slope class ,
aspect c lass , o r e leva t i on
class analyses.
N CLASS Specif ies the number of user-
de f ined c lasses t o use i n a
use r-c las s an al ys is (U SLOPE,
U ASPECT, U ELEV, o r UX SLOPE),
SHOW NZ These two commands control thepr in ti ng of small but nonzero
HIDE NZ values in gray-scal e maps. The
def aul t i s HIDE NZ; specifying
SHOW NZ w i l l cause small values
t o pri nt as the l igh tes t shade
of gray.
HI ANGLE Specifies an upper l i m i t to an
obser ver's angle of view. The
de fau lt val ue of HI ANGLE i s +90
degrees.
LO ANGLE Serves as synonym f o r Z ANGLE.
Either command may be used t o se ta ve rt ic al angle below which the
observer cannot see.
RANK Spec ifies a weight associated
wi th an observer po in t. The
defaul t RANK i s 1 .
MAX IMUM Weighted v i s i b i l i t y is normally
averaged over a l l observers. I f
AVERAGE th is averaging i s undesirable,
the maximum over a set of observ-
ers may be kept by sp ec if yi ng
MAXIMUM. The defaul t state of
averaging may be re in st at ed by
specifying AVERAGE.
3.2 .2 Analysis Commands
The f o l l o w in g commands cause va ri ou s
analyses t o be performed:
Command Act ion
SLOPE cal cul ate s s lope c lass number fo r
each c e l l and places i t i n t he
num er ic f i e l d f o r t h a t c e l l .
ASPECT Ca lc ul at es an asp ect c la ss number
and stores i t f o r each ce l l .
-ommand Act ion
This op t io n g ives 3 6 classes,
each 10 degrees wide, f o r t he
grea tes t reso lu t io n o f aspect .
C ASPECT Cal cul ate s aspect i n ei gh t 45-
degree wide classes, each center-
ed on a major compass di r ec t io n .
I t p rov i des l ess r eso l u t i on thanthe ASPECT opt io n, bu t i s more
us ef ul f o r some purposes.
R ASPECT Ca lc ul at es and st or es , fo r each
ce l l , a number showing the c e l l ' s
aspec t r e l a t i v e t o the spec i f i ed
d i r ec t ion . There a re e ig h t 22.5-
degree wide sectors on each side
o f the g iven d i re ct io n. The two
s id es a re t r ea t e d a l i k e ( t h i s i s
no t the case f o r th e ASPECT or C
ASPECT opt ons). For example,
t h i s may be thought o f as a sun-
i l l um i na t i on ana l ys i s i f the
given angle i s the sun's d i re c-
t i o n or as no rthe ast aspect map
i f R ASPECT a 45,
D CHECK Tes ts each c e l l t o see i f i t
d i f f e r s f r om the average o f i t s
eight closest neighbors by more
than the to lerance g iven. I f so,
a count o f the number o f t imes
the d i f ference exceeds the g iven
amount i s placed i n the numeric
f i e l d . Ce l l s whi ch a re g rea t l y
d i f f e r en t f rom the i r ne ighbors
are p robab ly i n e r ro r . (Normal ly
i ti s e f f i c i e n t t o c heck t h e d at afo r g ross e r ro rs w i th a l a rge to l -
erance before using smaller
values. )
VIEW Per fo rms a v i s i b i l i t y ana lys is
according t o the current para-
meters. The impor tant parameters
ar e observer p o s i t ons, (OBS),
RADIUS, th e number o f s ec to rs and
t h e i r p o s it i o ns , Z ANGLE, Z BIAS,
and whether o r no t r e l a t i v e as-
pect o r d is tanc e weigh t ing i s en-
ab led . For nonweighted v i s i b i l i t y
e i t h e r 0 o r 1 i s added t o the nu-
meri c f i e l d o f each ce l l . F orwei gh ted v i s i b i l i t y , an i n tege r
from 0 t o 10 i s added. Thus th e
conten ts o f each numeric f i e l d
are accumulated over any number
o f v i s i b i l i t y a naly ses , and i n d i -
cate e i th er t imes seen or weight-
ed tim es seen. Sin ce these num-
bers are added, the command CLEAR
should be given before beginning
a s er i es o f v i s i b i l i t y a na lys es
t o ze ro the numeric f i e l d fo r
each cel I. Otherwise, the use r
may be adding, f o r example, tim es

8/8/2019 VIEWIT: computation of seen areas, slope, and aspect for land-use planning
http://slidepdf.com/reader/full/viewit-computation-of-seen-areas-slope-and-aspect-for-land-use-planning 39/67
Command Mean ing
seen t o s lope c lass , g i v i ng a
nonsens ica l resu l t .
L i ke a l l o t h e r a n a l y t i c a l and
out put op tio ns, VIEW ac ts on on ly
the current subrectangle.
U SLOPE Causes th e VIEWIT system t o pe r-
fo rm a s lope c lass ana lys is us ing
user-defined classes.
U ASPECT Causes an aspect c lass analysis
t o be per formed us in g user-def ined
classes.
U ELEV Causes th e system t o c l a s s i f y ele -
vat ions by th e user-def ined
classes.
For U SLOPE, the conte nts o f the u ser-d efin ed
c lasses are in te rpre t ed as s lopes i n percent
( f o r example, 100.0 means a 45-degree s lo pe ).
Fo r U ASPECT, th e numbers ar e in te rp re te d as
compass di r e c t ons ( 0 t o 360) i n degrees.
Fo r U ELEV, the numbers a re in te rp re te d as
e l e va t i on s i n f e e t .
XSLOPE Calcu la tess lopec lassnumbers
us in g a nonaveraging method o f
c a l c u la t i ng s lope .
U X SLOPE Calculates s lope c lass numbers
us ing nonaveraging s lope calcula-
t i on , ac c or d ing t o us e r - s peci f i ed
c lasses.
3.2.3 Di sp la y Opt ion Commands
The fo l l ow in g commands are f o r the u-
p l a y o p ti o ns :
Command Meaninq
TABLE Pr in ts a ta bl e showing the
d i s t r i b u t i o n o f t h e c on t en t s o f
t he numeric f i e l d o f a l l c e l l s
i n the cur re nt subrectang le .
An appro pr ia te explanatory
heading i s pr i nte d, depend ing
on the operat i on la s t per formed
on the data . (The user wiI 1
pr obab ly f i nd t h i s op t i on use-
f u l f o r a l l o f t h e t yp es o f
analyses. )
MAP Pr i n ts a numeric map of the con-
t e n ts o f t he co un t f i e l d f o r
each cel l i n the cur re nt sub-
re ct an gl e. The numbers may be
slope clas s, t imes seen, etc .,
depending on the la s t op erat ion
performed. An app rop ria te
heading i s p r i n ted .
Command Meaning
AVG MAP Causes subsequen t MAP commands
t o pr i n t maps o f t imes seen
w i t h each c e l l ' s v a lue p r es ented
as a percent o f the numbers o f
observers . Th is i s esp ec i a l l y
us e fu l i f there are 10 or more
observer po in ts .
NUM MAP Cance ls the AVG MAP command and
re tur ns th e MAP command t o t he
de fa u l t mode o f p r i n t i ng t he
act ual number o f t imes seen f o r
each ce 1 1 .
G MAP Pr i nt s a gray-shaded map o f the
numer ic f i e l d o f each c e l I.
This gives t he same in for ma tio n
as t he MAP command i n a fo rm
which i s more understanda ble as
a whole, es pe ci al ly when seen
f rom a d is tance.
D PRINT Causes the actual e lev at i ons o feach c e l l i n t he c u r r en t s ub rec-
t ang le t o be p r i n ted i n a coded
for m. Th i s i s us e fu l p r i ma r i l y
fo r da ta check ing.
PROF ILE P r i n t s a c r os s -s e c ti o n o r p r o f i l e
o f t h e e l e v a t i o n d a ta f ro m t h e
c u r r en t obs er ve r po in t t o t he
cur ren t end po in t . The cross-
s e c ti o n i s n o t t o s c al e ( i t h as
exaggerated ve r t ic a l sca le) bu t
i s us e fu l f o r da ta c hec king o r
fo r g et t i ng a sense of the shape
o f t h e t e r r a i n o r f o r d et e r -min ing h igh or low po in ts on a
s p e ci f i ed r o u te f o r f u r t h e r
v iew ana lys is .
STATS These th re e commands p r i n t ta bl es
of s ta t is t ica l in fo rmat ion aboutEL STATS the cu rr en t sub rec tan gle . The
table i s fo r examined cel ls i n
V STATS the cu rr en t subre ctangle f o r the
STATS command, f o r v i s i b l e ce l l s
fo r the V STATS command, and f o r
el ev at io ns f o r the EL STATS
command .
3.2.4 Des cr i pt i on of Analys is Opt ions
The fo l low ing sec t ions exp la in the ana ly -
s i s op t ions i n more de ta i l .
SLOPE c a l c u l a te s the s lope o f each c e l l byf i t t i n g a p la ne s urf ac e t o i t s e i g h t n ea re st
ne ighbors . Th is p lane i s a 'bes t f i t ' i n t he
sense that i t minimizes the sum o f (d is tances
f rom the p lane to the ce l ls ) squared. Slope
class es are 10 percent each, so th a t a
s lope of 0 t o 10 pe rc ent i s t he f i r s t c l ass ,
10 t o 20 perce nt i s the second clas s, and so

8/8/2019 VIEWIT: computation of seen areas, slope, and aspect for land-use planning
http://slidepdf.com/reader/full/viewit-computation-of-seen-areas-slope-and-aspect-for-land-use-planning 40/67
f o r t h . S l o pe c l a s s num bers a re s to r e d i n t h en u me ri c f i e l d f o r e ac h c e l l w he re t h e y c an b ee xa m in ed w i t h o ne o r a n o t h e r o f t h e p r i n t o u to p t i o n s ( f i g . 5 ) .
C e l l 5 i s t h e c e l l w hose s l o p e i s wa nte d.A p l a n e P i s c h os en t h r o u g h 5 s o t h a t t h e sumo f t h e s q ua re s o f t h e d is t a n c e s f r om the cen-t e r s o f e ach o f t he e i g h t s u r r o un d in g c e l l s t ot h e p l a n e ( dra wn a bo ve as s h o r t v e r t i c a l l i n e s )i s a m in im um . T he s l o p e o f t h e p l a n e i s t h es l o p e f o r t h e c e n te r c e l l .
Each o f t h e a sp e ct o p t i o n s s t a r t s b y f i r s t
f i n d i n g t h e b e s t - f i t p la ne a t ea c h c e l l ; ast h e d i a g r a m a b ov e. T he n, t h e a s p e c t o f t h ec e l l i s t h e d i r e c t i o n i n w h i ch t h i s p l a n es l op e s m os t r a p i d l y . (A c e l l w i t h no s l o p ed oe s n o t h a v e an a s p e c t a t a l I . ) For ASPECT,t h e a sp e ct s a re d i v i d e d i n t o 36 c l a s s e s ( e a c h10 d e g r e e s ) a nd t h e c l a s s n um b er s s t o r e d f o re ac h c e l l ( f i g . 6).
Th e C ASPECT o p t i o n d i v i d e s t h e c i r c l ei n t o e i g h t $ - de g re e s e c t o r s c e n t e r e d o n t h ep r i n c i p a l co mp ass p o i n t s . Th e c l a s s nu mb ersc a n be p r n t e d w i t h TABLE, MAP o r G MAP ( f i g .
7 ) .
T h i s o p t i o n wo ul d b e u se d c h i e f l y t o d e v e lo ps ha de d m aps t o i n d i c a t e a sp e c t b y t r a d i t i o n a ls e c t o rs o f d i r e c t on .
Th e R ASPECT o p t i o n r e q u i r e s t h a t t h e u s e rs p e c i f y a d i r e c t i o n ( i n de gr ee s f ro m n o r t h )and c a l c u l a t e s t h e a sp e ct o f ea c h c e l l r e l a -t i v e t o t h e g i v e n d i r e c t i o n . A ng le s an e q ua ld i s ta n c e on e i t h e r s i d e o f t h e g iv e n d i r e c t i o na r e t r e a t e d a l i k e . T h e re a r e e i g h t c l a ss e s ,e a c h 2 2 .5 ' w i d e, f r o m t h e g i v e n a n g l e o ne i t h e r s i d e t o o p po s i t e t h e g i v e n a ng le . Th ef o l l o w i n g d i ag ra m shows t h e d i v i s i o n o f t h ec i r c l e i n t o r e l a t i v e a sp e ct c l a s se s as su min gt h e u s e r ha s s p e c i f i e d R ASPECT = 9 0 ( f i g . 8 ) .
T h i s o p t i o n w o ul d b e u se d m a i n l y t o d e v el o pw e i g h t i n g o f c e l l s f ro m mo st d e s i r a b l e t ol e a s t d e s i r a b l e a s p ec ts , s uc h a s, n o r t h e a s tf o r s no w r e t e n t i o n o r o pti mu m v e g e t a t i v er e g e n e r a t o n , s o u t h e a s t f o r c am p gr ou nd s( e a r l y m o r n in g su n and p r o t e c t i o n f r om l a t ea f t e r n o o n s u n ).
T he i n f o r m a t i o n d e v e l op e d b y R ASPECT canb e d i s p l a y e d w i t h TA BLE , MAP o r G MAP. The
G MAP d i s p l a y i s e s p e c i a l l y u s e f u l w i t h t h i sa s p e c t o p t i o n . ( G r a y - s c a l e m aps w i t h t h eo t h e r a s p ec t o p t i o n s a r e n o t s a t i s f a c t o r yb e ca u s e t h e m i n d d o es n o t w an t t o s ee t h ed a r k e s t c l a s s as b e i n g j u s t n e x t t o t h el i g h t e s t c l a ss . ) I n p a r t i c u l a r , a map o f t h ei n f o r m a t i o n f r o m t h e R ASPECT ana lys is can bec o n s i d e r e d t o b e a n a p p r o x im a t e s u n- i1 u m i n a -t i o n map o f t h e a r e a u n d e r c o n s i d e r a ti o n ,w he re t h e d i r e c t i o n s p e c i f i e d b y t h e u s e r i st h e s u n ' s a z i m u t h . ( S ha d in g of o ne c e l l b ya n o th e r i s n o t c on s id e re d i n t h i s a n a l y si s - -o n l y t h e a s pe c t o f e ach c e l l . )
F o r b o t h R ASPECT and C ASPECT, c l a s s
z e r o i s u se d f o r c e l l s w i t h n o as pe ct .
D i f f e r e n t i n v e s t i g a t o r s may h av e d i f f e r -e n t i d ea s as t o w ha t c o n s t i t u t e s a go od s e to f s l o p e o r as p e ct c l a s s e s . T h e r e fo r e , t h ec a p a b i l i t y o f u s e r - d e f i n e d c l a s s e s h as be enadded t o V IEWIT. These c la ss es can be usedf o r sl op e, a s pe c t o r e l e v a t i o n a n a l y s i s . T ou se t h i s o p t i o n , f i r s t d e f i n e th e cl a ss e s .T h e re c a n be u p t o 50 u s e r - d e f i n e d c l a s s e s .The u s e r who i n t e n d s t o p r i n t g ra y -s h ad e dm aps s h o u l d n o t d e f i n e m o re t h a n n i n e c l a s s e s ,h ow e ve r, b e ca u se o n l v t h a t m any d i s t i n c t
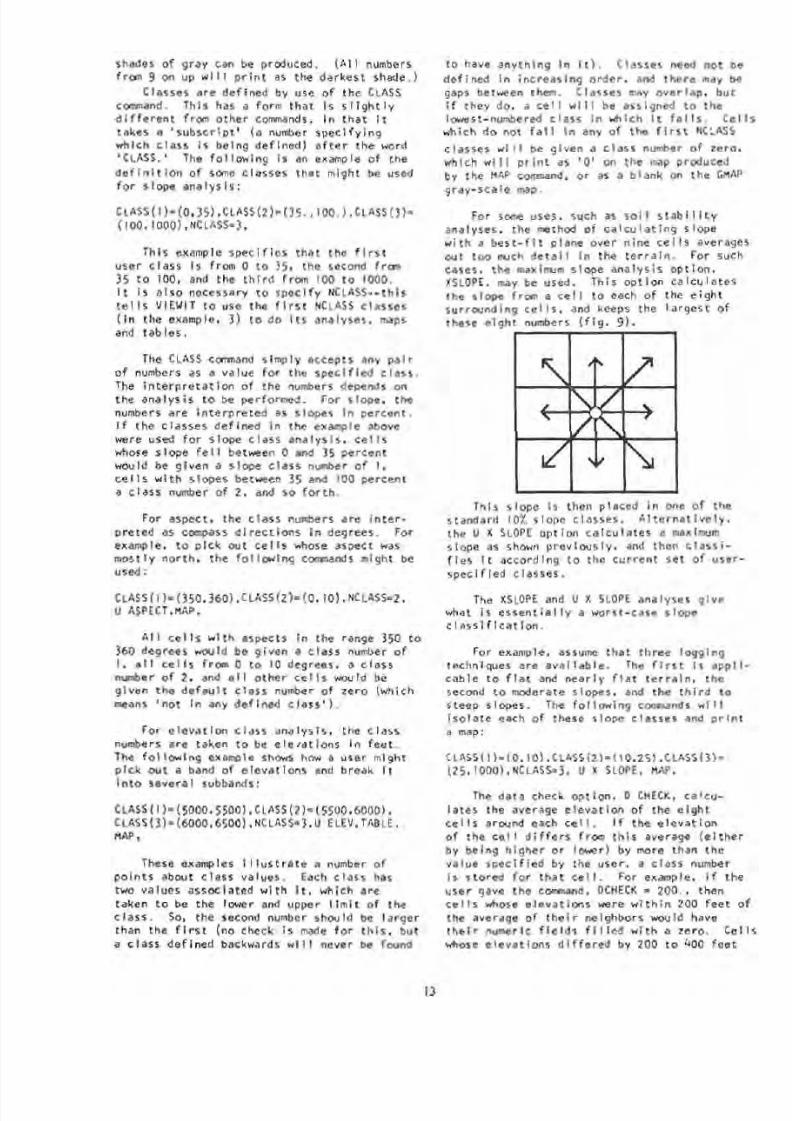
8/8/2019 VIEWIT: computation of seen areas, slope, and aspect for land-use planning
http://slidepdf.com/reader/full/viewit-computation-of-seen-areas-slope-and-aspect-for-land-use-planning 41/67
shades o f gr ay can be produced . (A1 1 numbers
from 9 on up wi 1 1 p r i n t as the darkest shade.)
Classes a re def ine d b y use o f th e CLASS
command. This has a form th at i s s l i g h t l y
d i f fe re n t f rom oth er commands, i n th at i t
takes a 'su bsc r ip t ' (a number spe c i f y in g
wh ic h c las s i s be ing de f i ned ) a f t e r t he word
'CLASS.' The fo l l ow in g i s an example o f the
d e f i n i t i o n o f some c lasses tha t might be used
fo r s lope ana ly s i s :
Th i s examp le s pec i f i es t ha t t h e f i r s t
user c l ass i s f rom 0 t o 35, the second f rom
35 t o 100, and the t h i r d f rom 100 t o 1000.
I t i s a l so necessary t o sp ec i fy NCLASS--this
t e l l s VIEWIT t o use the f i r s t NCLASS c lasses
( i n the example, 3) t o do i t s analyses, maps
and tables.
The CLASS command s im ply a ccep ts any p a i r
o f numbers.as a value f o r the spe c i f i ed c lass .
The i n t e rp re t a t i o n o f th e numbers depends on
the analys is t o be per formed. For s lope, the
numbers are i nte rpr et ed as s lopes i n percent .
I f the c l asses def ined i n the example above
were used fo r s lope c lass ana lys i s , ce l ls
whose slo pe f e l l between 0 and 35 perc ent
would be giv en a slope c la ss number o f I,
c e l l s wi t h s lopes between 35 and 100 percent
a cl as s number of 2, and so f o r t h .
For aspect, the clas s numbers are i nt er -
pret ed as compass di re ct io ns i n degrees. For
example, t o p i ck out c e l l s whose aspect was
mos t ly n or th , the fo l l ow in g commands might be
used :
A l l c e l l s w i t h aspec ts i n t he r ange 350 t o
360 degrees would be giv en a cl as s number o f
I, a11 c e l l s f rom 0 t o 10 degrees , a c lass
number of 2, and a l l oth er c e l l s would be
g iven th e def au l t c las s number o f zero (which
means ' no t i n any def ined c la ss ' ) .
For e lev at io n c lass ana lys is , the c lass
numbers are taken t o be e leva t ion s i n fee t .
The f o ll o w in g example shows how a user mig ht
p i ck ou t a band o f e le vat i ons and break i t
i n t o several subbands:
CLASS(] )=(5000,55OO) ,C~A SS(2 )=(5500 ,600 0),
CLASS(3)=(6000,6500) ,NCLASS=3,U ELEV,TABLE,
MAP,
These examples i l l u s t r a t e a number o f
po in ts about c las s values. Each c las s has
two values assoc iated wi th i t, which are
taken t o be the lower and upper l i m i t o f the
cl as s. So, th e second number should be la rg er
than t he f i r s t ( no check i s made fo r t h i s , bu t
a c la ss def ine d backwards w i l l never be found
t o have any th ing i n i t ) . C lasses need not be
def ined i n incre as in g order , and the re may be
gaps between them. Classes may ov er la p, b u t
i f t hey do, a c e l l w i l l be ass igned t o t he
lowest-numbered cl ass i n which i t f a l l s . C e l ls
which do no t f a l l i n any o f t he f i r s t NCLASS
classes w i l l be given a c las s number of zero,
which w i l l p r i n t as ' 0 ' on the map produced
by t he MAP command, o r as a b lank on t he GMAP
gray-scale map.
For some uses, such as s o i l s t a b i l i t y
analyses, the method o f calc ul at in g s lope
w i t h a be s t - f i t p lane ov er n ine c e l l s ave rages
ou t t oo much de ta i l i n t he t e r r a i n . For such
cases, th e maximum slop e ana lys is opt ion ,
XSLOPE, may be used. Th is o p ti o n ca lc u la t es
t h e sl op e f r om a c e l l t o e ach o f t h e e i g h t
surrounding ce l l s , and keeps the l arg est of
these ei uh t numbers ( f i q. 9) .
Th is s lope i s then p laced i n one o f the
standard 10% s lope c lasses. A l te rn at iv el y ,
t he U X SLOPE op ti o n ca l cu l at e s a maximum
slop e as shown pre vio usl y, and then cl as si -
f i e s i t ac co r ding t o t he c u r r en t s e t o f us er -
s pec i f i ed c las s es .
The XSLOPE and U X SLOPE analyses give
what i s ess en t i a l ly a wors t -case s lope
c l a s s i f i c a t i o n .
For example, assume t h a t th re e logg ing
t ec hn iq ue s ar e a v a i l a b l e . The f i r s t i s a p p l i -
c ab le t o f l a t and n e a r ly f l a t t e r r a i n , t h e
second t o moderate s lopes, and the t h i r d t o
steep slopes. The fo l l ow in g commands w i l l
i s o l a t e each o f these s lope c lasses and p r i n t
a map:
CLASS(\)=(O, 10),C~~ SS(2)=(10,2 5) CLASS(^)=(25,1000),NCLASS=3, U X SLOPE, MAP,
The data check option, D CHECK, ca lcu-
la tes t he ave rage e lev a t i on o f t he e igh t
c e l l s a r ound eac h c e l l . I f t h e e l e v a t i o n
o f t h e c e l l d i f f e r s f ro m t h i s a verage ( e i t h e r
by being hi gher o r lower) by more than the
value spe c i f ied by the user, a c las s number
i s s to r ed f o r t ha t c e l l . Fo r example, i f t he
user gave t he command, DCHECK = 200., then
c e l l s whose e lev a t i on s were w i t h in 200 f e e t o f
the average o f t h e i r neighbors would have
t h e i r numeric f i e l d s f i l l e d w i t h a z er o. C e l l s
whose e levat ions d i f f e r ed by 200 t o 400 fee t

8/8/2019 VIEWIT: computation of seen areas, slope, and aspect for land-use planning
http://slidepdf.com/reader/full/viewit-computation-of-seen-areas-slope-and-aspect-for-land-use-planning 42/67
I
would re cei ve a I, by 400 t o 600 feet a 2, ands o f o r t h . These numbers can be displayed withTABLE, MAP, o r G MAP. Depending on th e p re ci -
s io n w i t h wh ich the da t a was ga thered , ce l l swi th a la rge d i f f ere nce c la ss number should be
suspected o f hav ing in cor rec t e leva t ions .They should then be checked a gain s t the or ig i -nal topographic map t o determine i f an e r r o rwas made i n d i g i t i za t i on .
VIEW may be t he most impor tan t ana lys isc ap ab i l i t y f o r most us e rs o f t h i s system. I tp ro duc es v i s i b i l i t y i n f o r m a t io n t h a t can bedisplayed as a seen area map, v i s i b l e f r e-quency map, o r we igh ted v i s i b i l i t y map,depending on the opt ions chosen.
T hi s o p t i o n d et er mi ne s v i s i b i l i t y asfo l lo ws: A c i r c l e o f rad ius RADIUS as spec i -f i ed by the user i s f o rmed around the de f inedobserver po in t . From the observer poi nt , a
r ay i s c rea t ed ou t t h r ough t he i n t e r v en i ngc e l l s t o each p o i n t on t h e r i m o f t he c i r c l e .S in ce t h e e l e v a t i o n o f e ach c e l l on t h i s r a yand i t s d is t anc e f rom the observer a re known,
t he e l ev a t i on /dep r es s i on ang le r e l a t i v e t othe observer can be ca lc ul at ed . Only whent h i s i s eq ua l t o o r g r e a t e r t h an t h e an g le f o rany p reced ing c e l l on the ray can the ce l l i nquest ion be seen.
A d ia gr am i l l u s t r a t e s a m a t r i x o f d a t aw i th an observer po i n t , c i r c le , and one ray( f i g . 1 0 ) .
( Al th ou gh t h i s i l l u s t r a t i o n shows t h e c i r c l el y i n g e n t i r e l y w i t h i n t h e d a ta , t h e sy st emdoes no t requ i re t h i s and i t may be p a r t i a l l y
o r e n t i r e l y o u t s i d e t he c u r r e n t s u b r ec ta n gl eor even the da ta mat r i x . )
Eleva t ion s a long a ra y are determined andsome ce l l s a re shown t o be vi s i b l e and some not( f i g . 1 1 ) .
In th e sim pl est case of the VIEW anal ysis,when a ce l l i s v i s i b l e t he system adds I t ot h e c o n t e n t s o f t h e n u m e r i c f i e l d f o r t h a t
c e l l . Assume, f or example, t ha t the userissues the commands :
VIEW,TABLE,MAP,
observer
The CLEAR ensures t ha t th e numeric f i e l d has
a l l zeroes . Then an observer po s i t i on i sde f i ned and a v i s i b i l i t y ana l y si s per fo rm edf o r a r a d i us o f 16 mile s. The user coul d
have pr in te d a tabl e or map here, bu t e lec tedt o per form another anal ys is f o r a new observerpos i t i on. Since the radius o f examinat ion was
not changed, i t remained a t 1.25 mi les f o r th e
second analysis.
A f t e r th e second VIEW command, each c e l l ' s
numer ic f i e l d cou ld be i n one o f t h ree s ta tes :
a ) S t i l l conta in in g zero, which indicate s
t h a t i t could be seen by neither observer;(b ) con ta in ing 1 , i n d i c a t i n g t h a t i t was seenby one; (c ) con ta in ing 2, i nd ica t in g tha t i t
was seen by bo th obse rv er s. The TABLE com-mand w i l l produce a t ab le showing t he numberand area of ce l ls seen 0, 1 , and 2 t imes. TheMAP command w i l l p r i n t a map where each c e l l
wi 1 be pr in te d as blan k (seen zero t imes), 1,o r 2. O r , i f t he AVG MAP op t i o n has beenspe cif ied , the MAP command w i l l p r i n t a map
where each c e l l w i l l p r i n t as b l ank ( i n v i s -ib le ) , 5 (seen by 50 percent of the observers) ,o r 10 (seen by 100 perc ent o f t he observers).I n add i t i on , t he c e l l s wh ic h we re ou t s i de t hede f i ned r ad i us o f obs er v a ti on f o r a l l obs er v erp o i n t s w i l l be p r i n t e d as a ' . I . I n t h i ssimp lest case, the map coul d be ca l l ed a v i s-ib le f requency map. Any number o f ob ser verpo in ts can be combined f o r one anal ysi s.
A number o f op t i ons r es t r i c t o r m od i f y thev i s i b i l i t y a n al y si s and a f f e c t t he f or m o f
d i s p l a y o f t h e r e s u l t s :
1 , Z ANGLE
The lower l i m i t on v i s i b i l i t y c an a l s obe se t by sp ec if yi ng LO ANGLE, which hasthe same meaning as Z ANGLE. An upperl i m i t of v i s i b i l i t y can be set by spec i fy -ing H I ANGLE, a l i m i t above which theobserver i s not allowed t o look. Thedefau l t , +PO degrees (s tr ai gh t up), i s no ta l imi ta t i on . To use th is feature, the usershould specify ' H I ANGLE = I , followed by anangle between 0 and 90.
2. Z BIAS can be used t o r ai se o r lower the
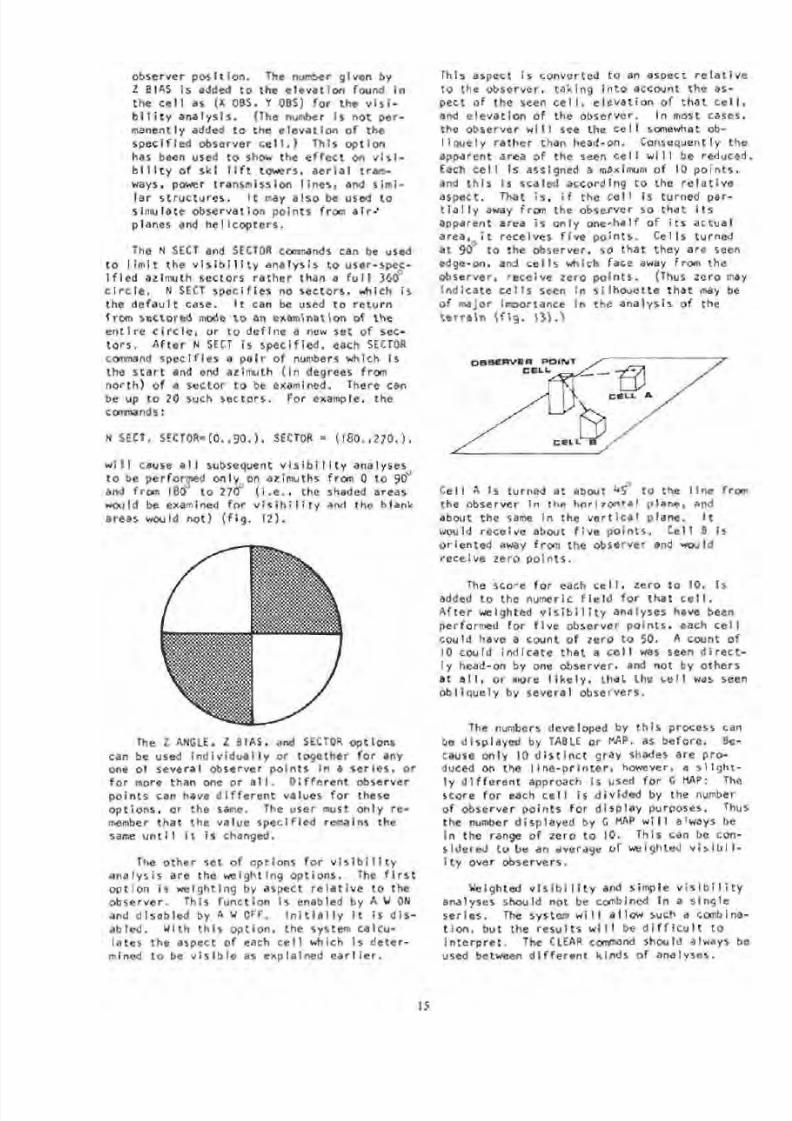
8/8/2019 VIEWIT: computation of seen areas, slope, and aspect for land-use planning
http://slidepdf.com/reader/full/viewit-computation-of-seen-areas-slope-and-aspect-for-land-use-planning 43/67
observer pos it io n. The number give n by
Z BIAS i s added t o the e le vat ion found i n
t h e c e l l as ( X OBS, Y OBS) f o r the vi s i -
b i 1 t y analy sis. (The number i s not per-
manentl y added t o the e le va t i on o f the
spec i f i ed observe r ce l l . ) T h is op t i on
has been used t o show the ef f e c t on v i s i -
b i l i t y o f s k i l i f t towers, ae r i a l t ram-
ways, power transm issi on l ine s, and sim i-
l a r s t r u c t u r e s . I t may al s o be used t os imu la te observa t ion po in ts f rom a i r - '
p lanes and hel i copt ers.
The N SECT and SECTOR commands can be used
t o l i m i t t h e v i s i b i l i t y a n a l ys i s t o us er- spe c-
i f i ed azimuth sectors ra th er than a f u l l 360
c i r c le . N SECT sp eci f ie s no sectors, which i s
the de f au l t case . I t can be used t o re t u rn
from sectore d mode t o an examination o f th e
e n t i r e c i r c l e , o r t o d e f i n e a new s e t o f sec-
t o r s . A f t e r N SECT i s spec i f i ed , each SECTOR
command sp ec if ie s a p a i r o f numbers which i s
the s t a r t and end azimuth ( i n degrees from
nor th) o f a se ct or t o be examined. There can
be up t o 20 such sec tor s. For example, th e
commands:
N SECT, SECTOR=(O. ,go.), SECTOR = (180. ,270.),
w i l l cause a l l subsequent v i s i b i l i t y an aly se so
t o be perfo rmed on l y o n azimuths f rom 0 t o 90
and from 180 t o 270 ( i e., the shaded areas
wou ld be examined fo r v i s i b i l i t y and the b lank
areas would not) ( f ig . 12).
The Z ANGLE, Z BIAS, and SECTOR opt ions
can be used i nd iv id ua l l y o r toge ther f o r any
one o f severa l observer po in t s i n a ser ies , o r
f o r more than one o r a l l . D i f fe r en t observe rpo i n ts can have d i f f e r en t va l ues f o r these
opt ion s, o r the same. The user must on ly re-
member th at t he value sp ec if ie d remains the
same u n t i l i t i s changed.
The o ther se t o f op t ions f o r v i s i b i l i t y
ana l ys i s a re the we i gh t i ng op t ions . The f i r s t
op t i on i s we i ght i ng by aspect r e l a t i v e t o the
observer . Th is func t io n i s enabled by A W ON
and disabled by A W OFF, I n i t i a l l y i t i s d i s -
abled, Wi th t h i s opt ion, the system calcu-
la te s t he aspect o f each c e l l which i s deter -
mined t o be v i s i b l e as exp la i ned e a r l i e r .
Th is aspect i s converted t o an aspect r e l a t i v e
t o the observer , tak i ng in to account the as-
p e ct o f t h e seen c e l l , e l e v a t i o n o f t h a t c e l l ,
and el ev at io n o f the observer. I n most cases,
the observer w i l l see t he c e l l somewhat ob-
l i qu el y ra the r than head-on. Consequent ly the
apparent area of the seen c e l l w i l l be reduced.
Each c e l l i s assigned a maximum o f 10 poi nts ,
and t h i s i s s c al ed a c co r di n g t o t h e r e l a t i v e
aspect. That is, i f t h e c e l l i s t u r ne d p ar -t i a l l y away f rom the observer so tha t i t s
apparen t area i s on l y one -hal f o f i t s ac tua l
area, i t rece ives f i v e po i n ts . Ce l l s tu rned
a t 9 0 t o the observe r, so tha t they a re seen
edge-on, and ce l l s which face away from the
observer, rece ive zero poi nt s. (Thus zero may
i nd i ca te c e l l s seen i n s i l houe t te th a t may be
of ma jor importance i n the ana lys is o f the
t e r r a i n ( f i g . 13 ). )
Ce l l A i s tu rned a t abou t 4 9 t o t he l i n e fr om
the obse rve r i n the h o r i zon ta l p l ane, and
about the same i n the ve r t ic a l p lane. I t
would rece ive about f i v e poin ts. Ce I 1 B i s
oriented away from the observer and would
rece ive zero po in ts .
The score f o r each c e l l , zero t o 10, i sadded t o the numer ic f i e l d f o r tha t c e l l .
A f te r we ighted v i s i b i l i t y ana lyses have been
per fo rmed f o r f i v e observer po i n ts , each c e l l
could have a count o f zero t o 50. A count of
10 cou ld ind ic a te t ha t a ce l l was seen d i re c t -
l y head-on by one observer, and n ot by oth ers
a t a l l , o r more l i k e l y , t ha t the ce l l was seen
ob l iqu e ly by severa l observers.
The numbers developed by t h i s process can
be di sp la ye d by TABLE o r MAP, as be fo re . Be-
cause only 10 d i s t i n c t gray shades are pro-
duced on the l ine -p r in ter , however, a s l i g h t -
l y d i f f e r en t approach i s used fo r G MAP: Thescore fo r each ce l l i s d iv ide d by the number
o f observer po in ts fo r d is p la y purposes. Thus
the number displayed by G MAP w i l l a lways be
i n the range o f zero t o 10. This can be con-
s idered t o be an average o f we igh ted v i s i b i l -
it y over observers.
Weighted v i s i b i l i t y and s im pl e v i s i b i l i t y
analyses should not be combined i n a si ng le
se rie s. The system w i l l al lo w such a combina-
t i o n, b ut th e r e s u lt s w i l l be d i f f i c u l t t o
i n t e r p r e t . The CLEAR command should always be
used between di f ferent k inds of analyses.

8/8/2019 VIEWIT: computation of seen areas, slope, and aspect for land-use planning
http://slidepdf.com/reader/full/viewit-computation-of-seen-areas-slope-and-aspect-for-land-use-planning 44/67
The Z ANGLE, Z BIAS, and SECTOR o p t i o n s
c a n be us ed f o r o n e o r m o re o b s e r v e r p o i n t s
f o r w e i gh te d v i s i b i l i t y a n a l y s i s , a nd h av e
t h e same e f f e c t s a s i n t h e s i m p l e ca se .
The s ec on d k i n d o f w e i g h t i n g i s d i s t a n c ew e i g h t i n g . T h i s c an b e u se d a l o n e o r i n com-
b i n a t i o n w i t h r e l a t i v e - a s p e c t w e i g h t i n g . Theo p t i o n a l l o w s t he v i s i b i l i t y o f a c e l l t o b ew e i g h te d b y i t s d i s t a n c e f r o m t h e o b s er v e r.
T o d o so . t h e u s e r m u st d e f i n e a d i s t a n c e -w e i g h t f u n c t i o n w h i c h e x p re s s e s t h e d e s i r e d
r e l a t i o n s h i p b e tw ee n d i s t a n c e and v i s i b i l i t y
R at h er t h a n h a v in g a l i m i t e d s e t o f d i s -
t a n ce f u n c t i o n s , t h e s y s te m a l ow s t h e u s e rd e f i n e an y f u n c t i o n w i t h i n c e r t a i n l i m i t s .
D i s ta n c e -w e i g h t f u n c t i o n s a r e d e f i n e d b y
a p p r o x i m a t i n g th em b y s t r a i g h t l i n e se gm en tsand s p e c i f y i n g t h e i n t e r s e c t i o n s o f t h e se 1 i n e
s eg me nts . T he se p o i n t s , w h i c h a r e c a l l e dt u r n i n g p o i n t s o f t h e f u n c t io n , a r e d e f i n e d b yth e T POINT command. A max imum o f 20 suc ht u r n i n g p o i n t s may b e u se d t o d e f i n e e a chd i s t a n c e - w e i g h t i n g f u n c t i o n . The p r og r am
assu me s t h a t a d i s t a n c e o f z e r o a lw a y s h a s aw e i g h t o f 1 .0 , a nd t h a t t h e l a s t u s e r - s p e c i -f i e d w e i g h t e x t e n d s o u tw a d t o a n i n f i n i t e
d i s t a n c e .
Assum e t h a t t h e u s e r ssues these commands:
NO D W T P , T POINT =( .5 , .O),T POINT = (1.0,
0 . 5 ) , T P OIN T = ( 1 . 5 , 0 . 5 ) , P O I N T= ( 2 , 0 . 25 ) ,
D WON,
T he f i r s t com mand, NO D W T P, s p e c i f i e s n o
d i s ta n c e - w e i g h t t u r n i n g p o i n t s . T h i s s e t s t h ed i s t a n c e - w e i g h t f u n c t i o n b a c k t o i t s i n i t i a l
v a l u e o f 1 .0 f o r a l l d i s t a n c e s . Then t h e u s e r
s p e c i f i e s f o u r p o i n t s o n th e f u n c t i o n ande n a bl es d i s t a n c e w e i g h t i n g ( f i g . 1 4 ).
weight
distance in miles
The l i n e i s a u t o m a t i c a l l y c o nn ec te d t o w e i g h t1 a t d i s t a n c e z e r o and t h e l a s t w e i g h t g i v e n
i s e x t e n d e d o u t w a rd .
T h i s ex am ple a l s o i l l u s t r a t e s t w o r u l e sf o r t h e d e f i n i t i o n o f d i s t a n c e - w e i g h t f u nc -t i o n s : ( a ) w e i g h t s a r e n um b er s b e t w ee n z e r o
a nd 1.0 i n c l u s i v e ; ( b ) t u r n i n g p o i n t s m u s t b ed e f i n e d f r om s m a l l e s t d i s ta n c e s t o g r e a t e rd i s ta n c e s , o t h e rw i s e t h e w e i g h t i n g w i l l n o tf u n c t i o n p r o p e r l y .
When a d i s t a n c e - w e i g h t f u n c t i o n i s d e f i n e d ,D W ON e n a bl es w e i g h t i n g b y d i s t a n c e . As i n
r e l a t i v e - a s p e c t w e i g h ti n g , e a ch c e l l re c e i v e s
a s c o re o f z e r o t o 10 p o i n t s . A w e i g h t o f 1.0c o rr es p o nd s t o 10 p o i n t s , a w e i g h t o f .5 t o 5
p o i n t s , and s o f o r t h . T h i s i n f o r m a t i o n c a n b e
p r i n t e d w i t h TABLE o r MAP, o r d i s p l a y e d a s a na ve ra ge w e ig ht e d v i s i b i l i t y w i t h G MAP as i nt h e ca se o f r e l a t i v e - a s p e c t w e i g h t i n g .
I f t h e u s e r s p e c i f i e s b o t h r e l a t i v e - a s p e c tand d i s t a n c e w e i g h t i n g , t h e t w o w e i g h t i n g p r o -c e ss e s a r e c a r r i e d o u t in d e p e n d e n t l y . E ac h
p r oc es s p r oduc e s a num ber be tw een 0 and 1 .0 .I n t h e c as e o f r e l a t iv e - a s p e c t w e i g h t i n g , t h i snum ber i s t h e a p p ar en t a r e a o f t h e c e l l a s af r a c t i o n o f i t s a re a i f s e e n h ea d -o n . I n d i s -t a n c e w e i g h t i n g , t h e n um be r i s d e r i v e d f r o m
t h e u s e r ' s f u n c t i o n . T he n t h e s e t w o n u mb e rs
a r e m u l t i p l i e d t o pr o du ce a f i n a l w e i g h t i nt h e ra ng e o f 0 t o 1.0. T h i s w e i g h t i s th e n
c o n v e r t e d t o 10 c l a s s e s f r o m 1 t o 10 an d a dd edt o t h e co n te n ts o f t h e n um er i c f i e l d o f t h ec e l l i n q ue s t i o n .
E i t h e r r e l a t iv e - a s p e c t o r d i s t a n c e w e i g ht -i n g o r b o t h ca n be u se d f o r a ny o b s e r v e r p o i n t
o r p o i n t s i n a s e r i e s o f v i s i b i l i t y a n al y se s ,
b u t n e i t h e r s h o u ld b e co mb in ed w i t h a s i m p l ev i s i b i l i t y a n a ly s i s f o r t h e re as on s e x p l a i n e d
e a r l i e r . (A s e r i e s o f v i s i b i l i t y a na ly se se n d s wh en t h e u s e r is s u e s a CLEAR command; upt o t h a t p o i n t n um be rs a c c um u l at e i n t h e n u -m e r i c f i e l d s f o r ea ch a n a l y s is . )
S ince GMAP p r i n t s th e lo wes t shade o fg r ay f o r t he l ow es t c l as s , num bers w h i c h a r ebe low 5 p e r c en t w i l l p r i n t as b l a n k. Th us, i f
t he r e a r e 20 o r m ore obs e rv e r s , o r i f t h e t o t a lo f o b s e rv e r p o i n t s t im e s o b s e rv e r p o i n t r a n ks
e xc ee ds 20, some v i s i b l e c e l l s w i l l b e p r i n t e das b lank . Where t h i s i s undes i r ab le , a new,l i g h t e r s ha de o f g r ay ca n be p r i n t e d f o r c e l l st h a t a r e b e l o w 5 pe r c en t bu t a r e nonz e r o . T h i sop t i on i s s e lec t ed by s p ec i f y i ng 'SHOW N 2 ' f o r-how nonze ro. The d e fa u l t case may be re sto re dby s pec i f y i ng ' H I D E N Z ' .
A t t imes a use r may want t o g i ve an observ -e r p o i n t g r e a t e r w e ig h t t h a n a n o th e r s uc h p o i n t .To do so, use th e 'RANK' command. The d e f a u l tobserver rank is 1 ( one ) . I f t h e u s e r s p e c i -f ies, 'RANK = 2, V I EW , . . . ' t h e n c e l l s s e e nb y th e o b s e rv e r w i l l h av e a co u n t o f 2 r a t h e rthan 1 a dd ed t o t h e v a lu e i n t h e i r n u m e ri c
f i e l d . The va lu e g ive n by the most recen t RANKcommand i s mu l t ip l i e d by whatever m ight o th er -w i s e ha ve b ee n s t o r e d i n o r a dd ed t o a p a r t i c u -l a r c e l l . T h er efo re , i f a c e l l w o u ld h a ve r e -ce ived an inc rement o f 5 ( f o r 50 p e rc e n t ) i n aw e ig h te d v i s i b i l i t y a n a l y s i s , and i f t he r anki s 5, th e n th e c e l l w i l l r e c e i v e an i nc re m en to f I S . A ra nk w i l l a f f e c t a l l o bs erv ers u n t i li t i s changed, so the de fa u l t mus t be res et byspecifying 'RANK = 1 ' .
W eig hte d v i s i b i l i t y a na l ys e s w i t h m oret han one obs e r v e r po i n t av e rage t he f i n a lw eig hte d v i s i b i l i t y o ve r a l l o b s er ve rs . W i ths c a t t e r e d o b s e r v er p o i n t s , t h e r e s u l t s may be

8/8/2019 VIEWIT: computation of seen areas, slope, and aspect for land-use planning
http://slidepdf.com/reader/full/viewit-computation-of-seen-areas-slope-and-aspect-for-land-use-planning 45/67
obscured by averagin g them away i n some areas .The user can avoid this by specifying 'MAXIMUM'.This w i l l cause the VIEWIT system t o keep themaximum o f the p revious and present values o ft h e co u n t f i e l d o f a v i s i b l e ce l l r a t h e r t h a nt o add the ol d and new values and then l a t e raverage fo r pr in tou t (as i s done i n the defaul tcase).
The default mode can be restored by speci-f y i n g 'AVERAGE'. The MAXIMUM command, al tho ug h
pr incipa l ly in tended for use wi th weightedvisibi l i ty, can also be used with nonweightedv i s i b i l i t y . Combined wi th the RANK command,MAXIMUM coul d be used t o la bel each c e l l w i t hthe rank of the highest-ranked observer pointwhich saw the cell.
The mode o f MAXIMUM or AVERAGE can bechanged a t any time. However, the user shou ldunderstand the e ff ec t t hi s change wi l l have.The mode i s checked when a v i s i b i l i t y a naly sisi s done, and e i t h e r a sum or maximum i s kept asexp la ine d. The mode i s al so checked fo r mappr in to ut requests, and i f the mode at the timeo f the map command i s AVERAGE, the systemassumes that th e mode was AVERAGE f o r t he v i s i -b i l i t y ana lyses as we l l . I t then d iv ides thecontents of the numeric f i e l d of each ce l l bythe number of observers ( i n the case of weightedmaps, AVG MAP o r GMAP). I f the mode at the timeo f th e map pr i n t o u t command i s MAXIMUM, thesystem does not perf orm any di vi si on .
Users in te res ted i n the s t a t is t i ca l p ro -per t ies o f the i r e leva t ion da ta o r ana lys isresu l t s may p r in t ou t tab les o f s ta t i s t i c a lmeasures by use o f the STATS, V STATS and ELSTATS commands. The i nf or ma ti on pr in ted outincludes the minimum, maximum, mean, standarddev iat io n, v ariance, skewness, and ku rt os is .This in format ion is pr in ted out fo r the eleva-t i on data i n the current subrectangle by speci-f y i n g 'EL STATS'. The inf or ma ti on can be deve l-
oped and pr in ted out f or the count f i e l d ofce l l s in the current subrectangle by specify ingSTATS'. I f the count f i e l d contains the re-su l ts o f one or more v i s i b i l i t y analyses, thes t a t i s t i c s w i l l only be computed on examinedce l l s . Ca lcu la t ion o f s t a t is t i cs can be l im i tedt o ce l l s a lone by spec i f y ing ' V STATS'. Inother words, V STATS w i l l c al cul at e and pr i n tout s ta t i s t i c s fo r ce l l s whose count f i e l d i snonzero.
3.2.5 Type o f I np ut Expected f o r Each Command
Th is system prov ides f o r the f ree- fo rm in -
p u t o f us e r commands. Commands need no t s t a r t
o r end i n any pa r t i c u l a r ca rd column, they may
cont inue across card boundar ies, and b lanksar e us ua ll y ignored. Each command i s a wordo f severa l l e t te rs . Cer t a in commands requ i reth a t th e word be se t equa l t o a va lue . Theth re e types o f va lues are: numbers, st r i ng so f charac te rs , and pa i r s o f numbers . Anexample fo l lows:
NROWS=50, NCOLS = 40, BCD, FORMAT = ' (40F2.0) 'Z SCALE = 100.0, READ, RADIUS = 1.50, MT1TI-E =
'SMALL MAP',OBS=( 12, 33. ), VIEW, MAP, OBS = (12,34),VlEW,MTITLE = '',MAP,
Th is example de f ines an e leva t ion a r ray o f50 b y 4 0 l o ca t i o n s , sp e c i f i e s t h a t i t i s i ncard image form (which i s th e de fa ul t and neednot have been spec i f i ed ) , and th a t t he da ta a r ei n 4 0 co n se cu ti ve tw o -d ig i t l oca t ions on eachcard. The e l eva t io ns as read f rom the cardsare t o be mu l t ip l i ed by 100. The da ta a re readby u s i n g t h e d e f a u l t s o f B Y ROWS, e t c . As im pl e v i s i b i l i t y a n a l ys i s i s t h en p er fo rm edwi t h the observer a t (12,33) and a map o f t imes
seen pr in te d w i t h the t i t l e SMALL MAP. Thisana l ys i s i s repea ted f o r a new observer.
The example i l l u s t ra t es these po in ts : Cer -t a i n commands su ch as BCD and READ expe ct nova lue ; any va lue g iven w i l l be ignored. Othercommands expect values o f a c e r t a i n type. Nu-mer ic va lues
.may have any o f th e forms NNN,
NNN. NNN, NNN, o r any o f t he se pr ecede d by aminus s ign . I f the p rogram expects an in teger ,the number g iven w i l l be rounded t o the neares tin teger . Charac te r s t r i ng s a re enc losed bys i n g l e q uo te s, and o n l y i n s id e t h e q u ote s a r eb l a n k s s i g n i f i c a n t . (On ly TITLE, M TITLE FOR-
MAT, FIL E and COMMENT ex pe ct ch ar ac ter s t r i n gvalues.) Commands a r e se pa ra te d by commas,and extra commas between commands are ignored.Card boundaries are ignored (and as a conse-quence, the l as t cm a n d on each cardhave a t r a i l i n g comma, o r t he re must be a com-ma befor e the f i r s t command on th e nex t card,o r b o th ) . Pai rs o f numbers a re enclosed byparentheses and sepa rate d by a comma; ot he r-wise, t h e i r form i s the same as fo r numberss tand ing a lone .
Commands may al s o have a su bs cr i pt , whic hi s a number i n paren thes is fo l lo win g the com-mand name. Cur ren t l y th i s i s on ly used by the
CLASS'command. I f a subs cr i p t i s used w i thany other command i t w i l l b e i g n or e d and awarning message pr inted.
The character ' $ I has a spec ia l func t ioni n s t r i n g s o f c h ar a c t er s - -i t a c t s as a t a b t ot h e n e x t se t o f 12 ch a r a c te r s . T h i s i s i n t en d -
e d f o r u s e w i t h t h e M TITLE and MESSAGE com-mands. Map t i t l e s a re p r i n t ed as two l i ne so f 12 ch a r a c te r s each. To p r i n t t h e t i t l eUSER-CLASS SLOPE MAP on two l i n e s , t h e us ercould use the command
MTITLE='USER-CLASS SLOPE MAP' .where th e two b lanks a f t e r t he word 'CLASS'ensure th a t t he word 'SLOPE' w i l l s t a r t onthe nex t l i ne , o r more s imp ly , the user cou ld
sa y
MTITLE=' USER-CLASS$SLOPE MAP',
wh ich wou Id save hav ing t o coun t charac te rs .
A l l us er commands, whether th ey expect avalue, and i f so what t ype , a re l i s te d here .Because bla nk s a r e ig nore d, th e command ZSCALE can be g i ve n as ZSCALE o r Z S C A L E,
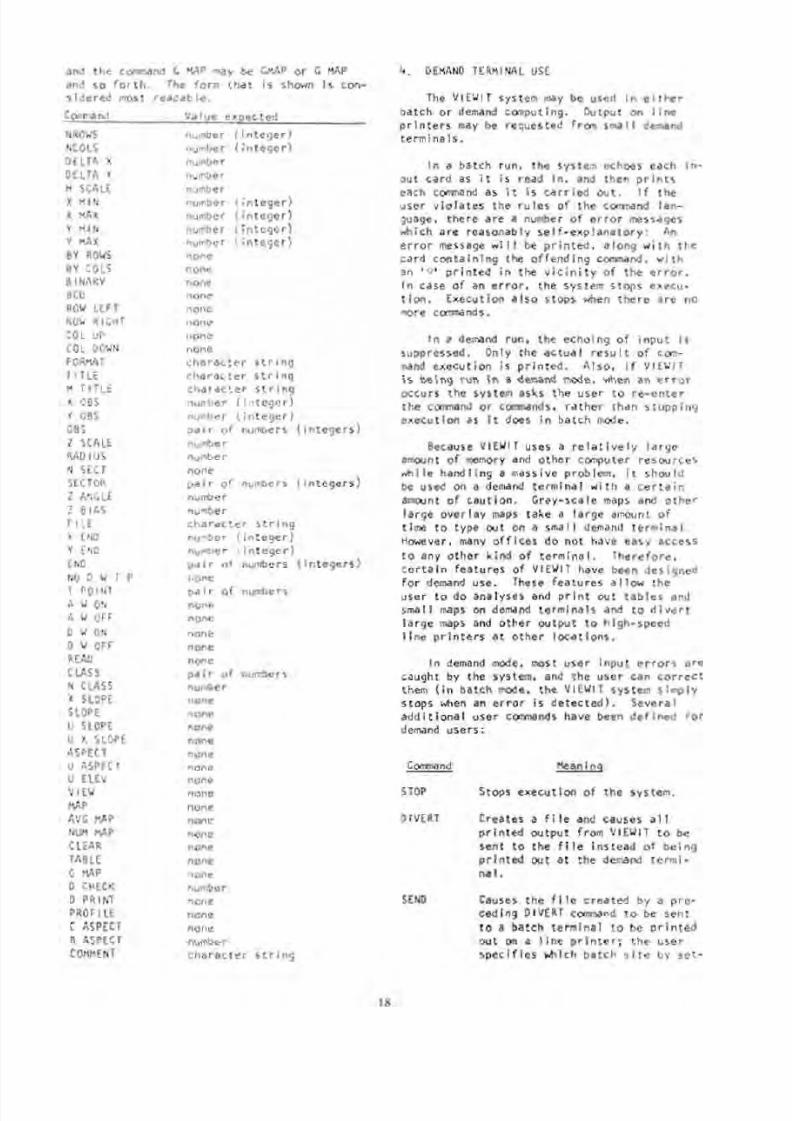
8/8/2019 VIEWIT: computation of seen areas, slope, and aspect for land-use planning
http://slidepdf.com/reader/full/viewit-computation-of-seen-areas-slope-and-aspect-for-land-use-planning 46/67
and t he command G MAP may be GMAP o r G MAP
and so fo rt h. The form th at i s shown is con-
side red most readable.
Command Value expected
NROWS number ( integer)
NCOLS number ( integer)
DELTA X number
DELTA Y number
M SCALE number
X MIN number ( integer)
X MAX number ( integer)
Y MIN number ( integer)
Y MAX number ( integer)
BY ROWS none
BY COLS none
B I NARY none
BCD none
R O W LEFT none
RO W RIGHT none
COL UP none
COL DOWN none
FORMAT c h a r a c t e r s t r i n g
T I TLE c h a r a c t e r s t r i n g
M TITLE c h a r a c t e r s t r i n gX O B S number ( integer)
Y O B S number ( integer)
O B S pa i r of numbers ( in t ege rs)
Z SCALE number
RAO I US number
N SECT none
SECTOR pa ir of numbers ( in t ege rs)
Z ANGLE number
Z BIAS number
FILE cha rac te r s t r i ng
X END number (integer)
Y END number ( integer)
EN D pa i r of numbers ( in t ege rs)
N O D W T P none
T POINT pai r of numbers
A W ON none
A W OFF none
D W ON none
D W OFF none
READ none
CLASS pa ir o f numbers
N CLASS number
X SLOPE none
SLOPE none
U SLOPE none
U X SLOPE none
ASPECT none
U ASPECT none
U ELEV noneVIEW none
MAP none
AVG MAP none
NUM MAP none
CLEAR none
TABLE none
G MAP none
D CHECK number
D PRINT none
PROF I LE none
C ASPECT none
R ASPECT number
COMMENT ch ara c ter s t r i n g
4 . DEMAND TERMINAL USE
The VIEWIT system may be used i n ei t h e r
bat ch o r demand computing. Output on li n e
p r i n t e r s may be requested from sm all demand
terminals.
I n a batch run, the system echoes each in -
put card as i t i s read in, and then p r i nt s
each command asi t
i s c a r r i e d o ut .I f
t heuser vio la te s the r ul es o f t he command lan-
guage, th er e are a number o f e r r o r messages
which are reasonably sel f-e xpl ana tor y: An
er r o r message w i l l be p r in ted , a long w i th the
card cont ain ing t he offe nd in g command, w i t h
an ' * I p r i nt e d i n th e v i c i n i t y o f t he e r r o r .
In case o f an er ro r, the system stops execu-
tio n. Execution al so stops when the re ar e no
more commands.
I n a demand run, the echoing of in pu t i s
suppressed. Only the ac tu al re s u l t o f com-
mand execution i s pri nte d. Also, i f VIEWIT
i s b ein g ru n i n a demand mode, when an e r r o r
occurs the system asks the user t o re- ent erth e command o r commands, ra th er th an s top p in g
execution as i t does i n bat ch mode.
Because VIEWIT uses a re l a t i v e l y la rg e
amount o f memory and ot he r computer res our ces
wh il e h and lin g a massive problem, i t should
be used on a demand ter min al w i t h a c e r t a i n
amount o f cau tio n. Gray-scale maps and ot he r
lar ge ove rla y maps tak e a la rg e amount o f
time t o type out on a small demand te rm in al .
However, many of f i c e s do no t have easy access
t o any o ther k ind o f te rmina l. Therefore,
certain features of VIEWIT have been designed
for demand use. These fe at ur es a1 ow th euser t o do analyses and pr i n t out t ables and
small maps on demand ter min als and t o di v e r t
la rg e maps and oth er out put t o high-speed
l i n e p r i n t e r s a t o t h er l oc a ti on s .
I n demand mode, most user in pu t e r r o r s a r e
caught by the system, and the use r can co rr e ct
them ( i n batc h mode, th e VIEWIT system si mp ly
stops when an err or i s detecte d). Several
ad di ti on al user commands have been de fi ne d f o r
demand users:
Command Meaninq
STOP Stops execution of the system.
D IVERT Creates a f i l e and causes a l l
pr i nte d output f rom VIEWIT t o be
s en t t o t he f i l e i ns te ad o f b ei n g
p r i n ted ou t a t the demand termi-
nal ,
SEND Causes th e f i l e cr ea te d by a pre -
ceding DIVERT command t o be se nt
t o a batch te rm ina l t o be p r i n te d
ou t on a l i ne p r i n te r ; t he use r
spec i f i es whi ch ba tch s i t e by se t -

8/8/2019 VIEWIT: computation of seen areas, slope, and aspect for land-use planning
http://slidepdf.com/reader/full/viewit-computation-of-seen-areas-slope-and-aspect-for-land-use-planning 47/67
t i n g SEND t o the. s i t e ID (see the
examp Ie beIow)
MESSAGE P r in t s a s t r i n g o f char acte rs i n
l a rge l e t t e r form, w i t h up t o 10
l ines of 12 characters each.
This command i s intended f o r use
w i t h DIVERT and SEND t o l a b e l t he
ba tc h ou tp ut . Als o, MESSAGE can
be used a t any t ime ( i n e i th er
demand o r ba tch mode) t o p r i n t ou tl a rge l e t t e r s f o r any purpose .
The DIVERT and SEND commands are es pec ia l -
l y use fu l f o r map output. The fo l lo wi ng exam-
p l e shows how a user mi ght do a slo pe c la ss
analysis and then p r i n t th e s lope c lass map a t
a high-speed s i t e:
SLOPE, TABLE,
(a t th i s po i n t the user i nspects the tab l e
and decides th at the w i l l be w or th p r i n t -
ing)
The 'DIVERT' command cre at es a f i l e , and
put s th e words VIEWIT OUTPUT a t i t s b egi nni ng
i n la r ge l e t t e r s . The 'MESSAGE' command i n
the example p r i n ts i n l a rge l e t te r s :
SEND TO
JONES AT
TAHOE NF
Command Va lue ex pecte d
SHOW NZ none
HIDE NZ none
HI ANGLE number
LO ANGLE number
INTERFACE (o pt io na l) cha rac ter s t r i n g
OVERLAY (o pt io na l) cha rac ter s t r i n g
RANK number ( i n t e g e r )
MAX IMUM none
AVERAGE none
STATS none
EL STATS none
V STATS none
The TABLE and MAP commands p r i n t a no th er
copy of the s lope c lass t able, and a s lope
c l as s map. Then the SEND command causes t he
f i l e c o n t a i n i n g t he o u t pu t produced b y a l l o f
the above t o be p r i n te d a t ba tch s i te F C~014,
whic h happens t o be the FCCC s i t e ID fo r th e
high-speed terminal i n the F o res t Se rv i ce 's
Ca l i fo rn ia Reg iona l Of f i ce i n San Francisco.
I f an err or occurs a f t e r a 'DIVERT' but
befo re a 'SEND', the er r or message w i l l go
i n t o th e f i l e r a t h e r t ha n t o t h e t er m in a l.
The recommended way t o us e t he se two commands
i s t o type i n DIVERT, then di sp la y commands,
then SEND, a l l on one l i ne . Inspect the l i n e
f o r e r r o r s b e fo r e h i t t i n g t he c ar r i ag e r e t u r n
key; i f there a re e r ro rs , cance l the l ine
( c o n t r o l X ) and retype i t .
I f something seems t o have happened a f t e r
a 'DIVERT', out put can be retu rned t o the
te rm ina l by t yp i ng i n the t ranspa ren t co n t ro l
statement:
The DIVERT command cre ate s a f i l e w i t h a
name o f the f or m PRnnnnnnnnnn, where nnnnnnnnn
i s a 10-d ig i t number. This i s a cata loged
p u b l i c f i l e ; n o rm a ll y t h e SEND command w i l l
f r e e i t and send i t t o t h e s pe c if ie d s i t e w i t ha @SYM operat ion. I f SEND f a i Is , or f o r what-
ever reason, the user could ex p l i c i t l y FREE
and S YM t h e f i l e , o r d e l et e i t , or examine i t
w i t h t h e i n t e r a c t i v e e d i t o r .
In other words, the f i l e created by DIVERT
i s a n o r d i n a r y E x e c - 8 f i l e . I t c a n b e o p e r a t -
ed on i n any way t ha t any l i n e image f i l e
(ca l le d 'SDFF' f i l e ) can be operated on.
Info rma t io n developed by the use of VIEWIT
ana lys is op t io ns can be saved and l a t er en tered
i n t o ove r la y mapp ing systems t o deve lop com-
b ined maps th a t cannot be produced d i r e c t l y by
VIEWIT.
The fo l l ow in g commands are used f o r t h i s
c a p a b i l i t y : XMIN, XMAX, YMIN, YMAX, FORMAT,
FILE, BY ROWS, BY COLS, ROW RIGHT, RO W LEFT,
COL UP, COL DOWN, BINARY, BCD, OVERLAY, INTER-
FACE.
The f o u r commands XMIN, XMAX, YMIN, YMAX
are used t o de f i ne a s ubrec t ang le w i t h in t he
data , such as fo r ana l ys is o p t io ns o f V IEWIT.
The su br ec ta ng le w i l l b e w r i t t e n o u t t o a f i l e
when t he OVERLAY o r INTERFACE command i s g iv en .
( I f no s u br e ct a ng l e i s s p e c i f i e d , t h e e n t i r e
d a ta a rr a y w i l l be w r i t t e n . ) The o r d e r i n w hi ch
t he da t a i s w r i t t en i s det e rm ined by t he com-
mands BY ROWS, BY COLS, ROW RIGHT, ROW LEFT, COL
UP, COL DOWN, wh ic h fu n c ti o n i n e x a c tl y th e
same way as the y do when rea di ng i n data w i t h
t he READ command .
The OVERLAY o r INTERFACE command ( e i t h e r
word may be used) w i 1 l cause the contents o f t he
c ou nt f i e l d o f e ach c e l l i n t he c u r r e n t su br ec -
t a ng l e t o be w r i t t e n o u t t o a f i l e on d i s k s t o r-
age. I f th e f i l e i s t o c on ta in ca rd o r l i n e
images, the n BCD should be sp ec i f ie d. In t h i s
case, a fo rmat must be supp l i ed by spec i f y i ng
FORMAT The form at t h a t was used t o read i n the
da t a c anno t be f u r t he r used s inc e t he ou t p u t

8/8/2019 VIEWIT: computation of seen areas, slope, and aspect for land-use planning
http://slidepdf.com/reader/full/viewit-computation-of-seen-areas-slope-and-aspect-for-land-use-planning 48/67
f o rmat must be appropr ia te t o wr i t e ou t i n tegers ;
t h a t i s , i t must have ' I ' f i e l d s p e ci f i ca t i on s .
The format given should be appropriat e t o wri te
out one row (or column i f BY COLS was spec i f i e d )
of the data.
I f BINARY i s sp ec if ie d, th en the INTERFACE
command wi 11 cause each row (o r column i f BY
COLS) o f the curre nt subrectangle t o be wri t t en
out as one binary record.
The F LE command may be used t o sp e c i f y t he
f i l e t o whi ch o ve r la y i n fo r mat i o n w i l l be w r i t t e n
I f the FILE command i s not given, the def au lt
f i l e name of 'OVERLAY.' w i l l be used f o r outp ut
da ta . I f an over lay i s wr i t t e n w i t hou t chang-
ing t he f i l e name, t he in fo rmat ion w i l l f o l l ow
p re v io us d at a w r i t t e n t o t h e same f i l e ( i f a n y ).
I f th e f i l e name i s changed, th e nex t INTERFACE
command w i l l w r i te in t o the beginning of the
new f i l e . That is , i f the user wri tes an over-
l ay i n t o f i l e A, then another i n t o f i l e B, and
t he n r et u rn s t o f i l e A f o r t he t h i r d o ve rl ay ,
t he i n f or mat i o n f ro m th e f i r s t o ve r la y w i l l b e
l o s t .
The INTERFACE command has two forms. Thef i r s t i s s imply :
I NTERFACE,
This form causes the contents o f the count
f i e l d o f each ce l l i n t he cu r ren t subrec tang le
t o be w r i t t e n o u t t o t h e sp e c if i e d o r d e f a u l t
f i le . The order and mode of wr i t in g are deter -
mined by the commands pr ev io us ly menti oned.
The second, o pt io na l f orm o f t he command
provides a label f o r the over lay data:
INTERFACE=' INFORMATION TO LABEL THE F LE' ,
I f t h e o ve rl ay i s BCD , then the contentsof the st r i ng o f characters between quotes
f o l l o w i n g t he INTERFACE command ar e w r i t t e n
t o t h e o ve r l ay f i l e as a card image (8 0 charac-
ter s) , fo l lowed by the data from the curre nt
subrec tangl e. I f BINARY was sp ec if ie d, then
the charac ters a re wr i t t en t o t he f i l e as one
20-word bin ary record (120 characters), f o l ow-
ed by the bina ry data records.
I f the f i l e spe cif ied by the FILE command
( o r t h e d e f a u l t f i l e ) e x i s t s as a ca ta lo ge d o r
t empora ry f i l e , t ha t f i l e w i l l be used. O ther -
wise, a temporary f i l e w i l l be created when the
INTERFACE command i s g iven.
The fo l low ing example i l l us t r a t es the use
o f the INTERFACE command:
Assume th e user has read i n dat a usi ng
these commands:
This w i l l read by rows, bottommost row
f i r s t , f rom l e f t t o r i g h t ( a l l d ef a ul t s) w i th
fo ur cards per row. The data w i l l come from
f i l e 'ZOATA.' (a l so a de fau l t ) .
The user then defines a subrectangle and
calcu la tes s lope c lass va lues:
XMIN = 51, Y MAX = 50, SLOPE, TABLE, MAP,
I f a f t e r seeing the t ab le and map, the
user decides t o save t h i s s lope c lass data f o r
fu r t he r analys is or combination wi th anothersystem, he would do so by
FILE = 'SLOPE.', FORMAT = ' ( 5012) ' ,
COL DOWN, INTERFACE = 'SLOPE CLASS DATA,
50 X 50'9
Af t er these commands are executed, f i l e
'SLOPE' c ont ain s one card image w i t h the la be l
inf orm ati on given between quotes, follow ed by
50 images--each w i t h one row's slo pe clas s
numbers. The topmost row appears f i r s t because
o f th e COL DOWN command. The other op t io ns re -
main a t t h e i r de fau l t values .
Af te r stopping the VIEWIT operator, the
user can c a l l in t o execut ion any other programor system, which can read the data from f i l e
'SLOPE. '
Another f e a t u r e added t o VIEWIT f o r de -
mand use makes i t p o s s i b le f o r t h e u s e r t o
i n t e r r u p t an o p e r a t i o n i n p ro gr es s , T h is i s
p a r t i c u l a r l y u s e fu l i f t h e u se r b eg i ns t o
p r i n t a l o n g t a b l e o r map and t h e n d e c id e s
t h a t h e d oe s n o t wa nt t o see i t . T h i s i s
done as f o l l ow s: F i r s t , ho l d down the
'BREAK' key on th e te rm in al f o r a moment.
T h is w i l l s t o p p r i n t i n g a nd c au se t h e E xec-8
syst e m t o p r i n t o u t a message: '*OUTPUT
INTERRUPT*'. A t t h i s p o i n t t h e us e r sh ou ld
t y p e i n ' @@ XC' f o l l o we d b y a ca r r i a g e r e -
t u r n . T h is w i l l g en e ra te a n i n t e r r u p t w h ic h
w i l l cause t he V IEWIT sys tem t o s top execu-
t i o n o f t he command i n p rogress and ask t he
us er t o subm it a new command. (Seve ral l ines
o f t h e map o r t a b l e b e i n g p r i n t e d may ap pe ar
b e f o r e t h e i n t e r r u p t t a ke s e f f e c t . )
The Exec-8 ru le s f o r t he au tomat i c
assignment o f f i l e s a r e d i f f e r e n t f o r demand
and batc h. Theref ore, th e demand us er shoul d
e x p l i c i t l y a s s i gn t h e t wo f i l e s needed t o
opera te V I EWI T. The recommended c o n t r o l ca rd
sequence t o use i s :
@ASG,A PSWW IEW IT.
@ASG,A PSW*LOG.
@FREE PSWLOG.
@XQT PSWV IEW IT.
(E i t he r '@ASG1 statement may r e s u l t i n
t h e message 'WAITING FOR FA CI LI TY '. I n t h i s
case t he demand user must wa i t u n t i l t he
Exec-8 sys tem makes t he f i l e a v a i la b l e . Th is
w i 1 1 norma l1y t ake on ly a few minutes. )

8/8/2019 VIEWIT: computation of seen areas, slope, and aspect for land-use planning
http://slidepdf.com/reader/full/viewit-computation-of-seen-areas-slope-and-aspect-for-land-use-planning 49/67

8/8/2019 VIEWIT: computation of seen areas, slope, and aspect for land-use planning
http://slidepdf.com/reader/full/viewit-computation-of-seen-areas-slope-and-aspect-for-land-use-planning 50/67
USER REQuESTi GM A P

8/8/2019 VIEWIT: computation of seen areas, slope, and aspect for land-use planning
http://slidepdf.com/reader/full/viewit-computation-of-seen-areas-slope-and-aspect-for-land-use-planning 51/67
USER REQuEST i COWMEN a
A N D R E L A T I V E A S P E C T
USER REQUEST! RASPEC Ã 1 8 0
A S P E C T C L A S S E S C A L C U L A T E D R E L A T I V E TO TH E U S E R - S P E C I F I E D D I R E C T I O N O F 1 8 0 . 0 D E GR E ES
USER REQUEST: TA BL E
T A B L E O F A S fr E CT S R E L A T I V E TO U S E R - S P E C I F I E D D I R E C T I O NTHERE ARE 8 C L A S SE S , E A C H R E P R E S E N T I N G AN G LE S I N TWO 22.5D E GR E E B A N D S, O NE ON E A C H S I D E O F T HE S P E C I F I E D O I R E C T I O N :
1 t - 0 , TO 22 .5 DEG. RE LA T I VE TO THE GI VE N ANGLE2 t - 2 2 . 5 T O 4 5 DE G
3 +-US TO 67.5 OEG4 t - 6 7 . 5 T O 9 0 , D E G5 +-SO. TO 11 2.5 OEG
6 t - 1 1 2 . 5 T O 1 3 5 , DE G7 t - 1 3 5 . T O 1 5 7 . 5 D EG
8 t - 1 5 7 . 5 TO 1 8 0 . D E G
ZERO NO ASPECT (F LA T)
USER REQUEST: MAP
M AP OF C E L L A S PE C T R E L A T I V E TO A U S E R - S P E C I F I E D D I R E C T I O N .THERE ARE 8 CLASSES, EA CH REPRES ENTING ANGLES I N TWO 22 .5D E GR E E B AN D S , O NE O N E A C H S I D E . O F T HE S P E C I F I E D D I R E C T I O N !
1 t - 0 , T O 2 2 . 5 DE G. R E L A T I V E TO T H E G I V E N A N GL E2 t - 2 2 . 5 TO 4 5 D EG3 t - 4 5 T O 6 7 . 5 D EG4 t - 67 . 5 TO 90 , DEG
5 t - 9 0 . T O 1 1 2 . 5 D E G6 +-112 .5 T O 1 3 5 . D E G
7 t - 1 3 5 . T O 1 5 7 . 5 D EG8 t - 1 5 7 . 5 T O 1 8 0 . 06 .GB L 4 N K NO A S P E C T ( F L A T )
( I F THE' G I V E N AN GL E I S TH E S UN D I R E CT I O N , T H I S I S
A N A P P R O X I M A T E S U N - I L L U M I N A T I O N H AP ,)

8/8/2019 VIEWIT: computation of seen areas, slope, and aspect for land-use planning
http://slidepdf.com/reader/full/viewit-computation-of-seen-areas-slope-and-aspect-for-land-use-planning 52/67

8/8/2019 VIEWIT: computation of seen areas, slope, and aspect for land-use planning
http://slidepdf.com/reader/full/viewit-computation-of-seen-areas-slope-and-aspect-for-land-use-planning 53/67

8/8/2019 VIEWIT: computation of seen areas, slope, and aspect for land-use planning
http://slidepdf.com/reader/full/viewit-computation-of-seen-areas-slope-and-aspect-for-land-use-planning 54/67
a= I N P U T C A R D 1 C O M M EN T n l CH E C K C E L L S W H IC H D I F F E R F RO M T H E AV ER AG E O f T H E I R N E I G h B U U S 8V PORE T H
USER REQ[ jEST l COMMENCHECK CELL S WHI CH D I F FE R FROM THE AVERAGE OF THEI R NEI GHBO RS B Y MORE THAN 1 5 0 F E E T *
USER REQuESTI MT IT LE m
DATA CHECK MAPM AP T I T L E 1 8 1 DA T A CH EC K
MAP
U S E R R E Q u E s T l D C H E C K = 1 5 0
D A T A C H EC K e O M P L ET E 0 , O F 1 8 7 2 C E L L S , 2 5 D I F F E R F RO M T H E A V E R A GE OF T H t I e N E I G P B U H S
USER REQUEST# MAP
DATA CHECK LASS MAP,B L A N K C E L L S P A S S T H E T E S T,1 MEANS CEL LS D I F FE R FROM THE AVERAGE OF THE I R NEI GHBORSB Y AN A MO UN T B E TW E EN TH E S P E C I F I k D T O L E R A f vC t A N 0 T W I C ETHE TOLERANCE*
2 M E AN S T H E D I F F E R E N C E I S 2 * T O L k R A N C E T O 3 * T O LE R A N CE , E T C *

8/8/2019 VIEWIT: computation of seen areas, slope, and aspect for land-use planning
http://slidepdf.com/reader/full/viewit-computation-of-seen-areas-slope-and-aspect-for-land-use-planning 55/67

8/8/2019 VIEWIT: computation of seen areas, slope, and aspect for land-use planning
http://slidepdf.com/reader/full/viewit-computation-of-seen-areas-slope-and-aspect-for-land-use-planning 56/67
U SE R R E Q ~ I E S T I T A B L E
DATA CHECK CLA SS TAB LE*0 MEANS CELLS PASS THE TEST*1 MEAN$ CELLS DI FF ER FROM THE AVERAGE OF TH EIR N EIGt iBORSBY AN AMOUNT BETWEEN THE SPECIFIED TOLERANCE AN0 TwICFTHE TOLERANCE.2 M EAN S TH E D I F FE R E NC E I S Z ! * T O L t R A h C t TO ~ * T O L E R A N C ~ , T C *
cl,A$s CE LLS AREA # SQUARE M l L t S A C R E S q t C T A R t Sa : : = ~ = ~ = x : a : : a = ~ = : = z = x ~ : = ~ ~ : : = ~ : = = ~ : = ~ = : = = = = = = ~ = ~ = : ~ = = = = = = = ~ = = = : = = ~ = = = = = = = = = = = = = ~ : = = ~ ~ ~ =
0 1 8 4 7 8 . 8 3 5 b 5 3 a 5 0 1 3 9 7 U S0 51 1 5 * 0 7 U 5 * 9 1 1 1 3 . U 5
2 2 m 0 1 6.12 1 5 , 1 33 5 a 0 2 1 5 * 3 0 37 . t32
5 1 * O o 3 .0 b 7.56
b 1. . . . . . . . . . . . . . . . . . . . . . . . . . . . .
0 0 0 3 * Ob J.56
27 ---- ------------ wo o 3.06 - - - - - - - - - - .56===a===:====z=*===s==x===s======- - - - * - - - - - - - - - - - -= - - - - - - - - - - - - - - - - - - - - - - - - - - - - -= - - - - - - - - - -
=a I N P U T CA RD : C O M M E N T = ~ N O T IC E T H A T T HER E I S ONE t S P E C I A L L Y B AD C k L L AT ( 1 7 ~ 3 4 ) ' 1
USER REQIJEST: C OM MN =N O T I C E T H A T T H ER E I S ON E E S P E C I A L L Y B AO C E L L AT ( 1 7 , 3 6 1
I N P U T C A R D # C O M M E N T a f I T S N E IG H B OR S A P P tA R I N ER RO R AL SO B k C A US E T H I S ONE CkL L AL TEUS T hE A V k
Z= INP UT CAe Ot RAGE FOR THOSE CE L L S * ' ,
USER REQUEST: CONMEN x
I T S N E I G H B O e S A P PE AR I N ERROR AL SO B~ C A U S E HIS ONE CEL L AL TER 3 THE AVERAGE F O d TWOSâ CkLLS.
USER REQUEST# COMMEN @
P R I N T T H E A e T U A L E L E V A T I O N DA T AUSER REQUEST: MESSAG =
E L E V A T I O N M A P

8/8/2019 VIEWIT: computation of seen areas, slope, and aspect for land-use planning
http://slidepdf.com/reader/full/viewit-computation-of-seen-areas-slope-and-aspect-for-land-use-planning 57/67
n&
8
u
Iu
Ã
aa
Ã
Ã
Ã
4k1
IDÃ
a
a
nm
8
Ã
nuB
II
M
Ã
Ill
u
8
M
0
ua
0
Iau
Ã
aÂtÂ
aw#8
Ã
OOOSI x
00601 t008B 1 Ã
OOL171 t
0 0 9 0 1 toos171 Ã
OOt7171OOC01 a00217T +001171 4
O O O f r l Ã
0 0 6 I l *0 0 9 I 1 i
OOLCI Ã
009E1 1
OOStI *OOhSI Ã
OOtf I m
0 0 2 s I *OOIf I A
OOOtI t
00621 8
00921 Â00L?t B
00921 Ã
OOSZI 1
0017?l H
OOf21 HI
OOZZT aOOl?l w
00021 ?00611 i
o o e ~ M
OOLII a0091 1 ÃOOSI I 1
001711 c
OOII I 9
OOZ11 m
OOtI I V
00011 000601 b
00901 t
OOLOI t
00901 9OOSOI t
001701 Â
OOtOl ?00201 fOOlOI Ã
0 0 0 0 1 x0 0 6 6 i
0 0 8 6 t
OOL6 I
0 0 9 6 $0 0 5 6 <OOt76 >OOtb -0 0 2 6 4
0 0 1 6 (
0 0 0 6 I
0 0 6 9 10 0 8 9 t
0 0 1 9 1
0 0 9 9 2OOS6 A
OOB9 X
OOE8 M
0 0 2 9 A
0 0 1 9 n0008 1
OObf s
OOVi MOOLL B0 0 9 f d
0 0 5 1 0
0 0 9 1 N
OOtL w002f 1
OOIL n
OOOL r0 0 6 9 10099 H0 0 1 9 9
0009 40059 3
00179 0
OOi9 3
OOZQ 9
0 0 1 9 V
0 0 0 9 00 0 6 s 6
0 0 9 5 9OOLS L
0 0 9 5 9ooss 5
OOPS 17
OOIS I
0 0 2 s 20 0 1 s I
0 0 0 s00617009BOOf0
00917o o s 0000170 0 t h00?0001B
000170 0 6 s0 0 9 sO O L I
0 0 9 Ioost0017sO O I I
OOZI0 0 1 I0 0 0 s0 0 6 2
0 0 9 2o o i ?0 0 9 2o o s 2OOBZOOIZ0 0 2 2
001Z0 0 0 20 0 6 10 0 9 1OOLI
0 0 9 1OOSI00171oon00210011
0 0 0 100 6
00 9O O L
00 90 0 sOO i 7
O O I
OO?0 0 1

8/8/2019 VIEWIT: computation of seen areas, slope, and aspect for land-use planning
http://slidepdf.com/reader/full/viewit-computation-of-seen-areas-slope-and-aspect-for-land-use-planning 58/67
B I I I I I I e I m I I I  ¥  ¥ Â¥  111 III I I I I I I # I I I I I 1 1 1 1 B I D  I in I I @ @ I 8 8 I I I a @ @ II I I II I I I I I IIIII #  ¥  IIIIi 1 1 # 1 8 I I I I Ill 80 8 I I

8/8/2019 VIEWIT: computation of seen areas, slope, and aspect for land-use planning
http://slidepdf.com/reader/full/viewit-computation-of-seen-areas-slope-and-aspect-for-land-use-planning 59/67
ex INP UT CA f tD l XOBSç22 YOBS=l8 ,COMMENTafTH IS I S AN ALTERNATIV E WAY TO SET OBSERVER PU ST IO Nf t
USER REQUEST! XOBS 8 2 2XOBS SET TO 2 2
USER REQUEST! YDBS Ã 1 8Y O0 8 S ET 1 0 1 8
USER REQUEST! COMMEN Ã
TH IS 1 3 AN ALT ERN ATI VE WAY TO SET OBSERVER POSTION
x* IN PU T CAftD: COMMENTÇ~DEMONSTRAT WEIGHTED VIEW O P T I O N S ~ , M T I T L E à ˆ ~ W E I G H T E D S M A P ~
USE R REQU EST! COWMEN 8
DEMONSTRATE WEIOHTED VIEW OPTIONSUSER REQuEST! M TI TL E *WEIGHTED MAP
MAP T IT L E I$ : WEIGHTEDMAP
3 3 IN PU T CARD: AWDN, VIEW, MAP, TABLE, AHOFF, COM MENTaIOEFIN E DIST ANC E WEIG HTIN G FUN CTI ONI ,
USER REQUEST# AWONV I S I B I L I T Y AN AL YS IS W IL L BE W EIG H TED BY T HE ASPEC T O F EAC H C EL L R EL A T IVE TO T HE O BSERVER .
USER REQtjEST! VIEW
V I S I B I L I T Y A N A L Y SI S W IL L BE PERF OR MED W IT H TH E F OL L O W IN G PARAMET ERS!: S Z X e Z 3 8 3 3 3 ~ 3 ~ 3 S S Z 3 3 3 3 f 3 S 3 Z : 3 3 S Z Z S E 3 f 3 3 8 ~ 3 S 3 3 : 8 3 3 3 8 3 Z 3 Z 3 Ã ‡ S 3 ~ 3 S 3 X ~ 3 3
x 0 6 s 22Y ons 1AR A D ~ U S 1 . 5 0 0 ( M I L E S )
2 .4 1 4 ( K IL O MET ER S)D EL IA X 2 0DELTA Y .17SCALE 24000.00
Z ANBLE -90.002 6 1 ~ 8 0SECTORS 0
V I S I B I L I T Y W I L L BE WEIGH T ED BY ASPECT R EL AT IV E TO T HE O BSER VER,
AN AL YSIS C O MPL ET E.T H IS O BSER VER C AN SEE 1 8 4 C EL L S ( ,88 SQUARE MILE S,
56 3 . 21 ACRES, 1391 . 71 HECTARES.)
USER REQuESTt MAP
MAP OF T IM E$ SEEN WEIG HTED BY ASPECT REL ATI VE TO THE OBSERVERFOR 1 oBSERVER(S1,
EAC H C EL L I $ GIVEN A SCORE OF 0 TO 1 0 FOR EACH OBSERVER,THESE ARE CUMULATED OVER OBSERVER POINTS.
FOR DI SP LA Y TH I S SUM I S DIVIDED BY THE NUMBER OF OBSERVERSSO THAT THE MAP D I S P L A Y S A NUMBER FROM 0 TO 1 0 FOR EACH CELLWHICH I S AN AVERAGE WEIGHTED VI EU OVER ALL OBSERVERS,

8/8/2019 VIEWIT: computation of seen areas, slope, and aspect for land-use planning
http://slidepdf.com/reader/full/viewit-computation-of-seen-areas-slope-and-aspect-for-land-use-planning 60/67
I I I I I I f l Ill I Â ¥ Â I IM IIIN @ I 8 8I m a I I I 8 I I I I
I ¥ @ Â I I I@ -18 I 1111 I I
I 8 @I I I I I I I I m I I I IrIi 111 111 I I I IIIII r i a
0 I @ Â ¥ 1 11 8
I # @I I.. I 1 .I l l I

8/8/2019 VIEWIT: computation of seen areas, slope, and aspect for land-use planning
http://slidepdf.com/reader/full/viewit-computation-of-seen-areas-slope-and-aspect-for-land-use-planning 61/67
USER REQuEST ! TABLE
T A B L E O F T I M E S S E E N W EI G H T E D BY A S P E C T R E L A T I V E TO T H E O B S ER V E R
FOR 1 f )BSERV ER(S) .
IN PU T CARD! NO DWTP, T PO IN T= (0. 5, I . ) , TPOI NT= ( l , O, 0.51, CLEAR, 0 W O N , v I k w , MAP , TABLE,
USE R REQIIESTI NODWTP
NO DISTANCE 'WEIGHT FUNCT ION TURNING POINTS. FUNCTION WEIGHT WILL BE 1.0 F OR A L L O I S T A ~ C E S .
USER REQuEST ! TPO INT a ( 5 0 , 1 . 0 0 1DISTANCE WEIGHT FUNCTION TURNING POINT I S A T DISTANCE = . 50. AND HAS A- w t 1 6 H T C k
USER REQUEST! TP OI NT a ( 1 , o o t 5 0 1DI ST AN CE WEIGHT FUNC TION TURNING PO IN T 2 I S A T D I S T AN C E = 1.00 AN0 HAS A *tlLHT CF-
USER REQUEST! CLEAR
C OU NT F I E L D C L E A R E D F O R C E L L S I N T HE C UR RE NT S U BR E CT A NG L E
USE S REQUEST ! DWONV I S I B I L I T Y A N A L Y S I S W I L L R E WE I G HE D BY T HE D I S T A N C E O F E A C H C E L L FR OM TH E O B SE R VE RACCORDING TO THE CURRENT D ISTANCE WEIGHT ING FUNCTION,
USES REQUEST! V IEW
V I S I B I L I T Y A N A L Y SI S W I LL BE P ERF ORM ED W I T H T HE F O L L O K IN G P A R A H E T ~ R S ~. . . . . . . . . . . . . . . . . . . . . . . . . . . . . . . . . . . . . . . . . . . . . . . . . . . . . . . . . . . . . . . . . . . .
x 0 8 s 2 2
Y ORS 1 6RADIUS 1.5 00 (M IL ES 1
2 . 4 1 U ( K I L O M E T E R S )D E L t A X 1 2 0
D E L T A Y 1 7S C A L E 2 4 0 0 0 . 0 0
X M I N 1X M Ax 3 6
Y M I N 1YMA y 5 2ZANRLE -90 .00
Z 0 I A S 0S t C T O R S 0
V I 8 I B I L I T Y W I L L BE WEIGHTED BY DISTANCE FROM THE OBSERVER.
A N A L Y S I S C O M P L E T E ,T H I S O B S ER V ER C A N S E E 1 8 4 C E L L S ( . 88 SQUARE MILE S,
56 1 . 21 ACRES, 13 91 . 71 HECTARES.)
USER REQUEST! MA P

8/8/2019 VIEWIT: computation of seen areas, slope, and aspect for land-use planning
http://slidepdf.com/reader/full/viewit-computation-of-seen-areas-slope-and-aspect-for-land-use-planning 62/67
o w o m^ a a e a a CO -^ m ............. . - . - - . - . . - - -4- m m m m <X) -0 -
u * m u m m m * * * . . - . . - . . * -m ul m u m m m - - t * - u e m m m a w m m IT .............. ul IT u m m u u 1 l ~ 7 m u m u m m mu- m ...............
m w m I T m IT < J ' w k / ' u l t / i u ' u u l t / i m u ' l J 7 u a I T m w - . . . . - - . - . - . - . . - ..m u t / i m m u m m u l w m u ul ul u m ~ u ~ ~ . . . . - - - . . - . - - . . . -

8/8/2019 VIEWIT: computation of seen areas, slope, and aspect for land-use planning
http://slidepdf.com/reader/full/viewit-computation-of-seen-areas-slope-and-aspect-for-land-use-planning 63/67
=a I N P U T C AR D! C L E A R , C O M M E N T ~ ~ N O W B O T H W E I G H T I N G M E T H O OS l l A W ON,VIEWIMAPIA w OFF, D w O F F 1
USER REQUEST! CLEAR
C O UN T F I E L D C L E A R E D F O R C E L L S I N T HE C U R RE N T S UB R E CT A NG L E
USER REQuE ST! COMMEN a
NOW BOTH WEIGHTING METHODS
USER REQUEST: AWONV I S I B I L I T Y A N A L Y S I S W I L L B E W E IG H TE D BY T HE A S P EC T OF E AC H C t L L R E L A T I V E TO T HE O BS ER VE R,
USER REQUEST! V IEW
V I S I B I L I T Y A N A L Y S I S W I L L B E P ER FO RM ED W I T H TH E F O L LO W I NG PA RA M ET ER S!
: : Z X X Z ~ X X ~ X ~ ~ ~ S Z Z Z Z : Z Z ~ Z X X Z Z = : : X S ~ Z E X E : : E ~ Z S : Z X X X X X B S Z X X X S X X X S C : Z : ~ ~
X ORS 2 2
Y ORS 1 8
RADIUS 1 .500 (M IL ES )
2 . ~ 1 1 ( K IL OM E TE RS )
D E L t A X 2 0D E L I A Y . 1 7SCALE 24000,00
X M I N 1XMAf 3 6Y M I N 1
Y MA x 5 2Z A N G L E - 9 0 ,0 0Z B l i S 0
SECTORS 0
V I S I B I L I T Y WILL B E W E IG H T E D B Y A S P EC T R E L A T I V E T O THE OBSERVER,
V I S I B I L I T Y W I L L B E W E IG HT ED B Y D I S T A NC E F RO M T HE O BS ERV ER ,
A N A L Y S I S C O M P L E T E ,T H I S O B S ER V ER C A N S E E 1 6 4 C E L L S ( a86 S Q U A R E M I L E S #
5 6 3 . 2 1 A C RE S , 1 3 9 1 . 7 1 H EC TA RE S. )
USER REQuE ST! MAP
MAP OF T I ME S SEEN WIEGHTED BY D IS TAN CE FROM THE OBSERVER
AND BY ASPEeT R EL AT IV E TO THE OBSERVER FOR 1 OBSERVER(S1 ,
E A C H C E L L I s GI VE N A SCORE OF 0 TO 1 0 FOR EACH OBSERVER.THESE ARE CUMULATED OVER OBSERVER POINTS,FOR D I SP LA Y TH I S SUM I S DIVIDED BY THE NUMBER OF OBSERVERSSO T H AT T H E H A P D I S P L A Y S A NUMBER FROM 0 TO 1 0 FOR EACH CE LL
WHICH I S AN AVERAGE WEIGHTED VIEW OVER ALL OBSERVERS,
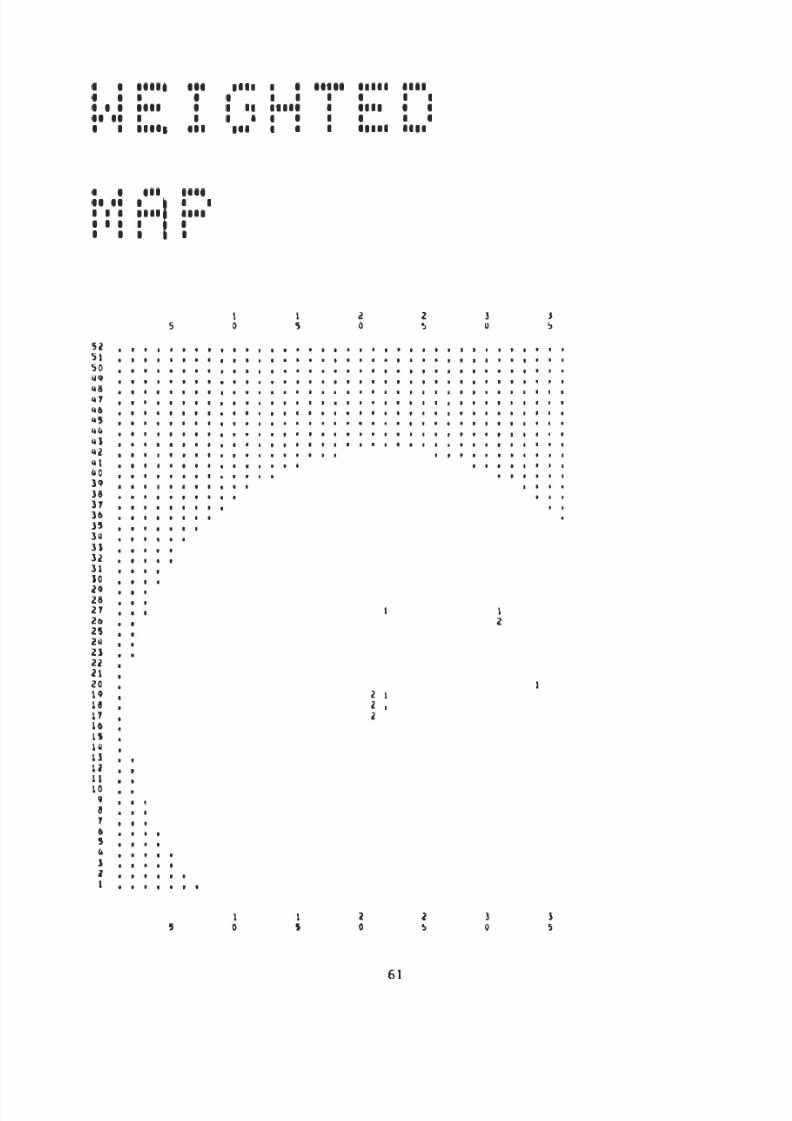
8/8/2019 VIEWIT: computation of seen areas, slope, and aspect for land-use planning
http://slidepdf.com/reader/full/viewit-computation-of-seen-areas-slope-and-aspect-for-land-use-planning 64/67
N N N .-

8/8/2019 VIEWIT: computation of seen areas, slope, and aspect for land-use planning
http://slidepdf.com/reader/full/viewit-computation-of-seen-areas-slope-and-aspect-for-land-use-planning 65/67
USER REQ ( lE .ST t AwOFFW E I G H T I N G BY ASPECT RE LA T I VE TO THE OBSERVER I S TURNED OFF,
USER RfcQtiEST) DWOFFDIS TAN CE WEIGHTING I S TURNED OFF,
== INP UT CARD: COMb 'ENTs 'DEF INE SOME SLOPE CLASSES, ' ,
U S E S R E Qt j t S T t C OW M E N a
DEFINE SOME SLOPE. CLASSES,
== I N P U T C A RD : C L A S S ( l ) = ( O , , Z 5 . ) , C L A S S ( ~ ) = ( 2 5 ~ , 5 0 ~ ) , C L A S S ( 3 ) ~ ( 5 0 ~ 1 0 0 0 , 1 , C L A S S s 3 ,
U SE R R E Q ~ I E S T ~C L A S S ( 1 ) = ( 0 0 . 2 5 .0 0 )C L A S S ( 1 ) W I L L BE FROM 0 0 TO 2 5. 00
USER REQUEST) CLASS ( 2) = ( 2 5 . 0 0 , 5 0 . 0 0 )
C L A S S ( 2 ) W I L L 8E FROM 25 .00 TO 50 .00U S E R R E U u k S T t C L A S S ( 3 ) = ( S0.00, 1000,OO)
C L A S S ( 3 ) W I L L BE FROM 50 .00 TO 100 0 .0 0USER REQt jEST t NCLASS = 3
NCLA SS SET TO 3
INP UT CAR01 COMMENTsIFOR SLOPE, CLASSES ARE TAKEN AS SLOPES I N PERCENT! ,
USER REQUEST) COMMEN =
FOR SLOPE, CL AS SE S ARE TAKEN AS SLOPES I N PERCENT
USER REQUEST! MT IT LE s
USER SLOPE MAPMAP T I T L E I $ l U S t R SLO PE
MAP
== INP UT CARD: U SLOPE, TABLE , MAP,
U S E R R E Qu E S T i U S L OP E
SLOPE CALCULATED BY U S E R - S P E C I F I E D C L A S S E S
USER REQUEST) TABLE
-----
T A B L E OF S L O P E B Y U S E R - D E F I N E D C L A S S E S .
CLASS LOWER
----.---.--I M I T UPPER
------.---.I M I T
1 0 0 2 5 . 0 02 25 .00 50 .003 5 0 . 0 0 1 0 0 0 . 0 0
-----------L A A S C E L L S
- - -AREA) -SQUARE- = = s = ^ = s = a = B a ^ a s s * ^ a = - - - - - - - - s  ¥ - - - -  ¥ - * a - - * - e -  ¥ s - - -- --
M I L ES A CR ES i t C T A R t S! S S S Z I S = S S f S S = s s f S = S f = 2 E Z Z :
1 1 2 7 2 6 . 08 3 8 9 3 . 4 8 9 6 2 0 . 9 62 5 6 7 2 . 71 1 7 3 5 . 5 4 4 2 8 8 . 5 93 3 3 1 6 1 0 1. 01 2 V . 6 0
= ~ = = = = = = ~ = = ~ = = = = ~ ~ ~ ~ ~ = ~ s = s = ~ = = = = ~ : = ~ = s = ~ = = = = = = = s = ~ a z = ~ = = ~ ~ = : = = = = = : = : = ~ = = ~ = ~ = = ~ : = x = = = = =
USER REQUEST! MAP
M A P OF SLOPp B Y USER-SPECIFIED CLASSES,

8/8/2019 VIEWIT: computation of seen areas, slope, and aspect for land-use planning
http://slidepdf.com/reader/full/viewit-computation-of-seen-areas-slope-and-aspect-for-land-use-planning 66/67
Ir a i i III 1111 IIIII
I I # IIIIIi I 8 I In
@ I1111
I I I I 8 I I I I # @ I @ Â ¥ Â I@ @ 1 1 1 8 1

8/8/2019 VIEWIT: computation of seen areas, slope, and aspect for land-use planning
http://slidepdf.com/reader/full/viewit-computation-of-seen-areas-slope-and-aspect-for-land-use-planning 67/67
* a IN PU T CARD: COMMENTs'NOW C AL CU LA TE SLOPE BY THE MAXIMUM SLOPE METHOD', U X SLOPE,
USER REQuESTt COMMEN =
NOW CAL CUL ATE SLOPE BY THE MAX IMUM SLOPE METHOD
USER REQuEST: UXSLOP
MAXIMUM SLOPE CALCULATED BY USER-SPECIF IED CLASSES.
=* IN PU T CARD: TABLE, MAP,
U SER R EQ u EST i T ABL E
TAB LE OF MAXIMUM SLOPE 8Y USER-DEFINED CLASSES.
CLASS- - - - - L O V R L I M I T UPPER L I M I T* -w- - - - -m-w
1
-----.-----0 0 25 .00
2 2 5 ~ 0 0 5 0.003 5 0 . 0 0 1 0 0 0 . 0 0
USER REQUEST: MAP
MAP OF MA XIM UM SLOPE BY USER-S PECIF I ED CLASSES