tcsbusiness.weebly.comtcsbusiness.weebly.com/.../market_analysis_factsheet.docx · web...
TRANSCRIPT

Introduction to Market Analysis The challenge for any business is to gain a sufficiently detailed understanding of the fundamentals of a market. Without this insight, it is unlikely that marketing strategies will prove effective or that marketing objectives will be met.
Gaining this understanding is the task of market analysis.
By market fundamentals we mean understanding issues such as:
How big is the market? (for example, measured by sales value, volume sold etc.) How fast is the market growing and what is the market growth potential? The key social, economic, political/legal and technological factors that drive change in the market Who are the existing competitors and what market shares do they have? The extent of branding and customer loyalty in the market How the market is segmented to meet different customer needs Customer preferences in terms of when and where they buy, what prices they pay and which methods of
promotion are effective The potential for developing a competitive position in a market – either through a USP or through effective price
competition
The process of analysing the market should not be considered as a one-off. An effective marketing team is constantly
searching and updating their market knowledge.
However, detailed marketing analysis is particularly important for tasks such as:
Forecasting sales for new products or investments into new markets Gathering evidence to support a finance-raising exercise To support a new marketing strategy or significant changes to the marketing objectives To help make decisions in relation to significant organisational or operational change
There are several methods of analysing a market that are in common use. The following methods are covered in the
following sections:
Test marketing Trend analysis (extrapolation, moving averages and correlation)
Test marketing is an experiment conducted in a field laboratory (the test market) comprising of actual stores and real-life buying situations, without the buyers knowing they are participating in an evaluation exercise. It simulates the eventual market-mix to ascertain consumer reaction.

Moving Averages and Extrapolation These two methods make extensive use of sales and other data to make predictions about the future.
A moving average takes a data series and "smoothes" the fluctuations in data to show an average. The aim is to take
out the extremes of data from period to period. Moving averages are often calculated on a quarterly or weekly basis.
Extrapolation involves the use of trends established by historical data to make predictions about future values. The
basic assumption of extrapolation is that the pattern will continue into the future unless evidence suggests otherwise.
To understand these techniques further, look at the following chart that shows quarterly sales (£m) for a large business from Q1 Year'06 to Q4 (Year'10):The blue line shows the actual quarterly sales figure. As you can see the sales total varies quarter by quarter, although you might guess from looking at the data that the overall trend is for a steady increase in sales.
The red line shows the quarterly moving average. This is calculated by adding the latest four quarters of sales (e.g. Q1 +
Q2 + Q3 + Q4) and then dividing by four. This technique smoothes out the quarterly variations and gives a good
indication of the overall trend in quarterly sales.
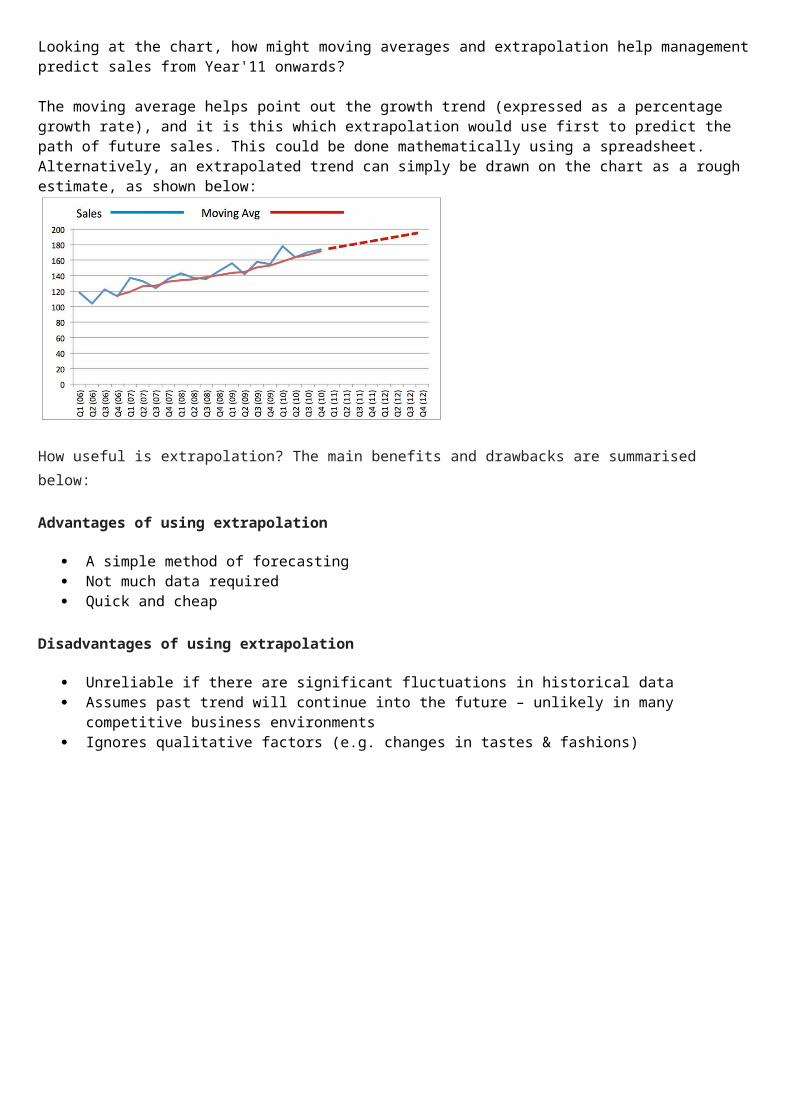
Looking at the chart, how might moving averages and extrapolation help management predict sales from Year'11 onwards?
The moving average helps point out the growth trend (expressed as a percentage growth rate), and it is this which extrapolation would use first to predict the path of future sales. This could be done mathematically using a spreadsheet. Alternatively, an extrapolated trend can simply be drawn on the chart as a rough estimate, as shown below:
How useful is extrapolation? The main benefits and drawbacks are summarised below:
Advantages of using extrapolation
A simple method of forecasting Not much data required Quick and cheap
Disadvantages of using extrapolation
Unreliable if there are significant fluctuations in historical data Assumes past trend will continue into the future – unlikely in many competitive business environments Ignores qualitative factors (e.g. changes in tastes & fashions)

CorrelationCorrelation is another method of sales forecasting. Correlation looks at the strength of a relationship between two variables.
For marketing, it might be useful to know that there is a predictable relationship between sales and factors such as advertising, weather, consumer income etc.
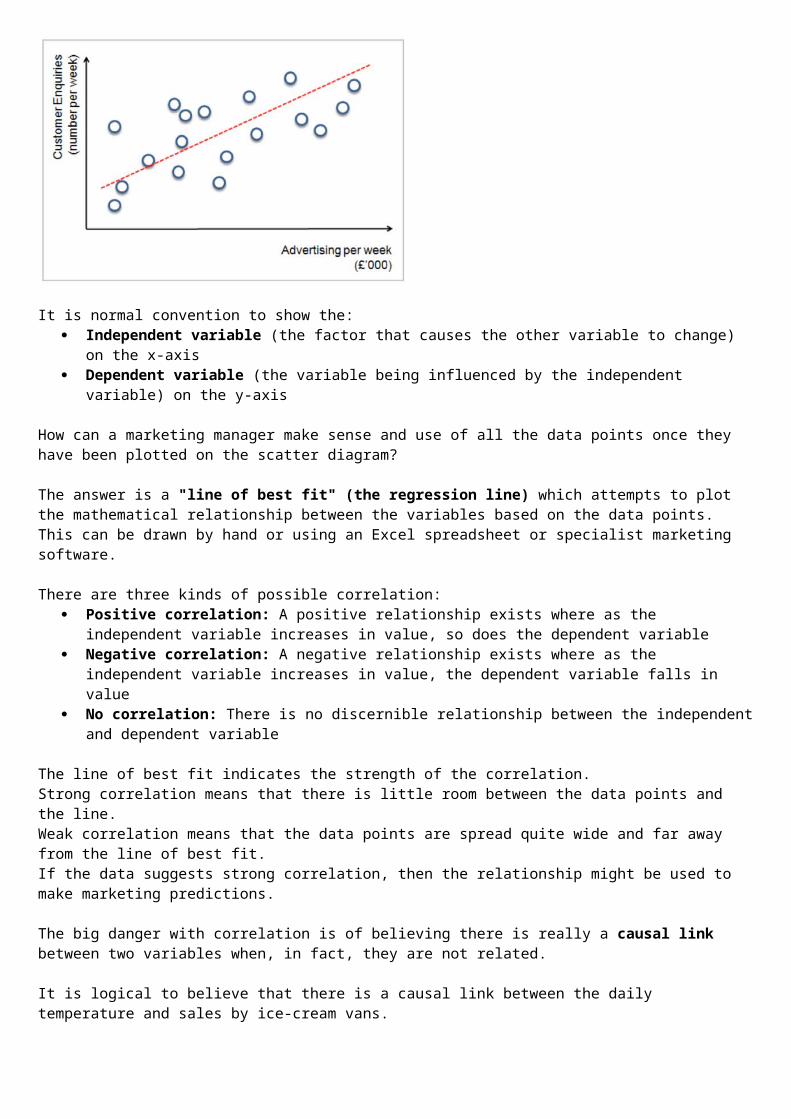
Correlation is usually measured by using a scatter diagram, on which data points are plotted. For example, a data point might measure the number of customer enquiries that are generated per week (x-axis) against the amount spent on advertising (y-axis). This is illustrated below:
It is normal convention to show the: Independent variable (the factor that causes the other variable to change) on the x-axis Dependent variable (the variable being influenced by the independent variable) on the y-axis
How can a marketing manager make sense and use of all the data points once they have been plotted on the scatter diagram?
The answer is a "line of best fit" (the regression line) which attempts to plot the mathematical relationship between the variables based on the data points. This can be drawn by hand or using an Excel spreadsheet or specialist marketing software.
There are three kinds of possible correlation: Positive correlation: A positive relationship exists where as the independent variable increases in value, so does
the dependent variable Negative correlation: A negative relationship exists where as the independent variable increases in value, the
dependent variable falls in value No correlation: There is no discernible relationship between the independent and dependent variable
The line of best fit indicates the strength of the correlation.Strong correlation means that there is little room between the data points and the line.Weak correlation means that the data points are spread quite wide and far away from the line of best fit.If the data suggests strong correlation, then the relationship might be used to make marketing predictions.
The big danger with correlation is of believing there is really a causal link between two variables when, in fact, they are not related.
It is logical to believe that there is a causal link between the daily temperature and sales by ice-cream vans.
However, is there a link between increasing childhood obesity and increasing disposal incomes for households? Both these variables have risen over the long-term, but they are probably not directly related.