sqlserverdashboards.docx · web viewguide for system center monitoring pack for microsoft sql...
TRANSCRIPT

Guide for System Center Monitoring Pack for Microsoft SQL Server DashboardsMicrosoft Corporation
Published: June 2015
Send feedback or suggestions about this document to [email protected]. Please include the monitoring pack guide name with your feedback.
The Operations Manager team encourages you to provide feedback on the monitoring pack by providing a review on the monitoring pack’s page in the Management Pack Catalog (http://go.microsoft.com/fwlink/?LinkID=82105).

CopyrightThis document is provided "as-is". Information and views expressed in this document, including URL and other Internet website references, may change without notice. You bear the risk of using it.
Some examples depicted herein are provided for illustration only and are fictitious. No real association or connection is intended or should be inferred.
This document does not provide you with any legal rights to any intellectual property in any Microsoft product. You may copy and use this document for your internal, reference purposes. You may modify this document for your internal, reference purposes.
© 2015 Microsoft Corporation. All rights reserved.
Microsoft, Active Directory, Windows, and Windows Server are trademarks of the Microsoft group of companies.
All other trademarks are property of their respective owners.

ContentsGuide for System Center Monitoring Pack for Microsoft SQL Server Dashboards.........................4
Guide History........................................................................................................................... 4Supported Configurations........................................................................................................4Files in this Monitoring Pack.....................................................................................................4
Introduction to the Microsoft SQL Server Dashboards Management Pack..................................4Datacenter View....................................................................................................................... 4Instance View........................................................................................................................... 7
Create and configure a Datacenter Dashboard.........................................................................10Create Datacenter Dashboard...............................................................................................10Adjusting Datacenter Dashboard...........................................................................................12Datacenter Dashboard Navigation.........................................................................................24
Known issues and Troubleshooting...........................................................................................26

Guide for System Center Monitoring Pack for Microsoft SQL Server DashboardsThis manager pack provides the end user with SQL Server Dashboards template.
Guide History
Release Date Changes
June 2015 Original release of this guide
Supported ConfigurationsThis monitoring pack is designed for the following versions of System Center Operations Manager:
System Center Operations Manager 2012 System Center Operations Manager 2012 SP1 System Center Operations Manager 2012 R2
A dedicated Operations Manager management group is not required for this monitoring pack.
Files in this Monitoring Pack Microsoft.SQLServer.Visualization.Library.mpb Microsoft.SQLServer.Generic.Dashboards.mp Microsoft.SQLServer.Generic.Presentation.mp
Introduction to the Microsoft SQL Server Dashboards Management PackMicrosoft SQL Server Dashboards Management Pack provides an ability to create and customize visualization on the fly. There are two views in the SQL Server Dashboards; Datacenter and Instance. The Datacenter view is an aggregated view. The Instance level provides detailed information about selected object.
Datacenter ViewThe Datacenter view is the home page of the dashboard which provides information about datacenter health state in the aggregated way. It is possible to drill down from the Datacenter
4

view to the Instance view to investigate the root cause of the issue. It is possibel to return to the home page from any Instance view by clicking on the Home part of the navigation pane.
Datacenter View TilesBy default all group tiles on the Datacenter view are collapsed. Tile consists of two parts, the left part displays the number of objects within a group in the worst state and total number of objects. The right part of the widget shows the number of alerts with the highest severity.
The expanded state shows the number of objects in other states in addition to the data which is displayed in collapsed mode.
By default when the Alerts widget is expanded it displays three Alert widgets; One for Critical, Warning and Info. The number of each alerts type are displayed in the widget.
5

The Aggregated state monitor tile gives the number of objects per state.
The Aggregated performance tile shows five columns and each represents the number of objects in the current range of data.
Use menu button of Datacenter View or a group to add a new tile.
It is possible to edit or remove the tile by selecting a corresponding menu item from the right-click context menu.
Background color, time interval, and refresh rate settings applied to the Datacenter View and all Instance Views and can be set from the Datacenter View menu only.
Note
Note
Note
6
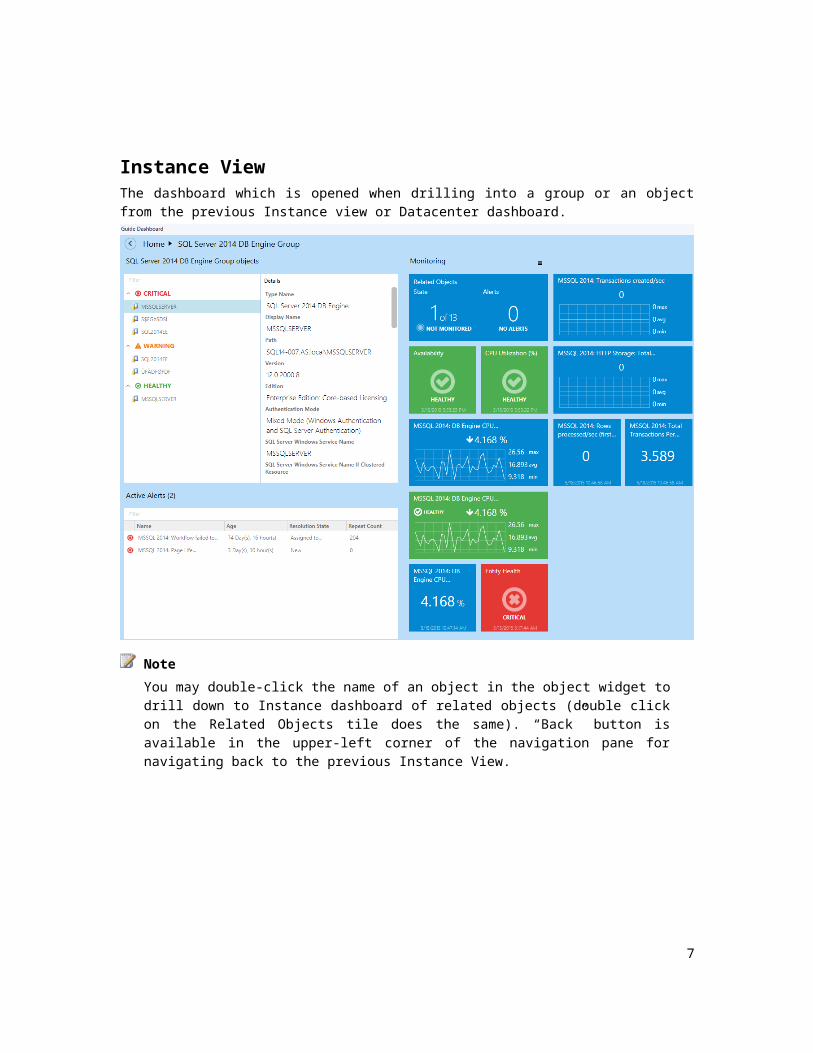
Instance ViewThe dashboard which is opened when drilling into a group or an object from the previous Instance view or Datacenter dashboard.
You may double-click the name of an object in the object widget to drill down to Instance dashboard of related objects (double click on the Related Objects tile does the same). “Back” button is available in the upper-left corner of the navigation pane for navigating back to the previous Instance View.
Note
7

Instance View TilesTiles display information about current state of monitors as well as the latest performance data. Depending on the current state and configuration, tiles will have different background colors and layout. Please refer to examples below for illustrations of tile capabilities.
Related objects tile displays the number objects that are either hosted on the selected entity or are linked by a containment. Double click on the tile opens Instance view for related objects.
The monitor is in a critical state.
The monitor is in a healthy state.
The monitor is disabled.
The monitor is in a critical state. This monitor has correlated performance data, the data for selected Time Range is being displayed.
8
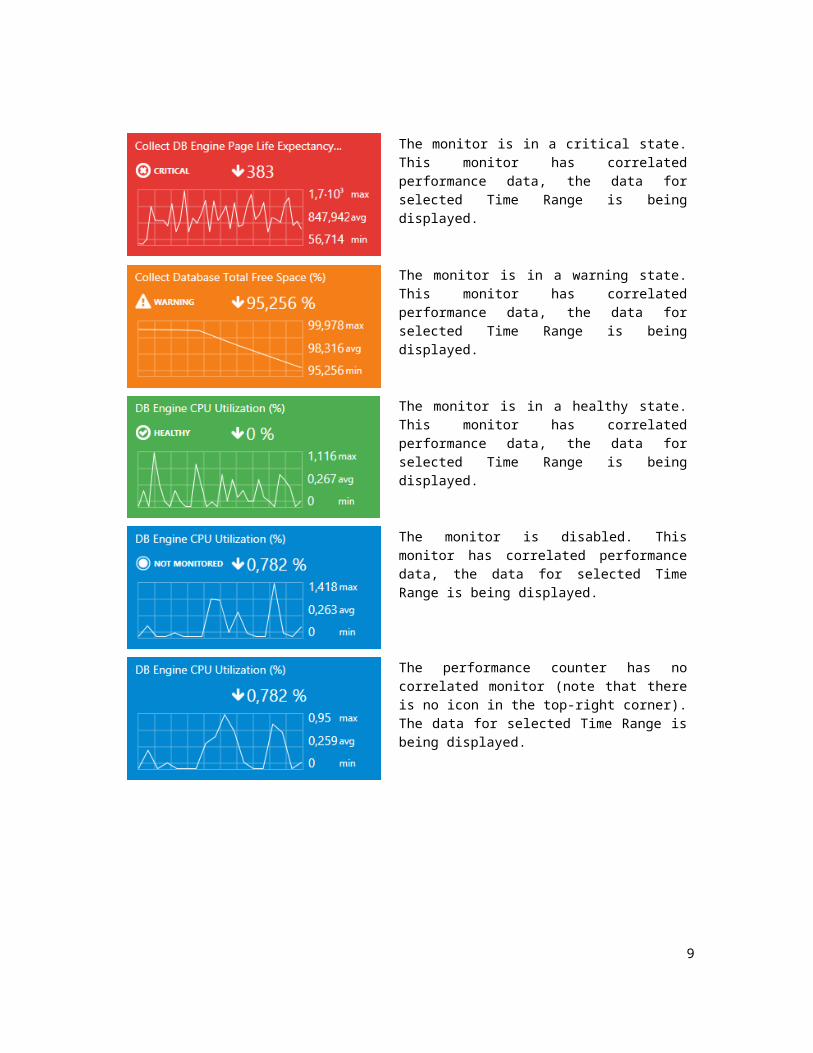
The monitor is in a warning state. This monitor has correlated performance data, the data for selected Time Range is being displayed.
The monitor is in a healthy state. This monitor has correlated performance data, the data for selected Time Range is being displayed.
The monitor is disabled. This monitor has correlated performance data, the data for selected Time Range is being displayed.
The performance counter has no correlated monitor (note that there is no icon in the top-right corner). The data for selected Time Range is being displayed.
It is possible to view the exact value of the performance metric by hovering the cursor over performance chart.
9

Create and configure a Datacenter Dashboard
Create Datacenter Dashboard
Create a custom management packIt is recommended to store Datacenter dashboards in a separate Management Pack to allow easy export and re-use of configured views. To create a new management pack navigate to the “Administration” tab, then click on the “Management Packs” item. Right click on “Management Packs” item, the click on “Create Management Pack”.
Create Datacenter Dashboard
Open “New Dashboard and Widget Wizard”Navigate to the “Monitoring” tab and select the folder for new Dashboard.
Right click -> New -> Dashboard View.
10

Select Dashboard’s templateOn the “New Dashboard and Widget Wizard” page select the “SQL Server Dashboards” template. Define a dashboard name and click Create.
Initial state of newly created Datacenter Dashboard
Datacenter Dashboard is empty by default. It is necessary to add a group.
11

Adjusting Datacenter DashboardTo set up a Datacenter dashboard, it is necessary to add Groups and widgets to each Group.
Personalization of Datacenter ViewClick on the menu button to add a Group, change Settings or refresh the dashboard.
Available settings are:
“Refresh Rate” – this setting defines how often dashboard refreshes data on a client. This setting does not change the actual collection frequency of metrics on a server.
“Time Interval” – this setting defines for which period to display data. The Performance widget on the “Instance” view depends on this setting.
“Background Color” – change background color for all views.
12

Add a GroupClick on the menu button and select “+ Add Group” item from the drop-down. It is also possible to search desired group in the “Add group” dialog by typing a name.
It is possible to create a custom group and populate it with a desired set of objects. Refer to the TechNet for guidance.
Select a Group, change the display name if required and click Add – a new tile will appear on the dashboard.
Note
13

By default, all panels (groups) are minimized (collapsed). To expand panel click on the arrow symbol in a front of a group’s name.
Rename/Remove GroupClick on menu button related to the group and select “Rename Group” or “Remove Group”
Note
14

Add aggregated tiles
Aggregated tiles are available only on the Datacenter view.
Add a monitor tileClick on menu button related to the group and select Monitor.
In the “Add Aggregated Monitor Tile” dialog select desired monitor.
Note
15

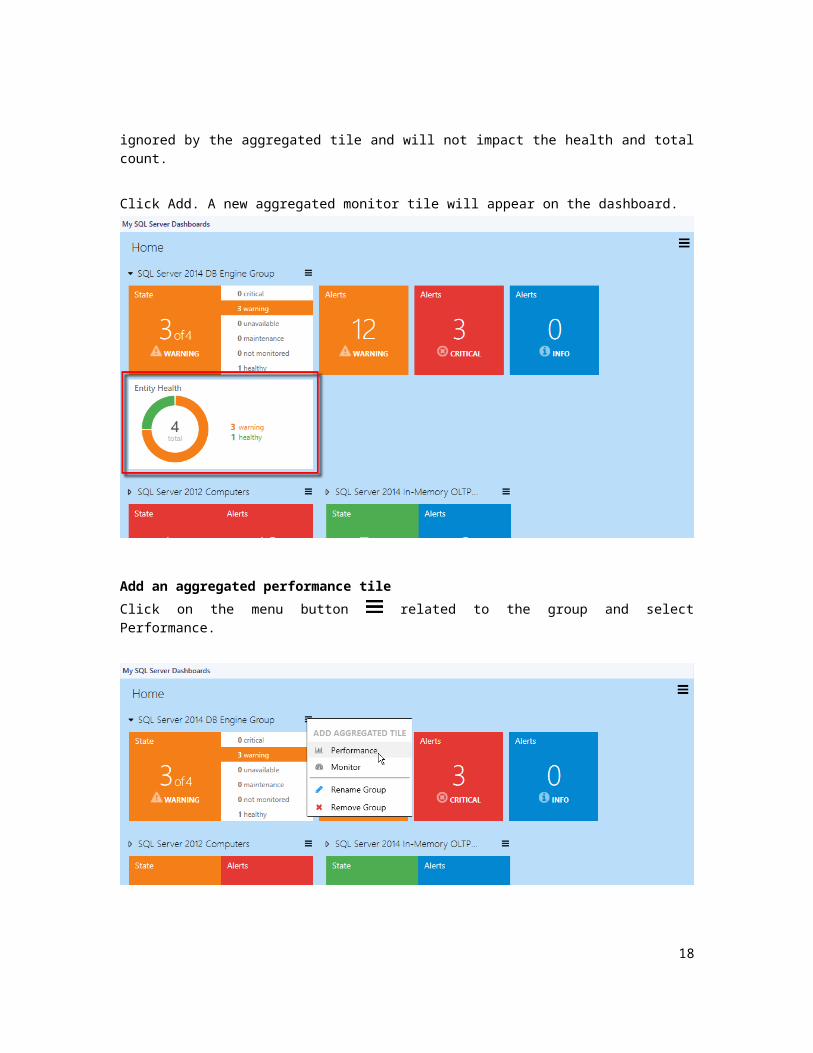
If target group contains several classes, it is necessary to populate similar monitors for each class. If a class does not have a similar monitor it is possible leave the monitor blank– this class will be ignored by the aggregated tile and will not impact the health and total count.
Click Add. A new aggregated monitor tile will appear on the dashboard.
Note
16

Add an aggregated performance tileClick on the menu button related to the group and select Performance.
In the “Add Aggregated Performance Tile” dialog select the desired performance counter.
17
If target group contains several classes, it is necessary to populate similar performance metric for each class. If some classes have not similar metric, it is possible to leave it blank, in such case, this class will be ignored by the aggregated tile.
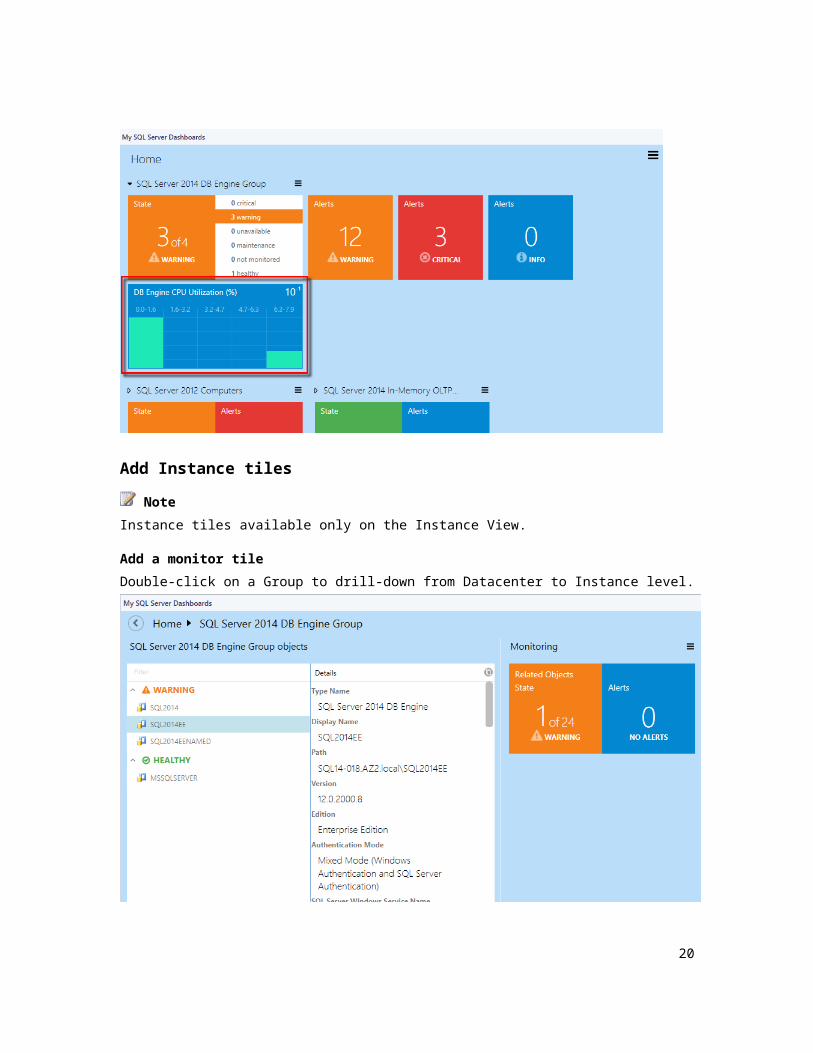
Click Add. A new aggregated performance tile will appear on the dashboard.
Note
18

Add Instance tiles
Instance tiles available only on the Instance View.
Add a monitor tileDouble-click on a Group to drill-down from Datacenter to Instance level.
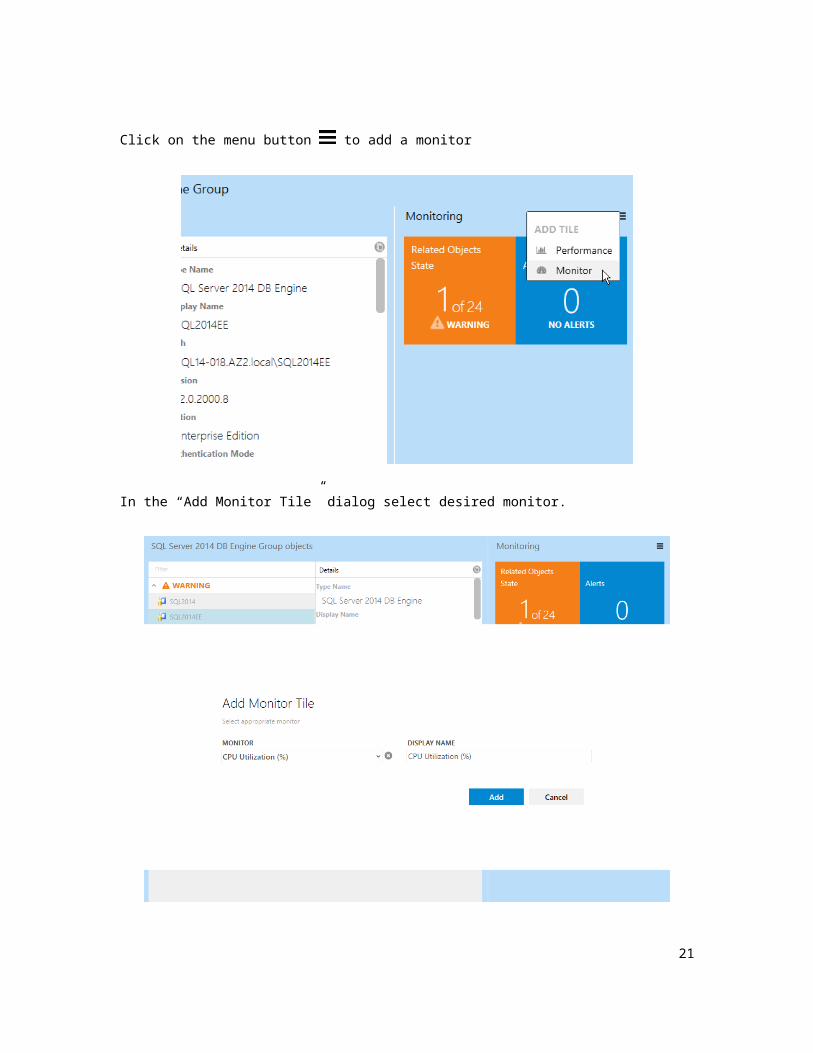
Click on the menu button to add a monitor
Note
19
In the “Add Monitor Tile” dialog select desired monitor.
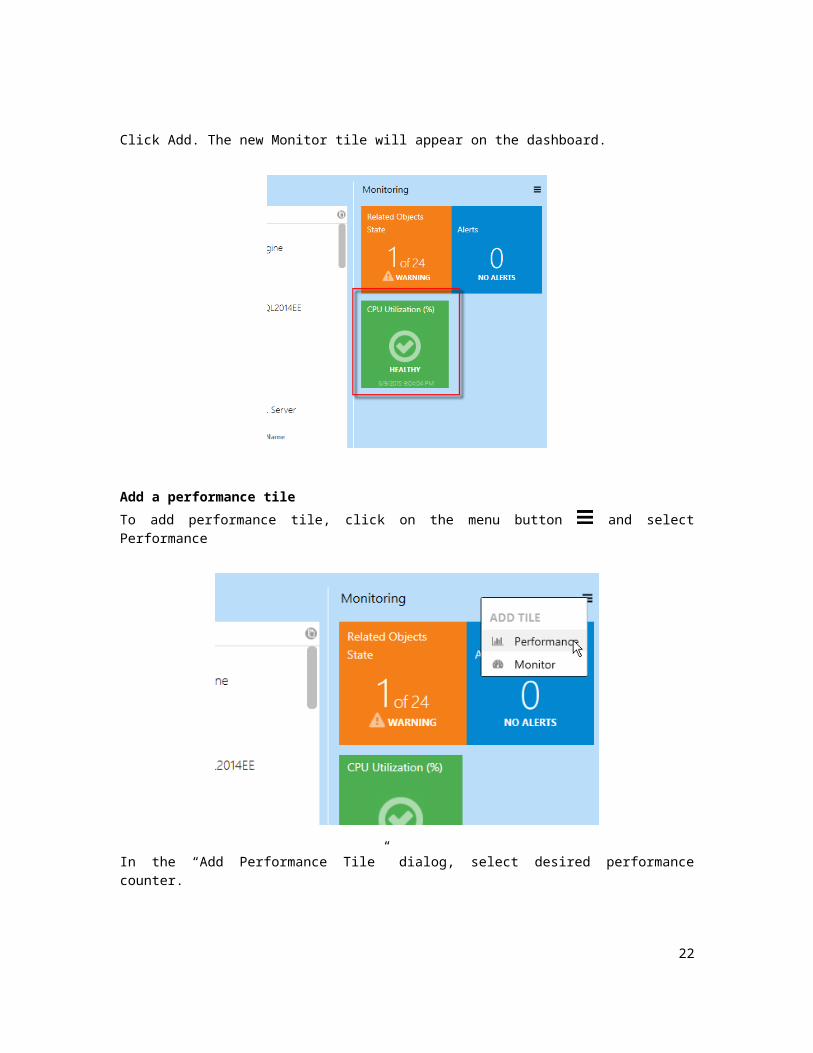
Click Add. The new Monitor tile will appear on the dashboard.
20
Add a performance tileTo add performance tile, click on the menu button and select Performance
In the “Add Performance Tile” dialog, select desired performance counter.
Click Add. The new performance tile will appear on the dashboard.
21
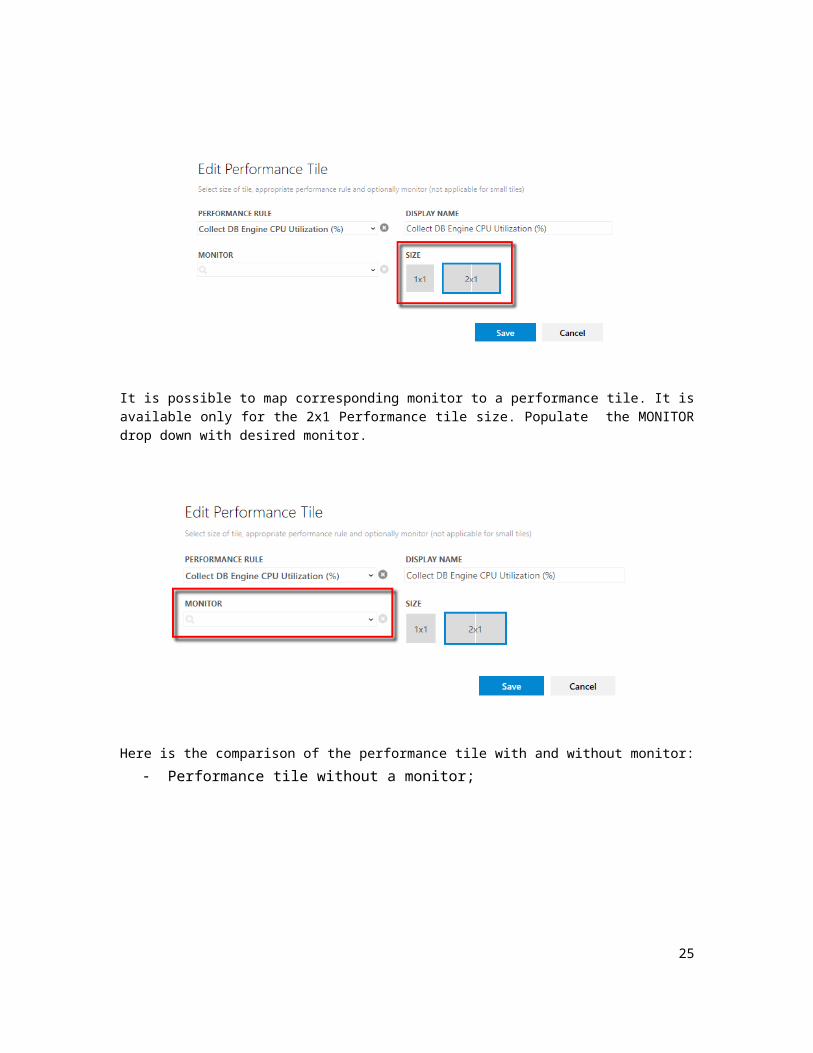
Performance tile advanced configurationTo show the Edit Performance Tile dialog, double click on performance tile and then choose Edit from the context menu.
The Edit Performance Tile dialog allows to configure the size of performance tile and allows to add a corresponding monitor.
Performance tile can be of two sizes:
1. 1x1 – shows only the last value.
2. 2x1 – shows collected performance data presented as a graph for the given range of time.
22

The type of the performance tile can be configured from the Edit Performance Tile dialog by the SIZE field.
It is possible to map corresponding monitor to a performance tile. It is available only for the 2x1 Performance tile size. Populate the MONITOR drop down with desired monitor.
23

Here is the comparison of the performance tile with and without monitor:
Performance tile without a monitor;
Performance tile with a monitor (Healthy state).
Edit/Remove tileIt is possible to edit or remove the tile by selecting a corresponding menu item from the right-click context menu.
24
Moving TilesTiles can be moved using drag-n-drop.Datacenter dashboards allow ways to move the tiles:
1. Moving groups on the Datacenter View.2. Moving aggregated tiles inside expanded group on the Datacenter View.3. Moving tiles on the Instance View.
Datacenter Dashboard Navigation
Drill-down to related objectsDrill-down can be done in two ways:
1. Select an object from the left pane and use double-click on “Related Objects State” widget.
2. Double click on object from the left pane
25

Navigation by breadcrumbsTo move to any place in the path just click on it. To move to the parent view click on the button
26

Known issues and TroubleshootingConfiguration of signed SQL Server Dashboards cannot be saved if Default Management Pack is removedIssue: Signed SQL Server Dashboards store their configuration changes in Default Management Pack (Microsoft.SystemCenter.OperationsManager.DefaultUser).
Resolution: Import Default Management pack. In further versions of the MP it will be possible set a custom MP for storing the configuration.
SQL Server Dashboards may display obsolete dataIssue: Operations Manager database should be synchronized with Data warehouse. If the default procedure of the synchronizing has not been executed for a long period of time the dashboards become unable to get the most recent data.
Resolution: Restart System Center Data Access service and take other required actions to make Delta Synchronization workbe successfully complete.
Operations Console may crash in case of the lost connection to the SCOM server.Issue: If Operations Console loses connection to the SCOM server, SQL Server Dashboards may crash. It can happen because of the network issues or the SCOM server issues (e.g. if console was left unattended for a long time).
Resolution: Check connection with SCOM server. Reopen Operation Console.
When configuration of a SQL Server Dashboards is edited simultaneously by a few operators only the last change is appliedIssue: When a user edits a SQL Server Dashboard from Operations console and Web console simultaneously the algorithm ‘last changes apply’ was implemented to resolve this race situation.
Resolution: Reopen the dashboard or wait till the data is refreshed.
Operation Console may behave unresponsive in case of configuration save failureIssue: In rare cases SCOM is unable to successfully save updated Dashboard configuration. In this case dialogs on the SQL Server Dashboards become unresponsive (e.g. OK button in the Add Group). User can find error details in the Application event log.
Resolution: Reopen Operation Console.
27