· web viewessnet big data specific grant agreement no 2 (sga-2) framework partnership...
TRANSCRIPT
ESSnet Big Data
S p e c i fi c G r a n t A g r e e m e n t N o 2 ( S G A - 2 )h tt p s : / / w e b g a t e . e c . e u r o p a . e u / f p fi s / m w i k i s / e s s n e t b i g d a t a
h tt p : / / w w w . c r o s - p o r t a l . e u /
Framework Partnership Agreement Number 11104.2015.006-2015.720
Specific Grant Agreement Number 11104.2016.010-2016.756
Work Pack age 8Met hodol ogy
Del iv erab le 8 .3 Report des cr ib ing t he I T - i nf ras truct ure us ed and t he accompany i ng proce ss e s dev e loped and s k i l l s nee ded to s t udy or produce B i g Dat a bas ed offi ci a l s t atis ti cs
ESSnet co-ordinator:
Peter Struijs (CBS, Netherlands)[email protected] : +31 45 570 7441mobile phone : +31 6 5248 7775
Prepared by: WP8 team

Spis treściSpis treści...............................................................................................................................................2
1. Introduction....................................................................................................................................4
2. List of issues...................................................................................................................................4
2.1. Metadata management (ontology)........................................................................................4
2.1.1. Introduction....................................................................................................................4
2.1.2. Examples and methods...................................................................................................4
2.1.3. Discussion.......................................................................................................................4
2.2. Big Data processing life cycle..................................................................................................4
2.2.1. Introduction....................................................................................................................4
2.2.2. Examples and methods...................................................................................................4
2.2.3. Discussion.......................................................................................................................4
2.3. Format of Big Data processing................................................................................................4
2.3.1. Introduction....................................................................................................................4
2.3.2. Examples and methods...................................................................................................4
2.3.3. Discussion.......................................................................................................................4
2.4. Datahub..................................................................................................................................4
2.4.1. Introduction....................................................................................................................4
2.4.2. Examples and methods...................................................................................................4
2.4.3. Discussion.......................................................................................................................4
2.5. Data source integration..........................................................................................................4
2.5.1. Introduction....................................................................................................................4
2.5.2. Examples and methods...................................................................................................5
2.5.3. Discussion.......................................................................................................................5
2.6. Choosing the right infrastructure...........................................................................................5
2.6.1. Introduction....................................................................................................................5
2.6.2. Examples and methods...................................................................................................5
2.6.3. Discussion.......................................................................................................................5
2.7. List of secure and tested API’s................................................................................................5
2.7.1. Introduction....................................................................................................................5
2.7.2. Examples and methods...................................................................................................5
2.7.3. Discussion.......................................................................................................................7
2.8. Shared libraries and documented standards..........................................................................7
2.8.1. Introduction....................................................................................................................7

2.8.2. Examples and methods...................................................................................................8
2.8.3. Discussion.....................................................................................................................10
2.9. Data-lakes.............................................................................................................................10
2.9.1. Introduction..................................................................................................................10
2.9.2. Examples and methods.................................................................................................10
2.9.3. Discussion.....................................................................................................................10
2.10. Training/skills/knowledge.................................................................................................10
2.10.1. Introduction..................................................................................................................10
2.10.2. Examples and methods.................................................................................................11
2.10.3. Discussion.....................................................................................................................11
2.11. Speed of algorithms..........................................................................................................11
2.11.1. Introduction..................................................................................................................11
2.11.2. Examples and methods.................................................................................................11
2.11.3. Discussion.....................................................................................................................11
3. Conclusions...................................................................................................................................11
4. Abbreviations and acronyms........................................................................................................11
5. List of figures and tables...............................................................................................................11
1. IntroductionTo be added when all the issues are finalizing – the goal of the report, objectives etc.
2. List of issues
2.1. Metadata management (ontology)2.1.1. IntroductionIt is important to have (high quality) metadata available for big data. This is essential for nearly all uses of Big Data. Ideally, an ontology is available in which the entities, the relations between entities and any domain rules are laid down.
2.1.2. Examples and methods
2.1.3. Discussion
2.2. Big Data processing life cycle2.2.1. IntroductionContinuous improvement of Big Data processing requires capturing the entire process in a workflow, monitoring and improving it. This introduces the need to design and adapt the process and determine its dependence on external conditions.
2.2.2. Examples and methods
2.2.3. Discussion
2.3. Format of Big Data processing 2.3.1. IntroductionProcessing large amounts of data in a reliable and efficient way introduces the need for a unified framework of languages and libraries.
2.3.2. Examples and methods
2.3.3. Discussion
2.4. Datahub2.4.1. IntroductionSharing of multiple data sources is greatly facilitated when a single point of access, a so-called hub, is set up via which these sources are made available to others.
2.4.2. Examples and methods
2.4.3. Discussion
2.5. Data source integration 2.5.1. IntroductionThere is a need for an environment on which data sources, including Big Data, can be easily, accurately and rapidly integrated.

2.5.2. Examples and methods
2.5.3. Discussion
2.6. Choosing the right infrastructure2.6.1. IntroductionA number of Big Data oriented infrastructures are available. Choosing the right one for the job at hand is key to assuring optimal use is made of the resources and time available.
2.6.2. Examples and methods
2.6.3. Discussion
2.7. List of secure and tested API’s 2.7.1. Introduction
BACKGROUND AND THE GOAL
Collecting information from websites is a process that can be implemented with traditional web scraping, manually or automatically. Usually it means that the person who scrap the website must be familiar with the construction of HTML (Hypertext Markup Language) website, its tags and CSS (Cascade Style Sheet) classes, to develop a robot that allow transforming web based semi-structured information into the data set. Because the website owners can block a robot when massive web scraping is running or they could limit the access for robots with Captcha codes, it is highly recommended to discover if any API’s are provided by the website owners.
An application programming interface (API) is a set of subroutine definitions, protocols, and tools for building application software. It is important to know which API´s are available for Big Data and which of them are secure, tested and allowed to be used. Using the API allows to omit any legal issues regarding web scraping. If the data owner provides an API interface, the rules of accessing the data are also described. For instance, with Twitter API you have limits in the number of requests. Most of the issues are listed in 2.7.2. Some of the API’s are not available for free and different pricing plans allows to access more detailed or historical data. For example, flightaware.com, that allows to access historical data on flights, has five different pricing plans available1.
The goal of this chapter is to present the list of API’s used for statistical purposes in different projects. It includes the characteristics of each API with its basic functionality and possible use in different statistical domains.
2.7.2. Examples and methods
DETAILED DESCRIPTION WITH TABLES/FIGURES
From official statistics point of view, we need to examine the API’s that were used with success to collect information for statistical purposes. The list of them is presented in Table 1.
Table 1. Brief overview of API'sNo
.Name of the Basic functionality Restrictions Domains Remarks
1 http://flightaware.com/commercial/flightxml/pricing_class.rvt, accessed 9th of November 2017

API with hyperlink
1 Twitter API Scrap the tweets by keywords, hashtags, users; streaming scrapping
25 to 900 requests/15 minutes; access only to public profiles
Population, Social Statistics, Tourism
Account and API code needed
2 Facebook Graph API
Collect information from public profiles, also very specific such as photos metatags
Mostly present information, typical no more than dozens of requests
Population Account and API code needed
3 Google Maps API
Looking for any kind of objects (e.g., hotels), verification of addresses, monitoring the traffic on specific roads
Free up to 2.5 thous. requests per day.$0.50 USD / 1 thous. additional requests, up to 100 thous. daily, if billing is enabled.
Tourism Google account and API code needed
4 Google Custom Search API
Can be used to search through one website, with modifications it will search for a keywords in the whole Internet; can be used to find a URL of the specific enterprise
JSON/Atom Custom Search API provides 100 search queries per day for free. Additional requests cost $5 per 1000 queries, up to 10k queries per day.
Business Google account and API code needed
5 Bing API Finding specific URL of the enterprise
7 queries per second (QPS) per IP address
Business AppID needed
6 Guardian API Collect news articles and comments from Guardian website
Free for non-commercial use. Up to 12 calls per second, Up to 5,000 calls per day, Access to article text, Access to over 1,900,000 pieces of content.
Population, Social Statistics
Registered account needed
7 Copernicus Open Access Hub
Access to Sentinel-1 and Sentinel-2 repositories
Free for registered users Agriculture Registered account needed
The list shown in Table 1. includes basic set of API’s already used for statistical purposes. All of them are constructed to handle requests prepared in a specific format, e.g.,
http://api.bing.net/xml.aspx?Appid=<AppID>&query=bigdata&sources=web
is a formatted request for Bing API to get the results in JSON (JavaScript Object Notation) format on searching through the web for bigdata term. The results of the requests, depending on the API, may be formatted to JSON or XML (Extensible Markup Language) files.
Therefore, the listed API’s are not dependent on the programming language. Although most of the API’s has a substitutes in libraries, such as Tweepy is a Python library to access the API directly from this language, usually recommended option is to used universal libraries. Our experience shows that name of the classes and methods in different libraries may change, which make it difficult to maintain a software using them. Using the API libraries also makes it necessary to register and generate the API key to scrap the data. The best known API in Big Data projects for statistical

purposes is a Twitter API. For this social media, several different libraries exist for different languages. One of them is Tweepy that allows access via API without formulating the requests text. Different parameters allow accessing the social media channel and store the results in Python dictionaries.
2.7.3. Discussion
STRENGTHS vs. WEAKNESSES, FINAL CONCLUSION
Using API’s allows accessing the website or any datasets in more stable way than using traditional web scraping. For example, the structure of the website may be changed very frequently, resulting in changing CSS classes, which makes the software written to scrap the data very instable. Therefore, recommended solution is to find an API associated with the website that was designated to scrap. This is the major strength in using API comparing to scrap the data in traditional way.
On the other hand, API’s have many weaknesses. They may also be very instable and continuing maintenance is important. One of the examples is a Google Search Engine API that was deprecated and changed into Google Custom Search API. It resulted in the necessity of changing the software source code to access a new API’s for the same purposes but working different way.
As mentioned in the previous part, the recommended solution is to use API’s instead of traditional web scraping by collecting the data directly from websites. However using API does not allow us to treat the software as final version, as API’s are a living interfaces and may change its structure. Also we cannot be sure that API’s will be supported by data owners all the time. In various situations, the development may be stopped or in the specific situation the pricing plans may change resulted in ceasing free access to the data source.
2.8. Shared libraries and documented standards2.8.1. IntroductionSharing code, libraries and documentation stimulates the exchange of knowledge and experience between partners. Setting up a GitHub repository or alternative ones would enable this.
Although Big Data is very often related to technologies such as Apache Hadoop or Spark, most of the Big Data work is done in programming languages such as Python, R, Java or PHP. The variety of programming languages and tools used, makes a necessity of creating the set of shared libraries and documented standards, that can be easily used by other users. In other words, it will allow executing the software by other NSI’s without problems regarding software misconfiguration.
Common repositories provide many benefits to users. Firstly, there is a possibility of the version control. It means that every change in the source code is saved with history that can also have a description. This allows going back to any of the previous version, e.g., if the software is not consistent and stable after specific change in the source code. The second benefit is that software can be shared all the time with the public or private (authorized) users. Any change may be monitored and tested by them. Also very important in terms of software development is a possibility to discuss changes and give feedback. Finally, the repository has usually a common structure for documentation.

2.8.2. Examples and methodsGrowing market of software development resulted in numerous repositories. Their main function is to share the software and provide version control with revision numbers. The difference is usually in additional features offered by the repository. Advanced repositories developed by commercial companies are usually not for free. However it is very common that light version, with limited functionality is offered for free to encourage persons to use a specific repository. In Table 2. we put the list of selected source code repositories that would enable to achieve the goal of sharing libraries and software.
Table 2. Main features of selected source code repositoriesNo. Name Link Main features
1 GitHub http://github.com Most popular, free access, branches and2 Google Cloud
Source Repositorieshttps://cloud.google.com/source-repositories
With connection to GitHub, Bitbucket or any other repositories on Google infrastructure, additional features include debugging.
3 Bitbucket https://bitbucket.org Can be integrated with Jira, up to 5 users per project for free.
4 SourceForge http://sourceforge.net Very common for software release, including project tracking and discussions.
5 GitLab http://gitlab.com Integrated wiki and projects websites.6 Apache Allura https://allura.apache.org With the support for control version
languages like Git, Hg and Subversion (SVN), internal wiki pages, searchable artifacts.
7 AWS CodeCommit https://aws.amazon.com/codecommit Mostly for AWS users, provide access to private Git repositories in a secure way.
8 GitKraken https://www.gitkraken.com Free version for up to 20 users, special features include visualization tools of the project progress.
The list presented in the table above shows the main repositories that can be used for free with some limitations listed in the main features column. As it can be seen, some of the repositories are dedicated for specific users, e.g., AWS cloud users, Jira or SVN users. Therefore, the decision of the use of the specific repository will be connected with the tools used for software development. It is a reliable decision to use AWS integrated tools when working with AWS environment. However, in this document we will concentrate mostly on the most popular repository which is GitHub.
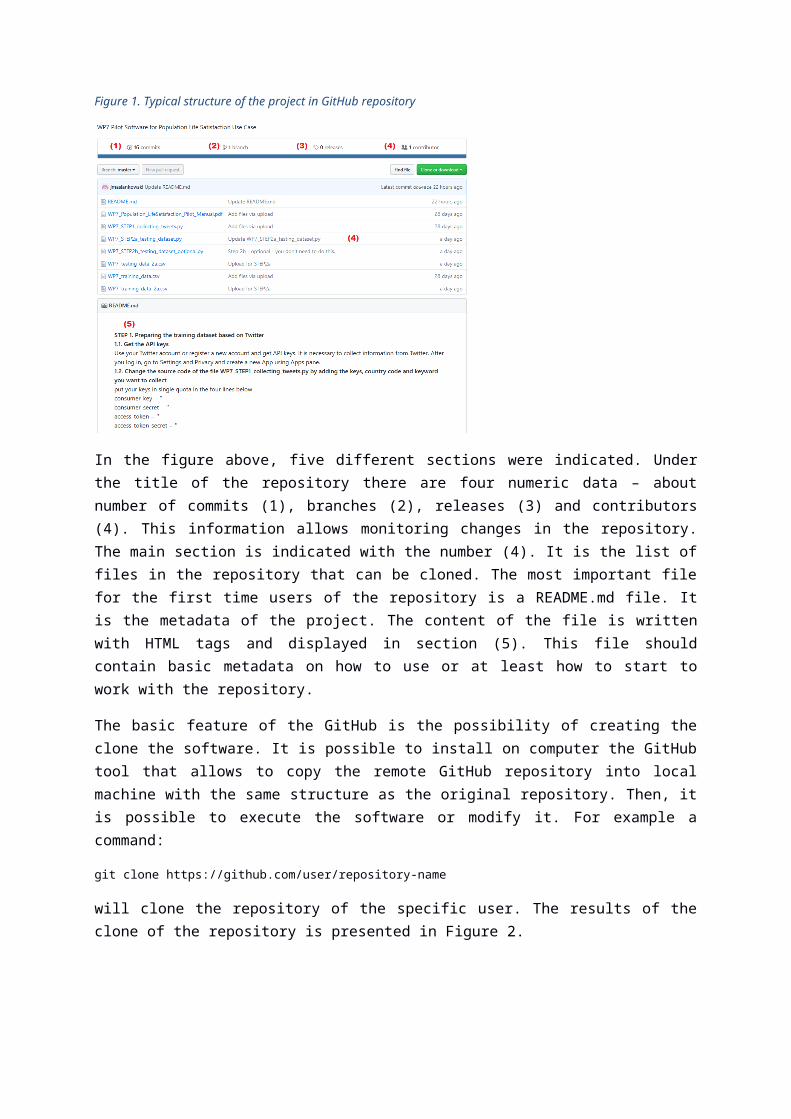
GitHub is structured in a specific way, where README file is the first file user can see when looking into the repository, like presented in Figure 1.
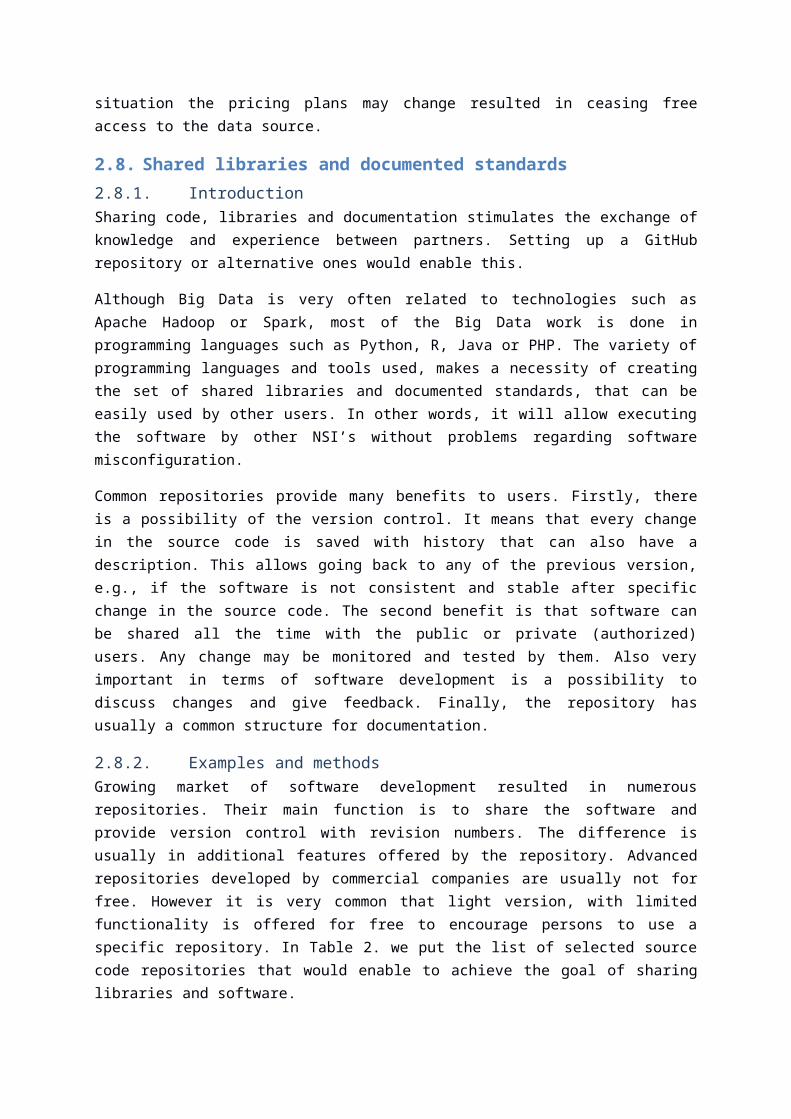
Figure 1. Typical structure of the project in GitHub repository
In the figure above, five different sections were indicated. Under the title of the repository there are four numeric data – about number of commits (1), branches (2), releases (3) and contributors (4). This information allows monitoring changes in the repository. The main section is indicated with the number (4). It is the list of files in the repository that can be cloned. The most important file for the first time users of the repository is a README.md file. It is the metadata of the project. The content of the file is written with HTML tags and displayed in section (5). This file should contain basic metadata on how to use or at least how to start to work with the repository.
The basic feature of the GitHub is the possibility of creating the clone the software. It is possible to install on computer the GitHub tool that allows to copy the remote GitHub repository into local machine with the same structure as the original repository. Then, it is possible to execute the software or modify it. For example a command:
git clone https://github.com/user/repository-name
will clone the repository of the specific user. The results of the clone of the repository is presented in Figure 2.
Figure 2. An example of GitHub clone process

Three parts indicated in the figure above are the clone command (1), the result of creating the clone – a new directory with the project name appeared (2) and the content of the directory (3) which is the same as presented in Figure 1. The next step for the user is just to execute the software or use the cloned libraries.
In Table 3. the list of the well-known repositories dedicated for official statistics was presented.
Table 3. Popular GitHub repositories for official statisticsNo. Name Link Main features
1 Awesome Official Statistics software
https://github.com/SNStatComp/awesome-official-statistics-software
The list of useful statistical software with links to other GitHub repositories, by CBS NL
2 ONS (Office for National Statistics) UK Big Data team
https://github.com/ONSBigData Various software developed by ONS UK Big Data Team
3 …The list of the repositories presented in the table above may change over time. Therefore, it is recommended to watch the repositories from registered GitHub account.
2.8.3. DiscussionThe benefits from sharing the libraries and software on repositories with versioning are strong visible especially when working in a group on one Big Data project. It helps to manage the revisions of the software produced, change the stages of the software development and inform the numerous users about changes or new releases of the software.
On the other side, programmers may be discouraged using the repositories when the project is not complex and only one person is developing the software. Alternative way of versioning is just to save different files with manual versioning. The reason for doing this is also to keep the software safe in one location. Although the repositories may be private and restricted from accessing them by other users, some users may not trust in the private policy.
To conclude, we can say that it is highly recommended to create the software with the support of repositories with version control. We recommend to share Big Data libraries and software created by NSI’s. It may result in the increased use of Big Data among official statistics users. As the consequence, the quality of the software will increase because of the wide group of users testing the software and giving feedback. Good practices of having public repositories were shown in Table 3.
2.9. Data-lakes 2.9.1. IntroductionCombining Big Data with other, more traditional, data sources is beneficial for statistics production. Making all data available at a single location, a so-called data-lake, is a way to enable this.
2.9.2. Examples and methods
2.9.3. Discussion
2.10. Training/skills/knowledge 2.10.1. IntroductionFor Big Data to be used in a statistical office, it is essential that employees are aware of the ways in which these data can be applied in the statistical process, are familiar with the benefits of using big
data specific IT-environments and possess the skills needed to perform these tasks. In the subsequent section it is assumed that all knowledge needed is (somewhere) available to fulfil these needs. Training is a way to transfer this knowledge to others. However, people can be trained in various ways. Examples are training of NSI-staff in house by big data experienced colleagues, training by coaches from a commercial company, such as employees of a big data company or experienced big data trainers, or by following a training course at an international level, which could be held either on- or offline.
2.10.2. Examples and methodsExamples of international training courses are the Big Data courses included in the European Statistical Training Program2, the Big Data lectures included in the European Master of Official Statistics3 or a Big Data bachelor or master program at a University or High school. In a nutshell, these courses enable participants to get acquainted with big data specific methods, techniques and IT-environments. The knowledge is primarily transferred by lecturing and some courses also include a hands-on training component. Since the ESTP trainings are the most relevant for NSI employees they are used as an example. To best way to get an idea of the skills taught, we list the for Big Data and Data Science relevant training courses in the ESTP program below including a brief description:
1. Introduction to Big Data and its ToolsIntroduction to the concepts of Big Data, the associated challenges and opportunities, and the statistical methods and IT tools needed to make their use effective in official statistics.
2. Can a Statistician become a Data Scientist?Demonstration of innovative techniques and their applications, identification of the skills needed for statisticians working at NSI’s to test the use of Big Data and other non-traditional sources of data for Official Statistics.
3. Machine Learning EconometricsDemonstration of innovative algorithm-based techniques for data analysis, with application to datasets for official statistics as well as for other sources (e.g. Big Data and text data).
4. Hands-on Immersion on Big Data ToolsIntroduction to the state-of-the-art IT tools required to process datasets of large size and test the tools in practices on real-world big data sets
5. Big Data Sources – Web, Social Media and Text AnalyticsApply web scraping and other techniques to collect texts from the web and learn how to analyse and mine them in order to determine their content and sentiment.
6. Automated Collection of Online Prices: Sources, Tools and Methodological AspectsUnderstand the advantages, risks and challenges of automated methods of collecting online prices (web scraping) including methods needed to calculate price indices and learn how to build web scrapers independently.
7. Advanced Big Data Sources – Mobile Phone and Other SensorsLearn how to explore, analyse and extract relevant information from large amounts of mobile phone and other sensor data, including its metadata.
In these training courses participants are introduced to topics such as High Performance Computing environments (including Hadoop, Spark and GPGPU’s), data cleaning procedures, machine learning methods and ways to collect and analyse various big data sources (such as web pages, social media
2 http://ec.europa.eu/eurostat/web/european-statistical-system/training-programme-estp3 http://ec.europa.eu/eurostat/web/european-statistical-system/emos

messages, mobile phone data, sensor data and satellite images). Each of these topics provides knowledge and form essential building blocks needed for the creation of big data based statistics.
In addition, it can be expected that the training courses also influence the mindset needed to enable the successful use of Big Data. The latter is an important consideration because the paradigm commonly observed in NSI’s is usually focused on dealing with sample surveys. In this mindset a statistician is used to predominantly look at the way the data is collected (the design), the representativity of the response and the estimation of variance. A similar approach is commonly observed when NSI employees deal with administrative data. Big Data oriented work, in contrast, focusses much more on the composition and quality of the data in a source and the potential bias of the estimate derived from it. The latter requires is a considerable change in the way an NSI employee is commonly used to work. Illustrating various ways in which big data can be successfully used for official statistics is an important contributor to stimulate such a change. The introduction to big data specific IT-environments support this as well because it demonstrates that there is no need to keep working with relative small data sets.
2.10.3. DiscussionTraining employees is an important building block in enabling the use of big data for official statistics. However, one may wonder if simply following a training course is enough? Certainly when a participant is acting at the big data forefront compared to the other employees at his/her NSI, following such a course by one or a few employees, does not immediately result in an increase in the production of big data based statistics when this person returns. Support by higher management, a certain number of employees with similar goals and skills, the availability of one or more big data sources and appropriate privacy protecting regulations are the minimum combination required to initiate this process. Additional contributors to this are a big data ready IT-environment and contact with either Universities, research institutes or other NSI’s with expertise on the topic studied. The latter can also be achieved by involvement in an international big data project, such as the ESSnet Big Data.
2.11. Speed of algorithms2.11.1. IntroductionIt is important in this section to make clear from the start what is exactly considered an algorithm and what is considered a method. This is important because sometimes these words are used interchangeably which is not correct. Strictly speaking, an algorithm is considered a means to a method’s end. In other words, an algorithm is the implementation of a method; usually in computer code. As a result, the following definitions are used:
An algorithm is a set of instructions designed to perform a specific task. In computer programming, algorithms are usually composed of functions that are executed in a step-by-step fashion with the aim to terminate at some point.
A method is a particular procedure to accomplish something in accordance with a specific plan. It can also be described as a systematic procedure to - in an orderly fashion - accomplish a task. An algorithm is a way to lay down such a procedure.

Because an algorithm is an implementation of a method, some of the choices made during the implementation affect its properties. The most important property considered in this section is the speed of the algorithm which is the amount of time needed to complete its task.
2.11.2. Examples and methodsA number of factors affect the speed of an algorithm. One of the most important, but not the only one, is the exact way in which a method is implemented. How well this is done is commonly indicated by the general term ‘algorithm efficiency’4. In the context of this section, an algorithm that is maximally efficient consumes the least amount of time to fully complete its task. From a theoretical point of view, certainly when processing large data sets, the complexity of the algorithm is the main contributor to the overall time needed to process data. In the field of computer science, this complexity is indicated by the so-called Big O notation. It expresses the time, as indicated by the number of operations, needed for an algorithm to complete its task as a function of the size of the input data (n). Various algorithms behave different when the amount of data they process increases. For algorithms the following complexity notations can be discerned (from fast to slow)5:
Name Notation Examples _ Constant O(1) Determine if a binary number is even or oddLogarithmic O(log n) Finding an item in a sorted array with binary searchLinear O(n) Finding an item in an unsorted list or a malformed treeLoglinear O(n log n) Performing a Fast Fourier Transform, heap sort or merge sortQuadratic O(n2) Multiplying to n-digit numbers, bubble sort or insertion sortExponential O(cn), c > 1 Determining if two logical statements are equivalent with brute force searchFactorial O(n!) Solving a travelling salesman problem with a brute force search
Figure 2.11 Big O complexity chart of algorithms. The number of operations are shown versus the number of elements (size n) for each complexity function. (from http://bigocheatsheet.com/)
4 https://en.wikipedia.org/wiki/Algorithmic_efficiency5 More are listed in table on https://en.wikipedia.org/wiki/Big_O_notation

Considerable decreases in the time needed to perform a particular task can be achieved by applying a less complex approach. For instance, changing from an algorithm with a quadratic complexity to one with a linear complexity reduces the time needed to complete the task by the square root of n. However, not for every task an algorithm of a lesser complexity can be used. In such cases there are a number of other alternatives to can be considered. The most often mentioned are: i) using an ‘approximate’ approach6 or ii) performing the task in parallel7. Both approaches can be combined off course.
i) When an approximate approach is used, one decides not to opt for the optimal, i.e. best, solution. This is especially useful when a lot of considerations need to be tested and/or when it is uncertain if an optimal approach exists or can be found within a reasonable amount of time. For some tasks this is the only way to obtain an answer during the life of the scientist.
ii) When implementing methods in parallel, the task is distributed over multiple devices. These can be multiple cores on the same processor, multiple processors on the same machine and/or on multiple machines. Each of these devices execute part of the overall task and its results are combined at the end to get the correct answer. Parallelization can speed up tasks considerably but because of the distributed approach and the need to combine the results at the end some communication overhead is introduced. The speedup achieved is expressed by Amdahl’s law8. The term ‘embarrassingly parallel’ is used to indicate methods that can be easily executed in parallel. Bootstrap sampling is an example of this.
2.11.3. DiscussionFrom the above one may be tempted to conclude that algorithmic complexity is the only consideration. This is clearly not the case as other factors also affect the overall speed of an implemented method. The most important other considerations are:
1) The hardware available (especially processor clock frequency, I/O performance of disks, use and number of multiple computers)
2) Any other tasks performed by (other users on) the system used3) The programming language and compiler used4) The programming skills of the person writing the code5) Use of in-memory techniques6) Use of specialized hardware (such as GPGPU’s or dedicated chips)7) Efficiently combining the factors listed above
This list makes clear that (increasing) the speed by which large amounts of data are processed actually depends on multiple ‘components’ and not only on the method chosen and the way it is implemented. This makes it challenging to master the ‘art’ of processing of data in a speedy fashion. However, creating a very fast implementation of a particular method can really help a lot of people and any production processes depending on it. Particular for (near) real-time processes the availability of such implementations are essential.
6 https://en.wikipedia.org/wiki/Approximation_algorithm7 https://en.wikipedia.org/wiki/Parallel_algorithm8 https://en.wikipedia.org/wiki/Amdahl%27s_law

3. Conclusions
4. Abbreviations and acronymsAPI – Application Programming Interface
AWS – Amazon Web Services
CBS – Centraal Bureau voor de Statistiek (Netherlands)
CSS – Cascade Style Sheet
HTML – Hypertext Markup Language
JSON – JavaScript Object Notation
ONS – Office for National Statistics (UK)
SVN – SubVersioN
XML – Extensible Markup Language
5. List of figures and tablesFigure 1. Typical structure of the project in GitHub repository..............................................................9Figure 2. An example of GitHub clone process.......................................................................................9
Table 1. Brief overview of API's..............................................................................................................6Table 2. Main features of selected source code repositories.................................................................8Table 3. Popular GitHub repositories for official statistics....................................................................10