clincancerres.aacrjournals.orgclincancerres.aacrjournals.org/highwire/filestream/... · web...
TRANSCRIPT

Supplemental Table 1. Patient characteristics of all six individuals with MDM2/4 amplifications who received immunotherapy.
Case # Cancer diagnosis Age/Sex Genomic alterations PD-L1 status (IHC) Immunotherapy Time-to-treatment failure
Response by imaging
1 Bladder cancer 73/ Men MDM2 amplificationAKT2 amplificationBRIP1 truncation exon 19PIK3CA H450_V461 > GSRAF1 amplification ocal)MYC amplification (equivocal)RNF43 S262*ARID2 S889*FRS2 amplification
Negative (22C3 antibody)
Atezolizumab (anti-PD-L1)
1.9 months. 258% increase from pre-immunotherapy imaging. 7.2-fold increase in progression pace compared to 2 months before therapy.
2 Breast cancer (triple negative)
44/ Women MDM2 amplificationPTCH1 T416STP53 S127Y
Negative(SP142 antibody)
Pembrolizumab(anti-PD-1)
1.5 months. 55% increase from pre-immunotherapy imaging.42.3-fold change in pace of progression compared to the 2 months before immunotherapy
3 Endometrial stromal sarcoma
65/ Women Profiling from initial surgical sample:CDKN2A R58* p14ARF P72L ZC3H7B-BCOR
Negative(SP142 antibody)
Nivolumab (anti-PD-1)
1.5 months. 242% increase from pre-immunotherapy imaging.~2.3 fold
1

Fusion
Profiling from liver mass biopsy 2 weeks after nivolumab:MDM2 amplificationCDKN2A R58* p14ARF P72L FRS2 amplification
Profiling from new abdominal mass biopsy 2 months after nivolumab: MDM2 amplificationCDKN2A R58* p14ARF P72L ZC3H7B-BCOR fusion FRS2 amplification
increase in rate of progression compared to the 2 months before immunotherapy
4 Adenocarcinoma of lung
50/ Women MDM2 amplificationKIF5B-RET fusion
Not tested. Pembrolizumab(anti-PD-1)
0.3 months. 135% increase from pre-immunotherapy imaging.7.1-fold increase in progression pace compared to 2 months before therapy
5 Adenocarcinoma of lung
61/ Men MDM2 amplificationCDK4 amplification
Not tested. Pembrolizumab(anti-PD-1)
1.2 months. Target lesions were stable. However, new brain metastases were found.
2
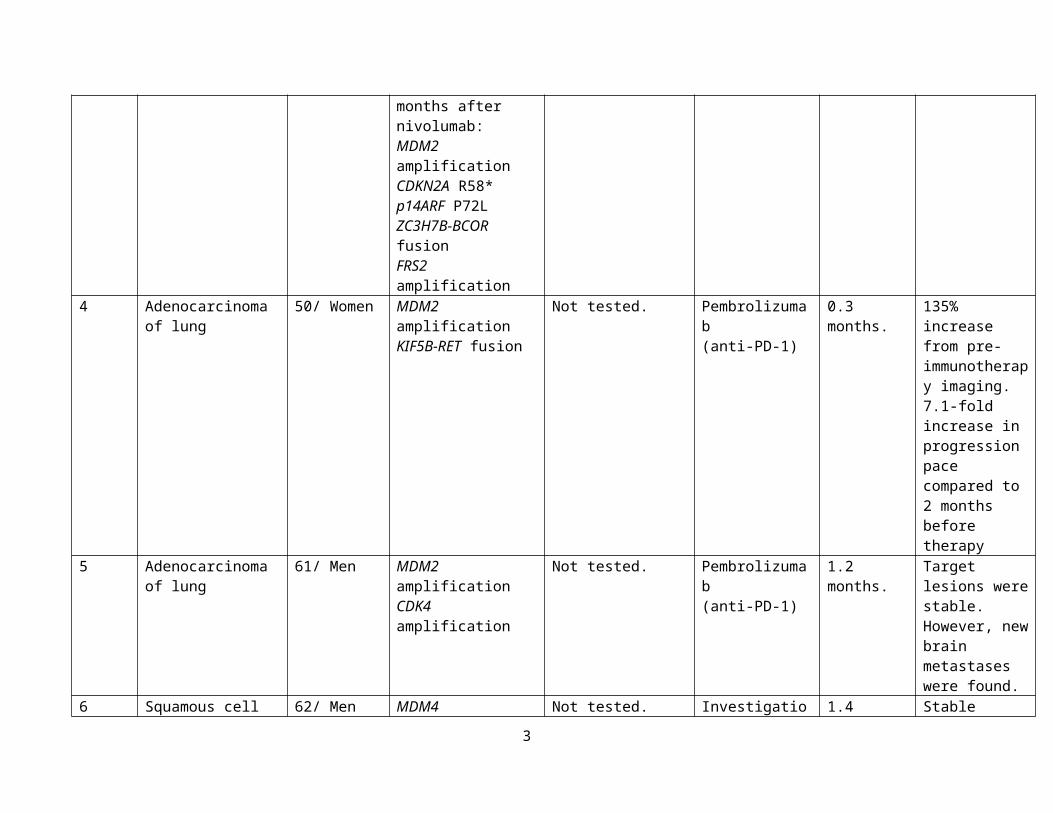
6 Squamous cell carcinoma of hypopharynx
62/ Men MDM4 amplificationEGFR amplificationFGFR1 amplificationKRAS amplificationPIK3CA amplificationCDKN2A/B lossIKBKE amplification (equivocal)MYC amplificationNTRK1 M375ISOX2 amplificationTP53 D259fs*2, Y220CBCL2L2 amplificationCUL3 splice site 379-1G>TNFKBIA amplificationNKX2-1 amplificationPIK3C2B amplificationZNF703 amplification
Not tested. Investigational immunotherapeutic agent (OX40 agonist)
1.4 months. Stable disease on scan.However had rapid clinical progression.
Abbreviations: IHC = immunohistochemistry
3

Supplemental Table 2. Patient characteristics among patients who received anti-PD-1/PD-L1 (N = 102) 1.
Variables All(N=102)
TTF <2 months
(N=39)
TTF ≥2 months
(N=63)
Odds- ratio * (95% CI)
(Univariate)
p-value *
(Univariate)Odds- ratio #
(95% CI)(Multivariate)
p-value #
(Multivariate)p-value §
(Bootstrap)
Age ≤ 65 years 64 (62.7%) 24 (61.5%) 40 (63.5%) 0.92 (0.42-2.10) >0.9999Age > 65 years 38 (37.3%) 15 (38.5%) 23 (36.5%)Cancer diagnosisNon-small cell lung cancer
38 (37.3%) 18 (46.2%) 20 (31.7%) 1.84 (0.83-4.13) 0.21
Squamous cell carcinoma of head and Neck
9 (8.8%) 2 (5.1%) 7 (11.1%) 0.43 (0.09-2.20) 0.48
Cutaneous squamous cell carcinoma
9 (8.8%) 0 (0) 9 (14.3%) <0.18 (0.02-1.31) ¶ 0.012 0.74 (0-6.31) 0.83 0.001
Melanoma 6 (5.9%) 1 (2.6%) 5 (7.9%) 0.31 (0.03-2.40) 0.40Renal cell carcinoma
5 (4.9%) 2 (5.1%) 3 (4.8%) 1.08 (0.19-5.49) >0.9999
Genomic alterationsTP53 50 (49.0%) 20 (51.3%) 30 (47.6%) 1.16 (0.50-2.47) 0.84CDKN2A/B 25 (24.5%) 9 (23.1%) 16 (25.4%) 0.88 (0.37-2.10) >0.9999TERT 17 (16.7%) 5 (12.8%) 12 (19.0%) 0.63 (0.23-1.80) 0.59LRP1B 13 (12.7%) 2 (5.1%) 11 (17.5%) 0.26 (0.06-1.20) 0.12KRAS 10 (9.8%) 2 (5.1%) 8 (12.7%) 0.37 (0.08-1.70) 0.31NOTCH1 10 (9.8%) 0 (0) 10 (15.9%) <0.16 (0.01-1.07) ¶ 0.012 0.47 (0-3.16) 0.54 0.001PIK3CA 10 (9.8%) 4 (10.3%) 6 (9.5%) 1.09 (0.33-3.90) >0.9999MLL2 9 (8.8%) 1 (2.6%) 8 (12.7%) 0.18 (0.02-1.30) 0.15EGFR 8 (7.8%) 7 (17.9%) 1 (1.6%) 13.6 (2.20-154.8) 0.005 11.8 (1.40-560.5) 0.02 0.014MYC 8 (7.8%) 4 (10.3%) 4 (6.3%) 1.69 (0.46-6.06) 0.48PTEN 8 (7.8%) 2 (5.1%) 6 (9.5%) 0.51 (0.10-2.20) 0.71BRAF 7 (6.9%) 4 (10.3%) 3 (4.8%) 2.29 (0.58-9.41) 0.42PTCH1 7 (6.9%) 1 (2.6%) 6 (9.5%) 0.25 (0.02-1.67) 0.25
4

Variables All(N=102)
TTF <2 months
(N=39)
TTF ≥2 months
(N=63)
Odds- ratio * (95% CI)
(Univariate)
p-value *
(Univariate)Odds- ratio #
(95% CI)(Multivariate)
p-value #
(Multivariate)p-value §
(Bootstrap)
ASXL1 6 (5.9%) 0 (0) 6 (9.5%) <0.3 (0.03-2.43) ¶ 0.08 0.47 (0-3.16) 0.54 0.34ATM 6 (5.9%) 2 (5.1%) 4 (6.3%) 0.8 (0.15-3.57) >0.9999CTNNB1 6 (5.9%) 2 (5.1%) 4 (6.3%) 0.8 (0.15-3.57) >0.9999GNAS 6 (5.9%) 1 (2.6%) 5 (7.9%) 0.31 (0.03-2.43) 0.4NF1 6 (5.9%) 1 (2.6%) 5 (7.9%) 0.31 (0.03-2.43) 0.4NOTCH2 6 (5.9%) 2 (5.1%) 4 (6.3%) 0.8 (0.15-3.57) >0.9999RB1 6 (5.9%) 3 (7.7%) 3 (4.8%) 1.67 (0.37-7.40) 0.67RET 6 (5.9%) 3 (7.7%) 3 (4.8%) 1.67 (0.37-7.40) 0.67SETD2 6 (5.9%) 2 (5.1%) 4 (6.3%) 0.8 (0.15-3.57) >0.9999SMAD4 6 (5.9%) 2 (5.1%) 4 (6.3%) 0.8 (0.15-3.57) >0.9999APC 5 (4.9%) 2 (5.1%) 3 (4.8%) 1.08 (0.19-5.49) >0.9999ARID1A 5 (4.9%) 1 (2.6%) 4 (6.3%) 0.39 (0.03-2.52) 0.65ARID2 5 (4.9%) 1 (2.6%) 4 (6.3%) 0.39 (0.03-2.52) 0.65BRCA2 5 (4.9%) 2 (5.1%) 3 (4.8%) 1.08 (0.19-5.49) >0.9999CREBBP 5 (4.9%) 0 (0) 5 (7.9%) <0.39 (0.03-2.52) ¶ 0.15FGFR1 5 (4.9%) 2 (5.1%) 3 (4.8%) 1.08 (0.19-5.49) >0.9999MCL1 5 (4.9%) 1 (2.6%) 4 (6.3%) 0.39 (0.03-2.52) 0.65MDM2 5 (4.9%) 5 (12.8%) 0 (0) >7.09 (1.08-87.8) ¶ 0.007 11.1 (1.95-infinity) 0.02 0.001STK11 5 (4.9%) 1 (2.6%) 4 (6.3%) 0.39 (0.03-2.52) 0.65ZNF217 5 (4.9%) 0 (0) 5 (7.9%) <0.39 (0.03-2.52) ¶ 0.15DNMT3A 4 (3.9%) 3 (7.7%) 1 (1.6%) 5.17 (0.74-68.0) 0.15
* Odds-ratio and p-value by Fisher's exact test.# Odds-ratio and p-value by exact conditional logistic regression (multivariate) analysis. Included characteristics with p-value ≤ 0.1 from univariate analysis.§ Bootstrapping with multiple logistic regression analysis was conducted on characteristics with p-value ≤ 0.1 from univariate analysis. p-value based on 989 bootstrap samples.
5

¶ If a variable dichotomized as N versus zero, and the odds ratio is thus zero or infinity, we adjusted the events to be 1 (instead of zero) versus N-1. This produces a numerical odds ratio, which is less than the actual infinite odds ratio. For example, for MDM2, where there were N = 5 versus zero patients with TTF<2 versus ≥2 months, the actual odds ration is infinity. Using the adjustment above, the numeric odds ratio for N=4 versus one patient is 7.09 and we list it as “>7.09.” The p-value shown is the actual p-value for the unadjusted numbers.
1 Included variables with N ≥ 5, except for DNMT3A (N=4).
Abbreviations: CI = confidence interval; TTF = time-to-treatment failure.
6

Supplemental Table 3. Patients with EGFR alterations and TTF less than 2 months on immunotherapy (N=8 of a total of 10 patients with EGFR alterations).
Case # Cancer diagnosis Age/Sex Genomic alterations PD-L1 status (IHC) Immunotherapy Time-to-treatment failure
Response by imaging
7 Squamous cell carcinoma of unknown primary
56/Men EGFR amplificationBRCA2 W1692fs*3BRIP1 T733fs*4MLH1 loss exons 12-19PTEN R173C, S229*, splice site 1027-2A>GARID1A Q1334_R1335insQCDKN2A/B lossMEN1 R521fs*15MSH6 F1088fs*5PIK3CB E1051KBAP1 Q441*CHD2 V175fs*1CIC P786fs*138CTCF E363fs*5CTNNA1 A784TEP300 Q128*HNF1A G292fs*25JAK1 K860fs*16, P430fs*2MLL2 P647fs*283, R2105HMLL3 K2797fs*26TP53 R282W
Negative(SP142 antibody)
Pembrolizumab(anti-PD-1)
0.7 months. 3% decrease from pre-immunotherapy imaging.
8 Glioblastoma 62/Men EGFR amplification, EGFR vIVa
Negative (22C3 antibody)
Nivolumab (anti-PD-1)
0.8 months. 2.4 % increase from baseline
7

CDKN2A loss p16INK4a and p14ARF exons 2-3PIK3R1 N453delQKI E135fs*5SETD2 splice site 5016-2_5018delAGAAATERT promoter -124C>T
imaging.
9 Squamous cell carcinoma of lung
64/Men EGFR amplificationPIK3CA amplificationCCND1 amplificationMCL1 amplificationTP53 splice site 560-7_561del9FGF19 amplificationFGF3 amplificationFGF4 amplificationSOX2 amplification
Not tested. Nivolumab (anti-PD-1)
0.8 months. 30% increase from pre-immunotherapy imaging.
10 Squamous cell cancer of hypopharynx
62/Men EGFR amplificationFGFR1 amplificationKRAS amplificationPIK3CA amplificationCDKN2A/B lossIKBKE amplification (equivocal)MDM4 amplificationMYC amplificationNTRK1 M375ISOX2 amplificationTP53 D259fs*2, Y220CBCL2L2 amplificationCUL3 splice site 379-1G>T
Not tested. Investigational immunotherapeutic agent (OX40 agonist)
1.4 months. Stable disease (0%) from pre-immunotherapy imaging.
8

NFKBIA amplificationNKX2-1 amplificationPIK3C2B amplificationZNF703 amplification
11 Adenocarcinoma of lung
54/Men EGFR E746_A750del, T790MAKT1 amplificationCDKN2A/B lossTP53 R248WNFKBIA amplificationNKX2-1 amplification
Not tested. Nivolumab (anti-PD-1)
1.1 months. 125% increase from pre-immunotherapy imaging.(3% increase from baseline to pre-immunotherpay). 41.7 fold increase in progression pace.
12 Adenocarcinoma of lung
44/Men EGFR E746_A750delMET amplificationCDK6 amplificationMYC amplificationRICTOR amplificationTP53 R248WFGF10 amplification
Not tested. Clinical trial with anti-PD-1 antibody
1.6 months. 18% increase from pre-immunotherapy imaging.
13 Adenocarcinoma of lung
73/Man EGFR amplification, L858R, T790MMITF amplificationTP53 C238_N239>*VGSDCTTIHYNYMCFOXP1 amplificationNFKBIA amplificationNKX2-1 amplificationNOTCH2 P6fs*27
Negative (22C3 antibody)
Nivolumab (anti-PD-1)
1.7 months. 53.6% increase from pre-immunotherapy imaging.(Only 1.5% increase from 2 month pre-therapy baseline scan to pre-
9

immunotherapy scan).35.7-fold increase in the pace of progression.
14 Renal cell carcinoma
44/Man EGFR I1060fs*18VHL R120GPIK3CA E545AERRFI1 lossCDKN2A/B lossBAP1 M231fs*11TNFRSF14 loss
Not tested. Nivolumab (anti-PD-1)
0.6 months. Clinical progression with respiratory failure from known lung metastases. No imaging available to evaluate the response.
Abbreviations: IHC = immunohistochemistry
10

Supplemental Table 4. Patients with DNM3TA alterations and TTF less than 2 months on immunotherapy (N=4 of a total of 5 patients with DNM3TA alterations).
Case # Cancer diagnosis Age/Sex Genomic alterations PD-L1 status (IHC) Immunotherapy Time-to-treatment failure
Response by imaging
15 Cutaneous melanoma
70/Man DNMT3A P718LKDR R1032QNRAS Q61HPDGFRA E459KCDKN2A R80*MCL1 amplificationTP53 S241FARID1A Y1377*EPHA3 G766EFGFR2 W156*RAD50 Q689*
Not tested. Ipilimumab (anti-CTLA-4)
1.4 months. 182% increase from 2 months prior to immunotherapy. No imaging just prior to the initiation of immunotherapy was available.
16 Cutaneous melanoma
59/Man DNMT3A R882HBRAF V600KMYD88 L265PTERT promoter -124C>T
Not tested. Pembrolizumab(anti-PD-1)
7 days. Clinical progression (Overall stable brain metastases per imaging).
17 Adenocarcinoma of lung
57/Woman BRAF V600EDNMT3A R882HTP53 D281Y, Q331*
Positive (Percent staining: 80%) (22C3 antibody)
Nivolumab(anti-PD-1)
4 days. No serial imaging available. Four days after nivolumab, patient was admitted for hydropneumothorax, and subsequently died 9 days after the
11

therapy. 18 Adenocarcinoma of
lung72/ Woman RET CCDC6-RET
fusionTP53 H193RDNMT3A splice site 2478+1G>ALRP1B D2600YNFE2L2 R18Q
Not tested. Nivolumab(anti-PD-1)
7 days. No serial imaging available. Seven days after the initiation of nivolumab, patient was admitted for respiratory and kidney failure. Subsequently deceased 17 days after the therapy.
12

Supplemental Figure legend.
Supplemental Figure 1. Evaluation of tumor biopsy at the time of progression (Case #4).
Two months after the initiation of nivolumab, tumor biopsy was obtained from the rapidly emerging abdominal mass which revealed high-grade endometrial stromal sarcoma (red arrow) with scattered apoptotic bodies (black arrow). However there was no finding suggestive of pseudoprogression including lymphocyte infiltration or tumor necrosis (Hematoxylin and eosin, 200x magnification).
Supplemental Figure 2.
Supplemental Figure 2.A.
Case #11:
54 year old man with metastatic adenocarcinoma of lung. Genomic profiling revealed aberrations including EGFR E746_A750del and T790M. After progressing on standard chemotherapy and anti-EGFR therapies (3% increase in last two months before immunotherapy), patient was started on nivolumab. However, 1.1 months after starting on nivolumab, patient was found to have worsening shortness of breath. Imaging revealed progression of thoracic lymphadenopathy as well as new liver metastases (125% increase; 41.7-fold increase in progression pace.) and taken off from therapy.
Supplemental Figure 2.B.
Case #13:
73 year old man with adenocarcinoma of lung. Molecular profiling showed EGFR amplification, L858R and T790M. After progressing on chemotherapy and anti-EGFR therapies, patient was started on nivolumab (1.5% increase in tumor size in the two months before immunotherapy). Restaging scan 1.7 months after the initiation of nivolumab showed disease stability of lung mass but progression of target liver mass as well as new liver metastases (53.6% increase; 35.7-fold increase in the pace of progression.). Nivolumab was therefore stopped.
13

Supplemental Figure 1. Evaluation of tumor biopsy at the time of progression (Case #4).
14

Supplemental Figure 2.
Supplemental Figure 2.A. Case #11
15

Supplemental Figure 2.B. Case #13
16