web viewabstract word count: 250/250. please address correspondence to: jiaying zhao. department of...
TRANSCRIPT
RUNNING HEAD: PERCEPTION OF MULTI-DIMENSIONAL REGULARITIES 1
Perception of multi-dimensional regularities is driven by salience
Ru Qi Yu1, Yu Luo1, Daniel Osherson2, Jiaying Zhao1,3
1Department of Psychology, University of British Columbia2Department of Psychology, Princeton University
3Institute for Resources, Environment and Sustainability, University of British Columbia
Manuscript type: Research ArticleMain text word count (excluding abstract, acknowledgement, and references): 5193Abstract word count: 250/250
Please address correspondence to:
Jiaying ZhaoDepartment of Psychology
Institute for Resources, Environment and SustainabilityUniversity of British Columbia
Vancouver, B.C., Canada, V6T 1Z4Email: [email protected]

2PERCEPTION OF MULTI-DIMENSIONAL REGULARITIES
Abstract
A challenge for the visual system is to detect regularities from multiple dimensions of the
environment. Here we examine how regularities in multiple feature dimensions are distinguished
from randomness. Participants viewed a matrix containing a structured half and a random half,
and judged whether the boundary between the two halves was horizontal or vertical. In
Experiment 1, the cells in the matrix varied independently in the color dimension (red or blue),
the shape dimension (circle or square), or both. We found that boundary discrimination accuracy
was higher when regularities were present in the color dimension than in the shape dimension,
but the accuracy was the same when regularities were present in the color dimension alone or in
both dimensions. By adding a third surface dimension (hollow or filled) in Experiment 2, we
found that discrimination accuracy was higher when regularities were present in the surface
dimension than the color dimension, but it was the same when regularities were present in the
surface dimension alone or in all three dimensions. When there were two conflicting boundaries
separately defined by two different dimensions, participants chose the boundary defined by the
surface dimension, followed by the color dimension, as more visible than the shape dimension
(Experiment 3). Moreover, participants were faster to discriminate differences in the surface
dimension, followed by the color dimension, than in the shape dimension (Experiment 4). These
results suggest that perception of regularities in multiple feature dimensions is driven by the
presence of regularities in the most salient dimension.
Keywords: attention, detection, feature, randomness, pattern
3PERCEPTION OF MULTI-DIMENSIONAL REGULARITIES
Introduction
Regularities are prevalent in the environment. The mind is able to detect many forms of
regularities, ranging from repetitions of the same object (Thompson & Spencer, 1966; Bar-Hillel
& Wagenaar, 1991), alternations between two different objects (Otto & Eichenbaum, 1992; Yu,
Osherson, & Zhao, in press), pairings between two distinct objects (Rescorla & Wagner, 1972;
Pavlov & Anrep, 2003), co-occurrences of individual objects over space or time (Saffran, Aslin,
& Newport, 1996; Fiser & Aslin, 2001), and associations between objects and contexts (Chun &
Jiang, 1998; Jiang, Swallow, & Rosenbaum, 2013).
Regularities are often present in multiple dimensions in the environment. For example,
the daily cycle between the sun and the moon is reflected by alternations in light intensity,
temperature, and colors of the sky. These features are highly correlated across dimensions. The
presence of regularities in multiple feature dimensions can facilitate learning (Turk-Browne,
Isola, Scholl, & Treat, 2008). In speech perception, lip movements and vocal sounds are highly
correlated, which helps language learning (Patterson & Werker, 2003) and perceptual
development in infants (Lewkowicz & Ghazanfar, 2009).
However, regularities are not always correlated across feature dimensions and can in
principle exist in each dimension independently. For example, features from the color dimension
do not need to correlate with features from the size dimension, and the visual input from the
environment does not need to correspond to the auditory input. Take English orthography for
instance. There are many individual patterns in the orthographic system, where the pattern in
spacing between words is independent from the spelling pattern of the word, and the
capitalization of letters is independent from the spacing between words (Venezky, 1970).
4PERCEPTION OF MULTI-DIMENSIONAL REGULARITIES
Given the presence of regularities in multiple feature dimensions, the challenge for the
cognitive system therefore is to detect regularities from these dimensions. It is currently not well
understood how the visual system perceives regularities which are present independently in
multiple dimensions. The current study addresses this question and tests two hypotheses. The
first is the facilitation hypothesis, which states that the detection of regularities is improved when
regularities are present in multiple dimensions of the stimuli than when regularities are present in
only one dimension. That is, the visual system is able to combine information from multiple
sources in order to extract regularities (Patterson & Werker, 2003; Turk-Browne et al., 2008).
The second is the dominance hypothesis, which states that the detection of regularities is
dominated by the presence of regularities in the most salient dimension. This hypothesis is based
on the assumption that different feature dimensions have varying levels of salience, and the most
salient dimension captures most attentional resources (Itti, Koch, & Niebur, 1998). Since
attention plays a critical role in the detection of regularities (Turk-Browne, Jungé, Scholl, 2005;
Yu & Zhao, 2015; Zhao, Al-Aidroos, & Turk-Browne, 2013; Zhao & Luo, 2017), this hypothesis
suggests that the ability to perceive regularities from multiple dimensions is determined by the
most salient dimension.
A common way to examine the perception of regularities is to test the ability to
distinguish regularities (i.e., signals) from randomness (i.e., noise). One method was developed
by Zhao, Hahn and Osherson (2014), where participants viewed a matrix that consisted of a
structured half and a random half, and judged whether the division between the two halves was
horizontal or vertical. The structured half of the matrix was made from binary bits (e.g., red or
blue cells) that alternated more than expected by chance (e.g., red blue red blue red blue), or
repeated more than expected by chance (e.g., red red red blue blue blue). The random half of the
5PERCEPTION OF MULTI-DIMENSIONAL REGULARITIES
matrix was made from random bits. Participants were not told anything about how the matrix
was generated, or which half was structured; they simply judged the orientation of the boundary.
The performance on this task served as a measure for the ability to perceive regularities.
In the current study, we used the same task as in Zhao, Hahn and Osherson (2014) to
examine the ability to detect regularities from multiple feature dimensions. Specifically, we used
an algorithm to generate binary bits that deviate from stochastic independence by allowing
previous bit to help determine the next one. Specifically, for each number p in the unit interval
(from 0 to 1), let D(p) generate a sequence of bits consisting of zeros and ones as follows:
Sequence generation using the device D ( p ) : An unbiased coin toss determines the first
bit. Suppose that the nth bit has been constructed (for n ≥ 1). Then with probability p the n
+ 1st bit is set equal to the opposite of the nth bit; with probability 1 − p the n + 1st bit is set
equal to the nth bit. Repeat this process to generate a sequence of any desired length.
The expected proportion of alternation, called the “switch rate” of the sequence, is p. For p < .5,
D(p) generates a sequence that is more likely to repeat, resulting in long streaks. The repetitions
are what we call regularities in the current study. For p > .5, D(p) tends to alternate. For p = .5,
D(p) generates a random sequence. The expected proportion of each bit is 50% for all p ∈ [0, 1],
although empirically, the output might deviate slightly from 50% (Yu, Gunn, Osherson, & Zhao,
in press). This algorithm allowed us to manipulate different degrees of repetitions in the
sequence while maintaining equal probability of the two outcomes (Yu et al, in press).
The current study used a boundary discrimination task where participants judged the
boundary between the two halves in a matrix (Zhao et al., 2014). Specifically, participants
6PERCEPTION OF MULTI-DIMENSIONAL REGULARITIES
viewed a matrix with a random half and a structured half, and judged whether the boundary was
horizontal or vertical. Each cell in the matrices could vary independently in three dimensions:
color (feature values: red or blue), shape (feature values: circle or square), and surface (feature
values: hollow or filled). In each dimension, the two feature values varied according to a binary
sequence generated by D(p). The feature values on the three dimensions were determined by
three independent binary sequences generated by D(p). In the random half of the matrix, the two
feature values were randomly determined with a switch rate p = 0.5. In the structured half of the
matrix, the two feature values were more likely to repeat with a switch rate p = 0.2, and therefore
containing regularities. In other words, regularities (repetitions) could be present in any feature
dimension independently.
The current study contained four experiments. In Experiment 1, the cells in the matrix
varied independently in the color dimension, the shape dimension, or both dimensions. We
compared the boundary discrimination performance when regularities were present on a single
dimension and when regularities were present on both dimensions. In Experiment 2, the cells in
the matrix varied independently in the color, shape, or surface dimension, and we compared the
discrimination performance when regularities were present on a single dimension and when
regularities were present on all three dimensions. In order to explain how participants detect
regularities from multiple dimensions, in Experiment 3 the matrix contained two conflicting
boundaries defined separately by two different dimensions, and we examined which boundary
was selected by the participants as being more visible. Finally in Experiment 4, we examined the
speed with which participants discriminated differences between the two feature values in each
dimension, in order to identify which dimension was more perceptually salient.

7PERCEPTION OF MULTI-DIMENSIONAL REGULARITIES
Experiment 1
The goal of this experiment was to examine how regularities from multiple feature
dimensions were perceptually distinguished from randomness.
Participants
Forty-seven undergraduate students (37 female, mean age=20.6 years, SD=2.3) from the
University of British Columbia (UBC) participated for course credit. Participants in all
experiments provided informed consent. All experiments have been approved by the UBC
Behavioral Research Ethics Board. We conducted a power analysis in G*Power (Faul, Erdfelder,
Lang, & Buchner, 2007), using an effect size of ηp2=0.17 observed in our prior work using
similar methods and analyses (Zhao et al., 2014). Based on the power analysis, 47 participants
would be required to have 95% power to detect the effect in our paradigm with an alpha level of
0.05. To keep power consistent, we recruited 47 participants in all subsequent experiments.
Apparatus
In all experiments, participants seated 50cm from a computer monitor (refresh rate=
60Hz). Stimuli in Experiments 1 and 2 were generated by Java.
Stimuli
The stimuli were 30×30 matrices, each subtending 15.1° of visual angle (Figure 1a).
Every matrix was evenly divided into a structured half and a random half, either horizontally or
vertically. The direction of division was randomly determined for each matrix, and each half of
the matrix contained 15×30 cells. In the structured half, the cells were tiled from a binary
sequence from D(p) where the switch rate of p=0.2, and in the random half, the cells were tiled
from a random sequence from D(p) where the switch rate of p=0.5. The direction of tiling in both
halves was randomly determined, independent from the boundary orientation, but it was

8PERCEPTION OF MULTI-DIMENSIONAL REGULARITIES
consistent in each half, either both horizontal or both vertical. There were three conditions. In the
color condition (Figure 1b), the cells varied only on the color dimension, and each cell could be
red (RGB: 255, 0, 23) or blue (6, 32, 244) determined by a binary sequence of D(p), but all cells
were squares. In the shape condition (Figure 1c), the cells varied only on the shape dimension,
and each cell could be a circle or a square determined by a binary sequence of D(p), but all cells
were blue. In the combined condition (Figure 1d), the cells varied on both color and shape
dimensions, and each cell could be a red circle, a red square, a blue circle, or a blue square,
determined by two independent binary sequences of D(p). The structured half contained a switch
rate of p=0.2 and the random half contained a switch rate of p=0.5 in all three conditions.
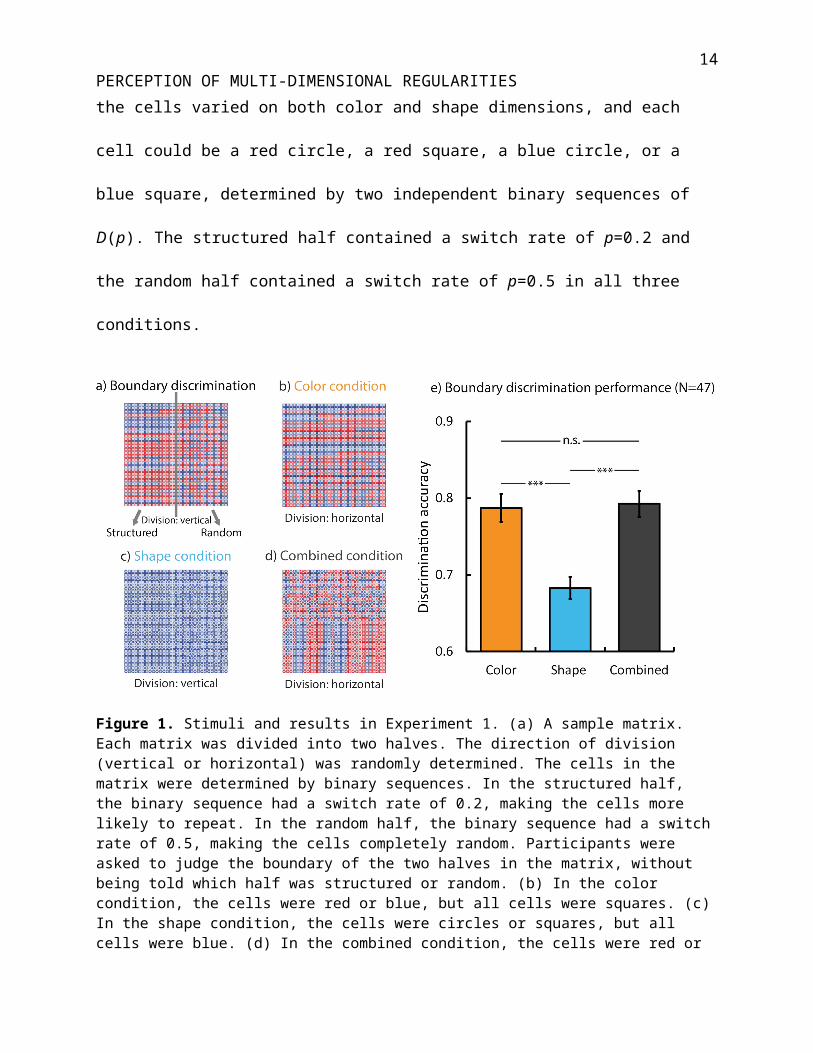
Figure 1. Stimuli and results in Experiment 1. (a) A sample matrix. Each matrix was divided into two halves. The direction of division (vertical or horizontal) was randomly determined. The cells in the matrix were determined by binary sequences. In the structured half, the binary sequence had a switch rate of 0.2, making the cells more likely to repeat. In the random half, the binary sequence had a switch rate of 0.5, making the cells completely random. Participants were asked to judge the boundary of the two halves in the matrix, without being told which half was structured or random. (b) In the color condition, the cells were red or blue, but all cells were squares. (c) In the shape condition, the cells were circles or squares, but all cells were blue. (d) In the combined condition, the cells were red or blue circles or squares. (e) Boundary discrimination accuracy in each condition (Error bars indicate ±1 between-subjects SEM; ***p<.001).

9PERCEPTION OF MULTI-DIMENSIONAL REGULARITIES
Procedure
There were three conditions: color, shape, and combined. Each condition was a separate
block, and each block contained 45 trials, so there were 135 trials in total. The order of the
blocks was randomized. In each trial, participants viewed a matrix and were asked to judge the
orientation of the boundary between the two halves in the matrix. They were not told anything
about how the matrix was made, or which half was structured or random. They were only told
that each matrix contained two halves which were separated by a horizontal or vertical boundary,
and their task was to judge the orientation of the boundary by pressing the “h” key for horizontal
or the “v” key for vertical. Each matrix was presented at the center of the screen for 2.5 seconds.
If participants did not respond within 2.5 seconds, the screen remained blank. There was no time
limit for participants to respond, and they could only proceed to the next trial if they responded
in the current trial. Participants took a break of one to two minutes between blocks.
Results and discussion
We used the boundary discrimination accuracy (Figure 1e) to measure the ability to
detect regularities from randomness in each condition. Using a one-way repeated measures
ANOVA, we found a significant difference in discrimination accuracy among the conditions
[F(2,92)=49.01, p<.001, ηp2=0.52]. Post-hoc Tukey HSD tests revealed that the accuracy was
reliably higher in the color condition than in the shape condition [p<.001], it was reliably higher
in the combined condition than in the shape condition [p<.001], but the accuracy in the color and
combined conditions was not different [p=.88]. This suggests that regularities were more easily
detected in the color dimension than in the shape dimension, but there was no additional benefit
in discrimination performance when regularities were present in both dimensions. This provides
support for the dominance hypothesis rather than the facilitation hypothesis.

10PERCEPTION OF MULTI-DIMENSIONAL REGULARITIES
Experiment 2
To see if the effect observed in Experiment 1 was specific to the color dimension, we
introduced a third dimension in Experiment 2, a surface dimension, and examined how
regularities from three feature dimensions were distinguished from randomness.
Participants
Forty-seven undergraduate students (34 female, mean age=24.5 years, SD=4.2)
participated in the experiment for course credit.
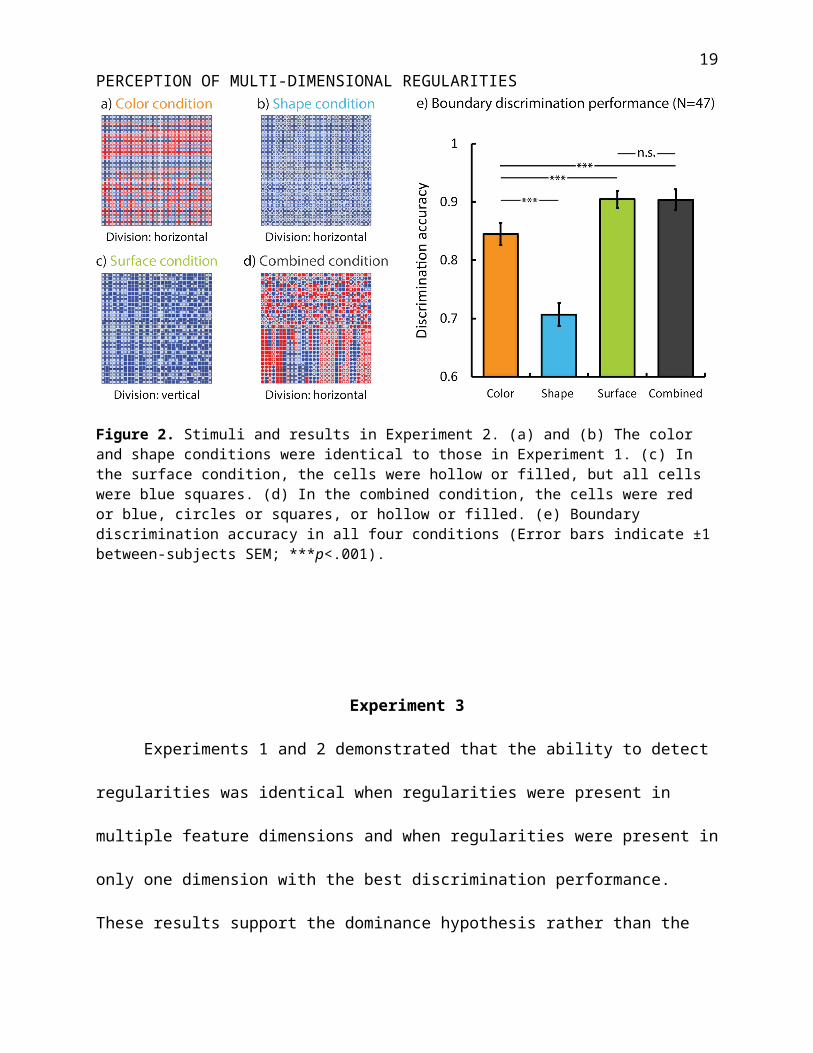
Stimuli and procedure
The matrices in the color and shape conditions were identical to those in Experiment 1
(Figure 2a & 2b), except now there was a third surface condition, and a new combined condition.
In the surface condition (Figure 2c), the cells varied only on the surface dimension, and each cell
could be hollow or filled determined by a binary sequence of D(p), but all cells were blue
squares. In the combined condition (Figure 2d), the cells varied on color, shape, and surface
dimensions, and each cell could be red or blue, circle or square, or hollow or filled, determined
by three independent binary sequences of D(p). As before, the structured half contained a switch
rate of p=0.2 and the random half contained a switch rate of p=0.5 in all four conditions. The
procedure was identical to that in Experiment 1, except that each block contained 27 trials, so
there were 108 trials in total.
Results and discussion
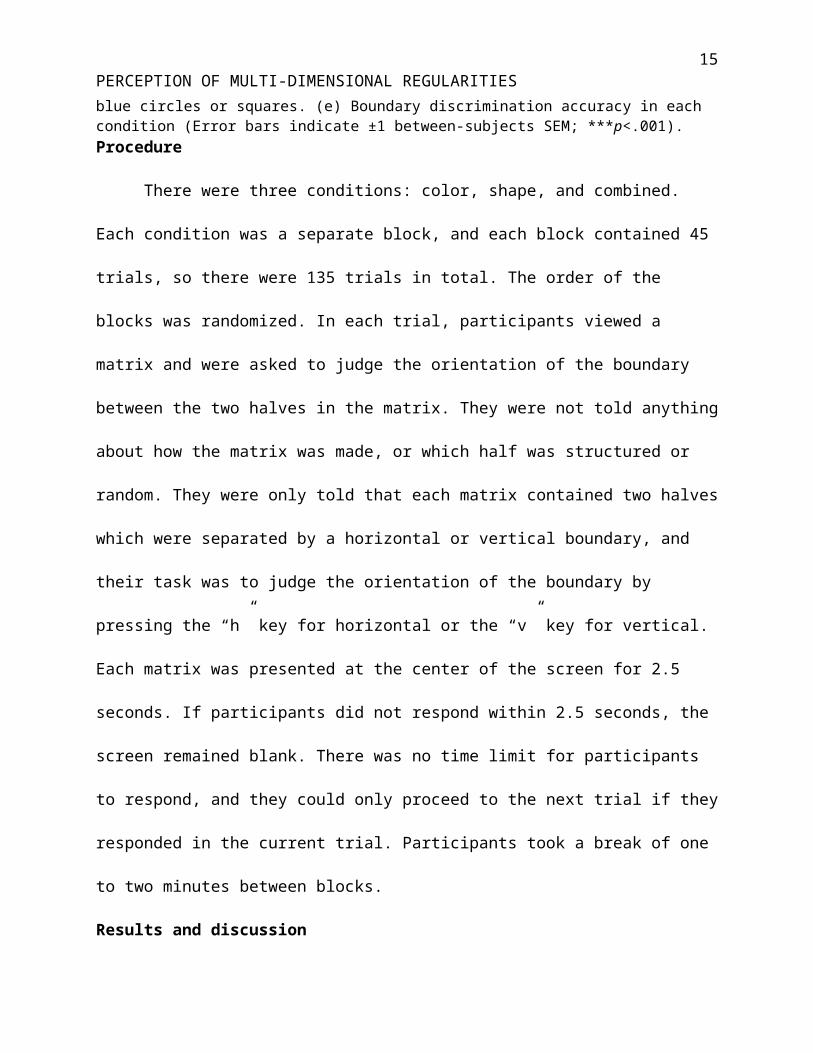
The boundary discrimination accuracy was shown in Figure 2e. Using a one-way
repeated measures ANOVA, we found a significant difference in discrimination accuracy among
the conditions [F(3,132)=71.56, p<.001, ηp2=0.62]. Post-hoc Tukey HSD tests revealed that as in
Experiment 1, the accuracy was reliably higher in the color condition than in the shape condition
11PERCEPTION OF MULTI-DIMENSIONAL REGULARITIES
[p<.001], but the accuracy in the surface condition was reliably higher than in the color or shape
conditions [p’s<.001]. Moreover, the accuracy in the combined condition was also higher than
the color or shape conditions [p’s<.001]. Critically, the accuracy in the combined condition was
not different from that in the surface condition [p=.99].
These results suggest that regularities were more easily detected in the surface dimension
than in the color or shape dimensions, but there was no additional benefit in discrimination
performance when regularities were present in all three dimensions than when regularities were
present only in the surface dimension. This again provides support for the dominance hypothesis
rather than the facilitation hypothesis.
Figure 2. Stimuli and results in Experiment 2. (a) and (b) The color and shape conditions were identical to those in Experiment 1. (c) In the surface condition, the cells were hollow or filled, but all cells were blue squares. (d) In the combined condition, the cells were red or blue, circles or squares, or hollow or filled. (e) Boundary discrimination accuracy in all four conditions (Error bars indicate ±1 between-subjects SEM; ***p<.001).
12PERCEPTION OF MULTI-DIMENSIONAL REGULARITIES
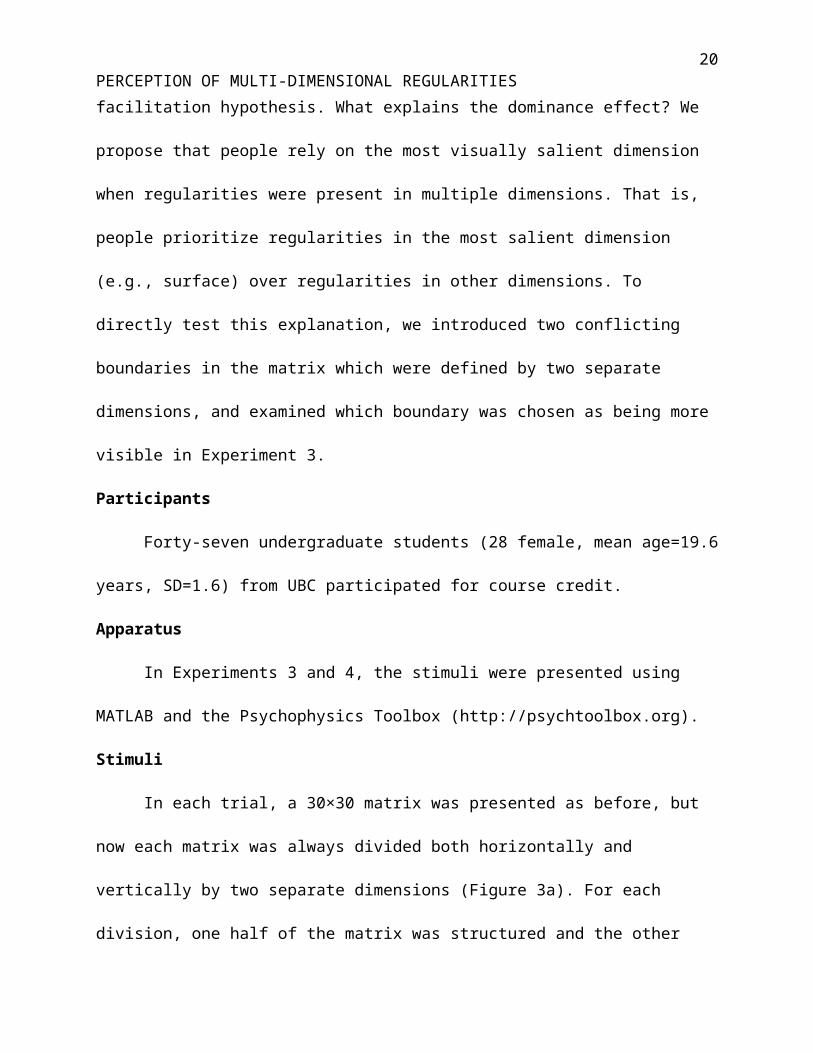
Experiment 3
Experiments 1 and 2 demonstrated that the ability to detect regularities was identical
when regularities were present in multiple feature dimensions and when regularities were present
in only one dimension with the best discrimination performance. These results support the
dominance hypothesis rather than the facilitation hypothesis. What explains the dominance
effect? We propose that people rely on the most visually salient dimension when regularities
were present in multiple dimensions. That is, people prioritize regularities in the most salient
dimension (e.g., surface) over regularities in other dimensions. To directly test this explanation,
we introduced two conflicting boundaries in the matrix which were defined by two separate
dimensions, and examined which boundary was chosen as being more visible in Experiment 3.
Participants
Forty-seven undergraduate students (28 female, mean age=19.6 years, SD=1.6) from
UBC participated for course credit.
Apparatus
In Experiments 3 and 4, the stimuli were presented using MATLAB and the
Psychophysics Toolbox (http://psychtoolbox.org).
Stimuli
In each trial, a 30×30 matrix was presented as before, but now each matrix was always
divided both horizontally and vertically by two separate dimensions (Figure 3a). For each
division, one half of the matrix was structured and the other half was random. One boundary was
more salient, where the structured half was determined by a binary sequence of D(0) and the
random half was determined by a random sequence of D(0.5). The other boundary was less
salient, where the structured half was determined by a binary sequence of D(0.07) and the
13PERCEPTION OF MULTI-DIMENSIONAL REGULARITIES
random half was determined by a random sequence of D(0.5). In other words, the difference in
switch rates between the two halves was greater with the more salient boundary (0 vs. 0.5) than
with the less salient boundary (0.07 vs. 0.5). The switch rate of the structured half was lower
than that in Experiments 1 and 2, because we wanted the two boundaries to be simultaneously
detectable in the same matrix, and with the previous switch rate of 0.2 the two boundaries were
too hard to see at the same time.
Importantly, one boundary was defined by D(p) sequences that determined the features
on one dimension, and the other boundary was defined by D(p) sequences that determined the
features on a different dimension. All D(p) sequences were independently generated. There were
three types of conflicts: color vs. shape (Figure 3b), surface vs. color (Figure 3c), and surface vs.
shape (Figure 3d). As before, the tiling direction of the sequence in each half was randomly
determined, independent from the boundary orientation, but was consistent across the two
halves. The location of the structured half was randomly determined, and which boundary was
more salient was counterbalanced across trials.
Procedure
Since there were three types of conflicts, there were three within-subjects conditions.
There were 40 trials for each condition, with 120 trials in total. For half of the trials in each
condition, the more salient boundary was defined by one feature dimension, and for the other
half of the trials, the more salient boundary was defined by the other feature dimension. In each
trial, one matrix was presented for 2.5 seconds, and participants were told that there were two
boundaries in the matrix and their task was to choose which boundary (horizontal or vertical)
looked more visible to them by pressing the “h” key for horizontal or the “v” key for vertical.
Our rationale was that the boundary participants chose as being more visible reflects the greater
14PERCEPTION OF MULTI-DIMENSIONAL REGULARITIES
ease with which regularities were distinguished from randomness on that feature dimension, and
therefore suggests that the dimension looked more salient. Participants were not told anything
about how the matrix was made or which half was structured.
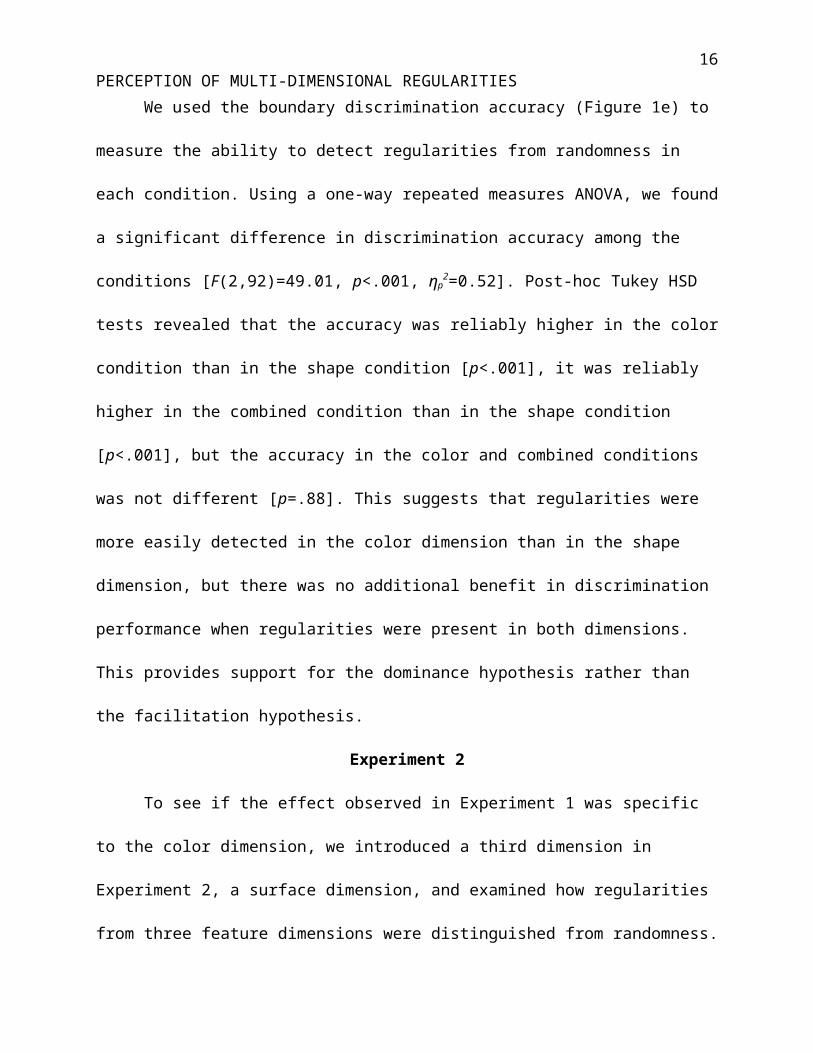
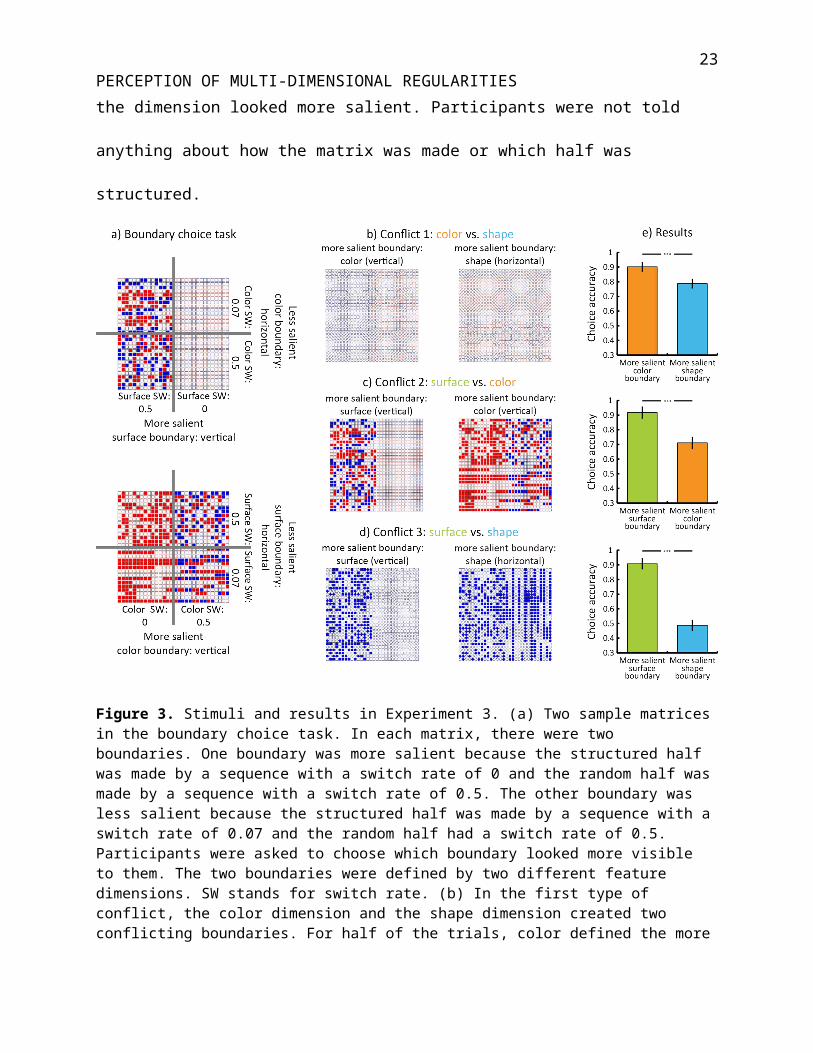
Figure 3. Stimuli and results in Experiment 3. (a) Two sample matrices in the boundary choice task. In each matrix, there were two boundaries. One boundary was more salient because the structured half was made by a sequence with a switch rate of 0 and the random half was made by a sequence with a switch rate of 0.5. The other boundary was less salient because the structured half was made by a sequence with a switch rate of 0.07 and the random half had a switch rate of 0.5. Participants were asked to choose which boundary looked more visible to them. The two boundaries were defined by two different feature dimensions. SW stands for switch rate. (b) In the first type of conflict, the color dimension and the shape dimension created two conflicting boundaries. For half of the trials, color defined the more salient boundary, and for the other half of the trials, shape defined the more salient boundary. (c) In the second type of conflict, the surface and color dimensions created two conflicting boundaries, with surface being the more salient boundary half of the time and color being the more salient boundary half of the time. (d) In the third type of conflict, the surface and shape dimensions created two conflicting boundaries, with surface being the more salient boundary half of the time and shape being the more salient boundary half of the time. (e) Accuracy of choosing the objectively more salient boundary was calculated as the percent of times when participants chose the objectively more salient boundary as more visible. The choice accuracy was shown for each type of conflict (Error bars indicate ±1 between-subjects SEM; ***p<.001).
15PERCEPTION OF MULTI-DIMENSIONAL REGULARITIES
Results and discussion
We calculated the accuracy of boundary choice as the percentage of times when
participants chose the objectively more salient boundary as more visible. The choice accuracy
was presented for each type of conflict in Figure 3e. We found that when the more salient
boundary was defined by the color dimension, participants were reliably more accurate in
choosing the boundary as more visible, than when the more salient boundary was defined by the
shape dimension [t(46)=4.19, p<.001, d=0.62]. When the more salient boundary was defined by
the surface dimension, participants were reliably more accurate in choosing the boundary as
more visible, than when the more salient boundary was defined by the color dimension
[t(46)=5.66, p<.001, d=1.19], or when the more salient boundary was defined by the shape
dimension [t(46)=12.63, p<.001, d=2.63]. These results showed that participants were better at
detecting regularities in the surface dimension, even when there were competing regularities in
the color or shape dimensions. They were also better at detecting regularities in the color
dimension when there were competing regularities in the shape dimension. These findings were
consistent with those in Experiments 1 and 2, suggesting that the perception of multi-
dimensional regularities was driven by the most salient dimension.
Experiment 4
In Experiment 3, salience was defined by the difference in switch rates between the
structured half and the random half of the matrix. In the final experiment, we examined the
perceptual salience of a feature dimension by the speed with which people discriminate
differences between features in each dimension.
Participants
16PERCEPTION OF MULTI-DIMENSIONAL REGULARITIES
Forty-seven undergraduate students (35 female, mean age=19.6 years, SD=1.5) from
UBC participated for course credit.
Stimuli
The stimuli contained two separate matrices per trial. Each matrix was a half matrix in
the previous experiments. Each matrix was half the size of the original 30×30 matrix, so either
15×30 or 30×15. Each matrix contained identical cells within the entire matrix. The two matrices
could be the same, or different. In case they were different, they differed only in the features in
the same dimension (Figure 4a). For example, one matrix contained only blue squares and the
other matrix contained only red squares. The two matrices could differ in the features in the
color, shape, or surface dimension.
Procedure
In each trial, two matrices were presented side-by-side on the screen, either top and
bottom with a horizontal gap, or left and right with a vertical gap. The layout was randomly
determined in each trial. In half of the trials, the two matrices were different, and in the other half
of the trials, the two matrices were identical. There were three conditions: color, shape, and
surface, where the two matrices could be different in color (red and blue), in shape (circle and
square), and in surface (hollow and filled), respectively. For each condition, there were 80 trials
(40 different trials and 40 identical trials), resulting in 240 trials in total, which were presented in
a random order. Participants were presented with the two matrices in each trial and were asked to
judge whether the two matrices were the same or different, as quickly as they could. The
matrices were presented until response.
17PERCEPTION OF MULTI-DIMENSIONAL REGULARITIES
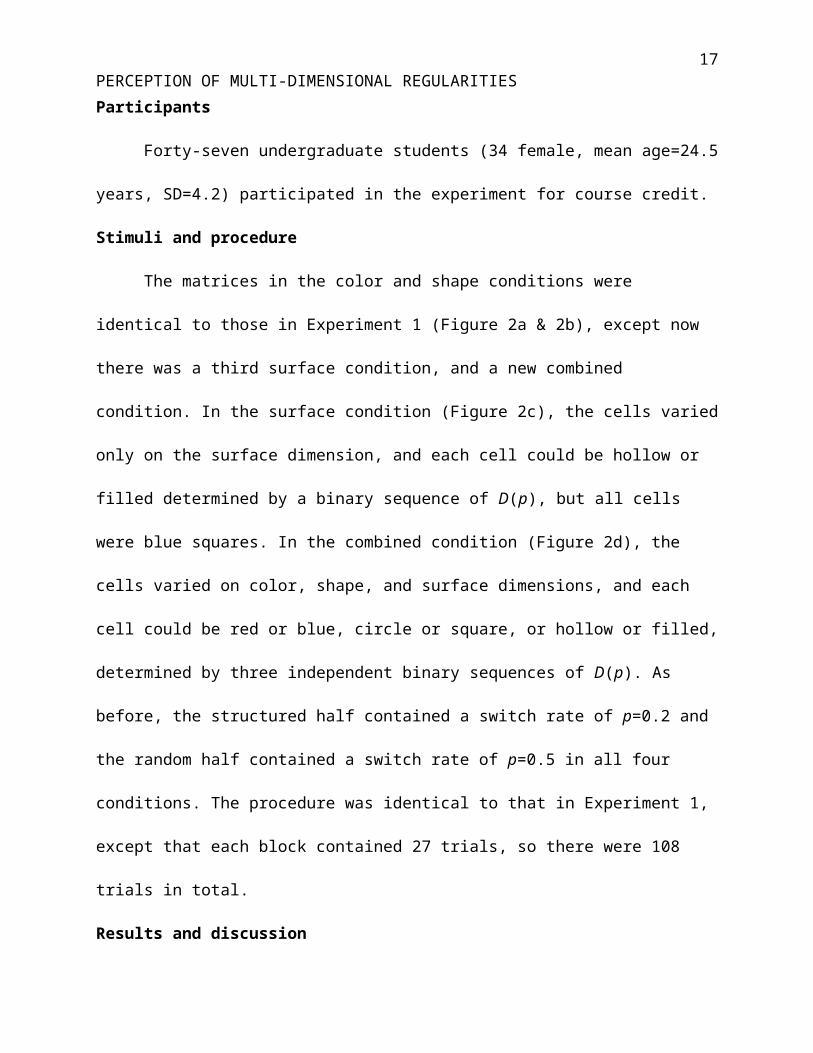
Figure 4. Stimuli and results in Experiment 4. (a) Sample matrices where the two matrices were different from each other in the judgment task. Participants were asked judge whether two matrices were the same or different as quickly as they could. The two matrices were identical in half of the trials and different in the other half of the trials. In case of different, they could differ only on one dimension (color, shape, or surface). The matrices are not drawn to scale. (b) The response time (in seconds) of correct trials were plotted for each condition (Error bars indicate ±1 between-subjects SEM; *p<.05, ***p<.001).
Results and discussion
We examined the response time in the judgment task as a measure for perceptual salience
of each dimension. The overall accuracy of the judgment task was 93%, which was quite high, so
we only included correct trials for analysis. Outliers were removed if the response time was not
within ± 2.5 standard deviations of the mean (1.6% of the total number of trials).
Using a one-way repeated measures ANOVA, we found a significant difference in the
response time across the three conditions [F(2,92)=14.65, p<.001, ηp2=0.24]. Post-hoc Tukey

18PERCEPTION OF MULTI-DIMENSIONAL REGULARITIES
HSD tests revealed that the response time in the color condition was reliably faster than that in
the shape condition [p=.03], and the response time in the surface condition was reliably faster
than that in the shape condition [p<.001], but there was no difference in response time between
the color and surface conditions [p=.37]. The results showed that participants were faster to
discriminate differences in the surface or color dimension than in the shape dimension,
suggesting that the surface or the color dimension was more perceptually salient than the shape
dimension. These findings support the idea that people prioritize the more salient dimension
when detecting regularities in multiple feature dimensions.
General Discussion
The current study aimed to examine the perception of regularities in multiple feature
dimensions. We found that discrimination accuracy between the structured half and the random
half of the matrix was higher when regularities were present in the color dimension than in the
shape dimension, but the accuracy was the same when regularities were present in the color
dimension alone or in both dimensions (Experiment 1). By adding a third surface dimension, we
found that discrimination accuracy was higher when regularities were present in the surface
dimension than in the color dimension, but the accuracy was the same when regularities were
present in the surface dimension alone or in all three dimensions (Experiment 2). When there
were two conflicting boundaries separately defined by two different dimensions, participants
chose the boundary defined by the surface dimension, followed by the color dimension, as more
visible than the shape dimension (Experiment 3). Moreover, participants were faster to
discriminate differences in the surface dimension, followed by the color dimension, than in the
shape dimension (Experiment 4). These results suggest that the perception of regularities in
multiple dimensions is driven by the presence of regularities in the most salient dimension.
19PERCEPTION OF MULTI-DIMENSIONAL REGULARITIES
It is important to note that in Experiments 1 and 2, each dimension contained the same
amount of regularities. That is, for all matrices, the structured half contained a sequence with a
switch rate of 0.2 and the random half contained a random sequence with a switch rate of 0.5.
This was true for the color, the shape, and the surface dimensions. Thus, there was no objective
difference in the amount of information available between the dimensions, and yet participants
were better at detecting regularities from randomness in the color dimension than the shape
dimension, and better in the surface dimension than in the color or shape dimension. This
suggests that the perception of regularities depends on not only the information available in each
dimension, but also the perceptual salience of the features in that dimension.
The current findings support the dominance hypothesis over the facilitation hypothesis.
That is, the detection of regularities from multiple dimensions is dominated by the presence of
regularities in the most salient dimension, rather than facilitated by the presence of regularities in
all dimensions. In other words, the presence of regularities in other less salient dimensions does
not seem to further help with the detection of regularities. It is worth noting that in the combined
condition in Experiment 1, the structured half contained twice as much regularities as that in the
color or shape condition. In the combined condition in Experiment 2, the structured half
contained three times as much regularities as that in the color, shape, or surface condition. This is
because the cells in the combined condition was determined by two or three independent binary
sequences of D(0.2) on separate feature dimensions. This means that cells in the structured half
contained regularities independently in multiple feature dimensions. The fact that the sequences
were independent means that features in one dimension could not predict features in a different
dimension. For an ideal observer, performance in the combined condition should be, in principle,
higher than that in the color, shape, or surface condition alone. However, for human observers,
20PERCEPTION OF MULTI-DIMENSIONAL REGULARITIES
despite the greater amount of regularities in the combined condition, they still performed at the
same level as when regularities were present in one dimension only. This suggests a bottleneck
in the perceptual integration of regularities from multiple feature dimensions. This integration
bottleneck could be due to the presence of regularities in the most salient dimension.
Experiments 3 and 4 suggest that people prioritized regularities in the most salient dimension
when multiple dimensions contained regularities. This raises the possibility that people may not
be able to attend to or process the regularities in other, less salient dimensions.
Our manipulation of salience results in longer streaks in the structured half of the matrix.
In fact, the structured half often looks more chunky than the random half, which leads to stronger
contrasts between the features in one dimension (Itti et al., 1998; Itti & Koch, 1999; Li, Levine,
An, Xu, & He, 2013). Moreover, the visual contrast of hollow and solid cells in the surface
dimension seemed greater than that in the color or shape dimension, which may have contributed
to the greater salience of the surface dimension, resulting in the prioritization of that feature
dimension (Maunsell & Treue, 2006; Saenz, Buracas, & Boynton, 2002).
The current study used a limited set of features in each dimension. It is entirely possible
that other features may change the outcome of the study. For example, if we used pink and red
instead of blue and red in the color dimension, or triangles and circles in the shape dimension,
the color dominance over shape may be weakened. An untested question is how does the
discriminability of the two features influence the detection of regularities? Based on our
experiments, we propose that the more discriminable two features are in a dimension, the more
salient the regularities are, and therefore the easier it is to detect regularities in that dimension.
In conclusion, the current study suggests that the perception of regularities from multiple
feature dimensions is driven by the presence of regularities in the most salient dimension.
21PERCEPTION OF MULTI-DIMENSIONAL REGULARITIES
Acknowledgments
We thank the Zhao Lab for helpful comments. This work was supported by NSERC Discovery
Grant (RGPIN-2014-05617 to JZ), the Canada Research Chairs program (to JZ), the Leaders
Opportunity Fund from the Canadian Foundation for Innovation (F14-05370 to JZ), and the
NSERC Canada Graduate Scholarship Master’s program and Elizabeth Young Lacey Fellowship
(to RY).
22PERCEPTION OF MULTI-DIMENSIONAL REGULARITIES
References
Bar-Hillel, M., & Wagenaar, W. A. (1991). The perception of randomness. Advances in Applied
Mathematics, 12, 428-454.
Chun, M. M., & Jiang, Y. (1998). Contextual cueing: Implicit learning and memory of visual
context guides spatial attention. Cognitive Psychology, 36, 28-71.
Faul, F., Erdfelder, E., Lang, A. G., & Buchner, A. (2007). G* Power 3: A flexible statistical
power analysis program for the social, behavioral, and biomedical sciences. Behavior
Research Methods, 39, 175-191.
Fiser, J., & Aslin, R. N. (2001). Unsupervised statistical learning of higher-order spatial
structures from visual scenes. Psychological Science, 12, 499-504.
Itti, L., Koch, C., & Niebur, E. (1998). A model of saliency-based visual attention for rapid scene
analysis. IEEE Transactions on Pattern Analysis and Machine Intelligence, 20, 1254-
1259.
Itti, L., & Koch, C. (1999, January). Comparison of feature combination strategies for saliency-
based visual attention systems. In Human Vision and Electronic Imaging (Vol. 3644, pp.
473-482).
Jiang, Y. V., Swallow, K. M., & Rosenbaum, G. M. (2013). Guidance of spatial attention by
incidental learning and endogenous cuing. Journal of Experimental Psychology: Human
Perception and Performance, 39, 285.
Lewkowicz, D. J., & Ghazanfar, A. A. (2009). The emergence of multisensory systems through
perceptual narrowing. Trends in Cognitive Sciences, 13, 470-478.
23PERCEPTION OF MULTI-DIMENSIONAL REGULARITIES
Li, J., Levine, M. D., An, X., Xu, X., & He, H. (2013). Visual saliency based on scale-space
analysis in the frequency domain. IEEE Transactions on Pattern Analysis and Machine
Intelligence, 35, 996-1010.
Maunsell, J. H., & Treue, S. (2006). Feature-based attention in visual cortex. Trends in
Neurosciences, 29, 317-322.
Otto, T., & Eichenbaum, H. (1992). Complementary roles of the orbital prefrontal cortex and the
perirhinal-entorhinal cortices in an odor-guided delayed-nonmatching-to-sample task.
Behavioral Neuroscience, 106, 762-775.
Patterson, M. L., & Werker, J. F. (2003). Two-month-old infants match phonetic information in
lips and voice. Developmental Science, 6, 191-196.
Pavlov, I. P., & Anrep, G. V. (2003). Conditioned reflexes. Courier Corporation.
Pelli, D. G. (1985). Uncertainty explains many aspects of visual contrast detection and
discrimination. JOSA A, 2, 1508-1532.
Rescorla, R. A., & Wagner, A. R. (1972). A theory of Pavlovian conditioning: Variations in the
effectiveness of reinforcement and nonreinforcement. In A. H. Black & W. F. Prokasy
(Eds.), Classical Conditioning II: Current Theory and Research (pp. 64-99). New York:
Appleton-Century-Crofts.
Saffran, J. R., Aslin, R. N., & Newport, E. L. (1996). Statistical learning by 8-month-old
infants. Science, 274, 1926-1928.
Saenz, M., Buracas, G. T., & Boynton, G. M. (2002). Global effects of feature-based attention in
human visual cortex. Nature Neuroscience, 5, 631-632.
Thompson, R. F., & Spencer, W. A. (1966). Habituation: a model phenomenon for the study of
bneuronal substrates of behavior. Psychological Review, 73, 16.

24PERCEPTION OF MULTI-DIMENSIONAL REGULARITIES
Turk-Browne, N. B., Jungé, J. A., & Scholl, B. J. (2005). The automaticity of visual statistical
learning. Journal of Experimental Psychology: General, 134, 552-564.
Turk-Browne, N. B., Isola, P. J., Scholl, B. J., & Treat, T. A. (2008). Multidimensional visual
statistical learning. Journal of Experimental Psychology: Learning, Memory, and
Cognition, 34, 399-407.
Venezky, R. L. (1970). The structure of English orthography (Vol. 82). Walter de Gruyter.
Yu, R., Gunn, J., Osherson, D., & Zhao, J. (in press). The consistency of the subjective concept
of randomness. Quarterly Journal of Experimental Psychology.
Yu, R., Osherson, D., & Zhao, J. (in press). Alternation blindness in the representation of binary
sequences. Journal of Experimental Psychology: Human Perception and Performance.
Yu, R., & Zhao, J. (2015). The persistence of attentional bias to regularities in a changing
environment. Attention, Perception, & Psychophysics, 77, 2217-2228.
Zhao, J., Al-Aidroos, N., & Turk-Browne, N. B. (2013). Attention is spontaneously biased
toward regularities. Psychological Science, 24, 667-677.
Zhao, J., Hahn, U., & Osherson, D. (2014). Perception and identification of random events.
Journal of Experimental Psychology: Human Perception and Performance, 40, 1358.
Zhao, J., & Luo, Y. (2017). Statistical regularities guide the spatial scale of attention. Attention,
Perception, & Psychophysics, 79, 24-30.