view pdf - southern · pdf filea forest model relevant to red-cockaded woodpecmrs (picoides...
TRANSCRIPT

A FOREST MODEL RELEVANT TO RED-COCKADED WOODPECmRS
(PICOIDES BOREALIS)
J.C.G. Goelz', C.C. ~ewerts', N. J. ~ e s s ~
'principal Forest Biometrician
Southern Research Station, USDA Forest Sewice, 2500 Shreveport Hwy, Pineville, LA 71360.
[email protected] (3 18)473-7227
and and Heritage Conservation Branch
U.S. Army Engineering Research and Development Center
P.O. Box 9005, Champaign, IL 61 821 -9005
3~lant Pathologist
Forest Health Protection, USDA Forest Service, 2500 Shreveport Hwy, Pineville, LA 71360
ABSTRACT. Most forest models are created with timber production as the implied primacy.
For many land managers, timber production is less important than production of habitat for
wildlife. Red-cockaded woodpeckers (RCW) are one of the priorities for management of
integrates a red-cockaded woodpecker model with forest dynamics is being produced. This
paper describes the forest dynamics part of the model. Foraging habitat for RCW is largely
determined by sufficient numbers of larger pine trees, scarcity of hardwoods in the
overstory and midstory, and the presence of an appropriate understory community. A
diameter class model seems well-suited for the pine component of the stands. We chose to
modify the existing Southpro model. Southern pine decline and root diseases are having a
large effect on forests of the installation. The effects of disease will be implemented as a
separate knowledge-based model.
The principal applications of forest models are directed towards timber production. Models
are often used for inventory updating, harvest scheduling, and evaluating silvicultural practices.
Goelz, J.C.G.; Rewerts, C.C.; Hess, N.J. 2005. A forest model relevant to red-cockaded woodpeckers (Picoides borealis). In: Strub, M.R.; Cieszewski, C.J., eds. Proceedings of the 2nd international conference on forest measurements and quantitative methods and management and the 2004 southern mensurationists meeting; 2004 June 15-1 8; Hot Springs, AR. Weyerhaeuser Corporation and University of Georgia. [12 pages in a nonpaginated compact diskl.

However, a forest provides more than timber. Among other things, forests provide habitat for wildlife.
On some (typically public) forests, management for wildlife, particularly endangered species, is
parkmciunt. Modeling forests as wildlife habitat requires that the pqkinent descriptors of habitat quality
be predicted. For example, if quality habitat for a wildlife species was determined, in part, by large
trees of a particular species, a model that aggregates species and size into stand-level variables like
basal area or volume per acre would be unsatisfactory.
2 LAND MANAGERS AT FORT BENNING NEED A MODEL
Fort Benning is an army installation located along the Georgia-Alabama border adjacent to
Columbus, GA. It comprises over 180,000 acres. After excluding bottomlands, cantonment, and
impact areas, over 90,000 acres of upland forest are actively managed, and habitat for red cockaded
woodpecker (Picoides borealis) is one of the emphases of management. The natural vegetation for
upland stands in the area is longleaf pine (Pinus palustris Mill), although currently loblolly pine (Pinus
taeda L.) is the predominant conifer. Mixed natural stands of pines (loblolly, shortleaf (Pinus echinata
Mill.), and longleaf) and mixtures of pines and hardwoods are the most-abundant forest types on the
uplands. Conversion to longleaf pine stands occurs gradually as stands are regenerated. Longleaf is
preferred as it is the natural vegetation that existed prior to settlement as well as being the preferred
habitat for the woodpecker. Longleaf pine is preferred for the woodpecker as the tree is long-lived and
thus may provide a habitat of mature pines for a longer time than the other southern pines. Fire is
another component of the management directed towards producing suitable habitat for red cockaded
woodpecker. The fort has over 200 active woodpecker clusters and has a goal of 361 (U.S. Fish and
Wildlife Service 2003).
Land managers for the installation have observed significant mortality of southern pine,
primarily loblolly and shortleaf, within the last decade. While patches of mortality caused by southern
pine beetle (Dendroctonusfi-ontalis) have been a long-term recurrent phenomenon, the more recent
mortality seems to be caused by littleleaf disease on heavy soils and loblolly decline on sandy soils.
Loblolly decline involves Leptographium spp. root pathogen (Eckhardt 2003). The diseases have the
potential to reduce the extent of suitable habitat for the woodpecker. Mortality caused by the disease is
most common in stands over 30 years old; currently 85 percent of the natural loblolly, shortleaf, and
mixed pine stands of the fort are 30 years or older.

Given a forest that seems at risk to the pathogens, and an animal population that requires
mature pine stands, the land managers of Fort Benning sought to obtain a model that would simulate
the dynamics of the forest habitat and the woodpecker population and would allow them to explore
alternative management practices The overall architecture of the simulation model is DIAS, Dynamic
Information Architecture System (Christiansen 2000, Hummel and Christiansen 2002, Sydelko and
others 2003). DIAS is a framework and programming toolset developed to integrate numerous models.
Rewerts and others (2000) used DIAS to implement an individual-based spatially-explicit model of a
red-cockaded woodpecker population, based on an existing RCW model of Letcher and others (1998).
The DIAS-implemented model for Fort Benning will include this RCW model, models of land
management, as well as models that describe the dynamics of the forest. This paper describes the basis
for the forest dynamics model.
3 FOREST DYNAMICS PORTION OF A MULTIDISCIPLINARY MODEL
The forest dynamics model will be broken into three main components: (1) the main model that projects
existing stands; (2) the disease submodel that specifies the inception and effects of the disease, and (3) a
regeneration model that populates stands that have been artificially or naturally regenerated.
3.1 Selecting a Model. The structure of the forest dynamics model should predict the forest parameters
that are suspected to determine the quality of RCW habitat. Foraging habitat has been described (U.S.
Fish and Wildlife Service 2003, pages 188-194 and appendix 5). The values for tree measurements are
found in table 1. The description of foraging habitat imply a forest dynamics model that: (1) segregates
pine from hardwoods; (2) provides number of trees in at least broad size classes for pines; (3) less
resolution is needed for hardwoods, with negligible interest in stands without a pine component.
Management of the forests at Fort Benning also dictate some characteristics of the model. While the
foraging guidelines do not segregate longleaf pine from the other pines, longleaf pine is managed
differently, and thus it should also be segregated. Although almost all stands are currently even-aged at
Fort Benning, management will convert them to uneven-aged longleaf pine dominated stands over time.
Thus, the model should provide for natural regeneration following uneven-aged harvest cuts. Fire is

also a regular management tool, so fire effects should be included in the model. We will describe
incorporation of root disease effects in a later section.
Table 1: Stand parameters that describe foraging habitat for red cockaded woodpeckers
(U.S. Fish and Wildlife Service 2003).
Minimum basal area 20frz/acre
Private Land Stand Component Public Land
Minimum 18 treeslacre
dbh
Minimum basal area 20ft2/acre
Pine stems 2 14 in. dbh
10 in. dbh 5 Pine stems 5 14 in.
I I
Pine stems 210 in. dbh I Minimum basal area 40 ft2/acre I Basal area 40 to 70 @/acre
(60 years or older)
Basal area 0 to 40 ft2/acre
Maximum 20 treeslacre
(30 years or older)
Basal area 0 to 40 ft2/acre
Pine stems < 10 in. dbh
(pine and hardwoods)
Maximum basal area 10 ft2/acre,
I I
Maximum basal area 20 ft2/acre
Total basal area
4 0 percent of canopy trees in Maximum hardwood basal area
Maximum basal area 80 ft2/acre
Hardwoods No hardwood midstory.
longleaf pine stands,
stands. I
No hardwood midstory.
is 80 ft2/acre minus pine basal
<30 percent of canopy trees in
loblolly and shortleaf pine
Although there is some inventory data available from Fort Benning, we do not consider it to be
adequate to develop a model de novo. However, the inventory data is sufficient to grossly evaluate a
model and perhaps to makes some minor modifications upon the model. Thus, we chose to base the
rnodel for Fort Benning on an existing forest model called Southpro (Schulte and others 1998, Lin and
area (which has a minimum of
40 ft2/acre).
others 1998). It is a diameter class model, which predicts the transition of trees from one class to

another, mortality, and ingrowth of stems into the smallest diameter class. It includes three species
groups, softwood, hard hardwood, and soft hardwood. The model acts on an annual timestep. There
are economics and diversity components of the model, but these will not be used.
3.2 Revisions to Southpro. We will make numerous revisions of the Southpro model to apply it to the
conditions at Fort Benning. In approximate order of priority are: (1) add longleaf pine as an additional
species group; (2) increase maximum diameter class to 30+ inches from the current 26 inch dbh class
(3) include root disease effects; (4) include fire effects, particularly on recruitment; (5) change diameter
class limits to coincide with recovery plan; (6) bound mortality and transition functions to [0,1]; (7) deal
with maximum diameter projection bias of all size-class models; (8) adjust ingrowth of soflwoods for
young even-aged stands, particularly plantations; (9) deal with bias of transition due to the shape of the
diameter distribution; (10) localize growth (i.e. transition) functions to be specific to Fort Benning; (1 1)
constrain to maximum stand density index. Revisions (I), (2) and (4) reflect management practices at
Fort Benning. Revision (3) incorporates a primary driving force behind stand dynamics at Fort
Benning. Revision (5) simplifies application of model results to recovery plan criteria. Revision (6)
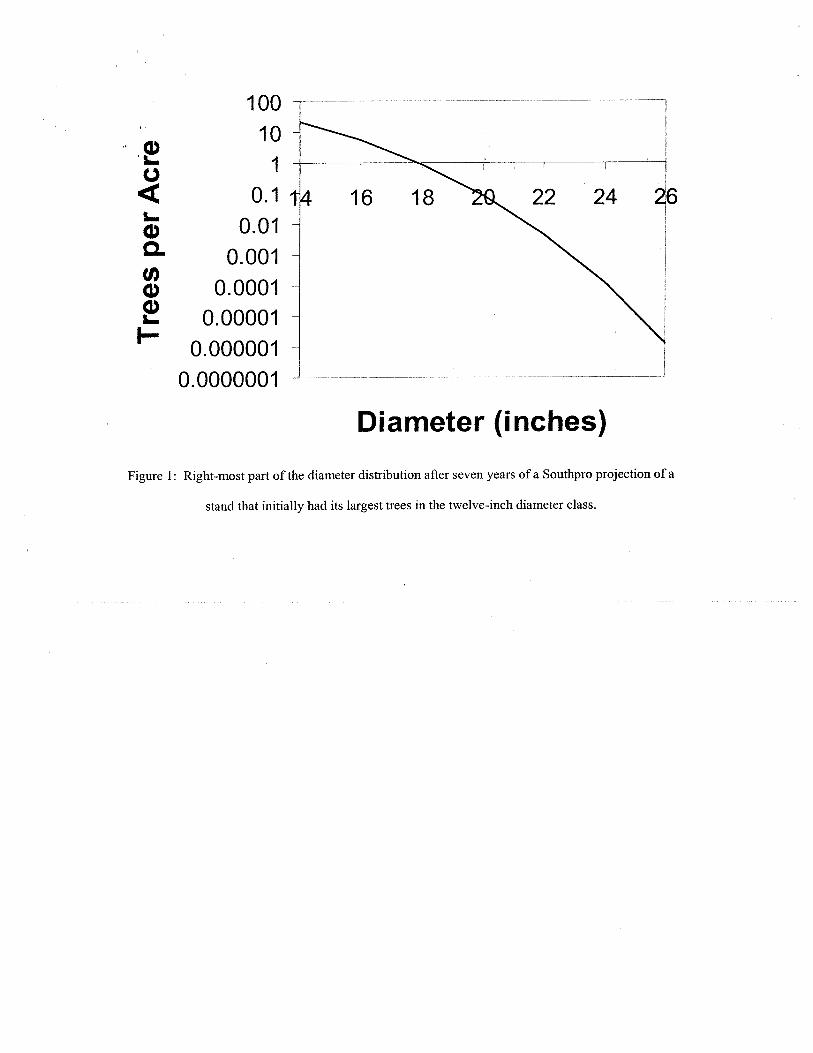
excludes impossible values for transition and mortality probabilities. Revision (7) will fix a problem
with size-class models; if the largest tree is in the "nth" size class at the start of the simulation, the
largest tree will be in the "n plus in-th class after "i" projection cycles. For example, if the largest tree
was initially in the twelve inch diameter class (1 1-to-13 inches), after seven years, the largest tree
would be in the twenty-six inch diameter class (25-to-27 inches), although the predicted number of trees
in the class would be very small (Figure 1). Diameter growth of over 12 inches in 7 years is not
possible In these stands. Revision (8) will insure that ingrowth does not occur in a young stand in the
stem exclusion phase (Oliver 198 1). Revision (9) reflects a problem with all standard diameter class
models (Goelz 2002). Revision (lo) will make the model more specific to Fort Benning. Revision (1 1)
ensures that projections will not exceed reasonable bounds; indications are that Southpro may
somewhat exceed maximum basal area for loblolly pine (Figure 2).
Diameter (inches)
Figure 1: Right-most part of the diameter distribution after seven years of a Southpro projection of a
stand that initially had its largest trees in the twelve-inch diameter class.
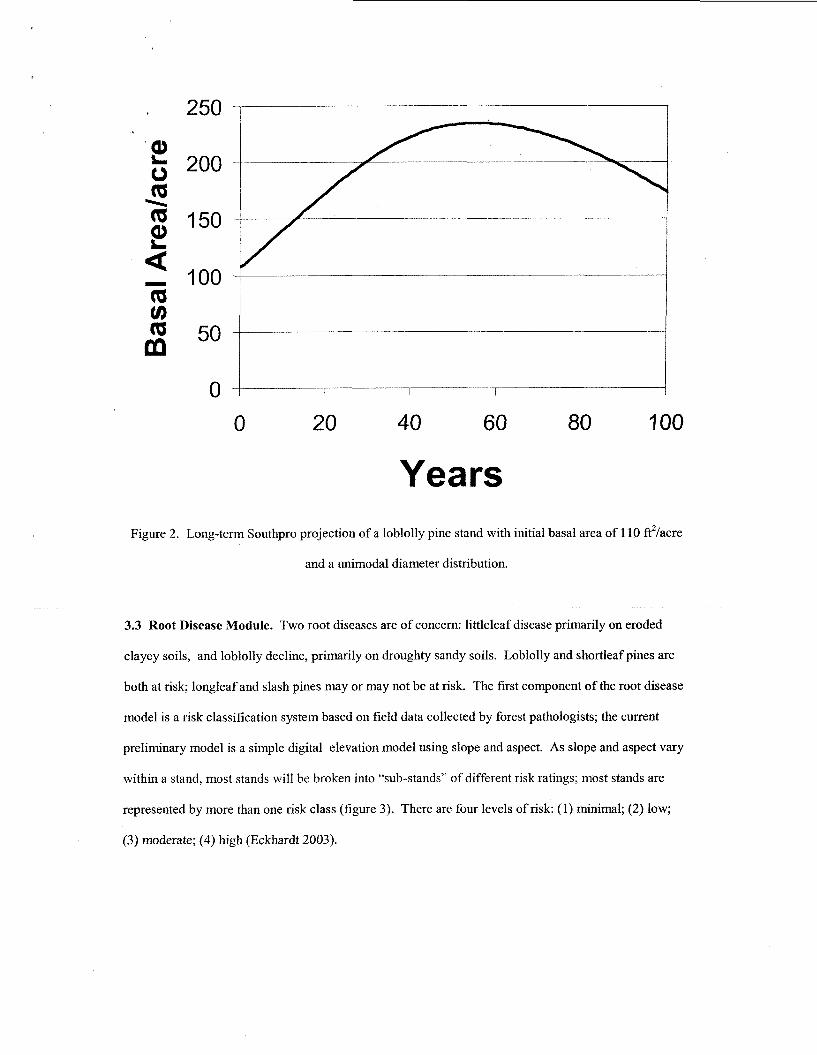
Years Figure 2. Long-term Southpro projection of a loblolly pine stand with initial basal area of 110 ft2/acre
and a unimodal diameter distribution.
3.3 Root Disease Module. Two root diseases are of concern: littleleaf disease primarily on eroded
clayey soils, and loblolly decline, primarily on droughty sandy soils. Loblolly and shortleaf pines are
both at risk; longleaf and slash pines may or may not be at risk. The first component of the root disease
model is a risk classification system based on field data collected by forest pathologists; the current
preliminary model is a simple digital elevation model using slope and aspect. As slope and aspect vary
within a stand, most stands will be broken into "sub-stands" of different risk ratings; most stands are
represented by more than one risk class (figure 3). There are four levels of risk: (1) minimal; (2) low;
(3) moderate; (4) high (Eckhardt 2003).

Figure 3. An arbitrary piece of Fort Benning with lines indicating stand boundaries and shading
indicating risk of root disease (white=minimal risk to darkest=high risk).
Preliminary investigations suggest the age at which symptoms appear vary little among risk
classes. Thus we are currently considering chance of inception to be common among risk classes; when
the pathology investigations are more complete, each risk class may have a unique cumulative risk of
inception (figure 4). Disturbance can hasten symptoms. Relevant disturbances are fire, logging, wet-
weather trafficking of military equipment or firing ranges. Disturbed stands may exhibit symptoms
starting at age 15. Disturbance may not be explicitly modeled, although it is in our preliminary work,
because disturbance is standard operating procedure for the repeatedly-burned upland stands.

0 I 0 20 30 40 50 60 70
Age (years) Figure 4. Different models for inception of risk. The dashed-and-dotted line represents a deterministic
model where all stands are symptomatic at age 35. The dashed line represents a model where
symptoms may occur as early as age 20, with roughly 50 percent of stands showing symptoms by age
35. The dotted line differs from that by increased probability for symptoms after disturbance at age 25.
The solid line represents a reduced probability for symptomology which differs from the dashed line by
halving the rate parameter of the function.
Although the rate of inception of the symptoms may be common among risk classes, the
degree of the symptoms vary greatly. Stands with a minimal risk class are basically asymptomatic.
Stands with low risk produced slightly decreased growth. Moderate risk produces significantly
decreased growth and some mortality. Symptoms on high risk sites include large reductions in growth
of surviving trees and severe mortality that reduces basal area to about 20 piacre within a few years.
The root disease module will be implemented as a combination of pathology research results on Ft.

Benning and expert opinion are integrated as modifiers of Southpro transition, mortality, and
recruitment functions. Hypothetical differences in stand development foi the four different risk classes
are shown in figure 5.
Age (years)
Figure 5. Hypothetical projection of basal area of stands of minimal (solid line), low (dashed line),
moderate (dashed-and-dotted line), and high risk (dotted line) starting from the same basal area and age
with inception of symptoms occurring at age 30.
3.4 Regeneration Module. The Southpro model already includes recruitment. Thus, the only
regeneration component that is lacking is regeneration following an even-aged regeneration harvest. As
the RCW foraging habitat criteria suggest stands less than thirty (or 60) years old provide no foraging
opportunity, early stand development is largely immaterial. Thus, we will populate a harvested stand at
the earlier of: (1) age 30; (2) time of first thinning. For plantations, the loblolly pine model of Harrison
and Borders (1996), the longleaf pine model of Lohrey and Bailey (1977), and the slash pine model of
Pienaar, Shiver and Rheney (1996) will be used to populate the stand table. For stands that have been
naturally regenerated, we will use data from the inventory of the installation to produce a stand table as
the average by classes of site index for a given forest type and age, assuming the same forest type as the

previous stand will be regenerated. At whatever age the data for the.rege;nerated stand is produced,
further projection of the stand will be determined by the Southpro equations. Before the stand is
populated, null values will be given for number of trees in each diameter class.
Christiansen, J.H. 2000. A flexible object-based software framework for modeling complex systems
with interacting natural and societal processes. Proceeding of the 4th International Conference
on Integrating GIs and Environmental Modeling (GIS/EM4): Problems, Prospects and
Research Needs. Banff, Alberta. 2-8 September 2000.
Eckhardt, L.G. 2003. Biology and ecology of Leptographium species and their vectors as components
of loblolly decline. Ph.D. Dissertation, Louisiana State University, Baton Rouge, LA.
Goelz, J.C.G. 2002. Forest Growth and Yield Models Viewed From a Different Perspective. Math,
Modeling and Sci. Computing. 13(3-4): 177-1 89.
Harrison, W:M. and B.E. Borders. 1996. Yield prediction and growth projection for site-prepared
loblolly pine plantations in the Carolinas, Georgia, Alabama, and Florida. . Athens, GA.
Plantation Management Research Cooperative, Warnell School of Forest Resources, The
University of Georgia. PMRC Technical Rept. 1996-1. 59pp.
Hurnrnel, J.R. and J.H. Christiansen. 2002. The dynamic information architecture system: A
simulation framework to provide interoperability for process models. Simulation
Interoperability Standards Organization 2002 Spring Simulation Interoperability Workshop ;
Orlando, FL ; Mar 10- 15,2002.
Letcher, B.H., J.A. Priddy, J.R. Walters, and L.B. Crowder. 1998. An individual-based, spatially-
explicit simulation model of the population dynamics of the endangered red-cockaded
woodpecker, Picoides borealis. Biological Conservation 86: 1-14.
Lohrey, R.E. and R.L. Bailey. 1977. Yield tables and stand structure for unthinned longleaf pine
plantations in Louisiana and Texas. Res. Pap. SO-133. New Orleans, LA: U.S.D.A. Forest
Service, Southern For. Exp. Sta.,. 53p.
Lin, C.R., J. Buongiorno, J. Prestemon, K. Skog. 1998.Growth model for uneven-aged loblolly pine
stands-Simulations and management implications. Res. Pap. FPL-RP-569. Madison, WI:
U.S.D.A., Forest Service, Forest Products Lab. 13p.

Oliver, C. D. 1981. Forest development in North America following major disturbances. Forest Ecology
and Management 3: 153-168.
Rienaar, L.V., B.D. Shiver, and J.W. Rheney. 1996. Yield prediction for mechanically site-prepared , ,
slash pine plantation in the Southeastern Coastal Plain. Athens: GA. Plantation Management
Research Cooperative, Warnell School of Forest Resources, The University of Georgia.
PMRC Technical Rept. 1996-3. 57pp.
Rewerts, C.C., P.J. Sydelko, J.E. Dolph, A.M. Shapiro, and T.N. Taxon, Jr. 2000. An object-oriented,
individual-based, spatially explicit environmental model: A discussion of the approach to
implementing the system. Proceedings of the 4' International Conference on Integrating GIs
and Environmental Modeling (GISlEM4): Problems, Prospects and Research Needs. Banff,
Alberta. 2-8 September 2000. Paper 15 1,7pp.
Schulte, B., J. Buongiorno, C.R Lin, K. Skog. 1998. Southpro: a computer program for managing
uneven-aged loblolly pine stands. Gen. Tech. Rep. FPL-GTR-112. Madison, WI: U.S.D.A.,
Forest Service, Forest Products Lab. 47p.
Sydelko, P. J., J.E. Dolph, and J.H. Christiansen. 2003. A flexible object-oriented software framework
for developing complex multimedia simulations. In proceedings, Wessex Institute of
Tech.;Univ. of Cadiz International Conference on Prevention, Assessment, Rehabitation and
Development of Brownfields Sites ; Cadiz, Spain ; Sep 2-4, 2002 Brownfield Sites :
Assessment, Rehabilitation, and Development ; edited by C. A. Brebbia, et al., WIT Press : pp.
U.S. Fish and Wildlife Service. 2003. Recovery plan for the red-cockaded woodpecker (Picoides
borealis): second revision. U.S. Fish and Wildlife Service, Atlanta, GA. 296 pp.