view or print 3rd quarter earnings press release
TRANSCRIPT
^ Q2 2016 results have been adjusted to reflect the early adoption of ASU 2016-09, “Compensation - Stock Compensation (Topic 718): Improvements to Employee Share-Based Payment Accounting.” See Adoption of the New Accounting Standard Related to Share-Based Compensation section for additional details related to the adjustment.
News ReleaseInvestor Contact: Media Contact:Mark Bette Doug Holt(312) 444-2301 (312) [email protected] [email protected]
https://www.northerntrust.com
FOR IMMEDIATE RELEASE
NORTHERN TRUST CORPORATION REPORTS THIRD QUARTER NET INCOMEOF $257.6 MILLION, EARNINGS PER COMMON SHARE OF $1.08
EARNINGS PER SHARE GROWTH OF 13%RETURN ON AVERAGE COMMON EQUITY OF 11.7%
ASSETS UNDER CUSTODY GROWTH OF 13%
CHICAGO, OCTOBER 19, 2016 — Northern Trust Corporation today reported third quarter net income per
diluted common share of $1.08, compared to $0.96 in the third quarter of 2015 and $1.10^ in the second
quarter of 2016. Net income was $257.6 million, compared to $234.6 million in the prior-year quarter and
$263.0 million^ in the prior quarter. Return on average common equity was 11.7%.
“Northern Trust performed well in the third quarter of 2016, producing 1.3 points of positive operating
leverage and driving our expense-to-fee ratio lower to 107%. Total revenue grew 5% versus one year ago,
with strong growth in net interest income and steady growth in trust, investment and other servicing fees,
partially offset by lower foreign exchange trading income. Expenses were well managed, growing 4% versus
one year ago. Earnings per share of $1.08 increased a strong 13% compared to one year ago, and we
increased our quarterly cash dividend by 6% to $0.38 per common share,” said Frederick H. Waddell,
Chairman and Chief Executive Officer.
The prior quarter included a net pre-tax gain in revenue of $96.6 million from the sale of Visa Inc.
Class B common shares, partially offset by impairment charges associated with our leasing portfolio, and
expense charges of $82.6 million relating to certain securities lending litigation, contractual modifications
associated with certain existing asset servicing clients, and severance and other personnel related charges.
Excluding these items, prior quarter net income per diluted common share, net income and return on average
common equity were $1.07^, $255.0 million^ and 11.9%^, respectively.

- 2 -THIRD QUARTER 2016 RESULTS
SUMMARY RESULTS & KEY METRICS% Change vs.
($ In Millions except per share data) Q3 2016 Q2 2016^ Q3 2015 Q2 2016 Q3 2015Total Revenue (FTE*) $ 1,220.7 $ 1,323.6 $ 1,161.6 (8)% 5%Noninterest Expense 843.0 925.0 812.3 (9) 4Provision for Credit Losses (3.0) (3.0) (10.0) — (70)Provision for Income Taxes 116.1 131.7 118.6 (12) (2)Net Income 257.6 263.0 234.6 (2) 10Net Income Applicable to Common Stock 251.7 257.2 228.8 (2) 10
Diluted Earnings per Common Share $ 1.08 $ 1.10 $ 0.96 (2)% 13%
Return on Average Common Equity 11.71% 12.30% 10.91%Return on Average Assets 0.88% 0.92% 0.85%
Average Assets $ 116,382.5 $ 114,913.8 $ 109,924.1 1 % 6%
(*) Total revenue and net interest income presented on a fully taxable equivalent (FTE) basis are non-generally accepted accounting principle financial measures that facilitate the analysis of asset yields. Please refer to the Reconciliation of Reported Total Revenue and Net Interest Income section for further detail.
(^) Q2 2016 results have been adjusted to reflect the early adoption of ASU 2016-09, “Compensation - Stock Compensation (Topic 718): Improvements to Employee Share-Based Payment Accounting.” See Adoption of the New Accounting Standard Related to Share-Based Compensation section for additional details related to the adjustment.
CLIENT ASSETS
Assets under custody/administration (AUC/A) and assets under management are the primary drivers of the
Corporation’s trust, investment and other servicing fees, the largest component of noninterest income. Assets
under custody/administration totaled $8.50 trillion at September 30, 2016, up $379.9 billion, or 5%, from
$8.12 trillion at June 30, 2016. The following table presents the Corporation’s assets under custody, a
component of AUC/A, and assets under management by reporting segment.
As of % Change vs.
($ In Billions)September 30,
2016June 30,
2016September 30,
2015June 30,
2016September 30,
2015Assets Under Custody Corporate & Institutional Services (C&IS) $ 6,173.6 $ 5,838.6 $ 5,460.6 6% 13% Wealth Management 533.2 514.2 495.8 4 8 Total Assets Under Custody $ 6,706.8 $ 6,352.8 $ 5,956.4 6% 13%Assets Under Management Corporate & Institutional Services $ 703.6 $ 672.3 $ 661.5 5% 6% Wealth Management 242.2 233.9 225.3 4 8 Total Assets Under Management $ 945.8 $ 906.2 $ 886.8 4% 7%

- 3 -THIRD QUARTER 2016 RESULTS (continued)
TOTAL REVENUE (FTE)% Change vs.
($ In Millions except per share data) Q3 2016 Q2 2016 Q3 2015 Q2 2016 Q3 2015Noninterest Income $ 910.6 $ 1,017.0 $ 886.6 (10)% 3%Net Interest Income (FTE*) 310.1 306.6 275.0 1 13Total Revenue (FTE*) $ 1,220.7 $ 1,323.6 $ 1,161.6 (8)% 5%
(*) Total revenue and net interest income presented on a fully taxable equivalent (FTE) basis are non-generally accepted accounting principle financial measures that facilitate the analysis of asset yields. Please refer to the Reconciliation of Reported Total Revenue and Net Interest Income section for further detail.
Noninterest Income% Change vs.
($ In Millions) Q3 2016 Q2 2016 Q3 2015 Q2 2016 Q3 2015Noninterest Income Trust, Investment and Other Servicing Fees $ 788.3 $ 777.2 $ 749.1 1 % 5% Foreign Exchange Trading Income 53.6 64.4 62.9 (17) (15) Treasury Management Fees 15.0 16.0 16.1 (6) (7) Security Commissions and Trading Income 20.4 20.6 20.4 (1) — Other Operating Income 33.1 141.2 38.1 (77) (13) Investment Security Gains (Losses), net 0.2 (2.4) — N/M N/MTotal Noninterest Income $ 910.6 $ 1,017.0 $ 886.6 (10)% 3%
Q3 2016 vs. Q2 2016
Trust, investment and other servicing fees increased primarily due to new business and favorable equity markets, partially offset by the unfavorable impact of movements in foreign exchange rates.
Foreign exchange trading income decreased due to lower client volumes and currency volatility.
Other operating income in the prior quarter included the pre-tax gain on the sale of 1.1 million Visa Inc. Class B common shares, net of the valuation adjustment to existing swap agreements, totaling $118.2 million, offset by $18.9 million of the total impairment charges and loss on sale related to the decision to exit a portion of a non-strategic loan and lease portfolio and impairment charges related to the residual value of certain aircraft and rail cars. The current quarter included $5.4 million of impairment charges and loss on sales related to a non-strategic loan and lease portfolio. In addition, the current quarter was impacted by a $2.3 million charge related to the valuation adjustment to existing Visa swap agreements.
Q3 2016 vs. Q3 2015
Trust, investment and other servicing fees increased primarily due to lower money market mutual fund fee waivers and new business, partially offset by the unfavorable impact of movements in foreign exchange rates.
Foreign exchange trading income decreased due to lower client volumes.
Other operating income decreased primarily due to $5.4 million of impairment charges and loss on sales related to a non-strategic loan and lease portfolio.
- 4 -THIRD QUARTER 2016 RESULTS (continued)
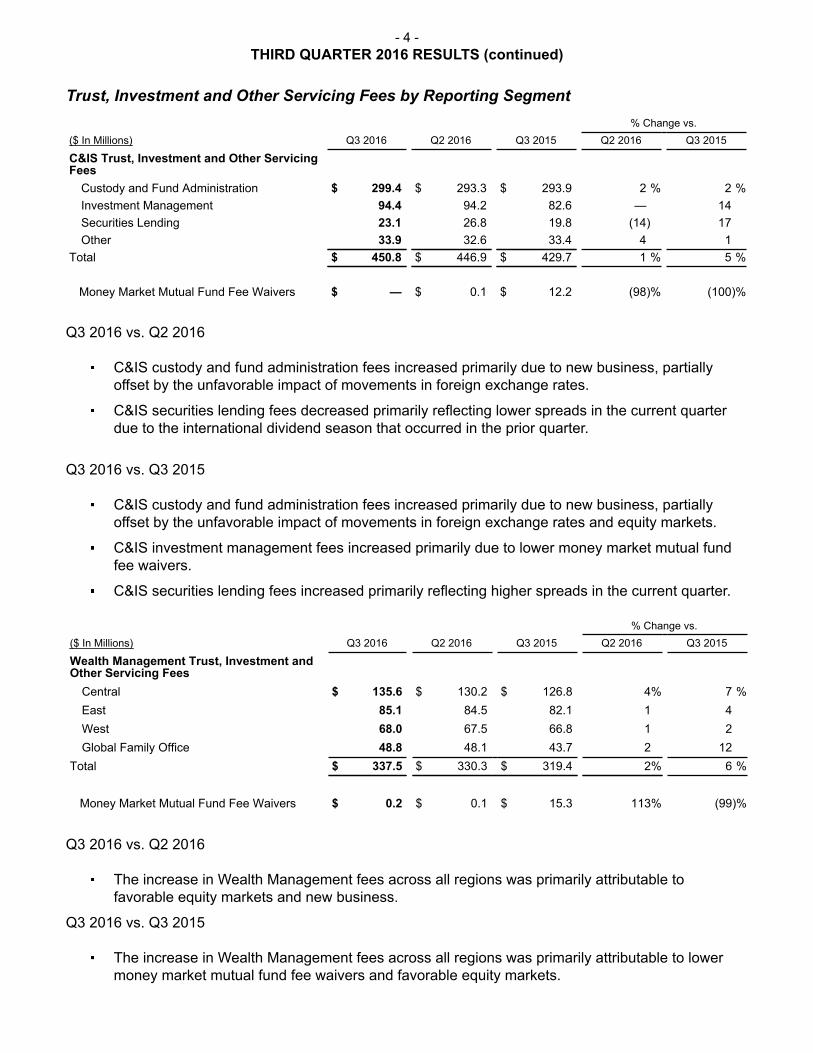
Trust, Investment and Other Servicing Fees by Reporting Segment% Change vs.
($ In Millions) Q3 2016 Q2 2016 Q3 2015 Q2 2016 Q3 2015
C&IS Trust, Investment and Other ServicingFees
Custody and Fund Administration $ 299.4 $ 293.3 $ 293.9 2 % 2 %Investment Management 94.4 94.2 82.6 — 14Securities Lending 23.1 26.8 19.8 (14) 17Other 33.9 32.6 33.4 4 1
Total $ 450.8 $ 446.9 $ 429.7 1 % 5 %
Money Market Mutual Fund Fee Waivers $ — $ 0.1 $ 12.2 (98)% (100)%
Q3 2016 vs. Q2 2016
C&IS custody and fund administration fees increased primarily due to new business, partially offset by the unfavorable impact of movements in foreign exchange rates.
C&IS securities lending fees decreased primarily reflecting lower spreads in the current quarter due to the international dividend season that occurred in the prior quarter.
Q3 2016 vs. Q3 2015
C&IS custody and fund administration fees increased primarily due to new business, partially offset by the unfavorable impact of movements in foreign exchange rates and equity markets.
C&IS investment management fees increased primarily due to lower money market mutual fund fee waivers.
C&IS securities lending fees increased primarily reflecting higher spreads in the current quarter.
% Change vs.($ In Millions) Q3 2016 Q2 2016 Q3 2015 Q2 2016 Q3 2015
Wealth Management Trust, Investment andOther Servicing Fees
Central $ 135.6 $ 130.2 $ 126.8 4% 7 %East 85.1 84.5 82.1 1 4West 68.0 67.5 66.8 1 2Global Family Office 48.8 48.1 43.7 2 12
Total $ 337.5 $ 330.3 $ 319.4 2% 6 %
Money Market Mutual Fund Fee Waivers $ 0.2 $ 0.1 $ 15.3 113% (99)%
Q3 2016 vs. Q2 2016
The increase in Wealth Management fees across all regions was primarily attributable to favorable equity markets and new business.
Q3 2016 vs. Q3 2015
The increase in Wealth Management fees across all regions was primarily attributable to lower money market mutual fund fee waivers and favorable equity markets.

- 5 -THIRD QUARTER 2016 RESULTS (continued)
Net Interest Income% Change vs.
($ In Millions) Q3 2016 Q2 2016 Q3 2015 Q2 2016 Q3 2015Net Interest Income Interest Income (FTE*) $ 356.2 $ 351.6 $ 311.8 1% 14% Interest Expense 46.1 45.0 36.8 2 25Net Interest Income (FTE*) $ 310.1 $ 306.6 $ 275.0 1% 13%
Average Earning Assets $ 107,844 $ 106,614 $ 100,809 1% 7%Net Interest Margin (FTE*) 1.14% 1.16% 1.08%
(*) Total revenue and net interest income presented on a fully taxable equivalent (FTE) basis are non-generally accepted accounting principle financial measures that facilitate the analysis of asset yields. Please refer to the Reconciliation of Reported Total Revenue and Net Interest Income section for further detail.
Q3 2016 vs. Q2 2016
Net interest income on an FTE basis in the prior quarter included a pre-tax impairment charge related to the residual value of certain aircraft and rail cars of $2.7 million. Excluding the impact of the prior-quarter pre-tax charge, net interest income on an FTE basis was up slightly compared to the prior quarter.
Average earning assets increased compared to the prior quarter, primarily resulting from higher levels of securities, partially offset by a reduction in short-term interest-bearing deposits and loans and leases.
Excluding the impact of the prior quarter pre-tax charge, the net interest margin on an FTE basis decreased primarily reflecting lower yields on earning assets.
Q3 2016 vs. Q3 2015
Net interest income on an FTE basis increased compared to the prior-year quarter, primarily the result of a higher net interest margin and an increase in earning assets.
Average earning assets increased compared to the prior-year quarter, primarily resulting from higher levels of securities. Earning asset growth was funded primarily by a higher level of borrowed funds and interest-bearing and demand deposits.
The net interest margin on an FTE basis was higher due to higher yields on earning assets driven by the higher interest rate environment, partially offset by higher premium amortization.

- 6 -THIRD QUARTER 2016 RESULTS (continued)
PROVISION FOR CREDIT LOSSESAs of and for the three-months ended, % Change vs.
($ In Millions)September 30,
2016June 30,
2016September 30,
2015June 30,
2016September 30,
2015
Allowance for Credit LossesBeginning Allowance for Credit Losses $ 227.1 $ 232.6 $ 274.2 (2)% (17)%Provision for Credit Losses (3.0) (3.0) (10.0) — (70)Net Recoveries / (Charge-Offs) 0.8 (2.4) (9.4) (133) (109)Effect of Foreign Exchange Rates — (0.1) (0.1) (100) (100)
Ending Allowance for Credit Losses $ 224.9 $ 227.1 $ 254.7 (1)% (12)%
Allowance assigned to:Loans and Leases $ 191.0 $ 192.0 $ 242.2 (1)% (21)%Undrawn Commitments and Standby Letters of Credit 33.9 35.1 12.5 (3) 171
Ending Allowance for Credit Losses $ 224.9 $ 227.1 $ 254.7 (1)% (12)%
Q3 2016 vs. Q2 2016
The credit provision in the current quarter was primarily driven by a reduction in outstanding loans and improved credit quality in the residential real estate portfolio, partially offset by an increase in the specific reserve requirement for the commercial portfolio. The credit provision in the prior quarter was driven by improved credit quality in the commercial real estate portfolio, a reduction in outstanding loans, and improved credit quality in the residential real estate portfolio.
Q3 2016 vs. Q3 2015
The credit provision in the prior-year quarter was driven by improved credit quality across the loan portfolio. The decrease in the allowance for credit losses from the prior-year quarter was driven by improved credit quality across the loan and lease portfolio. Nonperforming loans and leases in the current quarter were $173.3 million compared to $198.6 million in the prior-year quarter.

- 7 -THIRD QUARTER 2016 RESULTS (continued)
NONINTEREST EXPENSE% Change vs.
($ In Millions) Q3 2016 Q2 2016 Q3 2015 Q2 2016 Q3 2015Noninterest Expense
Compensation $ 382.1 $ 389.5 $ 361.6 (2)% 6%Employee Benefits 73.2 72.2 69.8 1 5Outside Services 157.6 159.0 158.3 (1) —Equipment and Software 114.5 118.0 113.6 (3) 1Occupancy 44.2 45.3 43.7 (2) 1Other Operating Expense 71.4 141.0 65.3 (49) 9
Total Noninterest Expense $ 843.0 $ 925.0 $ 812.3 (9)% 4%
End of Period Full-Time Equivalent Staff 16,900 16,600 16,000 2 % 6%
Q3 2016 vs. Q2 2016
Excluding severance and related charges of $13.0 million in the prior quarter, compensation expense increased $5.6 million due to current quarter severance charges, performance-based incentive compensation, and higher salary expense.
Excluding severance and related charges of $1.5 million in the prior quarter, employee benefits expense increased due to higher medical expense.
Excluding severance and related charges of $0.7 million in the prior quarter, expense for outside services remained relatively unchanged.
Equipment and software expense decreased compared to the prior quarter, primarily reflecting a reduction in software amortization and software dispositions.
Other operating expense in the prior quarter included a pre-tax charge in connection with an agreement to settle certain securities lending litigation of $46.5 million, charges related to contractual modifications associated with existing Corporate and Institutional Services clients of $18.6 million, and other personnel charges of $2.3 million. Excluding these charges, other operating expense decreased compared to the prior quarter, primarily due to a reduction in various other miscellaneous expenses, partially offset by a $3.5 million charge in connection with the settlement of the remaining securities lending litigation, as well as higher FDIC deposit protection expense.
Q3 2016 vs. Q3 2015
Compensation expense increased compared to the prior-year quarter, primarily reflecting higher salary expense and increased performance-based incentive compensation.
Employee benefits expense increased compared to the prior-year quarter, primarily related to higher medical expense, partially offset by lower pension expense.
Other operating expense increased compared to the prior-year quarter, primarily due to a $3.5 million charge in connection with the settlement of the remaining securities lending litigation as well as higher FDIC deposit protection expense.

- 8 -THIRD QUARTER 2016 RESULTS (continued)
PROVISION FOR INCOME TAX% Change vs.
($ In Millions) Q3 2016 Q2 2016^ Q3 2015 Q2 2016 Q3 2015Net Income
Income before Income Taxes $ 373.7 $ 394.7 $ 353.2 (5)% 6%Provision for Income Taxes 116.1 131.7 118.6 (12) (2)
Net Income $ 257.6 $ 263.0 $ 234.6 (2)% 10%
Effective Tax Rate 31.1% 33.4% 33.6%
(^) Q2 2016 has been adjusted to reflect the early adoption of ASU 2016-09, “Compensation - Stock Compensation (Topic 718): Improvements to Employee Share-Based Payment Accounting.” See Adoption of the New Accounting Standard Related to Share-Based Compensation section for additional details related to the adjustment.
Q3 2016 vs. Q2 2016
The decrease in the provision for income taxes compared to the prior quarter was based primarily on decreased income before income taxes and a lower effective tax rate driven by changes in the earnings mix in tax jurisdictions in which the Corporation operates. In addition, the lower tax rate can be attributed to the Corporation adopting the new share-based compensation accounting standard (ASU 2016-09) in the quarter, which resulted in a net income tax benefit of $6.4 million. The prior quarter income tax provision has been revised to include a $2.3 million benefit as a result of the adoption of the new standard. The increase in the net benefit in the current quarter was driven by an increase in stock options being exercised.
Q3 2016 vs. Q3 2015
The decrease in the provision for income taxes compared to the prior-year quarter was based primarily on a lower effective tax rate driven by changes in the earnings mix in tax jurisdictions in which the Corporation operates, partially offset by increased income before income taxes. The current quarter also includes the impact of the adoption of the new share-based compensation accounting standard, which provided a $6.4 million benefit to the provision for income taxes compared to the prior-year quarter.

- 9 -STOCKHOLDERS' EQUITY
Total stockholders’ equity averaged $9.2 billion, up $520.1 million, or 6% from the prior-year quarter’s
average of $8.7 billion. The increase was primarily attributable to the issuance of preferred stock and earnings,
partially offset by dividend declarations and the repurchase of common stock pursuant to the Corporation’s
share repurchase program. During the current quarter, the Corporation issued and sold 500,000 depositary
shares, each representing a 1/100th ownership interest in a share of Series D Non-Cumulative Perpetual
Preferred Stock for proceeds of $493.5 million, net of underwriting discounts, commissions and other
issuance costs. During the current quarter, the Corporation declared cash dividends totaling $5.9 million to
preferred stockholders and cash dividends totaling $87.8 million to common stockholders. During the three
and nine months ended September 30, 2016, the Corporation repurchased 951,401 shares of common
stock, including 42,012 shares withheld related to share-based compensation, at a total cost of $64.9 million
($68.26 average price per share) and 5,231,246 shares of common stock, including 429,855 shares withheld
related to share-based compensation, at a total cost of $346.1 million ($66.15 average price per share),
respectively.
CAPITAL RATIOS
The capital ratios of Northern Trust and its principal subsidiary, The Northern Trust Company,
remained strong at September 30, 2016, with all ratios applicable to classification as “well capitalized” under
U.S. regulatory requirements having been exceeded.
The table below provides capital ratios for Northern Trust Corporation and The Northern Trust
Company determined by Basel III phased in requirements.
September 30, 2016 June 30, 2016 September 30, 2015Capital Ratios - Northern Trust Corporation
AdvancedApproach
StandardizedApproach
AdvancedApproach
StandardizedApproach
AdvancedApproach
StandardizedApproach
Common Equity Tier 1 11.8% 11.2% 11.5% 10.6% 12.4% 10.5%
Tier 1 13.1% 12.3% 12.0% 11.0% 13.0% 11.0%
Total 14.5% 14.0% 13.5% 12.7% 14.8% 12.8%
Tier 1 Leverage 7.9% 7.9% 7.4% 7.4% 7.8% 7.8%
Supplementary Leverage(a) 6.6% N/A 6.2% N/A 6.4% N/A
September 30, 2016 June 30, 2016 September 30, 2015Capital Ratios - The Northern Trust Company
AdvancedApproach
StandardizedApproach
AdvancedApproach
StandardizedApproach
AdvancedApproach
StandardizedApproach
Common Equity Tier 1 12.0% 11.1% 11.6% 10.4% 12.0% 9.9%
Tier 1 12.0% 11.1% 11.6% 10.4% 12.0% 9.9%
Total 13.6% 12.9% 13.3% 12.3% 13.6% 11.6%
Tier 1 Leverage 7.0% 7.0% 7.0% 7.0% 7.0% 7.0%
Supplementary Leverage(a) 5.9% N/A 5.8% N/A 5.7% N/A
(a) Effective January 1, 2018, the Northern Trust will be subject to a minimum supplementary leverage ratio of 3 percent.

- 10 -RECONCILIATION OF REPORTED TOTAL REVENUE AND
NET INTEREST INCOME TO FULLY TAXABLE EQUIVALENTThe following table presents a reconciliation of interest income, net interest income, net interest
margin, and total revenue prepared in accordance with GAAP to such measures on an FTE basis, which
are non-GAAP financial measures. Management believes this presentation provides a clearer indication of
these financial measures for comparative purposes. When adjusted to an FTE basis, yields on taxable,
nontaxable and partially taxable assets are comparable; however, the adjustment to an FTE basis has no
impact on net income.
Three Months EndedSeptember 30, 2016 June 30, 2016 September 30, 2015
($ In Millions) Reported FTE Adj. FTE Reported FTE Adj. FTE Reported FTE Adj. FTENet InterestIncome
InterestIncome $ 349.2 $ 7.0 $ 356.2 $ 344.7 $ 6.9 $ 351.6 $ 305.7 $ 6.1 $ 311.8InterestExpense 46.1 — 46.1 45.0 — 45.0 36.8 — 36.8
Net InterestIncome $ 303.1 $ 7.0 $ 310.1 $ 299.7 $ 6.9 $ 306.6 $ 268.9 $ 6.1 $ 275.0Net InterestMargin 1.12% 1.14% 1.13% 1.16% 1.06% 1.08%
Total Revenue $1,213.7 $ 7.0 $1,220.7 $1,316.7 $ 6.9 $1,323.6 $1,155.5 $ 6.1 $1,161.6

- 11 -ADOPTION OF THE NEW ACCOUNTING STANDARD
RELATED TO SHARE-BASED COMPENSATIONIn the current quarter, Northern Trust elected to early adopt ASU No. 2016-09, “Compensation -
Stock Compensation (Topic 718): Improvements to Employee Share-Based Payment Accounting,” effective
January 1, 2016. The primary impact of the adoption was the recognition of excess tax benefits in the
Corporation's provision for income taxes rather than additional paid-in capital in common equity for all periods
in 2016.
Adoption of the new standard resulted in the recognition of excess tax benefits in the Corporation's
provision for income taxes rather than additional paid-in capital in common equity of $6.4 million and $12.3
million for the three and nine months ended September 30, 2016, respectively, and impacted the
Corporation's previously reported quarterly results as follows:
Q2 2016 Q1 2016
($ In Millions except per share data) As Reported As Adjusted As Reported As Adjusted
Provision for Income Taxes $ 134.0 $ 131.7 $ 117.4 $ 113.8
Net Income 260.7 263.0 241.8 245.4
Earnings Allocated to Participating Securities 4.7 4.8 4.1 4.1
Net Income Applicable to Common Stock 254.9 257.2 235.9 239.5
Effective Tax Rate 33.9% 33.4% 32.7% 31.7%
Basic Earnings per Share $ 1.10 $ 1.11 $ 1.01 $ 1.03
Diluted Earnings per Share 1.09 1.10 1.01 1.03
Diluted Weighted Average Shares Outstanding (000s) 229,197 229,280 229,980 229,798
Return on Average Common Equity 12.20% 12.30% 11.43% 11.60%
Return on Average Assets 0.91% 0.92% 0.86% 0.87%
- 12 -FORWARD-LOOKING STATEMENTS
This release may include statements which constitute “forward-looking statements” within the
meaning of the safe harbor provisions of the Private Securities Litigation Reform Act of 1995. Forward-
looking statements are identified typically by words or phrases such as “believe,” “expect,” “anticipate,”
“intend,” “estimate,” “project,” “likely,” “plan,” “goal,” “target,” “strategy,” and similar expressions or future or
conditional verbs such as “may,” “will,” “should,” “would,” and “could.” Forward-looking statements include
statements, other than those related to historical facts, that relate to Northern Trust’s financial results and
outlook, capital adequacy, dividend policy, anticipated expense levels, spending related to technology and
regulatory initiatives, risk management policies, contingent liabilities, strategic initiatives, industry trends,
and expectations regarding the impact of recent legislation. These statements are based on Northern Trust’s
current beliefs and expectations of future events or future results, and involve risks and uncertainties that
are difficult to predict and subject to change. These statements are also based on assumptions about many
important factors, including the factors discussed in Northern Trust’s most recent annual report on Form 10-
K and other filings with the U.S. Securities and Exchange Commission, all of which are available on Northern
Trust’s website. We caution you not to place undue reliance on any forward-looking statement as actual
results may differ materially from those expressed or implied by forward-looking statements. Northern Trust
assumes no obligation to update its forward-looking statements.

- 13 -WEBCAST OF THIRD QUARTER EARNINGS CONFERENCE CALL
Northern Trust’s third quarter earnings conference call will be webcast on October 19, 2016. The
live call will be conducted at 11:00 a.m. CT and is accessible on Northern Trust’s website at:
https://www.northerntrust.com/financialreleases
The rebroadcast of the live call will be available on Northern Trust’s website from 3:00 p.m. CT on
October 19, 2016, for approximately four weeks. Participants will need Windows Media or Adobe Flash
software. This earnings release can also be accessed at Northern Trust’s website.
To download our investor relations mobile app, which offers access to SEC filings, press releases,
stock quotes and upcoming events, please visit Apple’s App Store for your iPad. You may find the app by
searching Northern Trust Investor Relations or by clicking on https://appsto.re/us/MtHH3.i from your iPad.
About Northern Trust
Northern Trust Corporation (Nasdaq: NTRS) is a leading provider of wealth management, asset
servicing, asset management and banking to corporations, institutions, affluent families and individuals.
Founded in Chicago in 1889, Northern Trust has offices in the United States in 19 states and
Washington, D.C., and 22 international locations in Canada, Europe, the Middle East and the Asia-Pacific
region. As of September 30, 2016 Northern Trust had assets under custody of US$6.7 trillion, and assets
under management of US$946 billion. For more than 125 years, Northern Trust has earned distinction as
an industry leader for exceptional service, financial expertise, integrity and innovation. Visit
northerntrust.com or follow us on Twitter @NorthernTrust.
Northern Trust Corporation, Head Office: 50 South La Salle Street, Chicago, Illinois 60603 U.S.A.,
incorporated with limited liability in the U.S. Global legal and regulatory information can be found at http://
www.northerntrust.com/disclosures.
/ / /

NORTHERN TRUST CORPORATION Page 1(Supplemental Consolidated Financial Information)
STATEMENT OF INCOME DATA
($ In Millions Except Per Share Data) THIRD QUARTER2016 2015 % Change (*)
Noninterest Income Trust, Investment and Other Servicing Fees $ 788.3 $ 749.1 5% Foreign Exchange Trading Income 53.6 62.9 (15) Treasury Management Fees 15.0 16.1 (6) Security Commissions and Trading Income 20.4 20.4 1 Other Operating Income 33.1 38.1 (14) Investment Security Gains (Losses), net 0.2 — N/ATotal Noninterest Income 910.6 886.6 3
Net Interest Income Interest Income 349.2 305.7 14 Interest Expense 46.1 36.8 25Net Interest Income 303.1 268.9 13
Total Revenue 1,213.7 1,155.5 5
Provision for Credit Losses (3.0) (10.0) (70)
Noninterest Expense Compensation 382.1 361.6 6 Employee Benefits 73.2 69.8 5 Outside Services 157.6 158.3 — Equipment and Software 114.5 113.6 1 Occupancy 44.2 43.7 1 Other Operating Expense 71.4 65.3 9Total Noninterest Expense 843.0 812.3 4
Income before Income Taxes 373.7 353.2 6Provision for Income Taxes 116.1 118.6 (2)NET INCOME $ 257.6 $ 234.6 10%
Dividends on Preferred Stock $ 5.9 $ 5.8 —%Earnings Allocated to Participating Securities 4.8 3.8 27Earnings Allocated to Common and Potential Common Shares 246.9 225.0 10
Per Common ShareNet Income Basic $ 1.09 $ 0.97 12% Diluted 1.08 0.96 13
Average Common Equity $ 8,552.5 $ 8,322.0 3%Return on Average Common Equity 11.71 % 10.91%Return on Average Assets 0.88 % 0.85%
Cash Dividends Declared per Common Share $ 0.38 $ 0.36 6%
Average Common Shares Outstanding (000s) Basic 226,540 232,232 Diluted 228,055 234,163Common Shares Outstanding (EOP) (000s) 226,431 231,220
(*) Percentage calculations are based on actual balances rather than the rounded amounts presented in the Supplemental Consolidated Financial Information.

NORTHERN TRUST CORPORATION Page 2(Supplemental Consolidated Financial Information)
STATEMENT OF INCOME DATA THIRD SECOND
($ In Millions Except Per Share Data) QUARTER QUARTER2016 2016^ % Change (*)
Noninterest Income Trust, Investment and Other Servicing Fees $ 788.3 $ 777.2 1 % Foreign Exchange Trading Income 53.6 64.4 (17) Treasury Management Fees 15.0 16.0 (6) Security Commissions and Trading Income 20.4 20.6 (1) Other Operating Income 33.1 141.2 (77) Investment Security Gains (Losses), net 0.2 (2.4) (106)Total Noninterest Income 910.6 1,017.0 (10)
Net Interest Income Interest Income 349.2 344.7 1 Interest Expense 46.1 45.0 2Net Interest Income 303.1 299.7 1
Total Revenue 1,213.7 1,316.7 (8)
Provision for Credit Losses (3.0) (3.0) —
Noninterest Expense Compensation 382.1 389.5 (2) Employee Benefits 73.2 72.2 1 Outside Services 157.6 159.0 (1) Equipment and Software 114.5 118.0 (3) Occupancy 44.2 45.3 (2) Other Operating Expense 71.4 141.0 (49)Total Noninterest Expense 843.0 925.0 (9)
Income before Income Taxes 373.7 394.7 (5)Provision for Income Taxes 116.1 131.7 (12)NET INCOME $ 257.6 $ 263.0 (2)%
Dividends on Preferred Stock $ 5.9 $ 5.8 — %Earnings Allocated to Participating Securities 4.8 4.8 —Earnings Allocated to Common and Potential Common Shares 246.9 252.4 (2)
Per Common ShareNet Income Basic $ 1.09 $ 1.11 (2)% Diluted 1.08 1.10 (2)
Average Common Equity $ 8,552.5 $ 8,404.2 2 %Return on Average Common Equity 11.71 % 12.30%Return on Average Assets 0.88 % 0.92%
Cash Dividends Declared per Common Share $ 0.38 $ 0.36 6 %
Average Common Shares Outstanding (000s) Basic 226,540 227,536 Diluted 228,055 229,280Common Shares Outstanding (EOP) (000s) 226,431 226,591
(*) Percentage calculations are based on actual balances rather than the rounded amounts presented in the Supplemental Consolidated Financial Information.
(^) Q2 2016 has been adjusted to reflect the early adoption of ASU 2016-09, “Compensation - Stock Compensation (Topic 718): Improvements to Employee Share-Based Payment Accounting.” See Adoption of the New Accounting Standard Related to Share-Based Compensation section for additional details related to the adjustment.

NORTHERN TRUST CORPORATION Page 3(Supplemental Consolidated Financial Information)
STATEMENT OF INCOME DATA
($ In Millions Except Per Share Data) NINE MONTHS2016^ 2015 % Change (*)
Noninterest Income Trust, Investment and Other Servicing Fees $ 2,313.7 $ 2,233.4 4% Foreign Exchange Trading Income 178.5 209.3 (15) Treasury Management Fees 47.2 48.5 (3) Security Commissions and Trading Income 59.9 60.2 — Other Operating Income 212.4 214.1 (1) Investment Security Gains (Losses), net (1.9) (0.3) N/MTotal Noninterest Income 2,809.8 2,765.2 2
Net Interest Income Interest Income 1,045.9 893.3 17 Interest Expense 135.3 112.6 20Net Interest Income 910.6 780.7 17
Total Revenue 3,720.4 3,545.9 5
Provision for Credit Losses (4.0) (24.5) (84)
Noninterest Expense Compensation 1,150.4 1,077.8 7 Employee Benefits 216.0 215.9 — Outside Services 466.5 440.6 6 Equipment and Software 346.7 338.3 3 Occupancy 130.4 129.7 — Other Operating Expense 286.8 253.5 13Total Noninterest Expense 2,596.8 2,455.8 6
Income before Income Taxes 1,127.6 1,114.6 1Provision for Income Taxes 361.6 380.1 (5)NET INCOME $ 766.0 $ 734.5 4%
Dividends on Preferred Stock $ 17.6 $ 17.5 —%Earnings Allocated to Participating Securities 13.7 11.6 18Earnings Allocated to Common and Potential Common Shares 734.7 705.4 4
Per Common ShareNet Income Basic $ 3.23 $ 3.03 7% Diluted 3.21 3.00 7
Average Common Equity $ 8,420.2 $ 8,209.4 3%Return on Average Common Equity 11.87 % 11.68%Return on Average Assets 0.89 % 0.90%
Cash Dividends Declared per Common Share $ 1.10 $ 1.05 5%
Average Common Shares Outstanding (000s) Basic 227,561 232,916 Diluted 229,041 234,891Common Shares Outstanding (EOP) (000s) 226,431 231,220
(*) Percentage calculations are based on actual balances rather than the rounded amounts presented in the Supplemental Consolidated Financial Information.
(^) Q2 2016 and Q1 2016 have been adjusted to reflect the early adoption of ASU 2016-09, “Compensation - Stock Compensation (Topic 718): Improvements to Employee Share-Based Payment Accounting.” See Adoption of the New Accounting Standard Related to Share-Based Compensation section for additional details related to the adjustment.

NORTHERN TRUST CORPORATION Page 4(Supplemental Consolidated Financial Information)
BALANCE SHEET($ In Millions) SEPTEMBER 30
2016 2015 % Change (*)
AssetsFederal Funds Sold and Securities Purchased under Agreements to Resell $ 2,066.0 $ 1,255.6 65 %Interest-Bearing Due from and Deposits with Banks (**) 9,037.5 10,899.3 (17)Federal Reserve and Other Central Bank Deposits 22,195.0 27,663.8 (20)Securities U.S. Government 7,671.9 5,125.2 50 Obligations of States and Political Subdivisions 851.4 101.6 N/M Government Sponsored Agency 18,032.5 15,716.6 15 Other (***) 18,488.3 16,425.0 13Total Securities 45,044.1 37,368.4 21Loans and Leases 33,423.0 33,378.4 —Total Earning Assets 111,765.6 110,565.5 1Allowance for Credit Losses Assigned to Loans and Leases (191.0) (242.2) (21)Cash and Due from Banks and Other Central Bank Deposits (****) 1,724.7 2,109.8 (18)Buildings and Equipment 438.8 427.7 3Client Security Settlement Receivables 1,984.5 1,918.4 3Goodwill 524.4 529.7 (1)Other Assets 3,838.0 4,686.3 (18)Total Assets $ 120,085.0 $ 119,995.2 — %
Liabilities and Stockholders’ EquityInterest-Bearing Deposits Savings and Money Market $ 14,779.2 $ 15,153.5 (2)% Savings Certificates and Other Time 1,507.7 1,457.1 3 Non-U.S. Offices - Interest-Bearing 54,024.3 53,823.8 —Total Interest-Bearing Deposits 70,311.2 70,434.4 —Short-Term Borrowings 4,682.7 4,908.6 (5)Senior Notes 1,496.4 1,497.3 —Long-Term Debt 1,400.9 1,394.3 —Floating Rate Capital Debt 277.4 277.3 —Total Interest-Related Funds 78,168.6 78,511.9 —Demand and Other Noninterest-Bearing Deposits 29,160.1 29,501.5 (1)Other Liabilities 3,176.5 3,197.3 (1)Total Liabilities 110,505.2 111,210.7 (1)Common Equity 8,697.8 8,396.0 4Preferred Equity 882.0 388.5 127Total Equity 9,579.8 8,784.5 9Total Liabilities and Stockholders’ Equity $ 120,085.0 $ 119,995.2 — %
(*) Percentage calculations are based on actual balances rather than the rounded amounts presented in the Supplemental Consolidated Financial Information.
(**) Interest-Bearing Due from and Deposits with Banks includes the interest-bearing component of Cash and Due from Banks and Interest-Bearing Deposits with Banks as presented on the consolidated balance sheets in our periodic filings with the SEC.
(***) Other securities include Federal Reserve and Federal Home Loan Bank stock and certain community development investments for purposes of presenting earning assets; such securities are presented in other assets on the consolidated balance sheets in our periodic filings with the SEC.
(****) Cash and Due from Banks and Other Central Bank Deposits includes the non-interest-bearing component of Federal Reserve and Other Central Bank Deposits as presented on the consolidated balance sheets in our periodic filings with the SEC.

NORTHERN TRUST CORPORATION Page 5(Supplemental Consolidated Financial Information)
BALANCE SHEET($ In Millions) SEPTEMBER 30 JUNE 30
2016 2016 % Change (*)
AssetsFederal Funds Sold and Securities Purchased under Agreements to Resell $ 2,066.0 $ 1,862.7 11 %Interest-Bearing Due from and Deposits with Banks (**) 9,037.5 10,311.8 (12)Federal Reserve and Other Central Bank Deposits 22,195.0 23,022.2 (4)Securities U.S. Government 7,671.9 6,897.3 11 Obligations of States and Political Subdivisions 851.4 720.7 18 Government Sponsored Agency 18,032.5 17,445.5 3 Other (***) 18,488.3 16,397.6 13Total Securities 45,044.1 41,461.1 9Loans and Leases 33,423.0 34,557.1 (3)Total Earning Assets 111,765.6 111,214.9 —Allowance for Credit Losses Assigned to Loans and Leases (191.0) (192.0) (1)Cash and Due from Banks and Other Central Bank Deposits (****) 1,724.7 2,005.6 (14)Buildings and Equipment 438.8 434.0 1Client Security Settlement Receivables 1,984.5 2,217.0 (10)Goodwill 524.4 527.8 (1)Other Assets 3,838.0 5,302.3 (28)Total Assets $ 120,085.0 $ 121,509.6 (1)%
Liabilities and Stockholders’ EquityInterest-Bearing Deposits Savings and Money Market $ 14,779.2 $ 15,669.8 (6)% Savings Certificates and Other Time 1,507.7 1,403.1 7 Non-U.S. Offices - Interest-Bearing 54,024.3 50,547.5 7Total Interest-Bearing Deposits 70,311.2 67,620.4 4Short-Term Borrowings 4,682.7 6,909.1 (32)Senior Notes 1,496.4 1,496.2 —Long-Term Debt 1,400.9 1,418.8 (1)Floating Rate Capital Debt 277.4 277.4 —Total Interest-Related Funds 78,168.6 77,721.9 1Demand and Other Noninterest-Bearing Deposits 29,160.1 31,466.5 (7)Other Liabilities 3,176.5 3,369.7 (6)Total Liabilities 110,505.2 112,558.1 (2)Common Equity 8,697.8 8,563.0 2Preferred Equity 882.0 388.5 127Total Equity 9,579.8 8,951.5 7Total Liabilities and Stockholders’ Equity $ 120,085.0 $ 121,509.6 (1)%
(*) Percentage calculations are based on actual balances rather than the rounded amounts presented in the Supplemental Consolidated Financial Information.
(**) Interest-Bearing Due from and Deposits with Banks includes the interest-bearing component of Cash and Due from Banks and Interest-Bearing Deposits with Banks as presented on the consolidated balance sheets in our periodic filings with the SEC.
(***) Other securities include Federal Reserve and Federal Home Loan Bank stock and certain community development investments for purposes of presenting earning assets; such securities are presented in other assets on the consolidated balance sheets in our periodic filings with the SEC.
(****) Cash and Due from Banks and Other Central Bank Deposits includes the non-interest-bearing component of Federal Reserve and Other Central Bank Deposits as presented on the consolidated balance sheets in our periodic filings with the SEC.
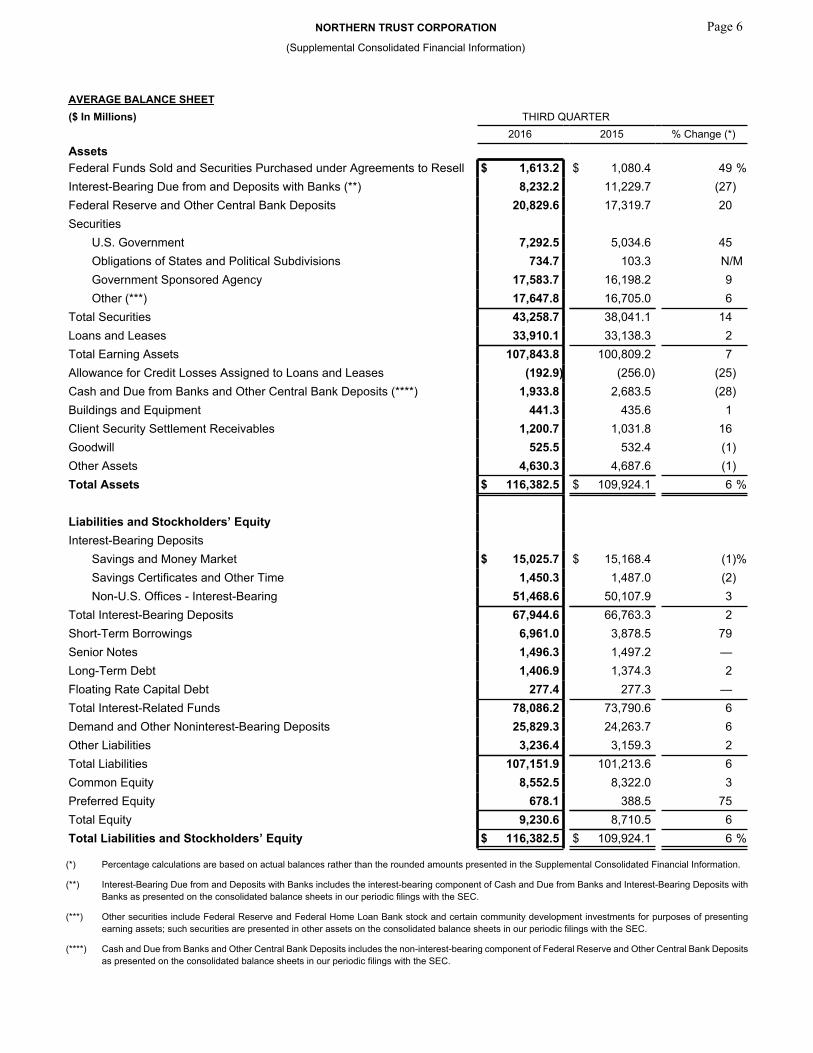
NORTHERN TRUST CORPORATION Page 6(Supplemental Consolidated Financial Information)
AVERAGE BALANCE SHEET($ In Millions) THIRD QUARTER
2016 2015 % Change (*)AssetsFederal Funds Sold and Securities Purchased under Agreements to Resell $ 1,613.2 $ 1,080.4 49 %Interest-Bearing Due from and Deposits with Banks (**) 8,232.2 11,229.7 (27)Federal Reserve and Other Central Bank Deposits 20,829.6 17,319.7 20Securities U.S. Government 7,292.5 5,034.6 45 Obligations of States and Political Subdivisions 734.7 103.3 N/M Government Sponsored Agency 17,583.7 16,198.2 9 Other (***) 17,647.8 16,705.0 6Total Securities 43,258.7 38,041.1 14Loans and Leases 33,910.1 33,138.3 2Total Earning Assets 107,843.8 100,809.2 7Allowance for Credit Losses Assigned to Loans and Leases (192.9) (256.0) (25)Cash and Due from Banks and Other Central Bank Deposits (****) 1,933.8 2,683.5 (28)Buildings and Equipment 441.3 435.6 1Client Security Settlement Receivables 1,200.7 1,031.8 16Goodwill 525.5 532.4 (1)Other Assets 4,630.3 4,687.6 (1)Total Assets $ 116,382.5 $ 109,924.1 6 %
Liabilities and Stockholders’ EquityInterest-Bearing Deposits Savings and Money Market $ 15,025.7 $ 15,168.4 (1)% Savings Certificates and Other Time 1,450.3 1,487.0 (2) Non-U.S. Offices - Interest-Bearing 51,468.6 50,107.9 3Total Interest-Bearing Deposits 67,944.6 66,763.3 2Short-Term Borrowings 6,961.0 3,878.5 79Senior Notes 1,496.3 1,497.2 —Long-Term Debt 1,406.9 1,374.3 2Floating Rate Capital Debt 277.4 277.3 —Total Interest-Related Funds 78,086.2 73,790.6 6Demand and Other Noninterest-Bearing Deposits 25,829.3 24,263.7 6Other Liabilities 3,236.4 3,159.3 2Total Liabilities 107,151.9 101,213.6 6Common Equity 8,552.5 8,322.0 3Preferred Equity 678.1 388.5 75Total Equity 9,230.6 8,710.5 6Total Liabilities and Stockholders’ Equity $ 116,382.5 $ 109,924.1 6 %
(*) Percentage calculations are based on actual balances rather than the rounded amounts presented in the Supplemental Consolidated Financial Information.
(**) Interest-Bearing Due from and Deposits with Banks includes the interest-bearing component of Cash and Due from Banks and Interest-Bearing Deposits with Banks as presented on the consolidated balance sheets in our periodic filings with the SEC.
(***) Other securities include Federal Reserve and Federal Home Loan Bank stock and certain community development investments for purposes of presenting earning assets; such securities are presented in other assets on the consolidated balance sheets in our periodic filings with the SEC.
(****) Cash and Due from Banks and Other Central Bank Deposits includes the non-interest-bearing component of Federal Reserve and Other Central Bank Deposits as presented on the consolidated balance sheets in our periodic filings with the SEC.

NORTHERN TRUST CORPORATION Page 7(Supplemental Consolidated Financial Information)
AVERAGE BALANCE SHEET THIRD SECOND($ In Millions) QUARTER QUARTER
2016 2016 % Change (*)
AssetsFederal Funds Sold and Securities Purchased under Agreements to Resell $ 1,613.2 $ 1,915.2 (16)%Interest-Bearing Due from and Deposits with Banks (**) 8,232.2 9,827.9 (16)Federal Reserve and Other Central Bank Deposits 20,829.6 19,657.8 6Securities U.S. Government 7,292.5 6,875.1 6 Obligations of States and Political Subdivisions 734.7 470.2 56 Government Sponsored Agency 17,583.7 17,347.0 1 Other (***) 17,647.8 16,064.2 10Total Securities 43,258.7 40,756.5 6Loans and Leases 33,910.1 34,456.1 (2)Total Earning Assets 107,843.8 106,613.5 1Allowance for Credit Losses Assigned to Loans and Leases (192.9) (195.4) (1)Cash and Due from Banks and Other Central Bank Deposits (****) 1,933.8 2,093.9 (8)Buildings and Equipment 441.3 439.9 —Client Security Settlement Receivables 1,200.7 1,143.0 5Goodwill 525.5 531.2 (1)Other Assets 4,630.3 4,287.7 8Total Assets $ 116,382.5 $ 114,913.8 1 %
Liabilities and Stockholders’ EquityInterest-Bearing Deposits Savings and Money Market $ 15,025.7 $ 15,041.3 — % Savings Certificates and Other Time 1,450.3 1,405.0 3 Non-U.S. Offices - Interest-Bearing 51,468.6 50,443.8 2Total Interest-Bearing Deposits 67,944.6 66,890.1 2Short-Term Borrowings 6,961.0 6,195.0 12Senior Notes 1,496.3 1,496.1 —Long-Term Debt 1,406.9 1,403.2 —Floating Rate Capital Debt 277.4 277.4 —Total Interest-Related Funds 78,086.2 76,261.8 2Demand and Other Noninterest-Bearing Deposits 25,829.3 26,718.0 (3)Other Liabilities 3,236.4 3,141.3 3Total Liabilities 107,151.9 106,121.1 1Common Equity 8,552.5 8,404.2 2Preferred Equity 678.1 388.5 75Total Equity 9,230.6 8,792.7 5Total Liabilities and Stockholders’ Equity $ 116,382.5 $ 114,913.8 1 %
(*) Percentage calculations are based on actual balances rather than the rounded amounts presented in the Supplemental Consolidated Financial Information.
(**) Interest-Bearing Due from and Deposits with Banks includes the interest-bearing component of Cash and Due from Banks and Interest-Bearing Deposits with Banks as presented on the consolidated balance sheets in our periodic filings with the SEC.
(***) Other securities include Federal Reserve and Federal Home Loan Bank stock and certain community development investments for purposes of presenting earning assets; such securities are presented in other assets on the consolidated balance sheets in our periodic filings with the SEC.
(****) Cash and Due from Banks and Other Central Bank Deposits includes the non-interest-bearing component of Federal Reserve and Other Central Bank Deposits as presented on the consolidated balance sheets in our periodic filings with the SEC.

NORTHERN TRUST CORPORATION Page 8(Supplemental Consolidated Financial Information)
QUARTERLY TREND DATA 2016 2015($ In Millions Except Per Share Data) QUARTERS QUARTERS
THIRD SECOND ^ FIRST ^ FOURTH THIRDNet Income Summary Trust, Investment and Other Servicing Fees $ 788.3 $ 777.2 $ 748.2 $ 747.1 $ 749.1 Other Noninterest Income 122.3 239.8 134.0 120.2 137.5 Net Interest Income 303.1 299.7 307.8 289.4 268.9 Total Revenue 1,213.7 1,316.7 1,190.0 1,156.7 1,155.5 Provision for Credit Losses (3.0) (3.0) 2.0 (18.5) (10.0) Noninterest Expense 843.0 925.0 828.8 824.8 812.3 Income before Income Taxes 373.7 394.7 359.2 350.4 353.2 Provision for Income Taxes 116.1 131.7 113.8 111.1 118.6 Net Income $ 257.6 $ 263.0 $ 245.4 $ 239.3 $ 234.6
Per Common Share Net Income - Basic $ 1.09 $ 1.11 $ 1.03 $ 1.00 $ 0.97 - Diluted 1.08 1.10 1.03 0.99 0.96 Cash Dividends Declared per Common Share 0.38 0.36 0.36 0.36 0.36 Book Value (EOP) 38.41 37.79 37.01 36.27 36.31 Market Value (EOP) 67.99 66.26 65.17 72.09 68.16
Financial Ratios Return on Average Common Equity 11.71 % 12.30 % 11.60 % 11.14% 10.91% Return on Average Assets 0.88 0.92 0.87 0.84 0.85 Net Interest Margin (GAAP) 1.12 1.13 1.18 1.09 1.06 Net Interest Margin (FTE) 1.14 1.16 1.21 1.11 1.08
Capital Ratios Standardized Approach Common Equity Tier 1 11.2 % 10.6% 10.6% 10.8% 10.4% Tier 1 12.3 11.0 11.1 11.4 11.0 Total 14.0 12.7 12.8 13.2 12.8 Tier 1 Leverage 7.9 7.4 7.4 7.5 7.8
Advanced Approach Common Equity Tier 1 11.8 % 11.5% 11.6% 11.9% 12.4% Tier 1 13.1 12.0 12.1 12.5 13.0 Total 14.5 13.5 13.6 14.2 14.8 Tier 1 Leverage 7.9 7.4 7.4 7.5 7.8 Supplementary Leverage 6.6 6.2 6.1 6.2 6.4
Assets Under Custody ($ In Billions) - EOP Corporate & Institutional Services $ 6,173.6 $ 5,838.6 $ 5,700.3 $ 5,565.8 $ 5,460.6 Wealth Management 533.2 514.2 511.1 506.3 495.8 Total Assets Under Custody $ 6,706.8 $ 6,352.8 $ 6,211.4 $ 6,072.1 $ 5,956.4
Assets Under Management ($ In Billions) - EOP Corporate & Institutional Services $ 703.6 $ 672.3 $ 669.9 $ 648.0 $ 661.5 Wealth Management 242.2 233.9 230.1 227.3 225.3 Total Assets Under Management $ 945.8 $ 906.2 $ 900.0 $ 875.3 $ 886.8
Asset Quality ($ In Millions) - EOP Nonperforming Loans and Leases $ 173.3 $ 152.2 $ 164.0 $ 180.1 $ 198.6 Other Real Estate Owned (OREO) 7.7 14.2 10.4 8.2 8.9 Total Nonperforming Assets $ 181.0 $ 166.4 $ 174.4 $ 188.3 $ 207.5 Nonperforming Assets / Loans and Leases and OREO 0.54 % 0.48% 0.51% 0.57% 0.62% Gross Charge-offs $ 3.0 $ 4.9 $ 5.3 $ 5.2 $ 11.9 Less: Gross Recoveries 3.8 2.5 2.6 2.3 2.5 Net (Recoveries) / Charge-offs $ (0.8) $ 2.4 $ 2.7 $ 2.9 $ 9.4 Net Charge-offs (Annualized) to Average Loans and Leases (0.01) % 0.03% 0.03% 0.03% 0.11% Allowance for Credit Losses Assigned to Loans and Leases $ 191.0 $ 192.0 $ 195.6 $ 193.8 $ 242.2 Allowance to Nonperforming Loans and Leases 1.1x 1.3x 1.2x 1.1x 1.2x Allowance for Other Credit-Related Exposures $ 33.9 $ 35.1 $ 37.0 $ 39.5 $ 12.5
(^) Q2 2016 and Q1 2016 have been adjusted to reflect the early adoption of ASU 2016-09, “Compensation - Stock Compensation (Topic 718): Improvements to Employee Share-Based Payment Accounting.” See Adoption of the New Accounting Standard Related to Share-Based Compensation section for additional details related to the adjustment.