vietnam infrastructure sua can - world banksiteresources.worldbank.org/inteapinfrastruct/... · as...
TRANSCRIPT

Infrastructure StrategyCross-sectoral issues
As Vietnam becomes richer it faces challenges in adapting its infrastructurepolicies and institutions. While the old challenges of providing basicservices to all remain, new challenges are emerging, such as accessing newsources of finance, refining planning processes, preparing for rapidurbanization, improving the efficiency of infrastructure service providers,developing stronger institutions to encourage private finance ofinfrastructure or direct private provision of infrastructure, and developingmore targeted approaches to poverty alleviation.
This report on Infrastructure Strategy - Cross Sectoral Issues is one of sixvolumes dealing with Vietnam's Infrastructure Challenge. It deals with cross-sectoral issues that are common to all infrastructure sectors, and provides anoverview of recent achievements and emerging challenges. Other volumesdeal with Water and Sanitation, Electricity, Transport, Telecommunications,and Urban Development.
The work for these reports was carried out between 2004 and 2006 byWorld Bank staff and consultants, under the direction of Klaus Rohland,Country Director for Vietnam, and Christian Delvoie, Sector Director forInfrastructure in East Asia and the Pacific. The reports have been revised totake account of comments made by the Government in workshops duringMay 15-17, 2006. The principal author of this volume was Michael Warlters.The comments of numerous colleagues from the World Bank, the UnitedKingdom's Department for International Development Bank, the AsianDevelopment Bank, and the Japan Bank for International Cooperation aregratefully acknowledged.
Vietnam’s infrastructure challenge

ADB Asian Development BankBCC Business Cooperation ContractBOT Build-Own-TransferCPRGS Comprehensive Poverty Reduction and Growth StrategyDAF Development Assistance FundEVN Electricity of VietnamGSO General Statistics Office of VietnamHIFU Ho Chi Minh City Investment Fund for Urban DevelopmentIBRD International Bank for Reconstruction and Development (the World Bank)ICOR Incremental Capital-Output RatioIDA International Development Association (the World Bank)IPP Independent Power ProducerITU International Telecommunications UnionJBIC Japan Bank for International CooperationLDIF Local Development Investment FundMARD Ministry of Agriculture and Regional DevelopmentMCF Marginal Cost of Public FundsMOF Ministry of FinanceMOT Ministry of TransportMPI Ministry of Planning and InvestmentMTEF Medium Term Expenditure FrameworkOBA Output Based AidODA Official Development AssistancePER-IFA Public Expenditure Review and Integrated Fiduciary AssessmentPIP Public Investment ProgramPPI Private Participation in InfrastructureSEDP Socio-Economic Development PlanSOCB State-Owned Commercial BankSOE State-Owned EnterpriseVHLSS Vietnam Household Living Standards SurveyVITRANSS Vietnam’s Transport Strategy StudyVND Vietnamese DongVNPT Vietnam Post and Telecommunications CorporationVRA Vietnam Road AdministrationWDI World Development Indicators
Abbreviations

iii
ABBREVIATIONS . . . . . . . . . . . . . . . . . . . . . . . . . . . . . . . . . . . . . . . . . . . . . . . . . . . . . . . . . . . . . . . . . . . . . .i
EXECUTIVE SUMMARY . . . . . . . . . . . . . . . . . . . . . . . . . . . . . . . . . . . . . . . . . . . . . . . . . . . . . . . . . . . . . .vii
Cross-Sectoral Issues . . . . . . . . . . . . . . . . . . . . . . . . . . . . . . . . . . . . . . . . . . . . . . . . . . . . . . . . . . . . . . . . . . .viiiSectoral Strategies . . . . . . . . . . . . . . . . . . . . . . . . . . . . . . . . . . . . . . . . . . . . . . . . . . . . . . . . . . . . . . . . . . . . .xviiReform Prioritization . . . . . . . . . . . . . . . . . . . . . . . . . . . . . . . . . . . . . . . . . . . . . . . . . . . . . . . . . . . . . . . . .xxvi
1. ACHIEVEMENTS AND CHALLENGES . . . . . . . . . . . . . . . . . . . . . . . . . . . . . . . . . . . . . . . . . . . .1
1.1. Growth and Poverty Reduction . . . . . . . . . . . . . . . . . . . . . . . . . . . . . . . . . . . . . . . . . . . . . . . . . . . . .11.2. Improved Access . . . . . . . . . . . . . . . . . . . . . . . . . . . . . . . . . . . . . . . . . . . . . . . . . . . . . . . . . . . . . . . . . .51.3. Changing Circumstances . . . . . . . . . . . . . . . . . . . . . . . . . . . . . . . . . . . . . . . . . . . . . . . . . . . . . . . . . . .61.4. Shared Challenges . . . . . . . . . . . . . . . . . . . . . . . . . . . . . . . . . . . . . . . . . . . . . . . . . . . . . . . . . . . . . . . .15
2. FINANCING . . . . . . . . . . . . . . . . . . . . . . . . . . . . . . . . . . . . . . . . . . . . . . . . . . . . . . . . . . . . . . . . . . . .17
2.1. Level of Infrastructure Financing . . . . . . . . . . . . . . . . . . . . . . . . . . . . . . . . . . . . . . . . . . . . . . . . . . .172.2. Who Pays for Investment, and When? . . . . . . . . . . . . . . . . . . . . . . . . . . . . . . . . . . . . . . . . . . . . . .202.3. Financing Institutions and Mechanisms . . . . . . . . . . . . . . . . . . . . . . . . . . . . . . . . . . . . . . . . . . . . .212.4. Recommendations . . . . . . . . . . . . . . . . . . . . . . . . . . . . . . . . . . . . . . . . . . . . . . . . . . . . . . . . . . . . . . . .39
3. PLANNING AND COORDINATION . . . . . . . . . . . . . . . . . . . . . . . . . . . . . . . . . . . . . . . . . . . . .43
3.1. Prioritizing Investment Decisions . . . . . . . . . . . . . . . . . . . . . . . . . . . . . . . . . . . . . . . . . . . . . . . . . .433.2. Coordination of Planning Across Ministries . . . . . . . . . . . . . . . . . . . . . . . . . . . . . . . . . . . . . . . . .463.3. Allocation of Responsibilities Across Tiers of Government . . . . . . . . . . . . . . . . . . . . . . . . . . . . .513.4. Urban Planning . . . . . . . . . . . . . . . . . . . . . . . . . . . . . . . . . . . . . . . . . . . . . . . . . . . . . . . . . . . . . . . . . .543.5. Environmental and Social Policies . . . . . . . . . . . . . . . . . . . . . . . . . . . . . . . . . . . . . . . . . . . . . . . . . .563.6. Recommendations . . . . . . . . . . . . . . . . . . . . . . . . . . . . . . . . . . . . . . . . . . . . . . . . . . . . . . . . . . . . . . . .60
4. EFFICIENCY . . . . . . . . . . . . . . . . . . . . . . . . . . . . . . . . . . . . . . . . . . . . . . . . . . . . . . . . . . . . . . . . . . . .63
4.1. Current Efficiency Levels . . . . . . . . . . . . . . . . . . . . . . . . . . . . . . . . . . . . . . . . . . . . . . . . . . . . . . . . . .634.2. Reforming Public Infrastructure Enterprises . . . . . . . . . . . . . . . . . . . . . . . . . . . . . . . . . . . . . . . . .674.3. Competition . . . . . . . . . . . . . . . . . . . . . . . . . . . . . . . . . . . . . . . . . . . . . . . . . . . . . . . . . . . . . . . . . . . . .704.4. Private Participation . . . . . . . . . . . . . . . . . . . . . . . . . . . . . . . . . . . . . . . . . . . . . . . . . . . . . . . . . . . . . .714.5. Regulation . . . . . . . . . . . . . . . . . . . . . . . . . . . . . . . . . . . . . . . . . . . . . . . . . . . . . . . . . . . . . . . . . . . . . .784.6. Addressing Corruption . . . . . . . . . . . . . . . . . . . . . . . . . . . . . . . . . . . . . . . . . . . . . . . . . . . . . . . . . . .81
Table of Contents
iv
4.7. Recommendations . . . . . . . . . . . . . . . . . . . . . . . . . . . . . . . . . . . . . . . . . . . . . . . . . . . . . . . . . . . . . . . .84
5. POVERTY . . . . . . . . . . . . . . . . . . . . . . . . . . . . . . . . . . . . . . . . . . . . . . . . . . . . . . . . . . . . . . . . . . . . . .87
5.1. Rural Poverty . . . . . . . . . . . . . . . . . . . . . . . . . . . . . . . . . . . . . . . . . . . . . . . . . . . . . . . . . . . . . . . . . . . .875.2. Urban Poverty . . . . . . . . . . . . . . . . . . . . . . . . . . . . . . . . . . . . . . . . . . . . . . . . . . . . . . . . . . . . . . . . . . .905.3. Designing Subsidies . . . . . . . . . . . . . . . . . . . . . . . . . . . . . . . . . . . . . . . . . . . . . . . . . . . . . . . . . . . . . .915.4. Recommendations . . . . . . . . . . . . . . . . . . . . . . . . . . . . . . . . . . . . . . . . . . . . . . . . . . . . . . . . . . . . . . . .95
6. REFORM PRIORITIZATION . . . . . . . . . . . . . . . . . . . . . . . . . . . . . . . . . . . . . . . . . . . . . . . . . . . . .97
6.1. International Competitiveness . . . . . . . . . . . . . . . . . . . . . . . . . . . . . . . . . . . . . . . . . . . . . . . . . . . . .976.2. Estimates of Reform Effects . . . . . . . . . . . . . . . . . . . . . . . . . . . . . . . . . . . . . . . . . . . . . . . . . . . . . . . .986.3. Capacity to Manage Reform . . . . . . . . . . . . . . . . . . . . . . . . . . . . . . . . . . . . . . . . . . . . . . . . . . . . . .1016.4. Principal Reform Priorities . . . . . . . . . . . . . . . . . . . . . . . . . . . . . . . . . . . . . . . . . . . . . . . . . . . . . . .101Annex 1 - Scope for Greater Competition in Infrastructure Sectors . . . . . . . . . . . . . . . . . . . . . . . . . . .104Annex 2 - Infrastructure Regulation . . . . . . . . . . . . . . . . . . . . . . . . . . . . . . . . . . . . . . . . . . . . . . . . . . . . .108
Boxes
Box 1.1: The Hanoi-Hai Phong northern transport corridor . . . . . . . . . . . . . . . . . . . . . . . . . . . . . . . . . . .4Box 2.1: The Marginal Cost of Public Funds . . . . . . . . . . . . . . . . . . . . . . . . . . . . . . . . . . . . . . . . . . . . . . . .26Box 2.2: Vietnam's Financial Sector . . . . . . . . . . . . . . . . . . . . . . . . . . . . . . . . . . . . . . . . . . . . . . . . . . . . . . .27Box 2.3: Ho Chi Minh City Investment Fund for Urban Development (HIFU) . . . . . . . . . . . . . . . . . .30Box 2.4: Using Pension Funds to Finance Infrastructure in Chile . . . . . . . . . . . . . . . . . . . . . . . . . . . . . .34Box 3.1: Common Weaknesses of Vietnamese Feasibility Studies . . . . . . . . . . . . . . . . . . . . . . . . . . . . .44Box 3.2: Development Planning in Malaysia . . . . . . . . . . . . . . . . . . . . . . . . . . . . . . . . . . . . . . . . . . . . . . .45Box 3.3: A Medium Term Expenditure Framework (MTEF) . . . . . . . . . . . . . . . . . . . . . . . . . . . . . . . . . .49Box 3.4: Weaknesses in the Coordination of Road Maintenance . . . . . . . . . . . . . . . . . . . . . . . . . . . . . .53Box 3.5: Strategic Environmental Assessment in Bali . . . . . . . . . . . . . . . . . . . . . . . . . . . . . . . . . . . . . . . .57Box 3.6: Resettlement and Land Markets . . . . . . . . . . . . . . . . . . . . . . . . . . . . . . . . . . . . . . . . . . . . . . . . . .58Box 4.1: Phu My 2.2 Project . . . . . . . . . . . . . . . . . . . . . . . . . . . . . . . . . . . . . . . . . . . . . . . . . . . . . . . . . . . . . .74Box 4.2 Gujarat Infrastructure Development Board . . . . . . . . . . . . . . . . . . . . . . . . . . . . . . . . . . . . . . . . .78Box 4.3: Forms of Price Regulation . . . . . . . . . . . . . . . . . . . . . . . . . . . . . . . . . . . . . . . . . . . . . . . . . . . . . . .79Box 4.4: Discretion in the Regulation of Private Infrastructure Enterprises . . . . . . . . . . . . . . . . . . . . .80Box 4.5: Bangladesh Rural Electrification Board . . . . . . . . . . . . . . . . . . . . . . . . . . . . . . . . . . . . . . . . . . . .82Box 4.6: Opportunities for Corruption . . . . . . . . . . . . . . . . . . . . . . . . . . . . . . . . . . . . . . . . . . . . . . . . . . . .83Box 5.1: Road Investment-A Case for Further Expenditure Redistribution . . . . . . . . . . . . . . . . . . . . .89Box 5.2: Targeting Effectiveness of Increasing Block Tariffs . . . . . . . . . . . . . . . . . . . . . . . . . . . . . . . . . .92Box 5.3: Output-based Aid: Tying Subsidies to Service Delivery for the Poor . . . . . . . . . . . . . . . . . . .95Box 6.1: Modeling the Benefits of Reform in Australia . . . . . . . . . . . . . . . . . . . . . . . . . . . . . . . . . . . . . .100

v
Figures
Figure 1: An Emerging Gap between Investment Plans and Available Financing . . . . . . . . . . . . . .viiiFigure 1.1: Growth of GDP per capita 1990-2003 . . . . . . . . . . . . . . . . . . . . . . . . . . . . . . . . . . . . . . . . . . . . .2Figure 1.2: Growth and Infrastructure Investment, as percent of GDP . . . . . . . . . . . . . . . . . . . . . . . . . .3Figure 1.3: Percent of Population Living in Poverty . . . . . . . . . . . . . . . . . . . . . . . . . . . . . . . . . . . . . . . . . .4Figure 1.4: Access to Infrastructure Services . . . . . . . . . . . . . . . . . . . . . . . . . . . . . . . . . . . . . . . . . . . . . . . .6Figure 1.5: Foreign Aid in US$ million . . . . . . . . . . . . . . . . . . . . . . . . . . . . . . . . . . . . . . . . . . . . . . . . . . . . .7Figure 1.6: Urbanization in East Asia . . . . . . . . . . . . . . . . . . . . . . . . . . . . . . . . . . . . . . . . . . . . . . . . . . . . . .8Figure 1.7: Vietnam's Incremental Capital Output Ratio . . . . . . . . . . . . . . . . . . . . . . . . . . . . . . . . . . . . .11Figure 1.8: Rural/Urban Poverty Levels and Changes (1993-2002) . . . . . . . . . . . . . . . . . . . . . . . . . . . .12Figure 1.9: Regional Poverty Rates . . . . . . . . . . . . . . . . . . . . . . . . . . . . . . . . . . . . . . . . . . . . . . . . . . . . . . . .12Figure 1.10: Evolution of Contribution to Poverty (percentage points) 1993-2002 . . . . . . . . . . . . . . .13Figure 1.11: Access to Clean Water, by Income Quintile . . . . . . . . . . . . . . . . . . . . . . . . . . . . . . . . . . . . .13Figure 1.12: Access to Hygienic Latrines, by Income Quintile . . . . . . . . . . . . . . . . . . . . . . . . . . . . . . . .14Figure 1.13: Households living in rural villages with road access, by income quintile . . . . . . . . . . .14Figure 2.1: Infrastructure Investment Financing Mechanisms (% of Investment Finance) . . . . . . . . .20Figure 2.2: Spending on Energy Services (% Household Expenditure) . . . . . . . . . . . . . . . . . . . . . . . . .22Figure 2.3: Average Electricity Tariffs (US$/kWh) . . . . . . . . . . . . . . . . . . . . . . . . . . . . . . . . . . . . . . . . . .23Figure 2.4: Operating Cost Coverage for 61 Vietnamese Water Utilities . . . . . . . . . . . . . . . . . . . . . . . .24Figure 2.5: Household Spending on Water Services (% Household Expenditure) . . . . . . . . . . . . . . .24Figure 2.6: Average Water Tariff (US$/m3) . . . . . . . . . . . . . . . . . . . . . . . . . . . . . . . . . . . . . . . . . . . . . . . .25Figure 2.7: Average revenues for water (US$/ m3) in 60 utilities . . . . . . . . . . . . . . . . . . . . . . . . . . . . .25Figure 3.1: Gini Indexes . . . . . . . . . . . . . . . . . . . . . . . . . . . . . . . . . . . . . . . . . . . . . . . . . . . . . . . . . . . . . . . . .46Figure 3.2: Transport Central Government Recurrent versus Capital Expenditure . . . . . . . . . . . . . .50Figure 4.1: Non-Revenue Water (%) in Asian Cities (2001) . . . . . . . . . . . . . . . . . . . . . . . . . . . . . . . . . . .64Figure 4.2: Unaccounted Water (%) in Vietnam . . . . . . . . . . . . . . . . . . . . . . . . . . . . . . . . . . . . . . . . . . . .64Figure 4.3: Water Utility Staff Ratio (Staff/1000 Connections) . . . . . . . . . . . . . . . . . . . . . . . . . . . . . . . .65Figure 4.4: Staff per 1000 water and waste water connections in Vietnam . . . . . . . . . . . . . . . . . . . . . .66Figure 4.5: Telephone Mainlines per Employee . . . . . . . . . . . . . . . . . . . . . . . . . . . . . . . . . . . . . . . . . . . . .66Figure 4.6: Transmission and Distribution Losses (% of Electricity Generated) . . . . . . . . . . . . . . . . . .66Figure 4.7: Road Maintenance Expenditure (% Total Road Expenditure) . . . . . . . . . . . . . . . . . . . . . . .67Figure 4.8: Transparency International Corruption Perceptions Index (2000-2004) . . . . . . . . . . . . . .81Figure 5.1: Percent Population with All-Weather Access to Rural Roads (2002) . . . . . . . . . . . . . . . . .89Figure 6.1: Percentage of firms ranking transport a severe or major constraint . . . . . . . . . . . . . . . . . .98Figure 6.2: Businesses' Problems with Infrastructure . . . . . . . . . . . . . . . . . . . . . . . . . . . . . . . . . . . . . . . .98

vi
Tables
Table 1.1: Investment in East Asia (% of GDP) . . . . . . . . . . . . . . . . . . . . . . . . . . . . . . . . . . . . . . . . . . . . . .3Table 1.2: Present value of repayments on a $1 loan from the World Bank Group . . . . . . . . . . . . . . . .7Table 1.3: Urbanization Forecasts . . . . . . . . . . . . . . . . . . . . . . . . . . . . . . . . . . . . . . . . . . . . . . . . . . . . . . . . . .9Table 2.1: Vietnam's Recent Investment in Infrastructure . . . . . . . . . . . . . . . . . . . . . . . . . . . . . . . . . . . .18Table 2.2: Infrastructure Investment Financing Mechanisms (% of GDP) . . . . . . . . . . . . . . . . . . . . . . .19Table 2.3: Private Investment (Contractual Commitments)-US$ millions . . . . . . . . . . . . . . . . . . . . . . .37Table 4.1: Private Participation Contracts in Vietnam . . . . . . . . . . . . . . . . . . . . . . . . . . . . . . . . . . . . . . .73Table 4.2: Responsibilities under the Main Private Participation Options . . . . . . . . . . . . . . . . . . . . . .76Table 6.1: Benefits of Possible Reforms . . . . . . . . . . . . . . . . . . . . . . . . . . . . . . . . . . . . . . . . . . . . . . . . . . . .99

ver the past decade Vietnam has madespectacular progress in GDP growth andpoverty reduction. Annual per capita
growth has averaged 5.9%, the eighth highest inthe world over the decade. Since 1990, povertymeasured at the $1 a day threshold has fallenfrom 51% of the population to just 8%.
A critical part of this success has been a highlevel of investment in infrastructure. Around 9-10% of GDP has been invested in transport,energy, telecommunications, water, andsanitation in recent years, a very high level ofinfrastructure investment by internationalstandards. Microeconomic studies provideevidence of a strong link between thisinfrastructure investment and Vietnam'sgrowth and poverty reduction.
The road network has more than doubled inlength since 1990, and its quality has improvedsubstantially. All urban areas and 88% of ruralhouseholds have access to electricity. Thenumber of fixed and mobile phones per 100people has multiplied nine-fold since 1995.Access to improved water grew from 26% of thepopulation to 49% between 1993 and 2002, andduring the same time access to hygienic latrinesgrew from 10% to 25% of the population.
Vietnam's existing infrastructure strategyhas been a success. And yet, the strategy needsto evolve and adapt as new challenges emerge.
Over the next five to ten years, officialdevelopment assistance (ODA) is unlikely togrow at the same pace as the economy, and willthus occupy a smaller part of totalinfrastructure investment. Grants and the mostconcessional forms of donor financing will
become increasingly difficult to obtain asVietnam's GDP per capita exceeds donorthresholds. In all infrastructure sectors, there isa need to develop new sources of long-termfinance as alternatives to ODA. Much of thatfinance will need to come from financialmarkets or direct private finance, requiringreforms of consumer pricing, enterpriserestructuring, and revised regulation toestablish the credit-worthiness of infrastructureenterprises.
Urbanization is adding a million people peryear to Vietnam's urban centers, providing notonly a financing challenge to meet theirinfrastructure needs, but also a planningchallenge to ensure that infrastructureprovision is timely and avoids the need forexpensive retro-fitting after urban areas arealready settled.
In past years, Vietnam could be reasonably sureof high social returns on public investment byconnecting consumers without access toinfrastructure networks. But as access levels increaseit will become more difficult to find investmentswith high rates of return, necessitating more refinedplanning systems. And as infrastructure networksexpand the cost savings available from moreefficient operation will increase, placing greateremphasis on tasks such as restructuring state-ownedenterprises, equitization, or the introduction ofgreater competition, to provide stronger commercialincentives. The elimination of corruption would alsohave a significant impact on the costs ofinfrastructure services.
Vietnam's approach to the reduction ofpoverty has been one of general reliance on
vii
Executive Summary
O

viii
growth, but with investments beinggeographically spread to ensure that all regionsparticipate in that growth. Increasingly povertyis focused in remote rural areas, ethnic minoritycommunities, and new areas of urban povertyarising from migration. As general poverty levelsfall and infrastructure access increases, theexisting approach to poverty reduction will needto be supplemented with approaches whichmore directly target individual householdsCareful review across infrastructure sectors isrequired to determine how existing subsidiescould be better targeted to address these newconcentrations of poverty, without wastingpoverty alleviation funds on the non-poor.
This report deals with cross-sectoralinfrastructure issues. Chapter 1 sets out theemerging challenges that will require a revisedapproach to Vietnam's infrastructure strategy -a reduction in ODA as a proportion of GDP,urbanization, the challenges of managing moreextensive infrastructure networks, and changesin the nature of poverty in Vietnam. Chapters 2to 5 set out the reform agenda required toaddress these new challenges, organized under
the themes of financing, planning, serviceefficiency, and poverty. Chapter 6 concludeswith a discussion of reform prioritization.
The report is accompanied by five furthervolumes dealing with transport, electricity,telecommunications, water and sanitation, andurban development. This executive summarypresents the main findings of all six volumes.
CROSS-SECTORAL ISSUES1. Investment Needs and Financing
Infrastructure investment in 2002 representedabout 9.4% of GDP. Looking to the future,sectoral plans and forecasts suggest futureannual infrastructure investment summing to11.4% of GDP, an increase of 2% of GDP overrecent levels:1● In September 2005, the Ministry of
Transport estimated future financing needsin a Medium Term Expenditure Framework,which matched proposed investment withpotential financing sources. The proposalsfor capital spending in 2006 to 2008amounted to VND 69,186 billion (US$ 4.3
1. In 2005, 2% of GDP was about VND 15,250 billion (US$ 966 million). Estimates of investment as a proportion ofGDP assume that GDP grows at 7% annually.
Figure 1: An Emerging Gap between Investment Plans and Available Financing
Source: For investment in 2002 see Table 2.1, for investment plans in 2010 see text in section 2.1, for financing sources in 2002 seeTable 2.2. Financing sources for 2010 assume that ODA grows at 2% p.a., while government and user financing (retained earnings)grow at the same pace as GDP (7% p.a.) from their 2002 levels.

ix
billion) over the three years, and averaged4.1% of GDP per year.
● In the electricity sector, investments requiredto meet the Fifth Power Master Plan amountto VND 215,078 billion (US$ 13,743 million)in the years 2005-2010, or about 3.9% of GDP.This figure is now regarded as anunderestimate, because of higher thanexpected demand growth in recent years.The financial model used by EVN to planfuture investments suggests that during2005-2010 capital expenditure will amount toVND 237,246 billion (US$ 16 billion), whichin annual terms is about 4.7% of GDP.
● In the water and sanitation sector theGovernment has set coverage targets toachieve its 2010 development goals. Thetargets are 85% for urban water andsanitation, and 75% for rural water andsanitation, which would require investmentof VND 57,547 billion (US$ 3.62 billion)during 2005-2010, or 1.2% of GDP annually.
● In the telecommunications sector, in October2005 the Ministry of Post and Telematicsadopted a target of 32-42 total telephonelines per 100 population by 2010. To achieve35 lines per 100 population would requireabout VND 57,000 billion (US$ 3.6 billion).Spread over the period 2006-2010, thiswould amount to around 1.4% of GDPannually.The forecasts should not be interpreted as an
endorsement of sectoral investment proposals.Closer analysis of the individual sector plansmay find ways of economizing on investments,increases in user tariffs could reduce demandand hence defer investment, and budgetingdecisions could result in indefinite deferral ofsome investment proposals. Nevertheless,investments dealing with electricity, water, andtelecommunications access targets are largelyunavoidable if the government's statedobjectives are to be met and should generally
yield high returns. Failure to keep pace with thegrowth of demand for electricity would likelyhave high economic costs. And the transportinvestment proposals have already beenprioritized to match existing sources of finance.
So, for purposes of thinking about financemobilization, a figure of about 10-11% of GDPseems reasonable. Nevertheless, a moredefinitive appraisal of the appropriate level ofinvestment would require a concerted effort tomonitor investment and maintenance activitiesand evaluate their financial and economicreturns.
Figure 1 illustrates the financing challengeimplied by this increase in investment. Thesources of finance in 2002 are summarized infour categories, with the category "Government"incorporating budget funding, governmentbond issues, as well as financing by State-Owned Commercial Banks. The category"Users" incorporates the retained earnings ofinfrastructure enterprises as well as communityfinancing of facilities such as small-scale ruralwater systems. The illustration supposes that thefinancing contribution by Government andUsers will grow with the economy, at 7% p.a.,but that ODA will only grow at 2% p.a. Underthese assumptions, ODA, Government and Userfinancing combined would fall short of the totalplanned/needed investment in 2010 by US$ 3billion, or 5.1% of GDP. In order to meet theGovernment's infrastructure goals, thisfinancing gap will need to be filled withexpanded Government financing, higher usertariffs, or an expanded role for the private sector.
An important source of this financingchallenge lies in the likely relative decline ofODA as a proportion of GDP. The assumptionthat ODA will grow at 2% of GDP, is purelyillustrative, and is by no means clear.Nevertheless, as discussed in Chapter 1, sometime druing 2010-2013, Vietnam is likely to begina "graduation" process in which it moves from
concessional IDA financing, to more expensiveIBRD financing. Internationally, the experiencehas been that when countries graduate, theytend to rely much less on ODA financing, and torely more on private financial markets.
While the levels of ODA in the future cannotbe predicted precisely, the overall nature of thefinancing challenge is clear. Vietnam must usethe coming years to develop financial institutionscapable of providing long-term finance forinfrastructure, and must reform its infrastructurebusinesses to become credit-worthy enterprisescapable of borrowing long-term.
Need to Increase Cost Recovery
A prerequisite for alternative financingmechanisms is cost-covering tariffs. Ensuringfull cost recovery through tariffs opens up arange of financing options that are otherwisegenerally impossible. The proportion of costsrecovered differs from sector to sector, and onlyin some sectors can it be increased. ● The principle is well established in
telecommunications and electricity. ● Charges associated with road transport,
such as vehicle registration and petrol tax,more than cover road maintenance costs,but do not cover the full cost of capitalinvested. There is scope to increase thesecharges, and there are many possibilities forrevenue to be raised from toll-roads.
● In the water sector, cost-covering tariffs havebeen embraced in the water sector in Ministryof Finance guidelines for water tariffs, and theprinciple is being considered forimplementation in a draft Government decree.But current water tariffs typically only coveroperational costs, while capital costs canoccupy 80% of total costs of a water utility.Considerable tariff increases would be requiredin the sector to achieve full cost recovery.
● In areas such as sanitation, waste water
treatment, and solid waste management, theability to raise revenues is constrained byconsumers' willingness to pay. The socialbenefits of these services typically exceedprivate willingness to pay, so a level of budgetsupport is appropriate. In these sectors thekey to mobilizing alternative financing is toprovide clear and predictable rules for theallocation of budget support, so that thefuture public revenue stream providessufficient security to mobilize investment. It ispossible to combine user payments withbudget revenues to meet the costs of serviceby means such as competitive bidding forservice delivery on a least-subsidy basis.
Other Sources of Finance
Wide-ranging reforms are required to developstronger institutions for infrastructure finance.
Governance reforms are needed for thestate-owned commercial banks to eliminateinformal pressures for "policy-lending",otherwise known as lending to projects that arenot commercially justified. In any case, directlending by banks is likely to play a relativelysmall role in infrastructure financing, because ofthe mismatch between short-term deposits heldby the banks and the long-term needs ofinfrastructure.
Bonds are a useful form of financing forinfrastructure, since they can provide long-termfinancing. The Government is making goodprogress in this area, but more needs to be donein the way of information disclosure concerningthe ability of public authorities to repay debt;and to increase the secondary activity andliquidity of the government bond marketthrough enhancements to the legal framework,improved debt issuance and management bythe Treasury, and strengthened intermediaryfunctions. As a means of limiting fiscal risks itwould be desirable for the Government to shift
x
from general obligation bonds (backed bytaxation powers) to revenue bonds (backed byinfrastructure revenues) where possible.
Decentralization has shifted greaterinvestment responsibilities to provincialgovernments. The extent to which thesegovernments have the financial resources tomeet their new responsibilities is unclear. Thesystem of transfers from the central governmentshould not undermine the incentives of localgovernments to raise their own revenues.Limits on their borrowing should be assessedbased on their ability to repay debt, rather thanthe current limits based on investment budgets.An expansion of property taxes could serve as auseful tax base to efficiently consolidate avariety of existing charges, and to provide areliable source of local government revenue.
Both central and provincial governments haveestablished specialist investment institutions,with an emphasis on infrastructure investment:the DAF and the 13 local developmentinvestment funds (LDIFs). Rationales for theseinstitutions include pooling finance from avariety of sources (reducing the risks taken by theindividual financing sources), and providingcenters of technical capacity for developinginfrastructure financing schemes. But:● They also expose the governments to fiscal risks
in the event of financing defaults. Measures areneeded to distance these institutions from thegovernments through clearer governancearrangements, and to install professionalmanagement practices to reduce risks ofdefault. Improved reporting is required toensure that the institutions' liabilities are takeninto account in assessments of thegovernment's fiscal position.
● In the case of the DAF, on-lending occurs atsubsidized rates. If investment subsidies areto be offered, differing levels of subsidiesshould be offered to different sectors inaccordance with the extent of externality or
other public finance rationale, andaccording to objective criteria.Equitization is a potential means of raising a
limited amount of infrastructure financing.Equity inputs can be used to increaseinvestment, or to retire public capital for useelsewhere. But the highest financing benefitswill not be realized if investors discount theprice they pay for the risks arising frominadequate disclosure of accountinginformation, or if investors are unable to obtainmanagement control rights.
There is great potential for more privateinvestment in infrastructure. But takingadvantage of this potential requires carefultransaction preparation and sound regulatoryenvironments. Vietnam should experimentmore with private financing than it has in thepast, developing a number of transactionsacross sectors, using competitive bidding, andcarefully monitoring the lessons learned.
Allied to the use of private financing,Vietnam should develop a risk managementframework that permits the appropriate use ofcontingent liabilities (such as guarantees) inattracting finance, but monitors and limits thegovernment's exposure.
Finally, efficiency improvements inprocurement and operation of infrastructureservices can be thought of as an alternative tothe mobilization of finance. Improvements inefficiency can increase output from existing andproposed facilities, and thereby lessen the needfor new investments.
2. Planning and Coordination
There is room for improvement in many aspectsof Vietnam's planning processes. As a result ofsuccess in increasing levels of access toinfrastructure services, it is becomingincreasingly difficult to select investmentprojects with high economic returns, requiringincreased emphasis on economic considerations
xi
in project selection. Rapid urbanization requiresimprovements in both the speed of urbanplanning processes, and also its responsivenessto local conditions. In addition to these reformsaddressing emerging challenges, there are long-standing needs to improve coordinationbetween spatial and sectoral master plans, todevelop tools to achieve national objectives inprovincial and municipal projects, and tointegrate environmental considerations intobroader investment planning.
Integrating Economic Criteria into ProjectSelection
The importance of economic criteria forchoosing between investment projects willincrease as the infrastructure stock increases.Identifying high return projects was easy whenmuch of the population lacked access toinfrastructure services. As the access rolloutadvances, choosing between investments willbecome more difficult. For example, it is noteasy to compare the social returns betweenproviding new connections in high costlocations or providing improved service qualityin areas already connected.
Better processes need to be developed forassessing investment priorities across sectorsand across projects. Ideally this would entailestimation and monitoring of rates of return,permitting an ordering of projects that could beachieved within financing constraints. A seriouseffort to build capacity in assessing economicand financial rates of return will take time. Inthe short term, a high priority should be toimprove the quality of feasibility studies,providing decision-makers with betterinformation about the relative merits ofproposed projects.
Progress is being made in relatinginvestment plans to development goals - theprinciples of the Comprehensive Poverty
Reduction and Growth Strategy (CPRGS) havebeen integrated into the Socio-EconomicDevelopment Plan for 2006-2010. But the linkbetween Vietnam's socio-economicdevelopment goals and investment planningcould be improved with the use of a resultsframework which specifies goals to be achieved(e.g. improve access to hygienic sanitation),strategies for achieving these goals (e.g.investment in sewerage systems in urban areas)and key performance indicators measuringprogress towards the goals (e.g. number ofurban households with sewerage connection).The goals should be comprehensive, andprojects would only be approved if theymapped into the strategies. An increasedemphasis on monitoring project outcomes isalso required, to inform future feasibilitystudies about the likely impact of differenttypes of investments, and to ensure thatprogress towards development goals is reallybeing made.
With improved criteria for distinguishingbetween projects, a framework within which toconsider projects' potential contribution todevelopment goals, there will then be a need fora governmental process that is capable ofallocating funds to the highest priority projects,with lower priorities receiving funding only tothe extent of available funding. Projects thatcould be financed privately should be given lowpriority for receiving public funding.
Budgeting processes need to be betterintegrated with investment planning. There hasbeen a problem with budget discipline in thepast, with transport projects being commencedwithout budget financing authorization.Questions are also raised about whether anappropriate balance is being struck betweennew investment and maintenance, particularlyin the transport sector. The Transport Ministry'srecent experience with preparation of budgetproposals within a medium-term expenditure
xii
framework (MTEF) has been a usefuldevelopment in terms of fitting proposedinvestments within the available financingenvelope and giving greater consideration tomaintenance costs. The MTEF experience shouldbe developed to extend to non-budget financesources, and to provide better information aboutthe trade-off between new investment andmaintenance (ie the relative rates of returnearned by spending in these areas).
Planning for Urbanization
Vietnam's urban population is growing by aboutone million people per year, with much of thatgrowth concentrated in Ho Chi Minh City andHanoi. It is likely that growth of Vietnam's ruralpopulation will level off in the next five to tenyears, with all new population growth beingexpressed as larger urban populations. Based onChina's example, urban growth will present arange of new problems including trafficcongestion, pollution, and the need to roll outinfrastructure services quickly. It is much moreexpensive to provide infrastructure services after
Urban planning is poorly managed atpresent. Centrally prepared spatial plans setunrealistic standards, and partly for this reasonare frequently ignored in practice. There needsto be more flexibility in centrally developedspatial plans, and more enforcement of thoseplans at the local level. Ideally spatial planningshould be devolved to a more local level, toenable greater responsiveness to localcommunities' desires and marketdevelopments. Arrangements under which landis provided to property developers in return forinfrastructure provision should be carried outthrough more transparent procedures involvingcompetition to mitigate potential risks forcorruption, land speculation, or wastedinvestments. Revised tax and fee instruments,such as property taxes, should be studied for
their potential to provide infrastructure moreefficiently and in closer synchronization withcommunity needs.
The need for more refined appraisals ofrates of return to different investments extendsto an assessment of the spatial balance ofinvestments. Vietnam has done well over thepast decade, balancing high-return investmentsin major centers of economic activity with ruralinvestments aimed at reducing poverty, andachieving high aggregate growth with only aslight increase in inter-provincial inequality.But migration to major urban centers has beenimportant in restraining inter-provincialinequality. Continued migration mayoverwhelm planning capacities in the majorcenters resulting in congestion, inadequateprovision of basic services, and environmentaldegradation. One response would be toprovide much more resources to urbanplanning in the major cities. An alternativewould be to divert migration to mid-sizedcities, but this would require wide-rangingpolicies extending beyond mere spatial andsectoral master plans. Assessing whether suchpolicies might be worthwhile would requiremuch better information about the relativesocial rates of return across different urbanareas.
Other Planning Challenges
There are general problems of coordinationacross government ministries. The need forbetter coordination between the Ministry ofPlanning and Investment and the Ministry ofFinance is a key area for better coordination, butthere is also a need to better coordinate spatialplans and sectoral master plans, particularly inurban areas.
Greater effort needs to be made to integrateenvironmental issues and assessments of socialimpacts (particularly resettlement issues) into the
xiii
overall planning environments. Whileenvironmental impact assessment may occur forindividual projects, plans for a series ofinvestment projects similarly need to be subject toassessment. While individual projects may haveonly marginal impacts, and thus be approved, theaggregate effect of a series of projects may bemuch larger, and require modification ofinvestment plans. Recent legislation requiringstrategic environmental assessments -assessments of the most critical environmentalissues in particular areas - is a positive step,
The process of decentralization is ongoing,with a gradual reallocation of spending andinvestment planning responsibilities from thenational government to provincial and localgovernments. Decentralization brings variousrisks of failure to coordinate between lower levelgovernments (eg failure to take account ofenvironmental effects on neighbors, or failure tocoordinate investments). There is a need for thecentral government to develop fiscal tools (suchas matching grants) that would help to coordinatesub-national decisions with national objectives.
3. Efficiency
In general, Vietnam's infrastructure services areprovided relatively efficiently. But as in allcountries, there is room to reduce the costs ofservice. Internationally, experience has been thatthe key to lowering costs is to increase thecommercial focus of infrastructure business entities- through reform of state-owned enterprises ordirect private investment - and the introduction ofcompetition. The sorts of reforms necessary toimprove commercial focus are also the sorts ofreforms needed to increase infrastructureenterprises' access to financial markets.
State-Owned Enterprise Reform
Central to improving efficiency is agovernance structure that improves the focus
on the commercial objectives of increasingrevenues and reducing costs. Internationally, atypical first step towards improvingcommercial incentives is "corporatization" ofbusiness enterprises - subjecting them toprivate corporations law. In Vietnam,subjecting infrastructure enterprises to theproposed Unified Enterprise Law may help toinstall the basics of corporate governance andshould be a minimum step. Additionalpossible measures include specific statementsof corporate objectives, and additionalreporting beyond that required by theEnterprise Law. Governments typically haveadditional non-commercial goals for theirinfrastructure enterprises, and these can beachieved by explicit contracting between theGovernment and the enterprises, withpayment for particular services provided.
Equitization, the sale of shares primarily toworkers and managers, has been used as a toolfor efficiency improvement in many state-owned enterprises in Vietnam. However, theworker motivation incentives that have beeneffective in smaller enterprises may be weakerin large infrastructure enterprises, where thereare greater possibilities to profit from the effortsof others (free-riding). Accordingly, it isimportant that equitization of infrastructureenterprises should involve sales of controllinginterests to general investors, and that it besupplemented by mechanisms to providestronger management incentives, such as stockexchange listing.
The agenda for state-owned enterprisereform varies across sectors. For example,the Ministry of Transport has over 200 SOEs,of which over 100 are engaged inconstruction. Many of these enterprises areexcessively indebted. Competition betweenthese enterprises results in low "survival"bids to secure contracts, a practice whichultimately results in low quality works anddelayed implementation. In a fully
xiv

developed market economy, this situationmight be resolved by bankruptcies of theleast efficient enterprises. But state-ownership tends to delay such politicallydifficult decisions. MoT has plans forequitization of SOEs, but these need to beaccompanied by clear guidelines on debtaccounting, and criteria under which certainenterprises might be declared bankrupt.
In the electricity sector, in contrast, thereform of state-owned enterprises is focused onthe transition to a future competitive market forelectricity. EVN will need to be broken up intotruly separate corporations. Decisions on thesize, structure and operational scope of newlyformed shareholding companies need to ensureadequate competition in different marketsegments, but also adequate resources to ensurefinancial viability. Distribution companies, inparticular, need to have sufficient financialstrength and managerial capacity to beperceived as credible and make long-termcontracts with generating companies.
In the water and sanitation sector, theagenda for SOE reform needs to focus onpreparing the utilities to access financialmarkets. For example, financiers are likely tohave more confidence in the credit-worthinessof water utilities if their accounts are preparedaccording to international accounting standardsand are independently audited.
Competition
Competition is the economic force most likely todeliver sustained efficiency improvements. Butthe possibility to introduce competition islimited in most infrastructure industries.Telecommunications and electricity generationare exceptions.
In telecommunications internationalexperience strongly suggests that the speed ofnetwork rollout is accelerated by greater
competition. Several new entrants have beenauthorized to compete with VNPT in fixed lineand mobile services, but VNPT remainsdominant. Effective regulation, in particularspectrum management and resolution ofinterconnection disputes, will be important infacilitating the progress of the new entrants.Faster progress could be made by allowing theentry of foreign firms. In this respect, the UnitedStates has obtained an early advantage, obtainingpreferential access for its firms under a BilateralTrade Agreement. But even these advantageslimit foreign ownership to 49% and 45% in themobile and fixed line services markets. Theselimits may unnecessarily inhibit market entry.
The 2004 Electricity Law and 2006 Road Mapfor Power Sector Reform set out plans for aphased transition over 20 years to directcompetition in electricity generation, witheventual choice of generators for consumers.There are various obstacles to the implementationof these plans, including the difficulty ofencouraging private investment in IPPs (a majorsectoral priority) when the future marketstructure is uncertain. Managing the transition toa competitive electricity sector will be one of themost difficult policy challenges in infrastructure.
Private participation
In most other infrastructure sectors,competition can only be introduced in the formof "competition for the market": competitivebidding among private investors for a the rightto provide an infrastructure service over a fixedperiod of time. Done well, with well-preparedcompetitive bidding and appropriateregulatory environments, concessions, leases,and management contracts can be strong toolsfor performance improvement as well asinvestment financing.
Vietnam already has experience in the useof BOTs, but at least some of the existing
xv
xvi
BOTs have been negotiated with a preferredoperator. Competitive bidding would providea higher probability of minimizingprocurement costs. A number of BOTs havebeen negotiated with state-ownedconstruction companies. While local financinghas advantages in terms of foreign exchangerisks, the use of foreign enterprises withspecialist infrastructure experience couldprovide more ideas for managementimprovement and utilization of newtechnology. And a difficulty with state-ownedenterprises is that weak governancestructures may provide weak commercialincentives. There is scope for greateropenness toward foreign private enterprisesin infrastructure investment. Vietnam iscurrently revising its BOT decree. A reviseddecree should entrench a requirement forcareful preparation and competitive biddingof BOT contracts.
Beyond the construction of new facilities,various forms of public-private partnershipscan help to improve efficiency of existingfacilities. Vietnam should conduct pilot projectsacross different sectors to gain experience in theuse of public-private partnerships other thanBOTs. An effective process would entail apipeline of projects, and a dedicated unitassociated with the development of public-private partnerships.
Regulation
One form of light-handed regulatory pressurefor efficiency improvements is benchmarking.Vietnam has made significant progress inbenchmarking water utilities, encouragingbetter performance by highlighting wellperforming companies that serve as examplesfor others. This experience could be copied insome other infrastructure sectors, for exampleurban environment companies, port operators,
or electricity distribution operations. Greaterattention to international benchmarking couldalso be used as a spur to improvedperformance.
More generally, performance standards andregulated prices, in addition to theirimplications for investment and financing, canbe used as tools to improve infrastructureservice performance. This is more likely to beeffective in infrastructure enterprises withstronger commercial focus, such as privatefirms. Getting prices right is a complex task,requiring specialist skills.
Regulatory institutional and capacity buildingis required, especially in the areas of cost auditingand economics (to set prices at efficient levels). Ahigh priority is support for the newly establishedElectricity Regulatory Authority, since lessonslearned here will have implications for othersectors. In the telecommunications sector, theMinistry of Post and Telematics' ownership ofVNPT creates a conflict of interest in itsregulation of the sector, for example in theresolution of disputes over access to VNPT'snetwork by new operators. An agencyindependent of the Ministry would be desirable.
Addressing Corruption
Corruption raises the final costs ofinfrastructure services, and is a source ofinefficiency. Opportunities for corruption ariseat most stages of the infrastructure project cycle.In recent years Vietnam has been makinggreater efforts to address corruption. Recentreforms have focused on detection andpunishment, but have been of generalapplication. Closer review could identifyparticular infrastructure activities at risk, anddevelop appropriate responses. Reforms toincrease competitive pressures in infrastructureare likely to complement measures againstcorruption, but should be buttressed by anti-

collusion measures.
4. Poverty
Road and water investments are good meansof targeting particular provinces in whichrural poverty levels are high, suggesting aneed to maintain high priority for theseinvestments.
Urban poverty is likely to increase incoming years. Because of the pace of migrationand urban development, addressing emergingurban poverty issues will requireimprovements in the local planning process toensure that infrastructure networks areinstalled "just in time", and in the right places.
There are many different ways of subsidizinguse of infrastructure services by the poor:● Currently, Vietnam uses increasing block
tariffs in water and electricity. While thedetails need to be studied carefully, suchschemes typically provide greater subsidiesto the relatively well-off, rather than thepoor.
● It would be useful to refocus subsidieson connection, rather than consumption,since those with connections aretypically less poor than those withoutconnections.
● Output-based methods for subsidy deliveryshould also be explored. A classic output-based scheme involves competitive biddingamong private operators for the right toprovide a service (encouraging costreductions in service provision), andpayment of the subsidy only when therequisite outputs have been achieved(transferring the implementation risk to theprivate sector).A general subsidy strategy should be
developed for infrastructure services,identifying whether subsidies are to bedelivered to the poor, and if so, how best tomaximize the benefits of those subsidies.
SECTORAL STRATEGIES
1. TransportFinancing
Transport expenditures reached 4.5% of GDP in2002, although 35% of this expenditure was notallocated budget funding and this in turn led toproblems of indebtedness in the sector. Incoming years, transport expenditure is expectedto be reduced to the order of 3.5-4.0% of GDP,although in a rapidly growing economy thisimplies continued increases in the absolute levelof transport expenditures.
ODA currently finances 37% of centraltransport expenditures. As in other sectors, theexpectation that ODA financing will not grow atthe same pace as GDP means that growingsector expenditure will need to be paid for byeither consumers or the Government. The scopefor direct user payments differs across sectors,but toll-roads are an obvious possibility forgreater direct payments. Fuel taxes (reducedsubsidies) would be a means of generatingadditional government revenue in a way that isrelated to use of infrastructure facilities. Anotheravenue would be to use land taxes to capture aproportion of the increase in land valueassociated with infrastructure improvements.
To ensure affordability of transport projects,the financing burden can be shifted to futuregenerations through government borrowing orby direct private investment. Around 30% of theMinistry of Transport's projects between 2001and 2005 were financed by government bonds,and local development investment funds(LDIFs) are also using bond financing toprovide transport projects in some provinces.The private sector could play an expanded rolein financing highways, ports and airports.
Planning and Coordination
All of the problems of planning and
xvii
coordination affecting infrastructure in generalcan be found in the transport sector. There tendsto be a gap between broad governmentstrategies and detailed sectoral plans, and littlecoordination between spatial and economicdevelopment plans. Poor budget discipline hasbeen the source of unfunded expenditures,giving rise to severe debt problems in thetransport construction industry. There ismisallocation between new investment andmaintenance; among modes, with inlandwaterways receiving a significantly smallershare of funding than is commensurate withtheir important role; and in the selection ofinvestments within each sub-sector.
The introduction of a results-oriented planningprocess at both the national and provincial levelswould help align expenditure planning with thedesired development goals. The ongoing MediumTerm Expenditure Framework (MTEF) pilotscould help remedy many of the problems in theplanning process by strengthening integratedplanning and developing investment plans withinthe envelope of available resources. Building onthe progress already made with the MTEF pilots isan important priority for the sector. Planningacross transport sectors needs to be betterintegrated, to ensure the development of multi-modal transport systems.
Rigidities in the planning system and thelack of metropolitan or regional institutions thatcan coordinate development acrossjurisdictional boundaries are obstacles to thedevelopment of effective urban transportsystems. Planning processes should encouragegrowth of high density corridors, and establishpublic transport systems to complementinvestments in road infrastructure.
Efficiency
Reform of the Ministry of Transport's State-Owned Enterprises is central to improved
outcomes in the sector. Frequently theMinistry's SOEs are over-indebted and deliverlow quality and delayed work. An equitizationprogram should be designed to close non-viableenterprises, to establish clear lines ofaccountability and improved commercialincentives for the remaining enterprises, and toprovide clear separation between Ministryfinances and enterprise finances. A furtherpossibility would be to remove ownership ofshares in the SOEs to a separate ministry, suchas the Ministry of Finance, to ensure no conflictof interest between the Ministry of Transport'spolicy role and the profit motives of shareownership.
Another important source of inefficiency isinadequate attention to road maintenance.Currently maintenance expenditures are at about50% of the necessary levels. If expenditures onnational road maintenance remain at their currentlevels over the next ten years, the condition of thenetwork would substantially deteriorate, withabout 34% of national roads being in poorcondition, including 55% of the high trafficvolume network.
Currently decisions about whether to paveprovincial and rural roads are distorted by biasin the Government budgetary system againstmaintenance. Knowing that regular budgetallocations are unlikely for ongoingmaintenance, many local governments prefer toconstruct paved roads which require lessongoing maintenance than gravel roads butwhich, depending on local circumstances, mayinvolve higher total costs over the life of theroad. The budgetary system should be revisedto ensure that decisions on road types can bebased on total life cycle cost - ie if on this basis agravel road is cheaper, then the necessarymaintenance budget should be provided.
There are many negative impacts oftransport, such as congestion, pollution, andhigh accident rates, which need to be better
xviii
xix
managed to improve the transport sector'scontribution to aggregate welfare. Efforts tocontrol congestion by limiting vehicleownership or registration in Hanoi and Ho ChiMinh City are not working. Alternativeinstruments, such as higher parking fees, andthe promotion of public transport systems mayprove more effective. Linked to congestion,both Hanoi and Ho Chi Minh City have airquality problems which could be at leastpartially addressed with improved vehicleinspections for emissions. A few relativelysimple measures, such as improved roaddesign and signage and police enforcement ofrules of the road, particularly the requirementfor motorcyclists to wear a helmet, couldsignificantly improve road safety
Building Capacity
A long term capacity development frameworkshould address needs at three main levels: thepolicies and laws governing the sector (buildingon the findings of a recently completedregulatory review); organizationaldevelopment (including stronger separation ofresponsibilities for policy development,enforcement of rules, implementation ofprojects, and operation of services), and humanresource development (training).
Implementation of project works has oftensuffered from inefficiency and low quality.Recent events have also highlighted problemsof governance in relation to projectmanagement units (PMUs). The respective rolesof PMUs, contractors, and supervisionconsultants need to be reviewed.
2. ElectricityFinancing
The capacity of Vietnam's electricity systemneeds to double in just five years, to meet
demand growth projected at 16% per yearduring 2006-2010. While demand-sidemanagement must be pushed as hard aspossible, the main solution lies in a large-scalemedium-term capacity expansion program. In2004 it was estimated that generation capacitywould need to expand from 11,000 MW at thetime, to 24,000 MW by 2010. More recentforecasts suggest this was an under-estimate.Annual power sector investment requirementsduring 2005-2010 are expected to cost over US$3billion.
The three main financing options for thesector are self-financing by EVN using retainedearnings, different types of borrowing, andindependent power investment. EVN exhibitedstrong financial performance during 2002-2004,permitting a substantial self-financingcontribution to the investment program. EVN isalso making extensive use of borrowing, fromdonors and by issuing bonds.
But increases in average retail tariffs arerequired to ensure an expanded contributionfrom self-financing and borrowing. Recent costincreases, stemming in part from powershortages in 2005, of themselves would requiretariff increases. The massive borrowing needswill also require counterpart funds from EVN tobe generated in the next few years, throughtariff increases.
EVN's purchase of power from sourcescurrently independent of EVN, including bothIPPs and imports, is expected to account formore than -half of new power productionduring 1995-2010. New IPPs wholly owned byforeign or private firms are expected to provideseveral thousand megawatts of new build-own-transfer (BOT) IPP capacity. Use of competitivebidding is strongly recommended as thestandard method for awarding new IPP powerpurchase agreements. International experiencehas been that prices and terms awardedthrough competitive bidding have providedlower costs than negotiated deals.

xx
Planning
Vietnam has established a good foundation forthe coming massive capacity expansion programwith the development of the Sixth Power MasterDevelopment Plan, covering 2006-2015, with aview to 2025. The basic institutionalarrangements, analytical capacity and analyticaltools being used are fundamentally sound.
The new Plan emphasizes expansion of allthree electricity generation subsectors - hydro,coal, and gas. Imports from China and otherneighbors are expected to increase considerably inthe future. Demand-side management should playa greater role than in the past - for example shiftingconsumption from peak times can significantlyreduce system capacity requirements.
Ongoing work will be required to ascertainthe optimal balance between coal-fired and gas-fired power plants. A central issue is the relativeeconomic costs of coal and gas - in particular, thecurrent price of coal in Vietnam appears todiverge substantially from its economic value -and this should be carefully reviewed beforesignificant investment in either sector. Greaterinvestment in exploration for gas and gas fielddevelopment will be needed in the longer term,and it is critical for Vietnam to further developthe framework for investment to ensure itremains attractive for international companies
More attention needs to be given to social andenvironmental issues in the planning process.For example: major hydro developments caninvolve significant resettlement and socialdislocation; the choice between coal- and gas-fired power plants has implications for carbonemissions; and siting of power plants andtransmission facilities must be planned withregard to local environmental effects.
Efficiency
The Electricity Law of 2004 and the recently
approved sector Road Map set the direction formajor efficiency improvements through theintroduction of competition in the powerindustry. The reform process is expected tospan twenty years, proceeding through (a)operation of a competitive market for supplyfrom generators to a Single Buyer (EVN); (b)introduction of a wholesale market, allowingbilateral between large consumers andgenerators; and finally (c) introduction ofcompetition at the retail level.
To implement these reforms, EVN will needto be broken up into truly separatecorporations. The model of EVN as a holdingcompany for assets in generation, transmission,and distribution cannot be retained if truecompetition is to be achieved. The corporaterestructuring and equitization involved will ofitself be a significant challenge. Resultingcompanies need to be strong enough to beactive market participants, but should not wieldexcessive market power. In particular,distribution companies need sufficient scale tobe reliable revenue collectors and powerpurchasing agents.
A further implication of the reforms is thatgreater flexibility in retail pricing will need to beintroduced over time, including mechanismswhich allow changes in costs to be passedthrough to consumers, and for consumers torespond.
The approved reforms could be improved bybringing forward at least some directcontracting between generators and largeconsumers and/or distribution companies. It isthis form of competition which is likely to yieldthe main efficiency gains.
A major challenge to the reform will be theexisting tight reserves in the system. In a marketsystem, supply shortages lead to high prices, assignals to induce more investment. It can takeseveral years for new capacity to come on lineand lower prices, during which politicalsupport for reform could be undermined by the

high prices. Alternatively, if prices are kept lowby regulation, additional investment may not beforthcoming from the private sector.
A linked challenge is the need to expandprivate investment. With Vietnam's limitedexperience of international investment in IPPs,there is a need to offer great certainty topotential investors about their future returns.Uncertainty over the nature of future marketdevelopments will increase the perceived risk ofIPP investments. The key here is to design thepower market to mitigate these concerns. Forexample, emphasis may be given in the marketdesign to cover load primarily with contracts,and limit spot trading to non-contractedsurpluses and to clearing differences.
Building Capacity
Existing planning strengths need to besupplemented with greater institutionalcapacity in demand-side management.
Managing the task of competitiveprocurement of a large pipeline of IPP projectswill pose considerable challenges for theMinistry of Industry, requiring much learningfrom international experience and building upof capacity in preparing 'bankable' transactions.Experienced international advisers will be anecessary element of this program, but there isa corresponding need for capacity on theGovernment's side to manage these advisers.
Linked to the reform program, there is aneed for an expansion of regulatory capacity.The Electricity Regulatory Authority ofVietnam was established recently. It needs to bean objective institution, charged withimplementation of the country's laws, with amandate recognized by all parties, andoperating as an agency separate from theMinistry of Industry's regular businessdepartments. Some areas for ERAV's earlyattention include: (a) establishment of itself witha distinct identity; (b) definition and publication
of a clear work program; (c) staff training anddevelopment; (d) agreement with industryparticipants on arrangements for informationcollection and monitoring; (e) definition ofERAV's enforcement powers; and (f) definitionof mechanisms for resolution of disputes.
3. Water and SanitationFinancing
Investment needs to meet the VietnamMillenium Development Goals in rural andurban water and sanitation by 2020 areestimated at US$ 600 million annually, which isroughly four times the annual investment in thelast ten years. Allowance can be made for agrowing economy, but even as a proportion ofGDP investment in the sector would need todouble, from 0.6% to 1.2%, by 2010. Moreover,nearly 85% of past investment in the sector hascome from ODA, which is unlikely to expandsignificantly in coming years.
Meeting the Government's developmenttargets will require greatly expanded financingfrom either the government or throughborrowing in the capital markets. Forborrowing to occur, the utilities would need togenerate operating surpluses to meetrepayment obligations, which would in turnrequire increased user fees and increasedefficiency of service providers.
One of the keys to the success of the sector ishigher but realistic and affordable tariffs. JointCircular 104 of November 2004 requires thattariffs be set to fully recover costs, which is animportant step in the right direction, butenforcement of the Circular remains an issue.The possibility of automatic indexation of tariffsto match cost increases should be considered.For wastewater, the Government should reviewCircular 67 (2003), which is perceived by localgovernments as a cap on wastewater fees at 10%of water tariffs. Wastewater operations andinvestment typically cost more than equivalent
xxi

water services, and the need for cost-coveringtariffs in the sector is the same.
As the creditworthiness of the sectorimproves, access to longer term local financingwill become important. A staged progressioncould be envisaged over the next 10 years fromcurrent reliance on ODA, through mixedfinancing, to a sector built on local capitalmarkets. Greater access to ODA funds could beprovided to utilities that are able to borrowfrom financial markets, as a means ofencouraging additional finance into the sector.Pilot projects will be required to develop credit-worthy utilities, and to develop capacity on thepart of banks or other financial institutions forloan appraisal. The Government orinternational financial institutions could play arole initially in providing some form ofguarantee to early commercial loans to thesector, in order to build confidence, but suchguarantees should not be seen as a permanentfeature.
Importantly the Government shouldconsider how best to utilize ODA. GraduallyODA should move away from production todistribution, from water supply to sanitationand from investment funding to leveraginglocal capital. Better targeting of ODA to reducepoverty will be important and Output BasedAid (ODA) should be considered as amechanism for the use of grant financing forpoverty interventions.
Planning and Coordination
Over the long term the government shouldconsider rationalizing into one entity thevarious line agencies that are currentlyresponsible for policy and oversight of waterand sanitation in the urban and rural areas. Inthe meantime the existing legal frameworkneeds to be upgraded to support the NationalRural Water and Sanitation Strategy. Inaddition the sector policy/regulatory role of
CERWASS should be more clearly separatedfrom its role as service provider.
Efficiency
Overall, Vietnam's water utilities areperforming well by developing countrystandards. But there remains wide variationbetween utilities in the costs of service andcommercial performance, suggesting significantroom for improvement for many utilities.Possible measures for improving performanceof the utilities include:● More widespread knowledge about the top
performing water companies andbenchmark capital and operating costs. Theexisting benchmarking system could beimproved and made available more widely,to be used by provincial governments andpotential private investors for cross-sectoralcomparison, and by utility managers tohighlight areas for improvement.
● Policies to provide incentives to watercompanies to achieve higher levels ofperformance. A system of incentivesrequires a strict evaluation of performanceand the use of rewards and sanctions whichaffect both the utility and its owners. As afirst step, performance contracts could beestablished between individual ProvincialPeoples Committees and their serviceproviders, with rewards/sanctions forperformance against agreed targets. In thecase of poorly performing water servicecompanies, PPCs could choose tocompetitively bid unserved district towns tonew water supply service companies.
● Competition between water servicecompanies could be also simulated, withrewards (eg greater access to Ministry ofConstruction finance, or donor finance)for companies that meet agreedperformance targets, or are the bestperforming companies in the country, or
xxii
that show the greatest improvement inperformance.
● The country should continue to encouragethe involvement of the private sector as aspur for efficient service delivery, andpossibly as a source of investment financing.The national private sector has a distinct roleto play in providing services to smallertowns and in the rural setting.
● Improved regulation. At present provincialgovernments are effectively both tariffsetters and owners of water servicecompanies, creating a conflict of interestbetween the goal of keeping tariffsaffordable for consumers, and the goal ofprofitable operation of the companies. Anational oversight agency (nascentregulator) could be established to provideadvice/guidance to Peoples' Committees ondesign of performance contracts, andexpected performance of water servicecompanies.
● Focusing on core businesses. Water servicecompanies should divest their constructionand other services from the water business.This would provide the basis for thedevelopment of a competitive market forconstruction services and reduce theopportunity for hidden cross subsidies.Progress on sanitation services is lagging
well behind water services. Establishingbusiness entities responsible for the provisionof sanitation services is the immediate priorityin sanitation reform. Merging wastewateractivities into the business of urban waterservice companies, to take advantage ofoperating and administrative synergies, shouldbe considered in all but the largest cities, whereseparate wastewater companies may beappropriate. The Government should continueto support soft interventions which highlightthe linkages between sanitation, improvedhygiene practices, and health outcomes, andbuild demand for investments in sanitation.
Building Capacity
The provision of incentives to service providerswill only be successful if there is adequateinformation about the sector, and there isadequate capacity to respond to thatinformation in both service providers andoversight agencies. In particular a sanitationstudy is required to develop and keep updatedcomprehensive and reliable data.
The Government needs to be more active incompiling, analyzing and disseminating sectordata. Through such activity the Governmentcan build its capacity to improve policydevelopment and the targeting of ODA funds.
The Peoples Committees need to improvetheir understanding of the opportunities forsector development and how they can benefit.National agencies should take a lead in theprovision of training in introducing andmaintaining commercial relationships, andeffective corporate governance and oversight.
The Vietnam Water Supply Associationcould play a bigger role in building technicaland managerial capacity in service providers. Acoordinated action to reduce non-revenue waterand improve energy efficiency could yieldsignificant benefits. Training for small-scaleproviders should be offered to enhance theirmanagement and financial capability, andcapacity for quality control, contract andcontractor management.
4. TelecommunicationsFinancing
In October 2005 the Ministry of Post andTelematics adopted a target of 32-42telephone lines (fixed plus mobile) per 100population by 2010. The investment requiredto meet this target, given the current level ofabout 20 per 100 population is about VND 57trillion (US$ 3.6 billion) spread over fiveyears. This compares with a total investment
xxiii

budget for VNPT in 2003 of aroundUS$ 313 million.
VNPT's main sources of profits - highlypriced leased lines and international calling -will be reduced as competition is increased, soself-financing of investments will be reduced.New sources of finance will need to bedeveloped. Possible sources of finance couldinclude bonds or issuance of shares. Currentbusiness cooperation contracts (BCCs) withforeign telecommunications companiesgenerate hundreds of millions of dollars ofinvestment, but the restrictions on this sort ofinvestment (such as the absence of managementrights for the foreign investor) means thatbillions of dollars of private investment throughBCCs is unlikely. A move to true joint ventures,desirably with the possibility of majorityprivate ownership, management control rights,and equity returns, would be likely to generatehigher levels of investment.
Following international experience, there isgreat potential for increased direct privateinvestment, domestic and foreign, in the sector,but this would require major improvements inthe regulation and operation of the sector. Thereforms required to encourage privateinvestment are broadly the same as thoserequired to increase access and improveefficiency.
Planning
Market forces, appropriately regulated, couldachieve most of the government'stelecommunications objectives, without theneed for detailed planning of investments andoperations by the Government. To arrive atsuch a position a wide range of policy reforms isrequired to increase access and improveefficiency.
At present there is no roadmap for policychange. Plans and decrees tend to beengineering documents or penetration goals,
not well-thought-out mechanisms using policychanges that reflect international best practice.There is a need for more policy planning andlinking processes and policy changes toanticipated results. Part of this process shouldbe the development of a moderntelecommunications law that the WTO,international best practice, and investors wouldrecognize as a model.
One area where market forces couldpotentially be supplemented with centralplanning is rural access. On this subject, regardshould be had to the WTO Reference Paper,which states that although WTO members mayundertake any universal service obligation(USO) regime they like, the USO scheme mustbe administered in a transparent, non-discriminatory and competitively neutralmanner.
Improving Access and Efficiency
The major priority for the sector should be tointensify and entrench competition in the sector.Competition provides positive incentives forincreased productivity and responsiveness tocustomer needs. Internationally, strongercompetition has also been linked to fasterexpansion of access to telecommunicationsservices.
Many elements are needed to promotecompetition. A clear vision of a future industrystructure needs to be devised and disseminated.This structure should have several viableoperators, each totally independent of eachother, and all subject to impartial regulation.VNPT's multiple ownerships in every marketsegment, particularly mobile telephony, shouldbe eliminated. VNPT's equipmentmanufacturing, postal and postal girobusinesses should be separated from thetelecommunications businesses.
Another key element of achievingcompetition and private entry is licensing. The
xxiv

Government should move to a class licensingsystem that will streamline and clarify licensingprocedures. Properly implemented, improvedpolicies could generate substantial revenues forthe State budget.
Enforcement of a credible and equitablenetwork interconnection regime is critical tofacilitate new entry as well as to provideincentives for existing operators to makeinvestments. A study of current interconnectionpractices should be undertaken, identifyingcarrier complaints, abuses if any, and the effectsof VNPT's market dominance. Other regulatorytasks that are central to effective competition arerules on numbering and on spectrum allocation.
A minimal step towards the promotion ofcompetition would be compliance with theprovisions of the Vietnam-USA Bilateral TradeAgreement. WTO accession could be used as aforum for further development of pro-competitive reforms. A telecommunicationsoffer will be required for accession, which couldaddress issues such as opening of variousmarket segments to foreign participation,possibly increasing private ownership above50% in at least some market segments, settingrealistic deadlines for proposed changes, andmeeting the Telecommunications ReferencePaper requirements.
Finally, supporting these pro-competitivepolicy reforms, there will be a need forimproved regulatory processes. Considerationshould be given to the establishment of a non-ministerial telecommunications regulatorybody and the respective responsibilities of thisbody and the ministry. As a first step aRegulatory Committee could be establishedwithin the Ministry; with the goal of having thisCommittee become the basis of a laterRegulatory Authority.
Building Capacity
Whatever institutional arrangements are made,
there is a growing need for enhanced capacityin regulatory issues. While price regulation canbe relaxed in competitive market segments,issues of market dominance will remain forsome time. In these areas, complicatedregulatory issues arise such as collusion onprices, development of inflation-linked pricecap formulas for maximum tariffs, dominantcarrier abuses of pricing, and analysis of costsunderlying prices. A considerable investment intraining and contracting-in of internationalexperience is required to address these topics.
5. Urban Development Strategy
Some of the most pressing issues for urbandevelopment strategy are investments in watersupply, wastewater collection, wastewatertreatment and urban transport. To a largeextent, these challenges and proposed strategiesfor dealing with them have been dealt withabove, along with the challenges of urbanplanning and financing of municipalinvestment.
Other significant forms of infrastructure forurban development include solid wastemanagement and housing. Safe disposal of solidwaste is becoming a major issue in Vietnam,particularly in the larger cities. Sound policieshave been put in place for solid wastemanagement but enforcement of these policiesremains problematic. Only 17 out of 91 disposalfacilities in the country are reported to beproperly designed sanitary landfills withleachate collection and treatment facilities. TheGovernment has designated 50 waste dumps asenvironmental hazards that should be closed assoon as possible. A national policy framework,with inspection and enforcement, is needed toensure that municipal governments dealappropriately with solid waste.
About 25% of the urban population wasliving in substandard or temporary houses in2002. The new Land Law of 2004 provided
xxv
incentives for property developers to buildplanned developments. This created a housingboom in major cities, with state-ownedcompanies taking on the role of commercialdevelopers. But the boom is geared largely tomiddle and upper income earners, and theprovision of appropriate housing for lowincome people remains a major challenge forthe Government.
The Government is reluctant to embark onsubsidized state housing because it has onlyrecently extracted itself from many of theproblems associated with poorly managed statehousing provision, such as poor housingmanagement, and insufficient cost recovery formaintenance. Measures which could beexplored include the release of land fromGovernment ownership to increase the supplyof land in private ownership and hence lowerits price; provision of incentives to developersto invest in rental properties; and developmentof the housing finance market as part of broadfinancial sector reform. A cost effective way toimprove living conditions for the poor isthrough urban upgrading of tertiary levelinfrastructure (drains, sewers, water supply,paved roads/alleys, street lighting, etc),providing householders with security of tenure(land use right certificates), and micro-financeto enable residents to improve their houses.Research from other countries show thatresidents invest up to seven times in theirhouses what the city invests in infrastructure.
REFORM PRIORITIZATION
It would be difficult for the Government toimplement all of the recommendationsidentified in these volumes simultaneously.Accordingly, there is a need to set priorities.Factors that could be taken into account insetting priorities include the extent to whichparticular sectors act as constraints to Vietnam'sinternational competitiveness, simple estimates
of the potential benefits of different sorts ofreforms, and the administrative capacity ofdifferent ministries to handle reform.
In the central ministries of Finance, Planningand Investment, and Construction, a majorpriority should be the development ofimproved mechanisms for project selection,monitoring, and evaluation. The centralministries could take the lead in cross-sectoralcapacity building to improve the quality ofproject feasibility studies and monitoring andevaluation activities. The aim should be toobtain high quality economic analysesindicating expected and attained rates ofeconomic return. These estimates should beused as central criteria in selection of projectsfor public financing and investment approval.
Chapter 3 highlights the need for a betterintegration of financial planning with otheraspects of planning. A mechanism needs to befound by which available taxpayer funds areallocated to infrastructure projects wherenecessary, by which taxpayer funds are notinvolved where not intended, and whichprovides financing alternatives for sociallyprofitable investments where taxpayer fundingis not required. These processes should be tiedto results frameworks providing strategies thatlink individual projects to development goals,and which should be prepared by sectoralministries.
Reforms of capital markets identified inChapter 2 will require a series of reforms, manywithin the responsibility of the Ministry ofFinance. Among these reforms, preparing theway for private infrastructure investment is aparticular priority, given the proposedimportance of the private investment in theelectricity sector and for its potential role infinancing and improving efficiency in othersectors. Here the Ministry of Planning andInvestment will have a key role. Reform of theBOT legal framework is one step, but muchbetter project preparation and improved
xxvi

xxvii
regulatory institutions will also be required.Efforts to build regulatory expertise could beginwith improved emphasis on rules-basedregulation within the public sector.
Among line ministries, the sectoral prioritiesdiffer in nature. ● In transport, where the emphasis has been
on road building, increased attention mustbe given to reform of state-ownedenterprises and to the provision of adequateresources for maintenance.
● In electricity, the private sector will play alarge role in meeting new investment needs.Adequately preparing projects for privateinvestment will be the biggest challenge inthe coming years.
● In telecommunications, the priority shouldbe to encourage greater levels ofcompetition through greater private sectorentry and entry by foreign firms andthrough improved regulation, particularlyregulation of interconnection terms andconditions.
● In water and sanitation, investment targetswill be driven by Vietnam's developmentgoals. A contribution to financing will comefrom increased user tariffs. Particularly insanitation where user willingness to pay islower, there will be a need to determine anappropriate public contribution toinvestment and appropriate mechanism forit to be delivered.
ietnam's overarching economic goals areto promote strong economic growth andto ensure that the benefits of growth are
equitably distributed. In the infrastructure sectorsthese broad goals are supplemented by goals ofproviding universal access to basic services. ThisVietnam Infrastructure Strategy provides a set ofproposed policy reforms and actions aimed toimprove the achievement of these goals. Itproposes a framework under which Vietnam canbetter evaluate which investments to undertake,and how to finance them, how to improve theperformance of infrastructure services, and howto target infrastructure interventions to the needsof the poor.
At first glance it may appear odd to suggestthat Vietnam's approach to infrastructure shouldchange. With infrastructure playing an importantrole in Vietnam's 7% economic growth rate and inthe reduction of poverty, the Government'sstrategy over the past decade has served thecountry well. Of course, no matter how well thestrategy has worked in the past, there is alwaysroom for improvement. But in addition there areimportant changes under way in the economythat demand refinements to the strategy for theyears to come. Among the changes are theapproaching end of concessional sources offinance, increasing urbanization, an emergingneed for increased maintenance, and increasinginequality between provinces. These changeshave implications for the sources of infrastructurefinance, the way investments are planned, how
infrastructure services are managed for efficientoperation, and how the Government will addressissues of inequality and poverty.
1.1. Growth and Poverty Reduction
Over the past decade Vietnam has beenremarkably successful in stimulating growthand reducing poverty. The average rate of GDPgrowth in the ten years 1994-2003 was 7.4%,while average growth of per capita income was5.9%.2 Figure 1.1 compares Vietnam's growthperformance with some of Vietnam's neighbors.It should be borne in mind that regionalcompetition in terms of GDP growth is strong:Vietnam's average GDP growth in 1994-2003was eighth best in the world.
A key factor in this success is considerablegovernment emphasis on investment, andinvestment in infrastructure in particular. Asseen in Figure 1.2, since 1997 infrastructureinvestment has outpaced GDP growth,boosting the economy's productivity. Table 1.1illustrates that Vietnam's total investment andinfrastructure investment have been highrelative to other regional countries in recentyears (and East Asian countries have highinvestment rates compared to the rest of theworld). The Government's focus oninfrastructure is illustrated by the fact thatbetween 1997 and 2002 about 44 percent of totalstate investment was directed toinfrastructure.3
1
1. Achievements and Challenges
2. Source: WDI (April, 2005).3. Source: Government Statistics Office. State investment includes the following categories: State budget, State
credit and owned outlays by state enterprises.
V

Vietnam's investment strategy has played acrucial part in delivering economic growth. Thereis no real doubt about this. Increasing theeconomy's capital stock boosts output. The size ofthe boost is determined by the marginalproductivity of capital and by the size of theincrease in the capital stock. Numerous micro-economic and macro-economic studies havedemonstrated high rates of marginal productivityof infrastructure; and Vietnam has had largeincreases in the stock of infrastructure bycomparison with other countries. Even if othermatters were the ultimate causes of growth, lowerlevels of infrastructure would have severelyconstrained Vietnam's growth potential.4
The linkage between large-scaleinfrastructure and growth has been confirmed inmicro-economic studies. In 2003, theGovernment and international donorsundertook a comprehensive review of large-scale infrastructure investment in the country inpreparing the Comprehensive PovertyReduction and Growth Strategy (CPRGS). Thereview examined the socio-economic impact of anumber of key large-scale infrastructureprojects, including the improvements to theNational Highway No. 1, the My Thuan bridge,the Hanoi-Hai Phong transport corridor (see Box1.1) and the North-South 500 kV electricitytransmission line (GRIPS Development Forum,
2
4. In the standard Solow-Swan model of economic growth the economy is specified as a production functionY=AF(K,L), where Y is output, A is a technology factor, F is a concave function, K is the capital stock and L is the laborstock. There is a mechanical boost to output when K is increased exogenously, which in the short term shows up asgrowth. In the longer term, however, the growth rate is given by g = a + n: growth is the sum of the rate oftechnological growth plus growth of the labor force. After a short term boost to the growth rate from increased capitalaccumulation, the economy continues to grow at its steady state rate, g, albeit at a higher level of GDP. Issues oftheoretical debate include: whether higher levels of infrastructure boost a, the rate of technological/organizationalinnovation, and thus the long term growth rate; and whether underlying institutions explain why some countriesinvest in infrastructure more than others (in which case it is institutions not infrastructure that “cause” growth). Amore empiric question in Vietnam is the extent of the relative contributions to growth of capital accumulation versusother contributions, such as agricultural reform or opening up to foreign trade. But there is little doubt thatinfrastructure investment has played a significant role, at least in the short term.
Source: General Statistics Office (GSO). Infrastructure investment includes transportation, telecommunications, water, gas andelectricity

2003). Overall, the study confirmed thecritical role played by trunkinfrastructure in opening up newbusiness opportunities, and promotingincome diversification and off-farmemployment. The study also showedthat trunk infrastructure facilitated thespread of economic linkages betweengrowth centers and their surroundingrural areas, proving the vitalimportance of connecting remote areaswith power grids, and trunk roadswith feeder roads to achieve poverty-reducing growth.
Strong growth has played a crucialrole in lifting millions out of poverty.Among the comparator nations ofFigure 1.3 Vietnam has the strongestperformance in reducing povertymeasured at the $1 a day poverty line,lifting 43% of its population out ofpoverty and reducing poverty to aforecast 8% of the population in 2005.The poverty headcount at the $2 a daylevel fell by 39 percentage points,surpassed among the comparators onlyby China's reduction of 40 percentagepoints. The reduction in poverty ratesis particularly evident in the mid-
3
Table 1.1: Investment in East Asia (% of GDP)
Investment (2003) Infrastructure (1998) Infrastructure (2003)
Cambodia 22 2.9 2.3 Indonesia 16 3.1 2.7 Philippines 19 5.6 3.6 Lao PDR 20 1.7 4.7 China 44 2.6 7.3 Vietnam 35 9.8 9.9 Thailand 25 5.3 15.4
Note: Investment is gross capital formation as a % of GDP, source: WDI (2005). The source for expenditure on infrastructure is ADB, JBIC and World Bank (2005), “Connecting East Asia,” Appendix A, Table 7. The infrastructure data include capital and recurrent expenditure, although in some cases some expenditure elements may not be included. See source for details.
My Thuan bridge
Source: General Statistics Office (GSO). Infrastructure investment includestransportation, telecommunications, water, gas and electricity

4
Hanoi (the national capital) and Hai Phong (with thelargest international port in the north of the country)are the two growth centers in northern Vietnam.
In recent years, the provinces along the Hanoi -Hai Phong transport corridor have demonstrateddynamic economic performance. With theimprovement of National Highway No.5 and theexpansion of Hai Phong Port, the transport corridorhas reinforced the link between the two growthcenters, and has enhanced the access of Hanoi toglobal markets by improving land and sea transport.5Foreign direct investment (FDI) in major industrialzones has increased significantly, particularly since2000, driving industrial and export growth in thenorth. An interview survey with over 70 FDI firmmanagers suggests that nearly 90 percent of newinvestments would not have been realized without theimprovement of National Highway No. 5 and the HaiPhong port. The survey indicates that those managerswere attracted by the benefits, such as (i) costreduction in transporting imported inputs, (ii) time-saving in delivering raw-materials and final products,
(iii) improved coordination of production and salesschedule.6 Many new jobs were created by the newFDI.
Moreover, growth has spread to neighboring areas,particularly Hung Yen and Hai Duong provinces(located between the two economic hubs), while therural economy has experienced major transformation.Rural households have diversified their agriculturalproduction (from rice to fishery and poultry) and havebeen increasingly engaged in new businessopportunities. More convenient transportation has alsospurred demand for tourism in Ha Long Bay (in effect,there is now a Hanoi-Hai Phong-Ha Longdevelopment triangle).
As a result, most of the provinces in the Hanoi-HaiPhong corridor achieved faster growth in per capitaincome and reduction in the number of poorhouseholds, compared to the average for the Red RiverDelta or the whole country.Source: GRIPS Development Forum (2003).
Box 1.1: The Hanoi-Hai Phong northern transport corridor
5. Improvement of National Highway No.5 and the expansion of the Hai Phong Port was financed by Japan (JBIC)and Taiwan. The parallel improvements in rural feeder roads were financed by the World Bank, DFID and JBIC.
6. Source: JBIC/ IDCJ (2003), “Impact Assessment of Transport Infrastructure Projects in Northern Vietnam”.
Source: World Bank (2004). "East Asia Update, November 2004". Missing data have been interpolated.

1990s, when a large cohort passed the $1 a daypoverty line. Enthusiasm about the reduction inpoverty rates should be tempered by therealization that this cohort remains close to thepoverty line and would be vulnerable to anyeconomic downturn. Almost 50% of thepopulation remains poor at the $2 a day level.While Vietnam has made remarkable progress,much remains to be done to eliminate poverty.
The role of infrastructure investments inthese reductions in poverty has been examinedby Larsen, Pham and Rama (2004). The averageprovincial poverty rate in 1998 was 41.7% ofprovincial population, with a maximum of 97%and a minimum of 2.2%. Analyzing provincialdata they find that an additional US$ 50 millionspent on infrastructure investments is associatedwith an average reduction of about 2% of thepoverty rate (on average, about 0.8 percentagepoints reduction in the headcount measure ofpoverty). They further find that the impact onpoverty is greater in the poorest provinces andlesser in the richest provinces. Disaggregatingthe figures for infrastructure investment theyfind that investments in water and sanitationvery strongly reduce poverty, transport projectsstrongly reduce poverty, and electricityinvestments make virtually no impact onpoverty in the local province. This last findingcan be understood when it is noted that powerinfrastructure frequently benefits many outsidethe province in which it is located.
1.2 Improved Access
Vietnam's program for infrastructureinvestment is necessarily large: investment must
reduce the infrastructure deficit facing Vietnamin the early 1990s at the same time as meetingthe needs of a fast-growing economy. Eachsector has seen impressive growth in terms ofaccess to services.● Vietnam's road network has expanded from
96100 km in 1990 to 205,782 km in 2002.7National level roads expanded from 15,100km with 36.6% in good condition in 1997 to17,300 km with 44.8% in good condition in2002.8
● Access to improved water grew from 26% ofthe population to 57% between 1993 and2004, with 48% of rural households and 82%of urban households having access in 2004.Access to hygienic latrines grew from 10% ofthe population to 31% between 1993 and2004, with rural access at 16% and urbanaccess at 76% of the population in 2004.9
● Teledensity (number of fixed and mobilelines per 100 people) increased from 1.08 in1995 to around 20 in 2005.10
● All urban areas in Vietnam are electrified. Inrural areas, electrification grew from 51% to88% of households between 1996 and 2004.11
5
7. Sources: WDI (April 2005) for 1990 figure; JBIC Sector Study for Transport Sector in Vietnam August 2003 for2002 figure.
8. Source: VITRANSS.9. Source: Vietnam Development Report 2004, World Bank, constructed using GSO data. Note that access estimates
differ substantially in Vietnam, as discussed in the water and sanitation sector chapter.10. Source: ITU.11. Source: EVN.
Rural electrification
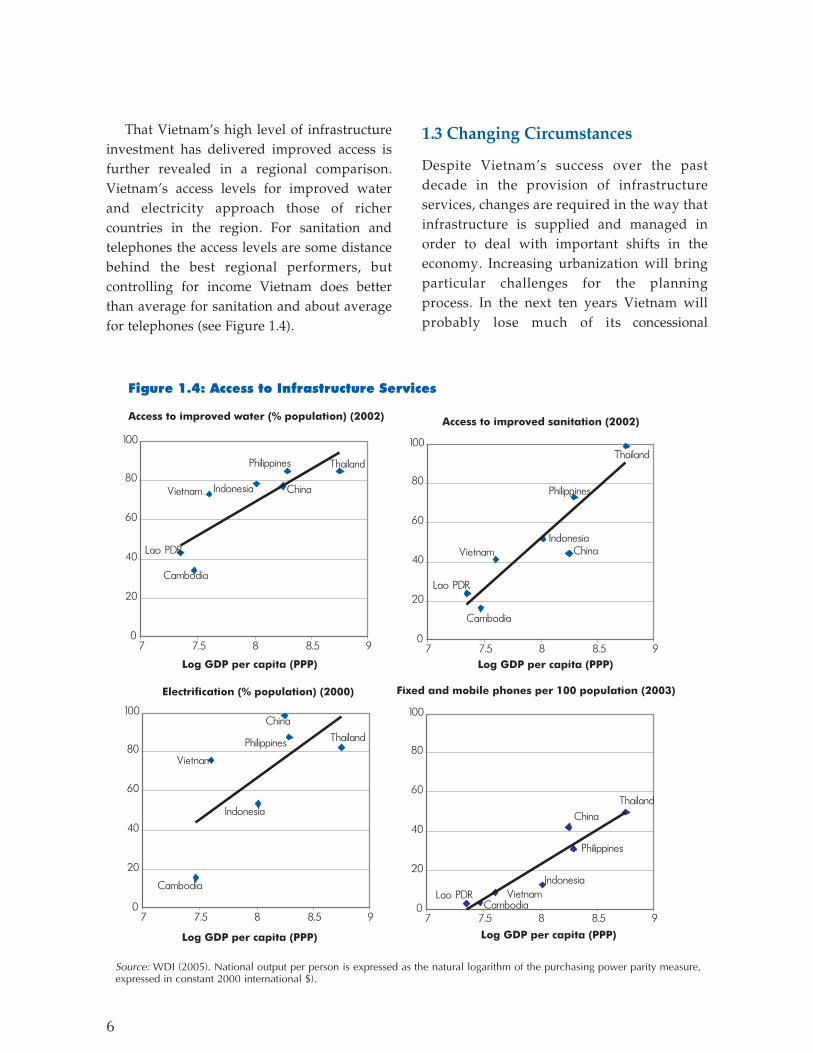
That Vietnam's high level of infrastructureinvestment has delivered improved access isfurther revealed in a regional comparison.Vietnam's access levels for improved waterand electricity approach those of richercountries in the region. For sanitation andtelephones the access levels are some distancebehind the best regional performers, butcontrolling for income Vietnam does betterthan average for sanitation and about averagefor telephones (see Figure 1.4).
1.3 Changing Circumstances
Despite Vietnam's success over the pastdecade in the provision of infrastructureservices, changes are required in the way thatinfrastructure is supplied and managed inorder to deal with important shifts in theeconomy. Increasing urbanization will bringparticular challenges for the planningprocess. In the next ten years Vietnam willprobably lose much of its concessional
6
Source: WDI (2005). National output per person is expressed as the natural logarithm of the purchasing power parity measure,expressed in constant 2000 international $).

financing, so it must begin to find alternativefinancing sources. Where once the main challengewas one of access-just ensuring that people wereprovided with infrastructure services-increasinglythe emphasis will be on ensuring that the serviceprovided at a reasonable price and quality. Therewill be an increasing need to ensure adequatemaintenance and operational efficiency tominimize costs, and effective regulation todistribute costs appropriately across current andfuture taxpayers and consumers. And finally,there is evidence of increasing inter-provincialinequality, which will require new approaches toensure inclusive development.
1.3.1 Impending Loss of ConcessionalFinancing
Over the next decade Vietnam is likely to loseaccess to the cheapest sources of donor funds,resulting in a large increase in financing costs.An increase in the cost to government of donorassistance has important implications for thecost of infrastructure investment overall.
Figure 1.5 indicates the level of foreigndevelopment assistance received by Vietnam
since 1994. ODA has averaged 4.4% of Vietnam'sGDP. Over the same period, World Bankcommitments to Vietnam have averaged 1.5% ofGDP, of which commitments to infrastructureprojects have averaged 0.77% of GDP. Apartfrom an $11 million grant from the GEF in 2002-2003 and $75 million of project guarantee at0.75% in 2003, all of the World Bank lending wasby IDA, which lends at low concessional rates.
The threshold for IDA borrowing currentlystands at a GNI per capita of $895. Countriesthat exceed this threshold begin a transitionperiod of several years in which theyprogressively lose the right to borrow at IDA'sconcessional rates, and 'graduate' to borrowingfrom IBRD. In 2003, Vietnam's GNI per capitawas $480. Over the period 1995-2003, the growthof GNI per capita expressed in US dollarsaveraged 10.5%, while in the five years to 2003the average growth rate was 6.6%. Supposingthat GNI per capita continues to grow atsomewhere between these two rates and that thethreshold remains unchanged, Vietnam willcommence the graduation process between 2010and 2013.
Graduation greatly increases the presentvalue of loan repayments on new loans,although it does not affect repayments on thestock of existing loans. A typical IDA credit has
7
Table 1.2: Present value of repayments on a $1 loanfrom the World Bank Group
’
5% 10% 15%IDA $0.45 $0.20 $0.11IBRD $0.74 $0.48 $0.34
Note: These calculations are indicative only, based onstandard lending conditions. Loan terms for specificcountries may differ from those assumed here. Calculationsfor IBRD assume a fixed spread loan with an interest rate of2.3% and constant principal repayments.
Governmen’s Discount Rate

a duration of 40 years, with a grace period of 10years, no interest payable, and a service fee of0.75% per annum. A typical IBRD loan has aduration of 25 years, a 3 year grace period, aninterest rate currently in the order of 2.3%, and aservice fee in the first four years of 0.85%. Table1.2 sets out the present value of the futurestream of repayments for a hypothetical loan of$1 from IDA or IBRD. The table indicates that ifthe Government of Vietnam has a discount rateof 10%, when it borrows $100 million from IDA,all the future repayments spread over 40 yearshave a present value to the government of just$20 million. But borrowing $100 million fromIBRD, the cost to the Government in presentvalue terms more than doubles to $48 million.12
IDA eligibility also has implications beyondthe cost of borrowing from the World Bank. TheWorld Bank's classification is the starting pointfor consideration for concessional funds anddebt restructuring terms by other multilateraland bilateral institutions. Consequently withinthe next ten years the cost of borrowing fromother donors is also likely to increase.
It should be noted that even for IBRD loansthe present value of repayments is less than thepresent value of the loan funds received.Provided the money is invested in soundprojects, it makes good sense to borrow as muchmoney as possible under these terms. Aftergraduation Vietnam should still find itfinancially attractive to borrow as much aspossible from the Bank Group, but in doing sothe social cost of repayments will represent a
higher proportion of GDP. Consequently, theGovernment will need to generate morefinancial resources to maintain the same level ofphysical infrastructure investment.
To give a very rough indication of theimportance of the increase in financing costs, wecan consider the 1996-2000 Public InvestmentProgram (PIP). Donors provided VND 76,090billion (around US$ 4.8 billion) for transport,energy, water and sanitation projects in the PIP.13
This sum represented 72% of funding for thesePIP projects. If all of this funding had been onIDA terms and if the government's discount ratewere 10%, the cost of the borrowing in presentvalue terms would have been VND 15,218 billion;if all donor funding had been on IBRD terms, thecost would have been VND 36,523 billion. Thedifference is VND 21,305 billion, or about 1.2% oftotal GDP during the period.
8
12 The arithmetic of these calculations can be understood supposing a very simple loan arrangement, whereprincipal (P) plus interest (r) are repaid in one single payment after n years. Using the government’s discount rate (),at the time the loan is incurred the present value (PV) of the future repayment is thus:
PV = P x (1 + r)n
(1 + d)n
Provided the government’s discount rate is greater than the interest rate, the present value of money repaid is lessthan the principal. The greater the discount rate, the smaller is the present value of repayments. The logic followsthrough to the case of multiple repayments.
13. Larsen, Pham and Rama (2004).
Source: WDI (2005). GDP per capita data from 2003.

1.3.2 Urbanization
High urban population growth is anticipated to bethe primary driver of future infrastructureinvestments. Currently Vietnam's population ispredominantly rural, reflecting its current level ofdevelopment. In 2003 the population was 25 percent urban. But as Vietnam's economy grows, it islikely to follow most of its regional neighborstowards higher rates of urbanization (see Figure1.6). Already Vietnam's cities and towns accountfor about 70 per cent of total economic output, andmost foreign direct investment is directed towardscities. Economic opportunities in urban areascurrently attract about one million peoplemigrating from rural areas each year. As a resultthe urban population is currently growing at a rateof 2.9% per year, compared with a total populationgrowth rate of 1.1%.14 It is likely that growth ofVietnam's rural population will level off in the nextfive to ten years, with all new net populationgrowth being concentrated in urban areas.Comparing China's historic income andurbanization rates with Vietnam and extrapolatingforward based on Vietnam's expected incomegrowth, Vietnam's urban population is likely toaccount for 45% of the total population by 2020.
Urban settlements are categorized into sixclasses by the Ministry of Construction, based onphysical criteria, population, populationdensity, level and nature of economic activity,GDP, and infrastructure provision (see Table1.3). The smallest towns to be classified as urbancenters (Class V) have a population of more than5000, with over 65% employed in non-agricultural sectors. The average population ofeach urban classification is expected to triplebetween 2000 and 2020. The Government'sstrategy is to promote urbanization of districttowns and some rural areas as a means ofreducing migration to the large cities. Buturbanization projections suggest a decreasingproportion of the urban population is expectedto live in Class IV and V district centers andtowns.
The major growth triangles can be identified inthe Red River Delta bounded by Hanoi, Haiphongand Halong in the North; the Mekong Deltaanchored by Ho Chi Minh City in the South; anda Central triangle based on Danang. Fast growthin urban population is expected to strain currenturban infrastructure capacity, revealing majorbottlenecks in infrastructure service provision.These bottlenecks are likely to be particularly
9
Table 1.3: Urbanization Forecasts
Urban Class Number of Cities
% of urban population
Number of Cities
% of urban population
Number of Cities
% of urban population
Hanoi & HCMC Special Cities 2 37% 2 39% 2 40%
National Cities Class I 3 9% 3 10% 3 11%Regional Cities Class II 12 15% 12 16% 12 17%Provincial Cities Class III 16 7% 18 8% 20 9%District Towns Class IV 58 14% 62 13% 66 12%Townlets Class V
612 18% 1172 14% 1831 11%
14. Source: WDI (2005), data for 2003. Note that urbanization projections vary. The GSO forecasts 22% urbanpopulation by 2020.
1998 2010 2020

pronounced in and around the major urbanareas such as Ho Chi Minh City, Hanoi,Haiphong, and Danang.
Urbanization presents an opportunity toreduce the costs of infrastructure provision,through economies of scale. However, thisadvantage requires that new investments bewell planned. If new infrastructure can be put inplace in peri-urban areas before developmentoccurs, the costs will be much lower than tryingto retro-fit infrastructure in areas that arealready populated. Urbanization presents avariety of challenges for the planning system.
Despite the opportunities for cost reductionpresented by more dense networks, the overallneeds of the growing urban population are likelyto require large increases in investment amountsat the municipal level. At present only half ofurban residents have access to piped water, nocities treat wastewater, and urban transport isalready being threatened by greater congestion.Addressing the infrastructure backlog at the sametime as catering for new urban residents willrequire mobilization of large amounts of finance,requiring the government to look beyond currentsources of finance, and new fiscal arrangementsbetween different levels of government.
Urbanization also presents challenges for howVietnam addresses poverty and inequality. Thepercentage of people in poverty is lower in urbanareas than rural areas. But there are more poorper square kilometer in urban areas. Poverty inurban areas, both in percentage and densityterms, is likely to increase, at least in the mediumterm, as more of the rural poor migrate. Becauseof the economies of scale in cities addressing theinfrastructure needs of urban poor will be lesscostly than addressing the needs of the ruralpoor. At the same time, it seems likely thatpockets of rural poor will remain as the poorest
sections of the country. Addressing theinfrastructure needs of these remaining pocketswill pose difficult policy problems concerning theextent to which expensive subsidies are meritedfor small pockets of the community.
1.3.3 Larger Stocks of Infrastructure
The emphasis of infrastructure policy over thepast decade has been the rollout of newinfrastructure, providing access to newconsumers. As seen above, the task of providingaccess is still far from complete. Nevertheless, asthe stock of infrastructure increases, it is possiblethat there will begin to be diminishing returns toinfrastructure investment, there will certainly bean increased need for maintenance, and as thetask of ensuring universal access draws to an endincreasing attention should be turned toensuring that the installed infrastructure isefficiently operated and maintained.
There are high social returns to the initialprovision of infrastructure networks. Theaverage economic rate of return on the WorldBank's four completed infrastructure projects inVietnam during 2000-2003 was 30.2%.15 Butthere are also likely to be diminishing marginalreturns beyond a certain point. For example,
10
15. Economic rates of return calculated at evaluation, on FY2000 power development (19%), FY2000 power sectorrehabilitation (38.8%), FY2002 highway rehabilitation (38%), and FY2003 2nd highway rehabilitation (25%).
Gravel roads improve access
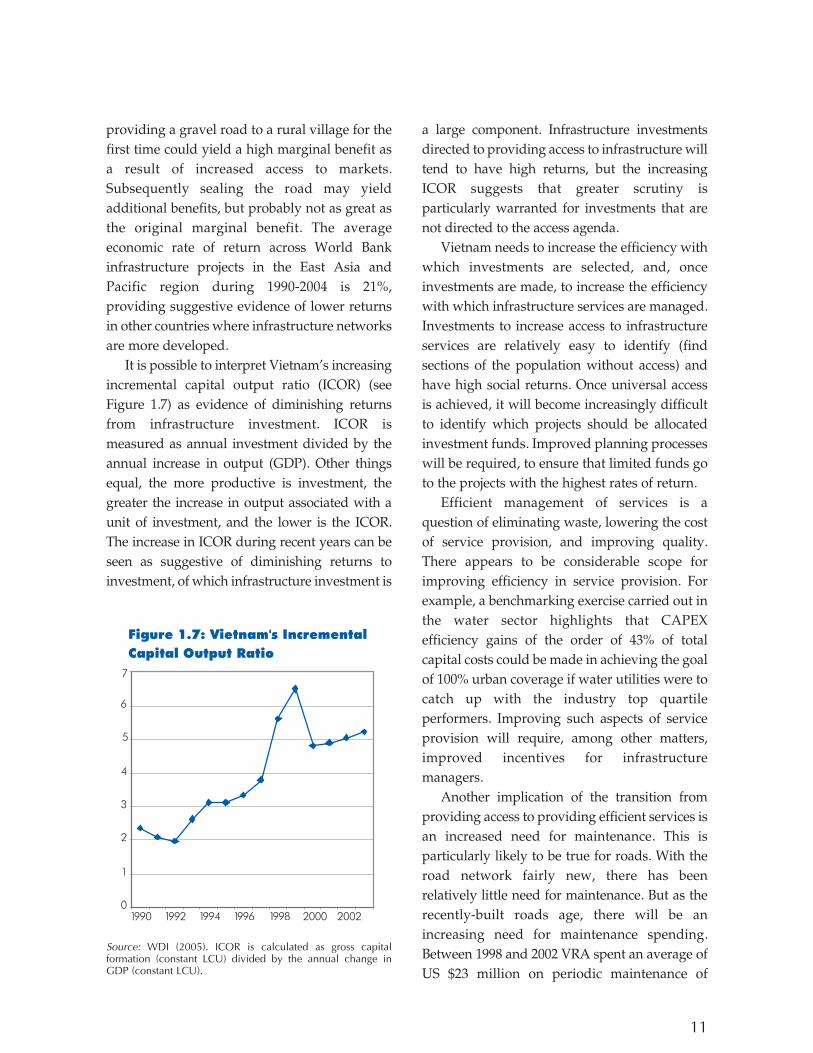
providing a gravel road to a rural village for thefirst time could yield a high marginal benefit asa result of increased access to markets.Subsequently sealing the road may yieldadditional benefits, but probably not as great asthe original marginal benefit. The averageeconomic rate of return across World Bankinfrastructure projects in the East Asia andPacific region during 1990-2004 is 21%,providing suggestive evidence of lower returnsin other countries where infrastructure networksare more developed.
It is possible to interpret Vietnam's increasingincremental capital output ratio (ICOR) (seeFigure 1.7) as evidence of diminishing returnsfrom infrastructure investment. ICOR ismeasured as annual investment divided by theannual increase in output (GDP). Other thingsequal, the more productive is investment, thegreater the increase in output associated with aunit of investment, and the lower is the ICOR.The increase in ICOR during recent years can beseen as suggestive of diminishing returns toinvestment, of which infrastructure investment is
a large component. Infrastructure investmentsdirected to providing access to infrastructure willtend to have high returns, but the increasingICOR suggests that greater scrutiny isparticularly warranted for investments that arenot directed to the access agenda.
Vietnam needs to increase the efficiency withwhich investments are selected, and, onceinvestments are made, to increase the efficiencywith which infrastructure services are managed.Investments to increase access to infrastructureservices are relatively easy to identify (findsections of the population without access) andhave high social returns. Once universal accessis achieved, it will become increasingly difficultto identify which projects should be allocatedinvestment funds. Improved planning processeswill be required, to ensure that limited funds goto the projects with the highest rates of return.
Efficient management of services is aquestion of eliminating waste, lowering the costof service provision, and improving quality.There appears to be considerable scope forimproving efficiency in service provision. Forexample, a benchmarking exercise carried out inthe water sector highlights that CAPEXefficiency gains of the order of 43% of totalcapital costs could be made in achieving the goalof 100% urban coverage if water utilities were tocatch up with the industry top quartileperformers. Improving such aspects of serviceprovision will require, among other matters,improved incentives for infrastructuremanagers.
Another implication of the transition fromproviding access to providing efficient services isan increased need for maintenance. This isparticularly likely to be true for roads. With theroad network fairly new, there has beenrelatively little need for maintenance. But as therecently-built roads age, there will be anincreasing need for maintenance spending.Between 1998 and 2002 VRA spent an average ofUS $23 million on periodic maintenance of
11
Source: WDI (2005). ICOR is calculated as gross capitalformation (constant LCU) divided by the annual change inGDP (constant LCU).

national roads and US $12 million on routinemaintenance. These figures represent less thanhalf the maintenance needs as estimated by VRAunder its Ten-Year Strategic Maintenance Plan.
1.3.4 Rising Inequality
Although Vietnam has done much to ensure thatthe benefits of growth are spread across thecountry, national measures of inequality have
increased in recent years. The national Ginicoefficient has risen from 0.34 in 1992/93 to 0.35in 1997/98 to 0.37 in 2002.16 The ratio of the topto the bottom quintile's per capita expenditureshas risen from 4.6 to 4.7 to 5.3 in the same years.Examining just the rural population or just theurban population, the Gini coefficients havestayed broadly stable, indicating that the risinginequality is mostly due to increasing inequalitybetween rural and urban populations. Rural
12
Source: GSO. Note: ethnic minorities exclude Kinh and Chinese groups.
16. Source: VHLSS.
Source: GSO.

areas are poorer and the decline in poverty hasbeen smaller in rural areas than in urban areas(see Figure 1.8). The Figure also indicates thatethnic minorities are constrained fromparticipating in economic opportunities,signaling a potential disconnection betweengrowth and poverty reduction in remote anddisadvantaged areas.
Poverty is unequally spread across theregions. Fifty-three percent of the poor live inthree regions that account for 34% of the total
population: Northern Uplands, North CentralCoast and Central Highlands (see Figure 1.9).Since 1993 the benefits of growth have beenunequally spread across regions, and migrationhas also redistributed the incidence of povertyacross regions. Figure 1.10 illustrates thatpoverty has become more concentrated in thethree poorest regions, while the poor havebecome a smaller proportion of the populationin the South East region.
There is also evidence of increasing
13
Note: The figure shows each province’s contribution to poverty which is defined as the difference between the province’s share ofthe poor population and the province’s share of total population.
Source: Joint Donor Report (Vietnam Development Report 2004).

inequality in access to infrastructure services.Figures 12 and 13 illustrate that not only do therich have greater access to clean water andhygienic latrines, but the increase in accessbetween 1993 and 2002 has been greater for therich than for the poor. Measuring access to roadsin rural areas by the percentage of householdsliving in a village that a car can drive to, thestory is a little more complicated (see Figure1.13). But it remains true that the poorest
households are more likely to live in villageswithout road access, and that the increase inpoor or near poor households with road accesshas been smaller than for middle or near richhouseholds. It seems likely that inequality ofaccess will continue to increase in the mediumterm, since the poorest households are the leastwilling and able to contribute to the cost ofinfrastructure connections.
To the extent that inequality is a policy
14
Source: Joint Donor Report (Vietnam Development Report, 2004)
Source: Vietnam Household Living Standards Surveys (1998, 2002)
concern for the government these various trendswill require the design of tailored policyresponses to minimize increases in inequalityacross the country.
1.4 Shared Challenges
Dealing with Vietnam's changingcircumstances requires an evolution ofVietnam's infrastructure strategy. Newfinancing sources must be mobilized to permitaccelerated implementation of desirableprojects, and to prepare for the transition tonon-concessional donor assistance. Investmentcriteria should be improved to focus oneconomic rates of return, and planningprocesses need to be streamlined.Infrastructure procurement and serviceefficiency need to be improved. And revisedapproaches to subsidy delivery are needed todeal with the changing characteristics ofpoverty in Vietnam.
These challenges are shared by many ofVietnam's neighbors. The ADB, JBIC, and theWorld Bank recently examined the region's
infrastructure challenges in a flagship study,"Connecting East Asia". The flagship studyorganizes infrastructure challenges into threemain themes: inclusive development;coordination; and accountability and riskmanagement.● Inclusive development is concerned with
the goals of generating growth and ensuringits benefits are shared across thecommunity. The role of Vietnam'sinfrastructure in generating growth andreducing poverty have been discussed inthis chapter, and additional measures thatcan be taken to effect a more equitabledistribution of benefits are discussed inChapter 5.
● Coordination concerns the State's ability togenerate strategic vision and translate thatvision into infrastructure outcomes. This isthe subject matter of Chapter 3, dealing withplanning. Chapter 6, dealing with reformprioritization, is also intended to assist theplanning process.
● Accountability and risk managementaddress the interaction of the variousplayers, including the State, consumers,service providers, and investors, and howit can be guided to ensure appropriateinfrastructure outcomes. Accountabilityinvolves rewarding good performanceand punishing bad performance. Riskmanagement involves ensuring that thepotential costs and benefits of actions areequitably and sustainably allocated.These issues are addressed in Chapter 2,on financing and investment decisions,and Chapter 4, dealing with mechanismsfor improving efficiency.These common themes underline the
potential to learn from regional neighbors, andmore generally from international experience.This report illustrates particular ideas forreform with examples from internationalexperience.
15

16

inancing needs are a function of thegrowth and equity objectives sought to beachieved by planning decisions, and the
efficiency of resulting investments. They arethus the outcome of matters addressed insubsequent chapters. However, before planningproceeds too far there is a need to take intoaccount the financing possibilities; the budgetenvelope. So it is useful in this chapter to takestock of possible financing needs and thesources of finance available to meet them,before moving on to the details of potentialinfrastructure reforms in subsequent chapters.
2.1 Level of Infrastructure Fincancing
Table 2.1 provides rough estimates of recentinvestment levels in the different infrastructuresectors. The greatest investment has been intransport and energy, with roughly 3-4% of
GDP each; while water and sanitation andtelecommunications infrastructure investmenthave been in the order of 1.4% and 0.8 % of GDPrespectively. Across sectors, these investmentssum to about 9.4% of GDP, without takingaccount of gas sector investment.
Looking to the future, sectoral plans andforecasts suggest future annual infrastructureinvestment summing to 11.4% of GDP, anincrease of 2% of GDP over recent levels:17
● In September 2005, the Ministry ofTransport estimated future financing needsin a Medium Term Expenditure Framework,which matched proposed investment withpotential financing sources. The proposalsfor capital spending in 2006 to 2008amounted to VND 69,186 billion (US$ 4.3billion) over the three years, and averaged4.1% of GDP per year.
● In the electricity sector, investments
17
2. Financing
Issues
(i) Financing of new infrastructure investment currently amounts to about 9-10% of GDP. Anincrease to 10-11% would seem to be justified for the coming five years, based largely on thegoal of providing increased access to electricity and water, and keeping pace with demandgrowth in electricity.
(ii) Currently donors meet around 30% of the ultimate burden of the investment program, andconsumers ultimately pay for around 50%, with the Government budget bearing theremainder. In future the contribution of donors is likely to diminish, and greater burden shouldbe placed on consumers.
(iii) Diversification of financing mechanisms would allow more investment to be brought forwardin time. To achieve such diversification will require wide-ranging reforms in capital markets,as well as greater cost recovery in some infrastructure sectors.
17. In 2005, 2% of GDP was about VND 15,250 billion (US$ 966 million). Estimates of investment as a proportionof GDP assume that GDP grows at 7% annually.
F

required to meet the Fifth Power MasterPlan amount to VND 215,078 billion (US$13,743 million) in the years 2005-2010, orabout 3.9% of GDP. This figure is nowregarded as an underestimate, because ofhigher than expected demand growth inrecent years. The financial model used byEVN to plan future investments suggeststhat during 2005-2010 capital expenditurewill amount to VND 237,246 billion (US$ 16billion), which in annual terms is about 4.7%of GDP.
● In the water and sanitation sector theGovernment has set coverage targets toachieve its 2010 development goals. Thetargets are 85% for urban water andsanitation, and 75% for rural water andsanitation, which would require investment
of VND 57,547 billion (US$ 3.62 billion)during 2005-2010, or 1.2% of GDP annually.
● In the telecommunications sector, in October2005 the Ministry of Post and Telematicsadopted a target of 32-42 total telephonelines per 100 population by 2010. To achieve35 lines per 100 population would requireabout VND 57,000 billion (US$ 3.6 billion).Spread over the period 2006-2010, thiswould amount to around 1.4% of GDPannually.The forecasts should not be interpreted as an
endorsement of sectoral investment proposals.Closer analysis of the individual sector plansmay find ways of economizing on investments,and budgeting decisions could result inindefinite deferral of some investmentproposals. Nevertheless, there is a reasonable
18
Table 2.1: Vietnam’s Recent Investment in Infrastructure
1999 2000 2001 2002 2003 VND billion
Water & Sanitation 2,132 2,306 2,532 2,778 Telecommunications 8,422
Electricity 13,517 18,172 19,548 Transport 11,219 11,660 17,871 21,576
US$ million Water & Sanitation 153 163 172 182
Telecommunications 543 Electricity 918 1,189 1,260 Transport 805 823 1,214 1,412
% GDP Water & Sanitation 0.53 0.52 0.53 0.52
Telecommunications 1.39 Electricity 2.81 3.39 3.23 Transport 2.81 2.64 3.71 4.03
Note: Blanks indicate missing data. The water & sanitation data are estimated based on statements in the water and sanitation strategy paper that over the past 10 years US$ 1.003 billion was spent on urban water, and during 1999-2002 VND 3160 billion was spent on rural water and sanitation; and supposing that annual investment grew at a smooth rate of 7%. Telecoms figures based on VNPT’s investment budget in 2003 of $133 million, and a BCC for $230 million of foreign investment. While BCCs are irregular, this figure is close to the annual average of BCC investment since 1994. Electricity data are taken from a financial model of EVN, using historic data prepared according to international accounting standards, to which are added PPI database figures for investment in the Phu My II and III BOTs, supposing that contracted amounts were split equally across 2003 and 2004. Investment in gas pipelines is not included. Transport data are taken from the PER, Table 11.7, subtracting recurrent spending from total spending. Official exchange rates from WDI.
1999 2000 2001 2002 2003VND billion
US$ million
%GDP
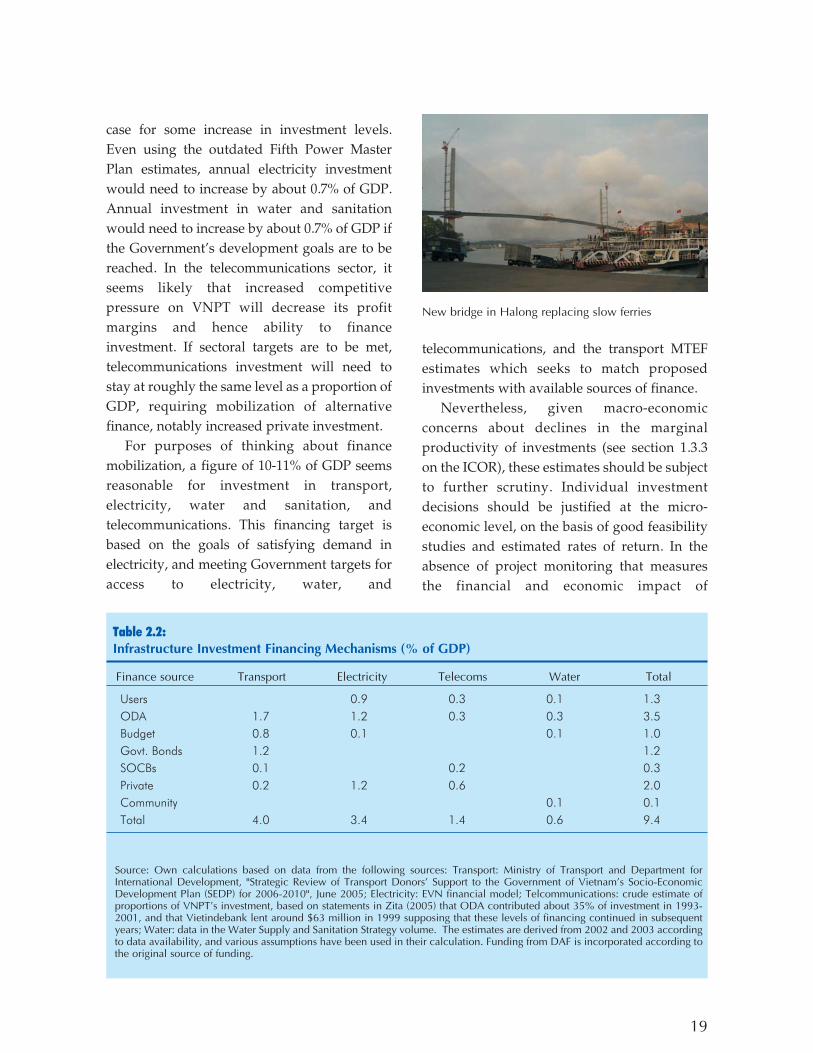
case for some increase in investment levels.Even using the outdated Fifth Power MasterPlan estimates, annual electricity investmentwould need to increase by about 0.7% of GDP.Annual investment in water and sanitationwould need to increase by about 0.7% of GDP ifthe Government's development goals are to bereached. In the telecommunications sector, itseems likely that increased competitivepressure on VNPT will decrease its profitmargins and hence ability to financeinvestment. If sectoral targets are to be met,telecommunications investment will need tostay at roughly the same level as a proportion ofGDP, requiring mobilization of alternativefinance, notably increased private investment.
For purposes of thinking about financemobilization, a figure of 10-11% of GDP seemsreasonable for investment in transport,electricity, water and sanitation, andtelecommunications. This financing target isbased on the goals of satisfying demand inelectricity, and meeting Government targets foraccess to electricity, water, and
telecommunications, and the transport MTEFestimates which seeks to match proposedinvestments with available sources of finance.
Nevertheless, given macro-economicconcerns about declines in the marginalproductivity of investments (see section 1.3.3on the ICOR), these estimates should be subjectto further scrutiny. Individual investmentdecisions should be justified at the micro-economic level, on the basis of good feasibilitystudies and estimated rates of return. In theabsence of project monitoring that measuresthe financial and economic impact of
19
Table 2.2: Infrastructure Investment Financing Mechanisms (% of GDP)
Finance source Transport Electricity Telecoms Water Total
Users 0.9 0.3 0.1 1.3 ODA 1.7 1.2 0.3 0.3 3.5 Budget 0.8 0.1 0.1 1.0 Govt. Bonds 1.2 1.2 SOCBs 0.1 0.2 0.3 Private 0.2 1.2 0.6 2.0 Community 0.1 0.1 Total 4.0 3.4 1.4 0.6 9.4
New bridge in Halong replacing slow ferries
Finance source Transport Electricity Telecoms Water Total
Source: Own calculations based on data from the following sources: Transport: Ministry of Transport and Department forInternational Development, "Strategic Review of Transport Donors' Support to the Government of Vietnam's Socio-EconomicDevelopment Plan (SEDP) for 2006-2010", June 2005; Electricity: EVN financial model; Telcommunications: crude estimate ofproportions of VNPT's investment, based on statements in Zita (2005) that ODA contributed about 35% of investment in 1993-2001, and that Vietindebank lent around $63 million in 1999 supposing that these levels of financing continued in subsequentyears; Water: data in the Water Supply and Sanitation Strategy volume. The estimates are derived from 2002 and 2003 accordingto data availability, and various assumptions have been used in their calculation. Funding from DAF is incorporated according tothe original source of funding.
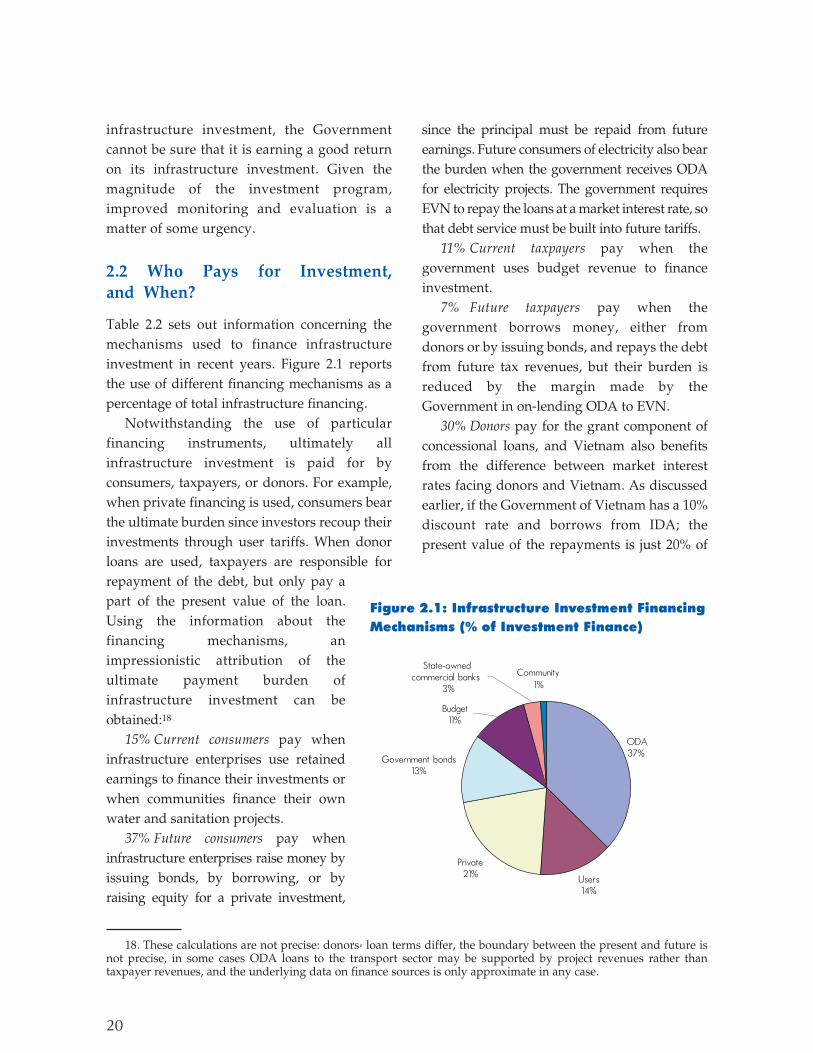
infrastructure investment, the Governmentcannot be sure that it is earning a good returnon its infrastructure investment. Given themagnitude of the investment program,improved monitoring and evaluation is amatter of some urgency.
2.2 Who Pays for Investment,and When?
Table 2.2 sets out information concerning themechanisms used to finance infrastructureinvestment in recent years. Figure 2.1 reportsthe use of different financing mechanisms as apercentage of total infrastructure financing.
Notwithstanding the use of particularfinancing instruments, ultimately allinfrastructure investment is paid for byconsumers, taxpayers, or donors. For example,when private financing is used, consumers bearthe ultimate burden since investors recoup theirinvestments through user tariffs. When donorloans are used, taxpayers are responsible forrepayment of the debt, but only pay apart of the present value of the loan.Using the information about thefinancing mechanisms, animpressionistic attribution of theultimate payment burden ofinfrastructure investment can beobtained:18
15% Current consumers pay wheninfrastructure enterprises use retainedearnings to finance their investments orwhen communities finance their ownwater and sanitation projects.
37% Future consumers pay wheninfrastructure enterprises raise money byissuing bonds, by borrowing, or byraising equity for a private investment,
since the principal must be repaid from futureearnings. Future consumers of electricity also bearthe burden when the government receives ODAfor electricity projects. The government requiresEVN to repay the loans at a market interest rate, sothat debt service must be built into future tariffs.
11% Current taxpayers pay when thegovernment uses budget revenue to financeinvestment.
7% Future taxpayers pay when thegovernment borrows money, either fromdonors or by issuing bonds, and repays the debtfrom future tax revenues, but their burden isreduced by the margin made by theGovernment in on-lending ODA to EVN.
30% Donors pay for the grant component ofconcessional loans, and Vietnam also benefitsfrom the difference between market interestrates facing donors and Vietnam. As discussedearlier, if the Government of Vietnam has a 10%discount rate and borrows from IDA; thepresent value of the repayments is just 20% of
20
18. These calculations are not precise: donors’ loan terms differ, the boundary between the present and future isnot precise, in some cases ODA loans to the transport sector may be supported by project revenues rather thantaxpayer revenues, and the underlying data on finance sources is only approximate in any case.

the amount borrowed, so that donors can beinterpreted as bearing the ultimate burden of80% of the sums lent.
Consumers (current and future) bear 52% ofthe overall financing burden for infrastructureinvestment, while taxpayers (current andfuture) bear 18%. As between consumers andtaxpayers, a greater proportion of theinvestment burden should be placed onconsumers (present and future) though eitherdirect user charges or borrowing backed byinfrastructure revenues:● One argument for this position is that
increasing the amounts paid by consumersserves as a means of limiting demandgrowth, and hence reducing the financingburden. Taxpayer funded infrastructure isperceived as free by consumers, resulting inpotentially excessive demand from a socialviewpoint.
● Another argument is that where revenuescan be raised from consumers they shouldbe, in order to free tax funds for use in othersectors where cost recovery is lower.
● Another argument rests on an idea offairness: between otherwise equal people itseems fair that one who benefits from aservice (a consumer) should pay for it, whilethose who do not benefit (non-consumingtaxpayers) should not pay.
● And finally, diversification of financingmechanisms (to liberate government capitalfor alternative uses) will be limited when theultimate burden is borne by taxpayers.Payments from government revenues occurthrough annual budget allocations, and areinherently uncertain. Medium and longterm financing is more readily arrangedwhen the ultimate burden is borne byconsumers, and the ultimate risk iscommercial. As a group, consumers aremore predictable than the political process.There is a case for government revenues
bearing some of the burden of infrastructureinvestment. For example, it is generallyimpractical to collect tolls for the use of ruralroads, and the social benefits of sanitation andwaste water treatment generally exceed privatewillingness to pay for these services. Thechallenge for the government is to graduallyincrease the contribution of consumers, whilelimiting the contribution of governmentrevenue to the relatively few cases where it isnecessary.
The breakdown of who bears the ultimateburden of infrastructure investment is alsorevealing in respect of the allocation across time.Current consumers and taxpayers pay for 26%of infrastructure investment, while futureconsumers and taxpayers pay for 44%. Increaseduse of alternative financing instruments wouldenable a greater proportion of the burden to beborne by the future. For example, increasedborrowing or private equity investment wouldenable investment to be brought forward intime. With more finance available, the level ofinfrastructure investment could be increased, orgovernment finance could be withdrawn for useelsewhere while maintaining the same level ofinfrastructure investment.
Funding by donors pays for a significantamount (30%) of infrastructure investment,raising the issue of how to manage thetransition to the situation when concessionalfunds will not be available on the same scale.Countries typically respond to the end ofconcessional funds by borrowing less fromofficial development agencies. Vietnam shouldtake advantage of concessional finance while itremains available, using the time to put in placethe necessary reforms to mobilize alternativefinancing sources.
2.3 Finacing Institutions andMechanisms
Meeting current investment plans with an
21

increased level of investment, and preparing forthe transition away from concessional donorfinancing, both suggest a need to mobilize newsources of finance. Even without thesedevelopments, the arguments of section 2.2suggest a case for shifting the sources ofinvestment finance. Diversification of financingsources, notably with greater reliance on privatefinancing, would also help to decentralizefinancing decisions reducing the burden oncentral planning organizations and potentiallyimproving the efficiency of investmentdecisions. The following discussion examinesdesirable reforms that would allowdiversification of infrastructure financing.
Reform of infrastructure services themselvesis important to the financing possibilities.Ensuring cost-covering tariffs for infrastructureservices, where feasible, provides infrastructureenterprises with not only the possibility of self-financing using retained earnings, but alsoopens the possibility for alternative financingsources that rely on future revenue streams.And reforms that improve the efficiency ofinfrastructure procurement and services canhelp to defer the need for new investment,reducing the overall financing needs.
2.3.1 User Payments
By the estimates of the previous section,retained earnings of infrastructure enterprisesaccount for around 30% of all infrastructurefinancing. A prerequisite for self-financing isthat tariffs more than cover the costs ofoperation. Cost recovery is also a necessary steptowards diversification of financing sources,since most financing institutions seek to earn apositive return on their investment. The abilityto diversify finance sources across
infrastructure sectors differs according to eachsector's ability to set cost-covering tariffs.
In the transport sector few data were availableon cost recovery for this report. Saigon Port'soperating ratio (operating expenses/operatingrevenue) gradually increased from 0.78 in 1995 to0.91 in 2002, indicating that the port's operatingrevenues covered its operating costs, but by asmaller margin over time.19 Over the same periodthe port's return on equity declined from 24.7% to6%. Declining margins may reflect increasedcompetition from the nearby private VICTterminal. Can Tho Port's operating ratioincreased from 0.86 in 1989 to 1.28 in 1993,declining again to 0.95 in 1995.20 Combined,these data provide weak evidence that Vietnam'sports operate a policy of recovering operatingcosts, but generally do not self-finance majorinvestment.
Vietnam Railways made losses in the mid1990s, but between 1999 and 2003 revenuesincreased at 15% per annum. VR now basicallycovers its operating costs including acontribution of 10% of its revenues to themaintenance of infrastructure. Arguably,
22
19. ADB (2003).20. World Bank, Inland Waterways and Port Rehabilitation Project, Project Appraisal Document, p.108.
Source: IDB, JBIC, & World Bank (2005), Annex 1.

however, insufficient funds are spent onmaintenance.
Road user charges (fuel surcharge, licenseand inspection fees and toll charges) amountedto VND 5,671 billion in 2001, more thancovering road maintenance costs. Theserevenues generally pass directly into the statebudget, so there is no necessary link with theactual level of maintenance spending.
In the electricity sector, EVN is self-financing. World Bank loans to the sector areon-lent by the Government to EVN, and EVN isrequired to repay the debt at a market interestrate. Tariffs have been set to cover costs,including capital. Nevertheless, tariffs will needto increase to meet future investment needs.Much of the planned new investment can befinanced with additional debt, but in turn thisrequires an equity contribution to keep thegearing ratio reasonable. Tariffs will need toincrease to generate the cash to make this equitycontribution. Figure 2.2 shows that an averageVietnamese households spend 2.9% of theirincome on energy services. This is not especiallyhigh regionally. In Figure 2.3, Vietnam'saverage residential and industrial tariffs of US$0.05/kWh are less than the regional residentialaverage of US$ 0.068/kWh and the regionalindustrial average of US$ 0.069/kWh. Thesefigures suggest there is some room for
increasing tariffs without encounteringsignificant affordability or businesscompetitiveness obstacles.
In the telecommunications sector, VNPTfully covers its costs. It funds its owninvestments (from retained earnings, donors,and commercial bank borrowing), and makesenough profit to contribute to the State budgetwith dividends. In 2003, the contribution to theState budget was VND 3,450 billion (US$ 222million), according to the VNPT website.
Figure 2.4 illustrates that all but twoVietnamese water utilities covered theiroperating costs in 2003. In developing countries
23
Source: IDB, JBIC, & World Bank (2005), Annex 1.
Electricity meters assist cost recovery

this is a rare positive achievement.Nevertheless, capital costs can account foraround 80% of water utilities' full costs, so thatthere may be a considerable gap betweencovering operating costs and full cost recovery.In November 2004 the Ministry of Finance andMinistry of Construction issued Joint Circular104/2004/TTLT-BTC-BXD requiring all watersupply companies to set tariffs based on the full
and accurate inclusion of all O&M costs,depreciation, debt payment, and return oninvestment. The speed of implementation ofthis decree remains to be seen. ProvincialPeople's Committees are responsible forreviewing and approving water tariffsproposed by water utilities. Tariff adjustmentshave been irregular in the past, and havesometimes taken several years to implement.
Some indication of thefeasibility of improving costrecovery by increasing waterprices can be obtained fromcomparisons of householdspending and tariffs. Figure 2.5compares household spendingon water across the region.Vietnamese households devoteon average 1.4% of theirspending to water, less than the2003 average of 1.9% in thesampled countries. Figure 2.6compares the average watertariffs in Hanoi and Ho ChiMinh City with other majorregional cities. In 2003 theaverage tariffs were $US 0.26 inHanoi, US$ 0.18 in Ho ChiMinh City, compared with aregional average of US$ 0.22.Figure 2.7 suggests that wateris cheaper in most Vietnamesetowns than in Hanoi and HoChi Minh City. Together theseindicators suggest some scopefor improving cost recovery.
2.3.2 Efficiency Improve-ments in Procurement andService Provision
While not a direct financingmechanism, efficiencyimprovements can reduce the
24
Source: IDB, JBIC, & World Bank (2005), Annex 1.
Each bar reports operating revenue as a percentage of operating costs for anindividual utility. Data for 2003.Source: Benchmarking data from Vietnamese Water Supply Association

overall investment burden. Forexample, a reduction of 1% in electricitytransmission and distribution losseswould be the equivalent of an increasein system capacity of 1%, or a 112 MWpower plant costing around US$ 100million. (Electricity demand sidemanagement is discussed in greaterdetail in the Power Strategy volume.)Improving procurement processes,notably through greater use ofcompetitive bidding and with greaterchecks on corruption, could similarlysignificantly reduce investment costs.Chapter 4 deals with means ofimproving efficiency.
2.3.3. Budget Funding
Budget funds are limited, and so needto be allocated to their most productive
25
Source: IDB, JBIC, & World Bank (2005), Annex 1.
Each bar represents a separate utility. A further utility (Than Po, Ho ChiMinh City) reported revenue of $1.71/m3, but is not shown in the graphbecause it would reduce the visible variation between other utilities. Datafrom 2003.Source: Benchmarking data from Vietnamese Water Supply Association.
uses. Spending budget funds on infrastructuremeans there is less of the budget available forother areas of government activity. And sincebudget funds are drawn from tax revenues,21
and taxation imposes welfare costs on theeconomy, there is a real cost imposed on theeconomy whenever budget funding is used (seeBox 2.1 on the marginal cost of public funds).For both of these reasons it is desirable to try touse alternative financing sources to themaximum extent possible, and to limit the useof budget funding to only those projects forwhich it is necessary.
There is, however, a strong case for budgetfunding in some cases. In particular, the social
benefits of some forms of infrastructure exceedthe private benefits. For example, privateindividuals' willingness to pay for treatment ofwaste water is low, but there are public healthand environmental benefits that wouldfrequently be sufficient to justify investments inwaste water treatment plants. Similarly, sinceaddressing poverty is a high priority for theGovernment, investments which providebenefits for poor communities, greater than thecommunities' ability to pay, may be sociallyjustified. Considerations such as externalities orsocial equity may thus justify the provision ofgovernment funds, without a requirement forrepayment.
26
In general, households obtain economic “surplus”when they purchase goods and services. They valuetheir purchase more highly than the money paid, orthey wouldn’t make the purchase. When governmentsraise money through taxes, households lose not onlythe tax revenue that is paid to the government, but alsothe economic surplus they would have enjoyed if theyhad used that revenue to purchase goods and services.
For this reason the social cost of raising a unit ofpublic funds through taxation usually exceeds oneunit. A commonly quoted estimate of the “marginalcost of public funds” (MCF) in the United States is1.30, which means that the welfare cost of raising onedollar of tax revenue is the dollar transferred to thegovernment plus 30 cents of lost surplus.
Taxation is socially worthwhile only if thegovernment spends the resulting funds on projects thatyield public benefits greater than the social cost. Forthe United States this would mean that publicly-funded projects should yield social returns greater than30%.
The MCF usually increases as taxes increase,while the marginal benefits of public spendingusually decrease since the government concentrateson high return projects first. In an ideal public
spending system, government spending would beincreased to the point where the marginal benefit ofpublic spending equated the MCF. In practice nocountry bases its decisions about governmentspending on estimates of the MCF. One problem isthat measures of the MCF are not sufficientlyreliable.
For purposes of this report an estimate of the MCFin Vietnam was generated, using the computablegeneral equilibrium model of Warlters and Auriol(2005). Supposing that tax rates on domestic goods,exports, imports, capital, and labor were eachincreased by 1% of the tax rates, the resulting estimateof the MCF is 1.10. The methodology used is toosimplistic to serve as a reliable measure (it is likely tobe an underestimate, because among other mattersnon-tax distortions are not modeled), but it is useful forpolicy-makers to bear in mind that funds raised bytaxation are not free. A minimum rate of return onpublic investment must be earned, simply to offset thedistortionary costs of taxation used to raise the publicfunds.
Box 2.1: The Marginal Cost of Public Funds
21. General government revenue amounts to about 23% of GDP, of which tax revenue constitutes about 57% andoil revenues about 30%. When the Government seeks to adjust its level of spending it must ultimately adjust its taxcollection, since its sales of oil are driven by commercial conditions. Consequently the marginal dollar of budgetrevenue is usually thought of as being derived from taxes.
In an ideal public finance system, the set ofprojects eligible for budget support would belimited to projects where:● Cost recovery through user charges is
achieved to the maximum extent possible,but this is not sufficient to ensure financialviability of the project using non-budgetaryfinancing; and
● The social benefits of the project have beenshown to exceed private benefits by reasonof externalities or social concerns.Projects within this set would then be ranked
in descending order of social benefit, and fundsallocated to projects until the social benefit ofthe marginal project were equal to the marginalcost of public funds.
While Vietnam may not achieve such apublic finance system in the near term, planningprocesses could be adapted so that projects that
can demonstrate a large gap between socialbenefits and private benefits are more likely toreceive budgetary support, and projects forwhich non-budgetary finance could be accessedreceive lower priority in budget allocations.Adaptations to the planning process could besupported by guidelines indicating what sortsof projects are likely to exhibit the greatestexternalities, and how to calculate thesebenefits. The budgeting and planning processesare discussed further in Chapter 3.
2.3.4 Banks
Vietnam's financial sector has a wide range offinancial institutions (see Box 2.2), but isdominated by four major state-ownedcommercial banks (SOCBs), accounting forabout 80% of the capital, lending and assets of
27
FORMAL FINANCIAL SYSTEM
Banking financial sector● 5 State-owned commercial banks, of which
o 4 large SOCBs:Bank for Foreign Trade (Vietcombank)Industrial and Commercial Bank (Incombank)Vietnam Bank for Agriculture and RuralDevelopment (Agribank)Bank for Investment and Development (BIDV)
o 1 small SOCBHousing Development Bank for the MekongRiver Delta
● 1 Social Policy Bank● 25 foreign banks’ branches● 6 foreign banks’ sub-branches● 40 foreign credit institutions’ representative offices● 5 joint venture banks● 36 domestic joint-stock commercial banks● Central People’s Credit Fund System and 32
branches● 888 local credit funds● 7 finance companies, of which 5 are affiliates of
large corporate groups (General Corporations)
Non-bank financial sector● 18 insurance companies● 8 finance leasing companies: 3 of which are joint
ventures with foreign investors or wholly foreignowned; 5 of which are subsidiaries of SOCBs
● 1 postal savings system, the Vietnam Postal SavingsService Company
● 2 stock exchanges: Ho Chi Minh City SecuritiesTrading Center; Hanoi Securities Trading Center.
● 4 investment funds● 1 Debts and Assets Trading Company (DATC)
established in 2003, belonging to the Ministry ofFinance
INFORMAL FINANCIAL SYSTEM● Moneylenders, relatives and friends● Rotating savings and credit associations (ROSCAs)
Source: Hoang Tien Loi (2004), “Insolvency Systems and RiskManagement in Asia, paper presented at the Forum on AsianInsolvency Reform 2004, the Oberoi Hotel, New Delhi, 3-5November 2004.
Box 2.2: Vietnam’s Financial Sector
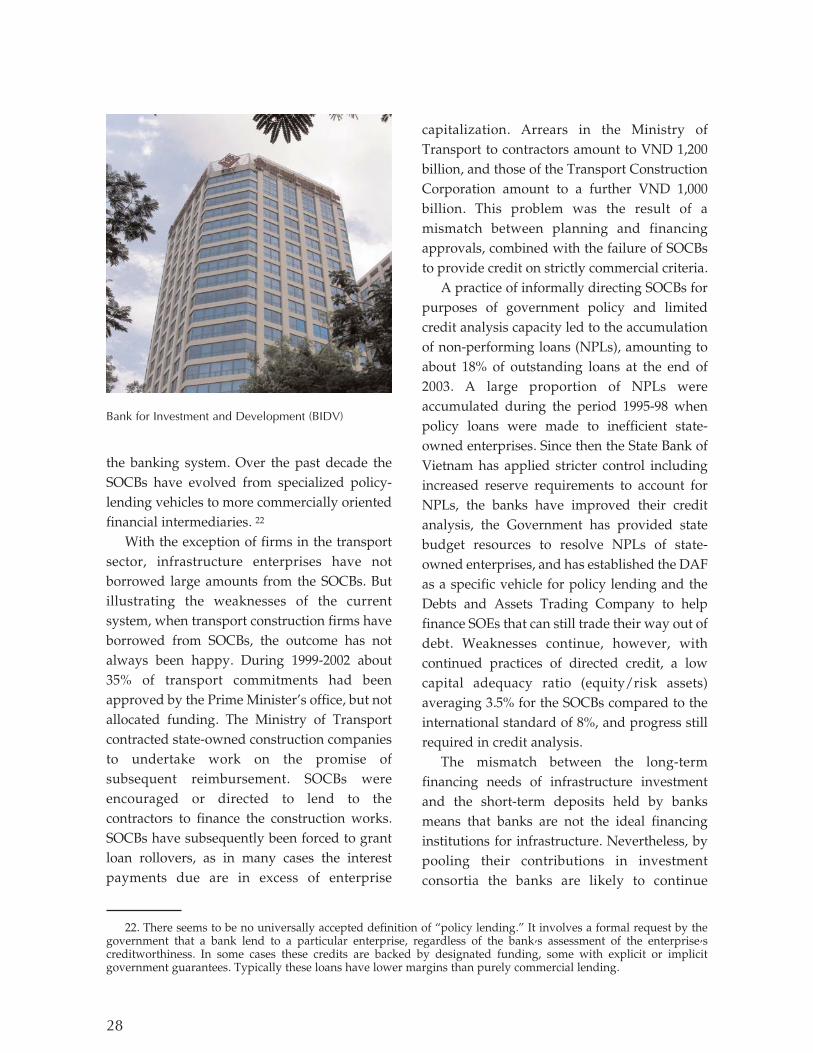
the banking system. Over the past decade theSOCBs have evolved from specialized policy-lending vehicles to more commercially orientedfinancial intermediaries. 22
With the exception of firms in the transportsector, infrastructure enterprises have notborrowed large amounts from the SOCBs. Butillustrating the weaknesses of the currentsystem, when transport construction firms haveborrowed from SOCBs, the outcome has notalways been happy. During 1999-2002 about35% of transport commitments had beenapproved by the Prime Minister's office, but notallocated funding. The Ministry of Transportcontracted state-owned construction companiesto undertake work on the promise ofsubsequent reimbursement. SOCBs wereencouraged or directed to lend to thecontractors to finance the construction works.SOCBs have subsequently been forced to grantloan rollovers, as in many cases the interestpayments due are in excess of enterprise
capitalization. Arrears in the Ministry ofTransport to contractors amount to VND 1,200billion, and those of the Transport ConstructionCorporation amount to a further VND 1,000billion. This problem was the result of amismatch between planning and financingapprovals, combined with the failure of SOCBsto provide credit on strictly commercial criteria.
A practice of informally directing SOCBs forpurposes of government policy and limitedcredit analysis capacity led to the accumulationof non-performing loans (NPLs), amounting toabout 18% of outstanding loans at the end of2003. A large proportion of NPLs wereaccumulated during the period 1995-98 whenpolicy loans were made to inefficient state-owned enterprises. Since then the State Bank ofVietnam has applied stricter control includingincreased reserve requirements to account forNPLs, the banks have improved their creditanalysis, the Government has provided statebudget resources to resolve NPLs of state-owned enterprises, and has established the DAFas a specific vehicle for policy lending and theDebts and Assets Trading Company to helpfinance SOEs that can still trade their way out ofdebt. Weaknesses continue, however, withcontinued practices of directed credit, a lowcapital adequacy ratio (equity/risk assets)averaging 3.5% for the SOCBs compared to theinternational standard of 8%, and progress stillrequired in credit analysis.
The mismatch between the long-termfinancing needs of infrastructure investmentand the short-term deposits held by banksmeans that banks are not the ideal financinginstitutions for infrastructure. Nevertheless, bypooling their contributions in investmentconsortia the banks are likely to continue
28
22. There seems to be no universally accepted definition of “policy lending.” It involves a formal request by thegovernment that a bank lend to a particular enterprise, regardless of the bank’s assessment of the enterprise’screditworthiness. In some cases these credits are backed by designated funding, some with explicit or implicitgovernment guarantees. Typically these loans have lower margins than purely commercial lending.
Bank for Investment and Development (BIDV)

playing a role in infrastructure financing, and itis important that the financing is directedtowards projects with the highest returns.
The SOCBs should be established on a moreclearly commercial basis, free of politicaldirection. Credit should be given only toprojects with sound fundamentals. Risks needto be properly accounted. Credit ratingagencies, including branches of internationalcredit rating agencies, could be established toassist in the process. The SOCBs currently havea non-performing loan portfolio of 10-15% oftotal loans, or 5-8% of GDP. Systemic banklending to risky projects played an importantrole in the East Asian financial crisis of 1997 andin Japan's long economic stagnation. Thedangers are clear; Vietnam needs to reform itsbanking system.
2.3.5 Bond Issues
There are three relevant types of bond issuers:the national government, provincialgovernments and infrastructure enterprises.National government bonds are backed by theGovernment's power to tax. Provincialgovernments' bonds are similarly backed bythose governments' general revenue-raisingpowers. Corporate bonds are backed by theability of the enterprise to raise revenue byselling its products.
The national Government has been workingto develop the government bond market, in partto directly finance investment, includinginfrastructure, and more broadly to serve as abenchmark for broader capital marketdevelopment. It plans to raise VND 63 trillion(US$ 4 billion) by 2010 to be used mainly tofinance infrastructure and education projectsincluding the north-south Ho Chi MinhHighway, roads along the borders with Chinaand Cambodia, and irrigation projects in thedisaster-prone central provinces. In 2004 theGovernment issued about VND 5 trillion of
bonds for infrastructure development and VND2.5 trillion for the education sector, representingabout 0.7% of GDP. Bonds of 2 years and 5 yearsmaturity have carried coupons of around 8%. InOctober 2005 the Government issued its firstoverseas government bonds, raising US$ 750million at a rate of 7.125%.
The bonds are kept off-budget, to complywith the State Budget Law's limit on the budgetdeficit of 5% of GDP. Including off-budgetbonds and SOCB recapitalization would raisethe official level of public debt by about 3percentage points, from its current level ofaround 33% of GDP. The overall level is notcurrently worrying from the viewpoint ofmacroeconomic stability, but as the bondprogram expands the contribution to the levelof public debt will increase. Clearly the bondissues should be reflected in official statistics ofpublic debt, and if the bonds make economicsense the State Budget Law's limit on the deficitshould be amended.
The principal purchasers of bonds have beenSOCBs and insurance companies. To ensure fullsubscription, the government has directedSOCBs to purchase bond issues. Insurancecompanies are obliged to invest in bonds orbank deposits. These investors would, if theycould, seek alternative investmentopportunities. Obliging financial intermediariesto invest in bond issues is not the ideal fashionto ensure the highest returns for the country'ssavings.
At the provincial level, the first municipalbonds were issued by the Ho Chi Minh Citygovernment in 2003, in the form of a generalobligation bond, raising US$ 127 million. In2004, a provincial government-ownedinvestment fund (HIFU) managed the issue ofanother US$ 127 million of municipal bonds.The rules for issuance of municipal bonds arenot yet clear, and they do not always provide theright incentives to the issuers. Disclosure rulesfor the public offerings either do not exist, or are
29
very weak. The stock of sub-nationalgovernment debt in Vietnam is not currently athreat to fiscal stability. But plans for increasedinvestment are likely to see sub-national debtincrease significantly, requiring nationaloversight.
Issuance of corporate bonds forinfrastructure development was pioneered byEVN, which issued bonds for the developmentof the Ialy hydro-electric power plant in 2001.On May 5, 2005 EVN began issuing bonds toraise VND 200 billion to finance a 500 kVtransmission line project in the CentralHighlands region. The coupon rate is 8.8% forthe first year of the five-year bond, while in thefollowing years the interest rate will beequivalent to the average interest rate of thefour major SOCBs plus 1.1%. Between now and2010, EVN plans to sell more than US$ 1.6billion worth of registered bonds on local andinternational markets.
Overall the market for bonds is poised for
significant development but importantinstitutional reforms, addressing governanceand transparency in particular, are required topermit this potential to be realized.
2.3.6 Government Investment Funds
In recent years specialist governmentinvestment funds have been created at thenational and provincial level, with significantroles in infrastructure financing. At the nationallevel, the key public financing institution forinfrastructure is the Development AssistanceFund (DAF), established in 2000, with branchesthroughout the country. At the provincial level,twelve provinces have followed the lead of HoChi Minh City (see Box 2.3) in establishing localdevelopment investment funds (LDIFs).
These investment funds serve asmechanisms for aggregating and managingfunds from a variety of sources, financing arange of projects not confined to infrastructure.
30
Established in 1997 as a pilot program, HIFU is themost advanced of Vietnam’s thirteen localdevelopment investment funds. One of HIFU’sfunctions is the management of funds provided by thecity/provincial government, helping to transform statesubsidies in areas such as new area building intobudget lending with full repayment. On the basis of itssuccess as a funds manager, HIFU has also beenentrusted with the management of the PollutionMinimization Fund of Ho Chi Minh City and theRevolving Fund for environmental improvements.
HIFU lends to urban infrastructure projects intransportation, water, health, education, housing, andindustrial parks. HIFU is beginning to take the leadposition in syndicates, raising capital fromcommercial banks, financial institutions, andorganizations and individuals as it puts togetherfinancing packages for large scale projects. Insyndicated projects HIFU’s capital contribution hasbeen about 20% of the loan amount.
Ho Chi Minh City has also provided HIFU withfunds raised by issuing municipal bonds, backed bythe city’s general revenues and taxing powers. Bond
issues of US$ 127 million each were made in 2003and 2004. HIFU is now examining the possibilities forissuing bonds backed by project revenues.
HIFU can invest directly in joint stockcompanies that invest in infrastructure fields. In2001 it established the Ho Chi Minh CityInfrastructure Investment company (CII),contributing 15% of the initial US$ 20 millionequity capital and mobilizing the remainder fromthe public. CII has itself invested in two toll-roadconcessions, the Phu My Bridge BOT, the KenhDong water treatment plant, and Tan Phu IndustrialZone. With CII now on a sustainable footing, HIFUis considering selling its shares in CII.
Other direct investments made by HIFU includethe Kenh Dong Water joint stock company, the HoChi Minh City Securities Joint Stock Company, theSong Tan Industrial Zone Infrastructure InvestmentJoint Stock Company, and the Thu Duc BOO WaterJoint Stock Company. HIFU’s strategy is to contributeabout 10-20% of the initial capital of theseinvestments, and then withdraw the capital forreinvestment when the companies stabilize.
Box 2.3: Ho Chi Minh City Investment Fund for Urban Development (HIFU)

An important difference between the DAF andthe LDIFs is that the DAF raises its funds solelyfrom public sources, and lends to publicenterprises. One of the motivations for theLDIFs is to provide a legal structure fororganizing joint ventures with privateinvestors, and the LDIFs can also make equitycontributions to projects.
The financial resources involved areconsiderable:● The DAF is the biggest financial institution
in the country. In 2004, the DAF stock ofloans outstanding was around 12 percent ofGDP, and its capital amounted to VND94,145 billion (US$ 6 billion), includingcontributions from ODA (39.9%),Government bonds (14.8%), domestic trustfunds (12.1%), social security fund (10.2%),postal savings (5.9%), Treasury bills (4.2%),state budget (3.6%), capital mobilized byDAF's branches (3.1%) and State credit(1.4%). Of the resources mobilizeddomestically, about 80 percent has been on-lent to SOEs.
● In 2004 the total capital channeled throughLDIFs was approximately US$ 400 million.The four most active LDIFs are located in HoChi Minh City (HIFU), Dong Nai (DNIF),Binh Duong (BDIF) and Hanoi (HANIF).The proportions of these provincialgovernments' investments handled by theirLDIFs in 2004 were 13%, 9%, 7-8%, and 33%respectively.Because these institutions are fairly new,
their governance arrangements have not beenfully developed.● The DAF formally reports to the Prime
Minister, but is also subject to oversightthrough its Board of Management by theMinister of Finance, State Bank of Vietnam,and the Ministry of Planning and Industry.The combination of these various lines ofauthority mean the DAF suffers from mixed
management incentives, weakaccountability, and limited supervision.
● The DAF has no reserves for bad debts, nomechanism for evaluating the credit-worthiness of loans, no portfolio limits onweighting for individual sectors orcompanies, and no external audits.
● Many operational aspects of the institutions,including the LDIFs, are still at an earlystage of development, including credit riskmanagement, accounting and reportingstandards, information systems andsupervision.Decree 106/2004/ND-CP is a recent
improvement in DAF's regulatory framework.It narrows the list of eligible borrowers, andstates that only projects that are capable ofdirect repayment, are socio-economicallyefficient and have feasible business plans areeligible for DAF support. Project assets are to beused as security, and those assets cannot beassigned until loans are fully repaid. Anelement of risk-sharing, through co-paymentsby other government bodies or by commercialbanks, is also required. DAF investment lendingand credit guarantee cannot exceed 70% of thetotal capital of a project. These measures, ifeffectively implemented, will increase theprobability that debts will be serviced and fiscalcosts minimized. But other problems ofgovernance and transparency remain.
31
Toll-road financed by Ho Chi Minh City InfrastructureFund (HIFU)

The same general weaknesses ingovernance and transparency exist in the caseof the LDIFs. The central government hasplans to legislate in this area, but the decreeenvisaged in the 2001 Public AdministrationReform Master Program remains in draftform. The absence of central regulation ongovernance has been a source of flexibility,allowing provinces to experiment withdifferent structures. It is important that if orwhen the central government legislates thebest features of each LDIF be retained. Atthe same time, legislation on crucialfeatures such as governance of the fundsmay help to provide confidence thatinvestors' rights will be protected, helpingthe funds to raise more long-term capital.One of the criticisms of the LDIFs is thatthey have not been very successful inleveraging their initial charter capital.
Although the institutions have a commercialfocus, they can be directed to undertake projectsthat may not be commercially profitable atmarket interest rates.● The DAF onlends its funds at interest rates
that are lower than the cost of raising them.The government subsidizes the interest ratedifference as well the operating costs of theDAF.
● Seven LIDFs currently actively administer"entrusted" funds, provided by provincialgovernments to support favored policies.These funds are not subject to the typicalproject appraisal process of the LDIF, andthe LDIFs receive a fee for theiradministration.The rationale for supporting non-
commercial transactions is not clear. This sort ofsupport is nothing less than a public subsidy,which should be subject to the normal rigors ofpublic expenditure review. Subsidies should bejustified in terms of addressing externalities, orparticular poverty issues, so that subsidy ratesshould differ across sectors. These policies may
also reduce the commercial focus of theinvestment funds, reducing the rigor of theirproject evaluations.
A weakness shared by DAF and the LDIFs isthe risk posed to their respective governments'fiscal positions. Given the magnitude of theiroperations and the potential for making loansthat are not commercially viable, there is a needto develop governance structures that places theinstitutions at arms' length from thegovernments, to discourage false expectationsthat projects are ultimately backed bygovernment. Alternatively, there is a need formore public accounting of these institutions,and the inclusion of the accounts withinconsolidated government accounts.
Overall, these funds are helping to fill thegap in long-term finance in Vietnam's capitalmarkets, but they pose significant risks. Variousgovernance and transparency reforms arerequired to lessen these risks, and even then, itwill be beyond the capacity of many provincialgovernments to establish effective LDIFs. Thesesorts of funds alone will not meet all of theneeds of infrastructure financing.
2.3.7. Sub-National Government Financing
Decentralization has increased the spendingobligations at sub-national levels. Asdecentralization has progressed, the share ofsub-national governments in total governmentexpenditures has risen from 26% in 1992 to48% in 2002. During 2005-2010 annualrequirements will be of the order of US$ 378million for urban water supply, US$ 280million for wastewater collection andtreatment, US$ 239 million for drainageincluding canal rehabilitation, and around US$800-900 million for urban transport. This givesa total of US$ 1.7 to 1.8 billion annually, oraround 3.7% of GDP over the period 2001-2010. In addition annual required spending onlow income housing in urban areas, a
32

municipal responsibility, has been estimated atUS$ 835.4 million, or 1.8% of GDP.23
This has given rise to a challenge to mobilizefinancing at sub-national level. The majoravenues for provincial governments to mobilizefunds for municipal infrastructure are:● Budgetary resources, including transfers
from the central government.● Borrowing from SOCBs.● Own-source revenues generated mostly
from land use rights and partnerships withthe private sector.
● State development credits from the DAF.● Bond issues.● LDIFs.
The potential contributions of SOCBs, thebonds market, the DAF, and LDIFs havealready been discussed. The central source offunds is likely to remain transfers from thecentral government, but more could be doneto improve sub-national governments'own revenues.
The 2005 PER-IFA examined the challengesinherent in assigning adequate revenues to sub-national governments. One potential area forreform is greater revenue autonomy at sub-national level. At present all taxes are centrallycollected. The revenues from some taxes areretained 100% at the central level, some othertaxes are assigned 100% to provinces, andrevenues of remaining taxes are shared betweenthe central government and the provincialgovernments where the taxes are collected.District and commune governments can collectcertain fees such as waste collection and schooltuition fees, but there are no sub-national taxes.The PER-IFA suggested the possibility ofpermitting provincial governments to introducepersonal income taxes that piggyback on theexisting national income tax, and of introducinga modern property tax at district and commune
levels. At present there are many overlappingfees on different real estate assets andtransactions, which could be consolidated in asingle more efficient property tax. Sinceproperty development is a strong driver ofdemand for municipal infrastructure, propertytaxes are frequently seen as an efficient form ofcost recovery for publicly providedinfrastructure. There may also be the potentialfor greater cost recovery for a range ofmunicipal services (eg parking fees).
Another area examined in the PER-IFA isthe system of equalization transfers from thecentral government to the provinces, whichplays an important role in reducing horizontaldisparities between provinces arising fromdiffering abilities to raise their own finance, inturn arising from differences in provincialwealth and differences in provincialgovernment capacity. Greater reliance onobjective formulas (rather than ad hocnegotiation) in the allocation of these transferswould provide greater certainty to theprovinces over their future revenues, andwould thereby enhance sub-nationalborrowing capacity (since lenders, too, wouldhave greater confidence concerning the abilityof sub-national governments to repay debt). Itis important that such formulas are based onrevenue potential, rather than actual revenuescollected, to ensure that provincialgovernments do not have disincentives to raisetheir own revenues.
At present municipal governmentsfrequently raise revenue through deals withprivate property developers, particularlythrough the sale of land use rights. Asprovincial governments do ad hoc deals withthe private sector under less than idealdisclosure environments, possibilities exist forinappropriate behavior. There is a need for a
33
23. For the assumptions behind these estimates see the Urban Infrastructure Strategy paper.

basic framework at the provincial level thatmakes public the operational standards of theprovincial government for partnering with theprivate sector. Ideally, the standards should bedeveloped by each provincial government andannounced to the public; alternatively, theymay be proposed by the central government.These standards should impose an obligation touse competitive bidding, and should establish atransparent procedure for dealing withunsolicited proposals.
2.3.8. Non-Bank Financial Institutions
In more developed financial markets, riskpooling institutions (insurance companies) andcontractual savings institutions (such as mutualfunds or private pension plans) are important
complements to the banks (see, for example,Box 2.4). Such institutions can help to broadenthe range of maturities and risks available toinvestors, and thereby offer offer a wider rangeof maturities and risk-pooling services forinvestors. Currently much private domesticsaving is directed toward investment inproperty, small-scale business ventures, gold,offshore accounts or simply held 'under themattress'. The promotion of vehicles for long-term investment may help to promote thenational returns on these savings, and wouldalso help to provide a long-term source offinance for infrastructure.
By providing competition to the banks,non-bank financial institutions can help topromote overall efficiency. And their presencecan help economies to recover more quickly
34
To increase investment in infrastructure during theearly 1990s, Chile’s government introduced aconcession program to attract private capital into thetransport infrastructure sector, covering roads andhighways, bridges, tunnels, and airports. Theprogram has managed to attract over US$ 3.6 billionin private investment in infrastructure.
Chile was the first Latin American country to allowpension funds to invest in infrastructure projects. In1981, Chile replaced its bankrupt pay-as-you-goretirement system with a fully funded system ofindividual retirement accounts managed by theprivate sector. By 2001, more than 95% of Chileanworkers had joined the system; the pension fundshave accumulated US$36 billion in assets; and theaverage real rate of return has been 10.9% per year.
Initially, pension funds were legally constrainedfrom investing in infrastructure projects. Inparticular, the lack of investment grade rating forbonds or other financial instruments issued byconcession companies was an obstacle. In order tofacilitate investments from pension funds andinsurance companies legal changes to financial andinfrastructure regulations were introduced duringthe mid-1990s. These reforms helped pension fundsand insurance companies to invest in bonds withouthistory. As a result of these reforms, a new long-
term financial instrument, the Infrastructure Bond,was created. The typical infrastructure bond offereda 20-year fixed rate bond denominated in Unidadesde Fomentos (an inflation-adjusted unit of accountused in Chile with a AAA local rating and amonoline guarantee. The bonds are sold exclusivelyto local private investors, including local pensionfunds, and they have been continuouslyoversubscribed.
Of the 16 toll road concessions awarded, 11have opted for the alternative of InfrastructureBonds, 3 have financed through bank loans and 2concessions have not yet decided their financingstructure. The development of the infrastructurebond market was assisted by the fact that in 1995Chile achieved an “A-“ credit rating, creating anopportunity for monoline insurance of bondissuances. In November 1998, the consortiumhandling the upgrade of the Talca – Chillan stretchof the nation’s main thoroughfare, Route 5, issuedthe first US$ 150 million in infrastructure bonds. Bymid-2002, a total of US$ 963 million ofinfrastructure bonds had been issued in fiveofferings. The concession program is now beingexpanded to fund private investment in jails andurban infrastructure.Source: World Bank (2004)
Box 2.4: Using Pension Funds to Finance Infrastructure in Chile

from shocks to the banking sector. While thecurrent reform priority is the banking sector,because of its general role in financing allbusinesses, some efforts could be directed tothe promotion of the non-bank financial sector.Care is needed to ensure adequate prudentialsupervision of the sector.
2.3.9 Credit Rating Agencies
Credit rating agencies could help to improvethe efficiency of various elements of financialmarkets, by improving the quality ofinformation concerning the likelihood ofrepayment by companies or governmentsseeking finance. Such information would assistin more accurate valuations of financial assetssuch as bonds or shares, whether issued bygovernments or enterprises, and could be alsoused by banks to assist in determining credit-worthiness of firms seeking loans.
Vietnam's first ever credit rating agency, theCredit Ratings Vietnamnet Center (CRVC) waslaunched on June 4, 2005, by the state-ownedVASC Software and Media Company. Theinitiative arose with VASC rather thangovernment officials. It appears unlikely thatthis firm will have the resources to providecredit information on infrastructure firms.Supportive regulation may be required toestablish an agency with the capacity to obtainuseful information on infrastructure firms. Suchregulation could include rights of access toinformation concerning tax and customs, orlegal obligations for firms wishing to be listedor to issue bonds to have a credit rating.Newspapers report that the Ministry ofPlanning and Industry is seeking a foreignpartner to set up another credit rating agency asa joint venture or 100% foreign-ownedenterprise.
2.3.10. Equitization
Internationally, many governments have usedthe sale of shares of state-owned enterprises asa means of raising substantial revenue. AsVietnam confronts the financing challenges ofits major investment program, equitizationcould provide an additional source of finance.
The equitization program is a process ofdiversification of ownership of state-ownedenterprises by sale of shares. For the most part,equitization has involved sales of shares toworkers, and has been attributed withincreasing workplace productivity byproviding stronger worker incentives.Equitization can also entail sale to another SOE,so it is not necessarily equivalent toprivatization. Equitization frequently entails asale of as little as 15% of the shares, with theState remaining the dominant owner.
In 2003, about 450 SOEs were equitized, anda further 700 in 2004. Surveys conducted in 850equitized SOEs found that businesses whichsuccessfully completed restructuring increasedtheir capital by 44%, turnover by 24% and laborincome by 12%. Most of the equitizedenterprises have been small, with capital underVND 5 billion (US$ 300,000). Firms with overVND 10 billion capital accounted for only 13%of the equitized companies in 2004.24
Rules related to infrastructure underDecision 155 of 2004 include:● The national electricity transmission system
will remain State owned, but distributionand generation are open to equitization ofup to 49%.
● National and international communicationscables will remain State owned. There is nodiscussion concerning who has the right touse the cables.
● Management and maintenance of the
35
24. Source: Vietnam Economy (2005)
national railway network are to remain Stateowned, as are large airports and seaports,sewage treatment works in big cities andpublic lighting.
● Companies that have State capital of at leastVND 30 billion and average annualcontribution to the State budget of VND 3billion and that operate in air and railtransportation will continue to be 100% Stateowned.
● The State will retain at least 50% of capital inlarge urban water companies.
● The State will retain at least 50% of thecapital in companies operating in maritimetransport.
● The State will retain at least 50% of thecompanies operating in the managementand maintenance of important roads,waterways, boats and bus stops.
● Construction companies no longer appearon lists of SOEs where the State will retain atleast 50% of the capital.Thus the new Decision and the new Decree
provide a legal basis for the equitization ofsome infrastructure SOEs. By the summer of2005, equitization pilots had been undertaken inboth electricity generation and distribution, andplans exist to equitize all of the existing powerplants of EVN except for the large hydro plants,during the next three years. The Ministry ofTransport and Communications has alreadyequitized 48 enterprises, and in June 2005announced plans to equitize 141 enterprises in2005 and 2006. Consideration is being given toequitization of VNPT's two mobile phonesubsidiaries.
Several general features of the currentequitization program reduce its financingbenefits. Investors will reduce the amount theyare willing to pay for shares in a company if:● There is inadequate disclosure of
information about the accounting positionand the business risks;
● An underdeveloped corporate governance
regime does not provide adequateshareholder rights to direct managers, ordoes not protect minority shareholders'rights to a proportional share of profits;
● Investors in infrastructure are not able toobtain management control;
● Shares are not listed on a stock exchange,reducing the ease with which shares can besold. Only a small proportion of equitizedcompanies are listed. In 2005 only 28equitized SOEs were listed on the Ho ChiMinh stock exchange, out of more than 2,400equitized SOEs.
● Sales are frequently restricted to managersand workers, who may be willing or able topay less for particular shares than generalinvestors.As the equitization process expands in size
and scope, these problems need to be remedied.This could, in part, be achieved by a newcomprehensive law on equitization (or onequitization of infrastructure firms), dealingwith the methods of sale, legal rights of redressof minority shareholders etc. Alternatively, thegovernment could start with pilot projects, andimprove its practice as it goes on.
2.3.11 Private Investment
There is great potential for more privateinvestment in infrastructure. Privateinvestment, including foreign investment,offers a virtually limitless source of financing,and could go far to meeting the infrastructureinvestment agenda. But taking full advantage ofthis potential requires sound projects in whichprices fully cover costs, including a return oncapital; careful transaction preparation; and asound regulatory environment. While thereappears to be reluctance within government toadvance rapidly toward a major program ofprivate investment in infrastructure, a strongcase can be made for increased experimentationwith private investment transactions, to
36

determine the extent to which a broader privateinvestment program would be desirable, and tobuild up the necessary experience to be able tomove to a broader program.
Table 2.3 summarizes the amounts investedin infrastructure projects with privateparticipation since 1994. Over the period 1997-2003 private participation in infrastructure (PPI)commitments amounted to about 15% of totalinfrastructure investments. Excluding a singleproject, the US$ 1.3 billion development of a gasfield and pipeline, PPI commitments amount to8.5% of total investment. That is, setting apartthe gas development, private financing hashistorically played a quite small part ininfrastructure investment.
Energy has been the principal recipient ofPPI, with the development of the Nam Con Songas field and several BOT independent powerprojects (IPPs). Going forward, in the absenceof other financing sources EVN will need topurchase more than half the incremental powerrequired during 2005-2010 from independentsources, mainly independent power plants. ThePhu My II experience of competitive biddingand successful closure provides a goodpotential template for further IPPs.
The telecommunications sector is a prime
potential candidate for increased privateparticipation. International capital markets are,for example, usually very willing to invest intelecommunications. Moreover becausetelecommunications markets can supportstrong competition they pose lesser regulatorydifficulties than other sectors. Involving theprivate sector in telecommunications marketscould increase financing available fortelecommunication investment, and free publicresources for investment in other sectors. Morecompetitive telecommunications markets havealso historically showed stronger jobs growth.Increased private investment in telecoms wouldrequire an acceleration of the current movementtowards liberalization, including relaxation ofthe current restrictions on foreign ownership.To further accelerate the process, existingtelecoms companies could be equitized, withpermission for foreign participation.
The biggest single area of new investmentrequired is in transport, of which roadsrepresent the largest proportion of investment(about 80%). Toll roads can provide interestingpossibilities for private investment. There aremany potential projects in other sectors, bothlarge and small, that could potentially benefitfrom greater private finance, including water
37
Table 2.3: Private Investment (Contractual Commitments)-US$ millions
Ports Airports Tollroads Telecoms Water Electricity Gas
1994 10 1995 128 1996 15 40 205 1997 70 714 110 1998 237 38.8 1999 120.5 2000 20 2001 154 2002 20 10 480 1300 2003 230 412 2004
Source: PPI database, except for telecommunications, where BCC network investments are drawn from USAID (2005).
Ports Airports Tollroads Telecoms Water Electricity Gas

and sewerage treatment plants, bridges, andport development.
But involving the private sector inundertaking significant investments ininfrastructure is a complex and difficult task. Toattract private finance, investors must expect toearn a return on the capital investedcommensurate with the risks undertaken, butthese needs must be balanced with theprotection of consumers from the market powerof privatized infrastructure. This balancing actmust be implemented in transaction documents(legal contracts, licenses, and laws establishedto induce the initial investments) and in theongoing regulatory environment established togovern the infrastructure firm's operations. Toget all of this right is a highly complex affair,requiring skilled economists, accountants, andlawyers, as well as careful political guidance.The best way of establishing these skills wouldbe through experience, which suggests thatVietnam should, in addition to the IPP programenvisaged for electricity, seek to establish pilotprojects with private participation, includingmanagement control rights, in a range ofinfrastructure sectors.
2.3.12 Risk Management
It is desirable to advance investments throughtime, but doing so introduces a risk that thegovernment will not be able to repay theadvanced funds. A traditional element of riskcontrol has been debt management, to ensurethat debt repayment does not occupy anexcessive proportion of governmentexpenditure. As alternative financinginstruments are increasingly embraced, greaterattention will also need to be given tocontingent liabilities, incurred both at thenational and provincial level.
Internationally, as governments have looked
to their state-owned enterprises or the privatesector to assume a greater proportion ofinfrastructure financing, they have oftenprovided guarantees or other forms ofcontingent support. For example, a state-ownedenterprise's bond issue might be guaranteed bythe government, or the government mightguarantee the purchase of a minimum quantityof electricity from an independent powerproducer by its state-owned utility. The aim isto increase the expected returns for privateinvestors, and hence private investment,without direct cash from the budget.
In considering whether to give contingentsupport to a project it is useful to distinguishbetween policy and non-policy risks.25 Policyrisk is variation in a project's net returns thatmay result from changes in government policy.Unilateral changes by the government to laws,regulations, or even contracts, can reduceproject profitability. When private investors areexposed to these risks their cost of capital isincreased. When the Government bears theserisks it has a stronger incentive to establish andmaintain sound policies. Overall, agreements tocompensate investors in the event of policychanges can reduce project costs.
Non-policy risks are those over which thegovernment has little or no influence. Examplesinclude the costs of construction, future demandfor the infrastructure service, or the value of localcurrency. Internationally, some governmentshave given guarantees to cover non-policy risksbecause of the illusion that no cost is borne by thegovernment. As with policy risks, there is a costto the Government of bearing these risks sincethere is some probability that the guarantee willbe called, but in this case it is not clear that thecost is any lower for the government than forprivate investors.
When guarantees are given, a fiscallyprudent government should take reasonable
38
25. See Brixi (2005).

steps to control the "exposure", "fiscal cost", and"fiscal risk" created. Exposure means themaximum possible amount the governmentcould pay as a result of giving the guarantee.Fiscal cost means the expected net present valueof the cash flows paid as a result of giving theguarantee, taking account of the probability thatthe guarantee will be called. Fiscal risk meansthe variability of the cash flows paid by thegovernment.
Contingent liabilities can be an effectivemechanism for the Government to leveragescarce budget resources, encouraging greaterprivate financing. The fact that they involverisks does not mean they are to be avoidedaltogether. Rather, it suggests a need to monitorthe risks, to ensure they are not excessive.Elements of an effective risk managementframework include:● Development of guidelines and criteria for
the sorts of risks that should be guaranteedby the government;
● Policies that limit the government'sexposure to risks to prudent levels;
● Quantitative analysis of the fiscal costs andrisks of proposed guarantees and otherforms of government support,
● Financial reporting that disclosesgovernment guarantees and their expectedcosts in the government's accounts.
● Institutional support for these policies,including staff with the appropriate skills.Issues of risk management are likely to be
encountered in the near future with the pressingneed to develop IPPs in the electricity sector.The government's approach to guarantees forIPPs will have implications for other sectors.Policy in respect of IPP guarantees should bedeveloped as part of a broader government-wide approach to risk management.
Vietnam's risk management frameworkshould embrace the activities of the nationalgovernment, sub-national governments andstate-owned enterprises. In practice the
Government cannot afford to have sub-nationalgovernments or major infrastructure enterprisescollapse because they have assumed excessiveliabilities. So either the national Governmentmust ensure that it has adequate revenues tocover the consolidated exposure of theseentities, or that each of these entities has its ownadequate risk management framework.
2.4 Recommendations
Recent levels of investment in infrastructurehave been around 9% of GDP. Infrastructureinvestment is devoted to the backlog ofinvestment required to provide consumers withbasic services combined with system expansionto keep pace with Vietnam's rapid pace ofgrowth. Given that the backlog remains in termsof various access statistics, and electricityinvestment has barely kept pace with demand,there is no evidence that this level of investmenthas been excessive. Indeed sectoral plans suggesta possible need for infrastructure investmentfinancing of 10-11% of GDP, although theseplans need to be subjected to review on a projectby project basis to ensure that each project yieldspositive net social returns.
Within the overall level of investment thereis significant room to increase the proportionof non-budgetary and non-ODA financing.This would free up budget and ODAresources, permitting either an increased levelof infrastructure investment or spending onother government priorities. The developmentof alternative financing reforms would alsohelp to replace concessional ODA, as it drawsto an end. A variety of reforms would help todevelop such alternative financing sources,and to improve the efficiency of existingfinancing sources.
To assist in prioritizing, recommendationsfor reform are accompanied by an indication oftheir proposed timeframes: (S) short-term (1-2years) and (M) medium term (3-5 years). In
39
general, recommendations that suggest a policychange or a simple review can be implementedwithin a short timeframe, whereas
recommendations requiring capacity buildingmay require a slightly longer timeframe.
Recommended actions are:
40
(2.1) Im prove project m onitoring and evaluation m echanism s to assess financial and
w ider econom ic returns achieved by the infrastructure investm ent program . A
particular priority isthe transportsector,w here there are less obvious access targets
to be achieved than in other sectors and w here there is considerable reliance on
publicinvestm ent.
(M )
(2.2) M ove toachieve greater costrecovery across infrastructure sectors,w here feasible. (S)
(2.3) Establish criteriafor the use oftaxpayer funding in infrastructure financing lim iting
the use oftaxpayer funds toprojectsw here:
• the socialbenefitshave been show n to exceed private benefitsby reason of
externalities or socialconcerns;and
• cost recovery through user charges is achieved to the m axim um extent
possible,butthisisnotsufficienttoensure financialviability.
(S)
(2.4) Im prove the com m ercial focus of public financial institutions, including SOCBs,
DAF,and LDIFs.Lending decisions should be based on com m ercialassessm entsof
the probability ofrepaym entand loans should be priced to reflectthe risk involved.
M easures to im plem ent this include developm ent of appropriate governance
structures and legal m andates w hich prescribe the conditions under w hich loans
m ay be m ade, and technical assistance to build capacity in assessing potential
returns and rating risks accurately.
(M )
(2.5) Im prove the efficiency of bond m arkets by, am ong other m atters, im proving
inform ation disclosure concerning the ability of public authorities to m eet debt
obligations,issuing governm entbonds w ith arange ofterm s,toprovide benchm arks
for non-governm entfinancialinstrum ents,im prove debtissuance and m anagem ent
by Treasury, increase secondary activity and liquidity of the governm ent bonds
through enhancem entstothe legalfram ew ork.
(M )
(2.6) Establish guidelines for the issuance of governm ent bonds to be used for
infrastructure financing, giving preference to bonds backed by infrastructure
revenues rather than bythe Governm ent’sgeneralrevenues.
(S)
(2.7) Conduct an assessm ent of m unicipal financing needs and m eans, com paring
m unicipalneeds w ith an assessm entoffinancialresources available,and potentially
available,atm unicipallevel.
(S)
(2.8) Im prove m unicipalfinancing capacities.Com m ence w ith pilotexercises w ith lessons
to be applied nationally.Elem entsofthe pilotexercises could include:adiagnosisof
existing strengths and w eaknesses in m unicipalcapacity;review ofthe efficiency of
the levels and structures of m unicipal taxes and charges; explore possibilities for
increased transparency and publicparticipation in budgeting;build capacity in cost
control; im prove accounting system s (e.g. com puterization, ‘m odified accrual
accounting’);and develop new m unicipalfinance instrum entsincluding bonds.
(M )

41
(2.9) Revise governance arrangem ents for the LDIFs to legally distance them from their
ow ning governm ents,in the sense thatrecourse m ay notbe had to agovernm entfor
liabilities incurred byan LDIF.
(S)
(2.10) Im prove the regulatory fram ew ork for equitization,including enhanced inform ation
disclosure and better protection of shareholder rights; and a requirem ent that
equitized infrastructure firm s be listed on publicstock exchanges.
(S)
(2.11) Accelerateprivateinvolvem entin the telecom m unications and electricity industries,
and launch pilotprogram s for greater private sector involvem entin the w ater and
sanitation and transportsectors.
(S)
(2.12) Establish a risk m anagem entfram ew ork thatestablishes a cap on the governm ent’s
exposure to contingentliabilities,provides guidelines for the appropriateallocation
of risks betw een the public and private sectors in public-private partnerships, and
requires M inistry ofFinance approvalfor any publicsupport,director contingent,to
public-privatepartnerships.
(M )

42

43
3.1 Prioritizing Investment Decisions
The importance of economic criteria forchoosing between investment projects is likelyto increase as the infrastructure stock increases.Identifying high return projects was easy whenmuch of the population lacked access toinfrastructure services. As the access rolloutadvances, choosing between investments thatupgrade the quality of service will become moredifficult.
An economically efficient planning processwould estimate the economic rates of returnassociated with each project, and accordpriority according to the rate of return.Financing would be allocated to projects inaccordance with their priority, until such timeas budgeted public finance had beenexhausted.
The current planning process is a long wayfrom this ideal, with no explicit statement ofhow trade-offs are to be made between desired
investments. There are no guidelines for projectappraisal prior to planning approval, and theplanning process does not provide for projectmonitoring to gain evidence on the sorts ofreturns obtained from different project types.The lack of economic criteria to guide prioritiesextends to the separation of planning for newinvestment versus maintenance. In some casesincreased maintenance will yield higher returnsthan new investment, and so should receivehigher funding priority.
A first step towards improved criteria for theallocation of public funds to public projectswould be improved feasibility studies forproposed infrastructure projects. Even if preciserates of return could not be estimated for allprojects, improved information would assist indistinguishing higher priority projects fromlesser priority projects. Box 3.1 identifies areasfor improvement in typical Vietnamesefeasibility studies.
3. Planning and Coordination
Issues
There are three broad areas of difficulty with current infrastructure planning and coordination:(i) The absence of economic criteria for setting priorities between different projects.(ii) The horizontal coordination of decisions between ministries with planning responsibilities,
particularly in respect of the incorporation of financing considerations and spatialdevelopment goals into infrastructure investment planning.
(iii) The vertical allocation of responsibilities across levels of government, with the principle of“dual subordination” potentially complicating or delaying approvals and withdecentralization leading to difficulties of coordination across sub-national levels ofgovernment.
In addition to these issues of general cross-sectoral application, improvements are particularlyneeded in urban planning, where spatial planning and timing are more critical than elsewhere, andin incorporation of environmental and social considerations into the general investment planningframework.
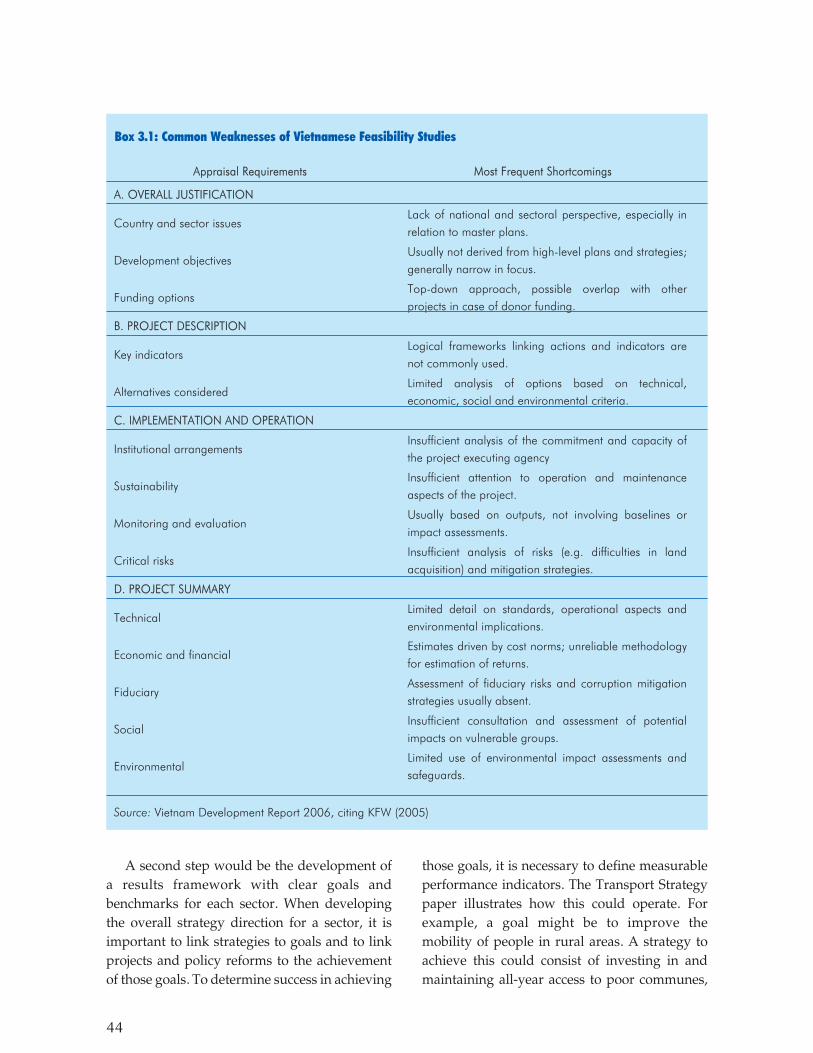
A second step would be the development ofa results framework with clear goals andbenchmarks for each sector. When developingthe overall strategy direction for a sector, it isimportant to link strategies to goals and to linkprojects and policy reforms to the achievementof those goals. To determine success in achieving
those goals, it is necessary to define measurableperformance indicators. The Transport Strategypaper illustrates how this could operate. Forexample, a goal might be to improve themobility of people in rural areas. A strategy toachieve this could consist of investing in andmaintaining all-year access to poor communes,
44
Box 3.1: Common Weaknesses of Vietnamese Feasibility Studies
Appraisal Requirements Most Frequent Shortcomings
A. OVERALL JUSTIFICATION
Country and sector issues Lack of national and sectoral perspective, especially in relation to master plans.
Development objectives Usually not derived from high-level plans and strategies; generally narrow in focus.
Funding options Top-down approach, possible overlap with other projects in case of donor funding.
B. PROJECT DESCRIPTION
Key indicators Logical frameworks linking actions and indicators are not commonly used.
Alternatives considered Limited analysis of options based on technical, economic, social and environmental criteria.
C. IMPLEMENTATION AND OPERATION
Institutional arrangements Insufficient analysis of the commitment and capacity of the project executing agency
Sustainability Insufficient attention to operation and maintenance aspects of the project.
Monitoring and evaluation Usually based on outputs, not involving baselines or impact assessments.
Critical risks Insufficient analysis of risks (e.g. difficulties in land acquisition) and mitigation strategies.
D. PROJECT SUMMARY
Technical Limited detail on standards, operational aspects and environmental implications.
Economic and financial Estimates driven by cost norms; unreliable methodology for estimation of returns.
Fiduciary Assessment of fiduciary risks and corruption mitigation strategies usually absent.
Social Insufficient consultation and assessment of potential impacts on vulnerable groups.
Environmental Limited use of environmental impact assessments and safeguards.
Source: Vietnam Development Report 2006, citing KFW (2005)

with particular projects involving a bond issue,community contributions, and various donorprojects. An indicator to measure performancemight be the number of additional householdsprovided with access to an all-weather roadwithin 2 kilometers. The results frameworkshould be comprehensive. Projects that are notdirected to achieving particular sectoral goalsshould not be approved.
With improved criteria for distinguishingbetween projects, and a results framework
providing the justification for projects, there isthen a need for a governmental process that iscapable of allocating funds to the highestpriority projects, with lower priorities receivingfunding only to the extent of available funding.The example of Malaysia's planning process(see Box 3.2) suggests that projects that couldpotentially be privately funded may receive lowpriority for public funding.
An important element of such processes is themonitoring and evaluation of projects to
45
Development planning in Malaysia addresses long-, medium- and short-term planning horizons, andblends centralized and decentralized planning.
Vision 2020 was launched in 1991, spellingout the national development aspirations over a 30year period. It is supported by 10-year outlineperspective plans that provide an indication ofspecific programs to support the Vision. Medium-term planning occurs with 5-year developmentplans that set out the allocation of the publicsector development program. By identifyingpriority sectors the plans also give guidance to theprivate sector in determining their own investmentpolicies. In the middle of the 5-year planningcycles, a mid-term review (MTR) of the five-yearplan is carried out. The MTR determines whetherthe plan is implemented in accordance with thestated targets and development schedule, andmakes adjustments to sectoral policies andstrategies if needed. Short-term planning (andadjustment of plans) occurs through the annualbudget prepared by the Ministry of Finance.
At the national level development objectivesare formulated by the National Economic Council(NEC)—a ministerial council chaired by the PrimeMinister—and the National DevelopmentPlanning Committee (NDPC)—composed of topcivil servants from federal ministries. TheEconomic Planning Unit (EPU)—located in the inPrime Minister’s department—acts as acoordinating and integrating agency rather than asinitiator of sectoral plans. A similar institutionalarrangement exists at the state and district levels.At the state level, the State Economic PlanningUnits and the State Development Offices areresponsible for formulating state developmentstrategies.
At the beginning of every Plan the NEC and
NDPC determines broad development policies andsectoral priorities. Ministries, departments,statutory authorities, and non-financial publicenterprises are invited to submit bids fordevelopment funding for the next five years toimplement the identified strategies. Sub-nationalagencies are required to discuss their developmentprograms with the appropriate State EconomicPlanning Unit before submitting them to therelevant federal ministry. This ensures that thestate governments are aware of the developmentproposals of the federal agencies operating withintheir boundaries. Submissions must includedescriptions of the proposed projects, includingcost estimates. On receipt of the submissions theEPU assesses and prioritizes development projects.It consults with the ministries, agencies, and stategovernments to review past performance andbetter examine the scope and cost of eachprogram. The NDPC has ultimate jurisdiction overthe selection of expenditure programs for the five-year plans.
The number and size of proposals alwaysexceeds available resources. Accordingly the EPUhas to match and prioritize the requirements withrespect to sound public finance practice. Some ofthe broad criteria applied when prioritizing theprojects are growth promotion, project viability,social obligation and needs, poverty eradication,and promotion of regional balance. Projects inurban areas that have potential for privatizationare given less priority than projects with littlescope for privatization. Projects in the lessdeveloped states and regions are given moreweight than those in the more developed statesand regions. Continuing projects are given priorityover new projects.
Source: Economic Planning Unit (2004).
Box 3.2: Development Planning in Malaysia
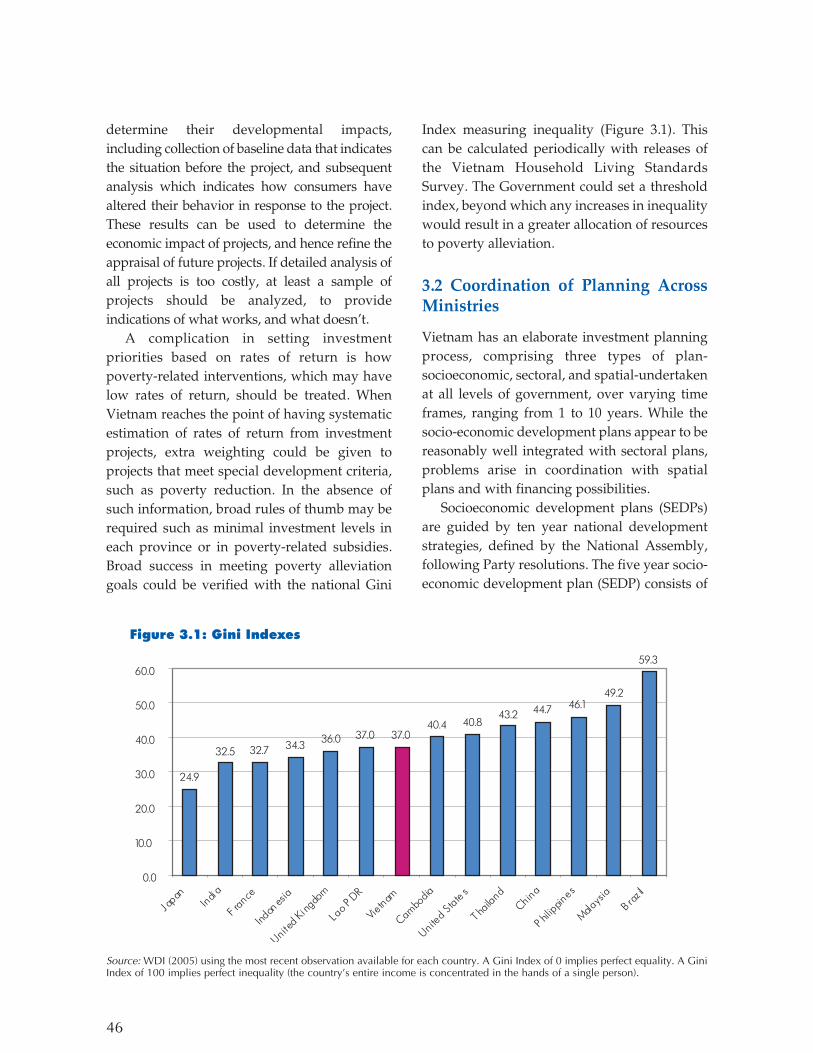
46
determine their developmental impacts,including collection of baseline data that indicatesthe situation before the project, and subsequentanalysis which indicates how consumers havealtered their behavior in response to the project.These results can be used to determine theeconomic impact of projects, and hence refine theappraisal of future projects. If detailed analysis ofall projects is too costly, at least a sample ofprojects should be analyzed, to provideindications of what works, and what doesn't.
A complication in setting investmentpriorities based on rates of return is howpoverty-related interventions, which may havelow rates of return, should be treated. WhenVietnam reaches the point of having systematicestimation of rates of return from investmentprojects, extra weighting could be given toprojects that meet special development criteria,such as poverty reduction. In the absence ofsuch information, broad rules of thumb may berequired such as minimal investment levels ineach province or in poverty-related subsidies.Broad success in meeting poverty alleviationgoals could be verified with the national Gini
Index measuring inequality (Figure 3.1). Thiscan be calculated periodically with releases ofthe Vietnam Household Living StandardsSurvey. The Government could set a thresholdindex, beyond which any increases in inequalitywould result in a greater allocation of resourcesto poverty alleviation.
3.2 Coordination of Planning AcrossMinistries
Vietnam has an elaborate investment planningprocess, comprising three types of plan-socioeconomic, sectoral, and spatial-undertakenat all levels of government, over varying timeframes, ranging from 1 to 10 years. While thesocio-economic development plans appear to bereasonably well integrated with sectoral plans,problems arise in coordination with spatialplans and with financing possibilities.
Socioeconomic development plans (SEDPs)are guided by ten year national developmentstrategies, defined by the National Assembly,following Party resolutions. The five year socio-economic development plan (SEDP) consists of
Source: WDI (2005) using the most recent observation available for each country. A Gini Index of 0 implies perfect equality. A GiniIndex of 100 implies perfect inequality (the country’s entire income is concentrated in the hands of a single person).
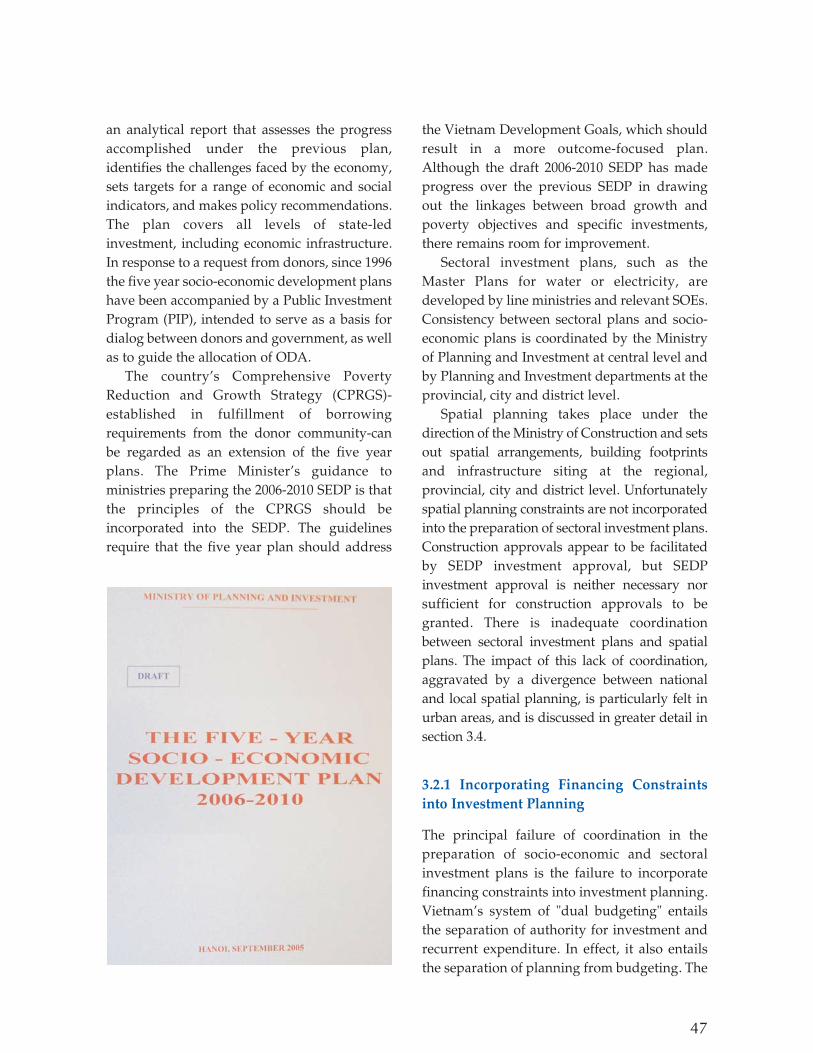
an analytical report that assesses the progressaccomplished under the previous plan,identifies the challenges faced by the economy,sets targets for a range of economic and socialindicators, and makes policy recommendations.The plan covers all levels of state-ledinvestment, including economic infrastructure.In response to a request from donors, since 1996the five year socio-economic development planshave been accompanied by a Public InvestmentProgram (PIP), intended to serve as a basis fordialog between donors and government, as wellas to guide the allocation of ODA.
The country's Comprehensive PovertyReduction and Growth Strategy (CPRGS)-established in fulfillment of borrowingrequirements from the donor community-canbe regarded as an extension of the five yearplans. The Prime Minister's guidance toministries preparing the 2006-2010 SEDP is thatthe principles of the CPRGS should beincorporated into the SEDP. The guidelinesrequire that the five year plan should address
the Vietnam Development Goals, which shouldresult in a more outcome-focused plan.Although the draft 2006-2010 SEDP has madeprogress over the previous SEDP in drawingout the linkages between broad growth andpoverty objectives and specific investments,there remains room for improvement.
Sectoral investment plans, such as theMaster Plans for water or electricity, aredeveloped by line ministries and relevant SOEs.Consistency between sectoral plans and socio-economic plans is coordinated by the Ministryof Planning and Investment at central level andby Planning and Investment departments at theprovincial, city and district level.
Spatial planning takes place under thedirection of the Ministry of Construction and setsout spatial arrangements, building footprintsand infrastructure siting at the regional,provincial, city and district level. Unfortunatelyspatial planning constraints are not incorporatedinto the preparation of sectoral investment plans.Construction approvals appear to be facilitatedby SEDP investment approval, but SEDPinvestment approval is neither necessary norsufficient for construction approvals to begranted. There is inadequate coordinationbetween sectoral investment plans and spatialplans. The impact of this lack of coordination,aggravated by a divergence between nationaland local spatial planning, is particularly felt inurban areas, and is discussed in greater detail insection 3.4.
3.2.1 Incorporating Financing Constraintsinto Investment Planning
The principal failure of coordination in thepreparation of socio-economic and sectoralinvestment plans is the failure to incorporatefinancing constraints into investment planning.Vietnam's system of "dual budgeting" entailsthe separation of authority for investment andrecurrent expenditure. In effect, it also entailsthe separation of planning from budgeting. The
47

Ministry of Finance (MOF), and Departmentsof Finance (DOF) at sub-national levels, aregiven responsibility for preparation of the fiscalframework and recurrent expenditure, whilethe Ministry of Planning and Investment (MPI),and Departments of Planning and Investment(DPI) at local levels prepare the investmentbudget, including capital expenditure anddonor funded projects.
The Public Investment Program provides along list of investments compiled fromsectoral master plans. But the PIP is preparedwithout reference to financing sources. It iseffectively a wish-list which could potentiallybe implemented in the absence of a hardbudget constraint. To fully implement the2001-2005 PIP would have requiredinvestment of approximately 15 percent ofGDP per year.
A central process for allocation of publicfunds to the PIP would be desirable, to permitall proposed projects to be consideredtogether when financing priorities aredecided. In practice, sectoral ministries obtainfinance directly from the state budget (withallocations made by the National Assembly, orProvincial People's Councils), or from lineministries' own budgets, from the DAF, ODA,or from retained SOE earnings. Finally, theState Bank of Vietnam can place informalpressure on SOCBs to lend to specific projects.The absence of consistent criteria for projectselection across these organizations meansthat there is no effective system forprioritizing the commitment of public funds toinvestment projects.
A better organized system for the allocationof public funds would provide greater certaintyto sectoral planners when designing projects.Under the current system, uncertainties overfinancing lead to projects frequently changescope, size, location, and timing. There areunimplemented projects, unfinished projects,and untimely delivery.
Lack of coordination between investmentand financing approvals has created seriousproblems in the past. During 1999-2002about 35% of commitments for transporthad received prime ministerial approval,but had not been allocated funding. TheMinistry of Transport contracted state-owned construction companies toundertake work, on the promise ofsubsequent reimbursement. State-ownedcommercial banks were encouraged toadvance credit to the constructioncompanies, and to provide subsequent loanrollovers when budget funds were still notallocated. Arrears in the Ministry ofTransport amounted to VND 1,200 billion,and debts of the Transport ConstructionCorporation to its creditors amounted toVND 1,000 billion. The Governmentultimately agreed to absorb debt incurredfor projects implemented in fulfillment ofmaster-plans, but many projects had noteven been the subject of master plans. Thebrunt of the Government's decision not topay for these projects was borne byconstruction companies and by the SOCBs.
To date, the government's attempts to betterco-ordinate budgeting and investment planninghas focused on clarification of the respectiveresponsibilities of the MPI and MOF, ratherthan better integration.
One recent step towards better matching offinances with planned projects is theintroduction of pilot programs for mediumterm expenditure frameworks (MTEFs) (see Box3.3) in the transport sector and other non-infrastructure sectors. A positive effect ofincorporating budget constraints into theMinistry of Transport's investment planningappears to have been achieved in the Ministry'sinitial expenditure proposals prepared in thecontext of the MTEF in September, 2005. Whereprevious estimates of annual financing needsfor potential investments had amounted to
48
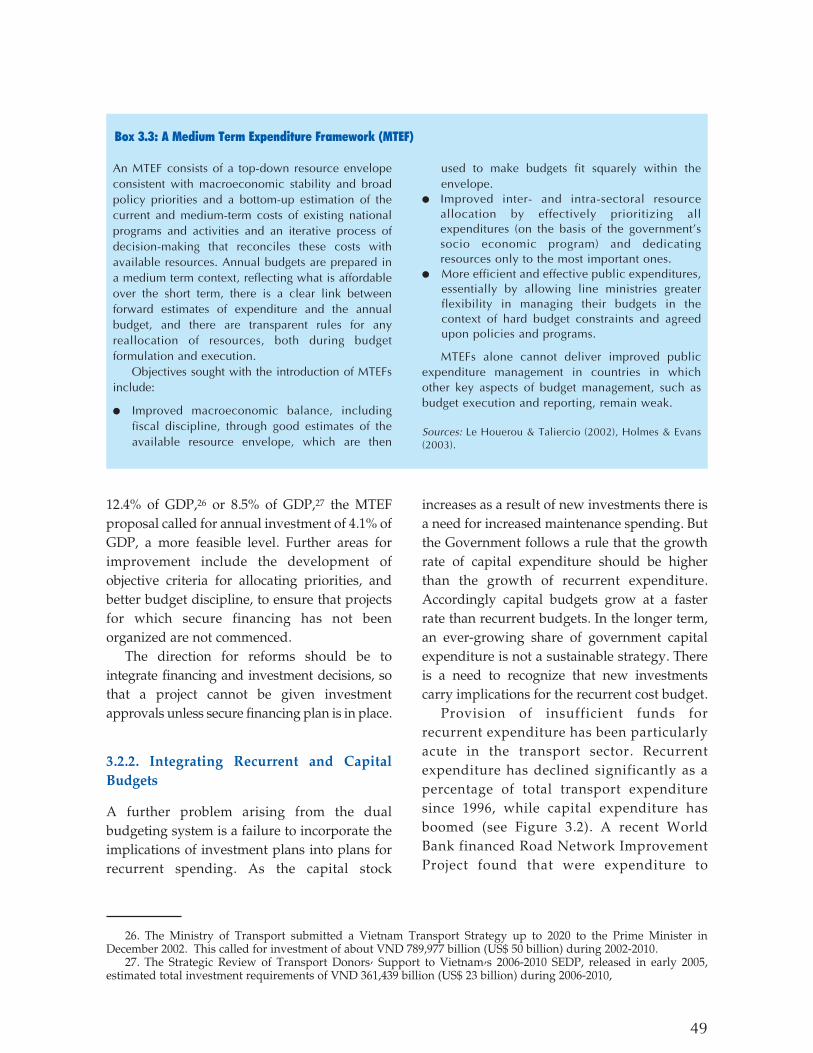
49
12.4% of GDP,26 or 8.5% of GDP,27 the MTEFproposal called for annual investment of 4.1% ofGDP, a more feasible level. Further areas forimprovement include the development ofobjective criteria for allocating priorities, andbetter budget discipline, to ensure that projectsfor which secure financing has not beenorganized are not commenced.
The direction for reforms should be tointegrate financing and investment decisions, sothat a project cannot be given investmentapprovals unless secure financing plan is in place.
3.2.2. Integrating Recurrent and CapitalBudgets
A further problem arising from the dualbudgeting system is a failure to incorporate theimplications of investment plans into plans forrecurrent spending. As the capital stock
increases as a result of new investments there isa need for increased maintenance spending. Butthe Government follows a rule that the growthrate of capital expenditure should be higherthan the growth of recurrent expenditure.Accordingly capital budgets grow at a fasterrate than recurrent budgets. In the longer term,an ever-growing share of government capitalexpenditure is not a sustainable strategy. Thereis a need to recognize that new investmentscarry implications for the recurrent cost budget.
Provision of insufficient funds forrecurrent expenditure has been particularlyacute in the transport sector. Recurrentexpenditure has declined significantly as apercentage of total transport expendituresince 1996, while capital expenditure hasboomed (see Figure 3.2). A recent WorldBank financed Road Network ImprovementProject found that were expenditure to
An MTEF consists of a top-down resource envelopeconsistent with macroeconomic stability and broadpolicy priorities and a bottom-up estimation of thecurrent and medium-term costs of existing nationalprograms and activities and an iterative process ofdecision-making that reconciles these costs withavailable resources. Annual budgets are prepared ina medium term context, reflecting what is affordableover the short term, there is a clear link betweenforward estimates of expenditure and the annualbudget, and there are transparent rules for anyreallocation of resources, both during budgetformulation and execution.
Objectives sought with the introduction of MTEFsinclude:
● Improved macroeconomic balance, includingfiscal discipline, through good estimates of theavailable resource envelope, which are then
used to make budgets fit squarely within theenvelope.
● Improved inter- and intra-sectoral resourceallocation by effectively prioritizing allexpenditures (on the basis of the government’ssocio economic program) and dedicatingresources only to the most important ones.
● More efficient and effective public expenditures,essentially by allowing line ministries greaterflexibility in managing their budgets in thecontext of hard budget constraints and agreedupon policies and programs.
MTEFs alone cannot deliver improved publicexpenditure management in countries in whichother key aspects of budget management, such asbudget execution and reporting, remain weak.
Sources: Le Houerou & Taliercio (2002), Holmes & Evans(2003).
Box 3.3: A Medium Term Expenditure Framework (MTEF)
26. The Ministry of Transport submitted a Vietnam Transport Strategy up to 2020 to the Prime Minister inDecember 2002. This called for investment of about VND 789,977 billion (US$ 50 billion) during 2002-2010.
27. The Strategic Review of Transport Donors’ Support to Vietnam’s 2006-2010 SEDP, released in early 2005,estimated total investment requirements of VND 361,439 billion (US$ 23 billion) during 2006-2010,

remain at its current level, the percentageof national roads in good condition wouldfall to just 10% of the total network. Thesituation was even worse for provincialroads. In its funding request for 2003 to2005, the Vietnam Roads Agency was ableto secure less than half of the financerequired to cover all maintenance needs onnational highways.
Poor coordination between capital andmaintenance expenditure is a common featureof countries that operate systems of dualbudgeting. A recent review of developingcountry experience with dual budgeting seesthe introduction of medium term expenditureframeworks as a first step in addressing theissue, since a medium term perspective helpsto highlight the capital savings presented byadequate maintenance.28 Nevertheless, acomplete response to the issue requiresintegration of budget preparation forrecurrent and capital spending, includingstaffing integration, unified budgetdocumentation, and unified accounting andreporting systems.
3.2.3 Spatial Development Goals andInvestment Planning
There is a tension between the Government'sstated spatial development objectives and thepractice of its investments process. TheOrientation Master Plan for UrbanDevelopment to 2020, prepared by the Ministryof Construction, seeks to limit growth of themajor cities, and spread urban developmentmore widely. Specific objectives include:● Establish population targets for cities and
district towns in an urban growth hierarchy;● Limit growth of Hanoi and Ho Chi Minh
City and reduce population densities in thecenter of the primary cities;
● Create satellite cities for Hanoi and Ho ChiMinh City;
● Encourage growth at the urban fringe;● Promote the development of medium and
small cities and district towns;● Create new urban areas in the more remote
provinces and in proximity to major cities as ameans of controlling growth of the larger cities;
● Preserve agricultural land and plan ruraldevelopment.
50
28. Sarraf (2005).

In practice, investment planning tends tofocus on specific growth centers in the north,south and center of the country. The idea is thathigher returns to infrastructure investments canbe obtained in areas of concentrated populationwhere there are stronger returns to scale andcomplementarities between different sorts ofinvestments. At the same time, investments aremade in rural areas to address povertyobjectives. The overall spatial balance ofdevelopment appears to be broadlyappropriate. While inter-provincial inequalityhas increased (as observed in section 1.3.4), theincrease has been quite small, and this is beingachieved at the same time as rapid growth isenjoyed at the aggregate level.
Large migration from rural areas to themajor cities has made a significant contributorto the success (in terms of generating growthwithout large increases in inter-provincialinequality) of the current investment strategy.The presence of large numbers of unregisteredmigrants in the major cities, and theurbanization forecasts of section 1.3.2 suggestthat high levels of migration to Hanoi and HoChi Minh City are likely to continue.International experience suggests that theforces driving such migration are very difficultto counter. Overall, the spatial objectives ofdeveloping mid-sized cities and containing thegrowth of major cities are not being achievedin practice.
Despite the difficulty of implementing theOrientation Master Plan, the objectives shouldnot be lightly discarded. While mega-cities mayoffer economies of scale, they may also sufferconsiderable problems of congestion, pollution,and difficulties in urban planning andinfrastructure provision. To the extent that theseproblems become significant, the objective ofmaximizing economic growth and the objectiveof more widely-spread urban development maybe consistent.
Determining whether it makes sense topromote greater urban growth of mid-sizedcities would require much better analysis of theeconomic rates of return to potential projects inthe major cities and the mid-sized cities, takingaccount of a range of externalities such ascongestion and pollution, as well as taking intoaccount the transaction costs of administeringlarge cities. If the Government were to pursuethe Orientation Master Plan objectives moreclosely, a first step would require that sectoralinvestment plans be adapted to meet the spatialpriorities. But successful regional developmentwould also require a concerted developmenteffort going beyond mere investment inregional cities. Examples of such policies mightinclude expanding opportunities for stateemployment in the lesser cities, or releasingmore private land to keep the price of housingand business development lower in regionalcities. Overall, considerable analysis is requiredto determine whether the Orientation MasterPlan's goals are appropriate, and if they are,how best to shape the existing strong forces formigration from rural areas to Ho Chi Minh Cityand Hanoi.
3.3 Allocation of ResponsibilitiesAcross Tiers of Government
Countries around the world struggle to findthe appropriate allocation of powers to levelsof government. There is a tension between
51
Traffic Congestion

devolving power to ensure decisions areresponsive to local needs, and centralizingpower to ensure that decisions arecoordinated, that externalities (very broadlydefined to include matters such as fiscalconsequences of decisions, issues of nationalconcern such as poverty, environmentaleffects, etc) are adequately addressed and thatthe level of government has adequateresources (fiscal and technical capacity).Vietnam bears witness to this tension, as itdeals with problems inherited from itstraditional principle of "dual subordination"and newer problems arising fromdecentralization.29
Vietnam has four levels of government, with64 provinces, 643 districts, and 10,602communes, each with their own Assembly (orPeople's Councils at sub-national level) andexecutive (People's Committees at sub-nationallevel). To ensure consistency of decision-making, administrative units of the executiveoperate under a system of "dualsubordination": they report to their own level'sPeople's Council, and are also accountable tothe next higher level of government. Thedifficulty with this system is that it can lead toinefficiency in public administration. Forexample, up to 14 official approvals arerequired before investment can occur, withdecisions sought at multiple levels ofgovernment. Incompatible horizontal andvertical instructions can also leave authoritiesto decide for themselves which instructions totreat as binding, or leave agencies to competefor authority where responsibilities are unclear(see Box 3.4).
A possible direction for evolution of thesystem would be for higher levels ofgovernment to prescribe guidelines orcriteria for decisions made by lower levelgovernments, and within those criteria lower
level governments could make decisionswithout referring back to higher levelgovernments. This could help to limit thetendency towards excessive bureaucracy andprovide greater certainty about what hasbeen decided.
The tradition of centralized stateplanning underwent a major reform whenthe 1996 State Budget Law inaugurated aprocess of decentralization. As a result sub-national governments' shares of totalexpenditures increased from 26% in 1992 to43% in 1998 and 48% in 2002. The 2002 StateBudget Law gave the provinces broadpowers to organize expenditure assignmentsfor the districts and communes within theirborders. It also strengthened the prohibitionof unfunded expenditure mandates fromhigher to lower levels of government.Services are assigned to levels ofgovernment broadly consistent with thegeographic area of benefits. Sub-nationalspending is funded through a combinationof locally raised revenue and transfers fromthe central budget.
Decentralization brings a range of potentialcoordination problems, including:● Excessively thinly spread investment, as
each commune and district places pressureon Provincial People's Committees. Toomany small projects at once may be a factorbehind the delayed implementation ofinfrastructure investment, over-commitment of budget and buildup ofarrears to contractors.
● Unnecessary duplication of facilities. Forexample, almost every province has at leastone industrial zone in order to attract FDI,even though foreign investors prefer toconcentrate investment in clusters close tothe main metropolitan areas. There is asimilar risk with decisions to construct
52
29. The following discussion draws on the PER-IFA (2005).

ports. In 2005 a start was made inaddressing this problem by preparingregional plans for the greater metropolitanareas of Hanoi, Ho Chi Minh City andDanang, but the initiative is limited tospatial planning.
● Managing externalities: an upstreammunicipality might not be especiallyconcerned about treating its waste water; adownstream municipality might wishotherwise.
● "Vertical fiscal imbalance": there can be amismatch between the responsibilities ofsub-national governments to spend moneyand the financial resources available to
them. For example, most district andcommune governments lack the capitalfunds for their needs for rehabilitation,
53
The dilution of responsibility in the Vietnamesepublic financial management system isexemplified by arrangements for maintenance ofnational and provincial roads. The Vietnam RoadsAuthority (VRA) was established in 1993, and isformally responsible for the management andoversight of the whole roads sector, and forimplementation of work on national roads. Inpractice, however, it is unable to effectively fulfillthis role, for a number of reasons, relatedprimarily to how financing responsibilities areallocated in the system.
The Ministry of Transport receives financingfrom the state budget, as well as frominternational financial institutions, and dividesthis amount between the Vietnam Roads Authority(VRA) and Provincial People’s Committees (PPCs),based on the size-classification of the repairs thatthey undertake. The VRA takes responsibility forpart of the national roads network, while the PPCsare responsible for the remainder of nationalroads, and their own provincial roads. The VRAdelegates work on the national networks toProject Management Units (PMUs) and RegionalRoads Management Units (RRMUs), while thePPCs delegate work to Provincial Departments ofTransport (PDOTs). For large repairs to thenational road network, between a half and a thirdof work is managed by the VRA’s PMUs. Theremainder is managed by the PDOTs. For routinemaintenance and medium repairs on the nationalroad networks, most work is managed by theRRMUs, while the remainder is managed again by
the PDOTs. The result of these overlapping jurisdictions
complicates the assignment of responsibility andmonitoring of results. While the VRA is formallyresponsible for managing the national roadsnetwork, it relies on provincial roads managementunits for the greater portion of work undertakenon the network. The VRA has limited control overthe provincial units and is limited in its capacityto ensure that funds allocated for national roadmaintenance are actually spent as planned,despite the fact that the purpose of the funds isspecified in detail, and distinguishes betweendifferent kinds of maintenance. This arisesbecause parts of these funds are transferred viaprovincial finance departments, which can delaydisbursement. The VRAs have no effective meansof monitoring work carried out.
While the VRA is also responsible for planningand the setting of technical standards for allroads, it has very little oversight of roads at sub-national level, other than advising on technicalstandards and administrative matters. This isbecause the PDOTs retain direct managerialresponsibility for provincial roads, and fundsallocated for these roads are transferred toprovinces, without direct involvement of the VRA– be it to inspect or approve plans. As a result, itis not at all clear to what extent allocated fundsare actually used for road maintenance orconstruction.
Sources: Louis Berger (2003);
Box 3.4: Weaknesses in the Coordination of Road Maintenance
Road maintenance - essential for preserving capitalinvestment
replacement and new construction ofinfrastructure.30
In some sectors, the potential problems ofdecentralization are avoided by the relativelycrude method of retaining central control.Since 2001, the PIP classifies projects into A, Band C level investments. A-level investmentprojects-which include the largest and moststrategic infrastructure investments (forinstance major ports, or main roads)-rest withcentral government, requiring authorizationof the Prime Minister. Such investments areshielded from the complications of provincialservice delivery. Similarly the national levelstate-owned enterprises in the energy andtelecommunications sectors are responsiblefor their own financing and planningprocesses. They are not subject to thelimitations of either dual subordination ordual budgeting. Nor is responsibility for theirdelivery diffused across different levels ofgovernment. Some rural water projects havebeen included in a National Target Program,which is implemented independently ofprovincial planning.
Remaining infrastructure projects face therisks posed by decentralized decision-making,the potential delays and conflicts arising fromthe principle of dual subordination, and thefinancing difficulties of dual budgeting. Theimpact of these risks and problems is feltprincipally in transport projects, and smallerscale infrastructure services in urban areas. Theimpact of the coordination and planningweaknesses in the transport sector has alreadybeen illustrated with the example of debtspassed on to the construction and bankingindustries.
Rather than simply retaining central controlfor some projects, and subjecting other projectsto the risks of decentralized decision-making, it
would be preferable to address squarely theproblems of coordination in a decentralizedenvironment. Currently, the bulk of the fundsthat can be used by sub-national governmentsfor investment in infrastructure are transferredfrom central government in the form ofunconditional grants. The central governmentshould develop financial tools through thepublic finance management system to alignprovincial investment with national priorities.For example, conditional or matching grantfacilities, or ring-fenced minimum expenditurerequirements could be used to channelresources to particular infrastructure priorities.
3.4 Urban Planning
The difficulties in urban infrastructure illustratemany of the problems of vertical and horizontalcoordination, as well as highlighting that thebasic types of plans produced are inappropriatefor an economy in which development occursincreasingly in response to market requirementsrather than central planning decrees.
Spatial planning presents the greatestproblem for urban infrastructure, both in theway it is conducted and in how it relates tofinancing and sectoral plans. Most plans areprepared by the National Institute of Urban andRural Planning (NIURP) or, in the south, by theInstitution of Planning and Architecture of theNational Corporation of General ConstructionConsultancy (NAGECCO). Both institutes aresubsidiaries of the Ministry of Construction.Only the three largest cities have their ownplanning institutes.
Spatial plans are prepared in four levels ofdetail: orientation plans (national policy),regional plans, general plans (province or city),and detailed area plans (ward, industrial zone,or project). Until 2005, no consideration wasgiven to regional planning: there was no
54
30. See PER-IFA p.84
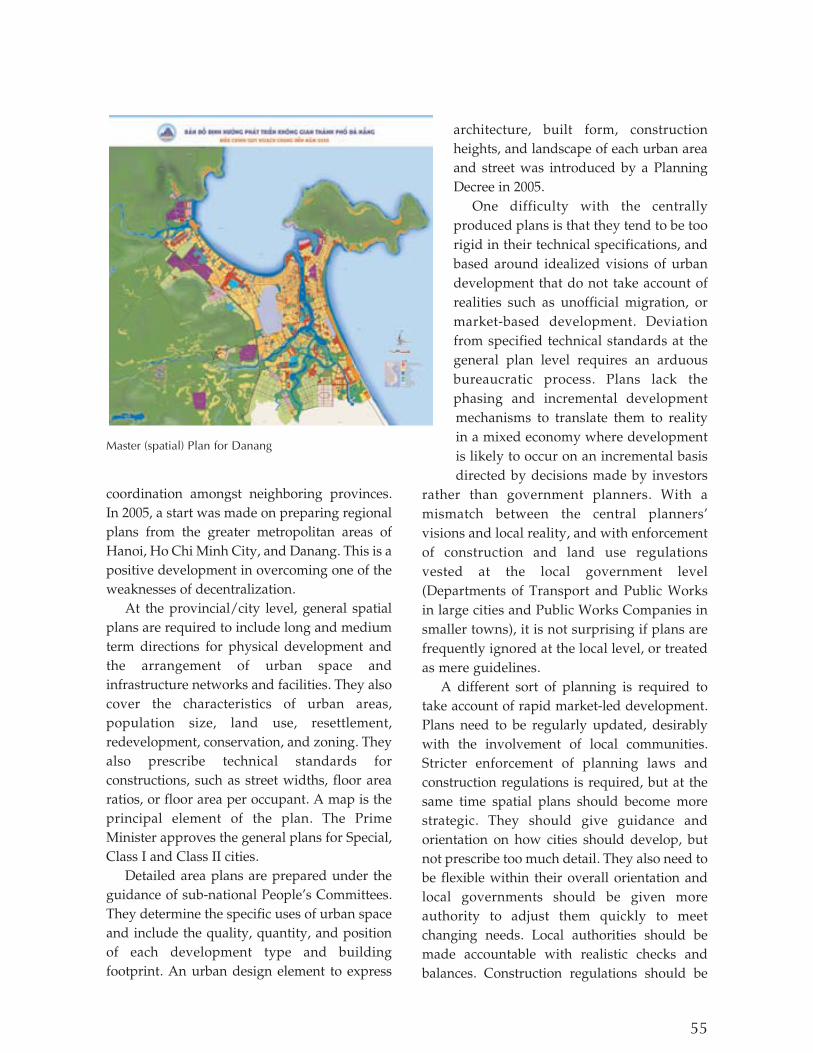
coordination amongst neighboring provinces.In 2005, a start was made on preparing regionalplans from the greater metropolitan areas ofHanoi, Ho Chi Minh City, and Danang. This is apositive development in overcoming one of theweaknesses of decentralization.
At the provincial/city level, general spatialplans are required to include long and mediumterm directions for physical development andthe arrangement of urban space andinfrastructure networks and facilities. They alsocover the characteristics of urban areas,population size, land use, resettlement,redevelopment, conservation, and zoning. Theyalso prescribe technical standards forconstructions, such as street widths, floor arearatios, or floor area per occupant. A map is theprincipal element of the plan. The PrimeMinister approves the general plans for Special,Class I and Class II cities.
Detailed area plans are prepared under theguidance of sub-national People's Committees.They determine the specific uses of urban spaceand include the quality, quantity, and positionof each development type and buildingfootprint. An urban design element to express
architecture, built form, constructionheights, and landscape of each urban areaand street was introduced by a PlanningDecree in 2005.
One difficulty with the centrallyproduced plans is that they tend to be toorigid in their technical specifications, andbased around idealized visions of urbandevelopment that do not take account ofrealities such as unofficial migration, ormarket-based development. Deviationfrom specified technical standards at thegeneral plan level requires an arduousbureaucratic process. Plans lack thephasing and incremental developmentmechanisms to translate them to realityin a mixed economy where developmentis likely to occur on an incremental basisdirected by decisions made by investors
rather than government planners. With amismatch between the central planners'visions and local reality, and with enforcementof construction and land use regulationsvested at the local government level(Departments of Transport and Public Worksin large cities and Public Works Companies insmaller towns), it is not surprising if plans arefrequently ignored at the local level, or treatedas mere guidelines.
A different sort of planning is required totake account of rapid market-led development.Plans need to be regularly updated, desirablywith the involvement of local communities.Stricter enforcement of planning laws andconstruction regulations is required, but at thesame time spatial plans should become morestrategic. They should give guidance andorientation on how cities should develop, butnot prescribe too much detail. They also need tobe flexible within their overall orientation andlocal governments should be given moreauthority to adjust them quickly to meetchanging needs. Local authorities should bemade accountable with realistic checks andbalances. Construction regulations should be
55
Master (spatial) Plan for Danang

56
based on performance standards rather thanstrict technical norms. For example, road widthsshould relate to estimated traffic projectionsrather than pre-defined dimensions;wastewater should be treated to a level relevantto the river, or sea, into which the effluent willbe discharged; water consumption levels andquality should relate to what people are likelyto be willing to pay.
Much of the vertical coordination problemwould be resolved with more flexible standardsand planning processes that permitted greaterflexibility for local authorities. Part of theproblem is also that plans have been centrallyprepared, when greater local participation isrequired. The new Construction Law (2004),with new (2005) Decrees on Planning and onConstruction Investment Project Management,has introduced greater decentralization ofapprovals for plans, and public consultation.These are positive steps, but without greatercapacity at the local level the plans will continueto be developed by the central planninginstitutes. There is also an issue concerning howlocal governments should be held accountablefor compliance with essential elements ofcentrally developed plans.
The introduction of public consultation is aparticularly important development in terms ofholding local governments accountable to theirpopulations. Idealized top-down plans fail totake adequate account of the preferences oflocal stakeholders. Such idealized plans canresult in the wholesale clearance ofcommunities and housing to permitredevelopment to a higher and moretechnically mandated standard. This oftenresults in the destruction of tightly knitcommunities and housing with their owncarefully developed economic and socialsupport systems that have evolved over manyyears. Experience from other countries,including many in Western Europe and theUnited States, indicates that demolishing suchneighborhoods, often with the best intentions,
results in irreparable damage to the socialfabric and well-being of the residents. Housingprices in the newly created development willoften be well beyond the affordability of thosedisplaced. Experience in many other countriessuch as Indonesia and Brazil demonstrates thatit is usually better on cost effectiveness andsocial grounds to adopt an incrementalapproach developed with the activeparticipation of the beneficiaries.
Problems of horizontal coordinationbetween different government ministries occurwith a mismatch between budgets and spatialplans, and mismatches between sectoral andspatial plans. Spatial plans are generallyprepared independently of financingconsiderations. Lack of budgets to implementplans can provide further grounds forimplementation failure at the local level. Lack oftimely financing means public infrastructure(water supply, solid waste management,drainage, and sewers) often has to follow afterdevelopment has occurred. Rapid, unplannedgrowth of the peri-urban fringes of large cities isleading to serious environmental degradationand significantly higher costs for infrastructurethan would be the case if the infrastructure werebuilt at an earlier stage. (There are, however,some well-planned peri-urban areas, such as theTu Lien development in Hanoi and Phu MyHung in Ho Chi Minh City.)
Sectoral master plans for the same locationare also developed independently, and may notbe linked in phasing, finance, orimplementation. For example the drainageincluded as part of a transport master plan maynot be coordinated with the drainage andsewerage master plan. In some cases they mayeven propose conflicting strategies.
3.5 Enviromental and Social Policies
Infrastructure projects can have adverseenvironmental and social effects that conflictwith the objectives of sustainable growth and
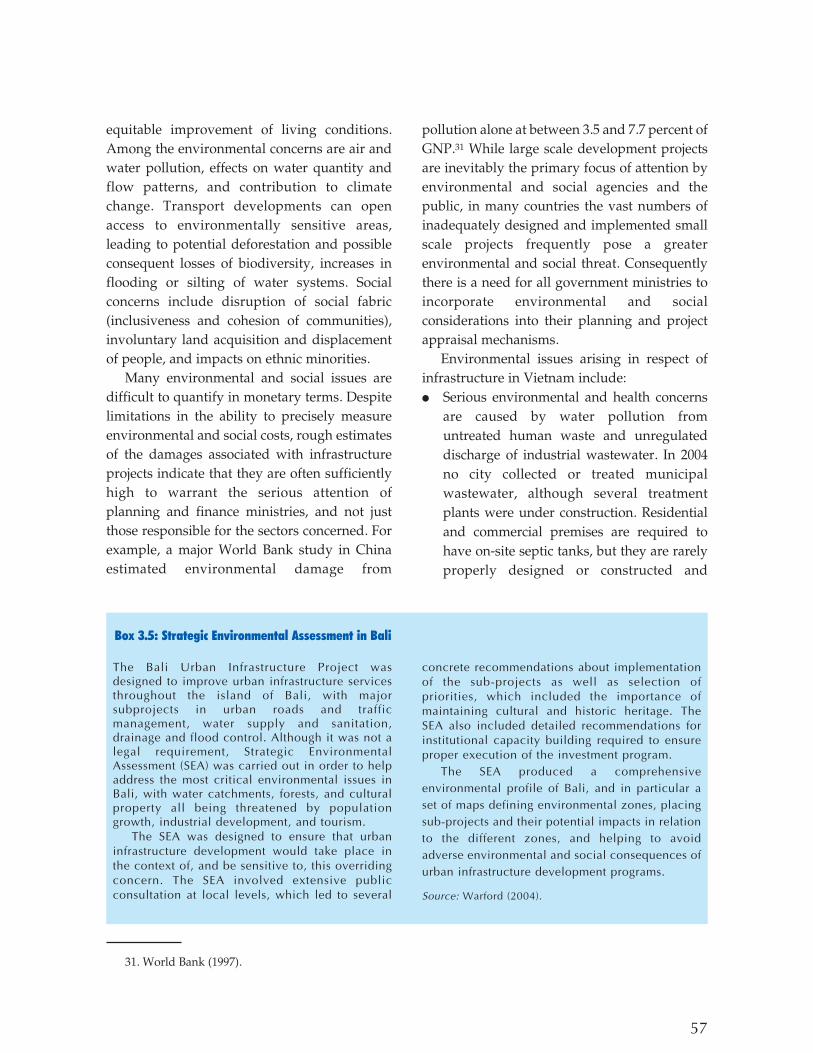
equitable improvement of living conditions.Among the environmental concerns are air andwater pollution, effects on water quantity andflow patterns, and contribution to climatechange. Transport developments can openaccess to environmentally sensitive areas,leading to potential deforestation and possibleconsequent losses of biodiversity, increases inflooding or silting of water systems. Socialconcerns include disruption of social fabric(inclusiveness and cohesion of communities),involuntary land acquisition and displacementof people, and impacts on ethnic minorities.
Many environmental and social issues aredifficult to quantify in monetary terms. Despitelimitations in the ability to precisely measureenvironmental and social costs, rough estimatesof the damages associated with infrastructureprojects indicate that they are often sufficientlyhigh to warrant the serious attention ofplanning and finance ministries, and not justthose responsible for the sectors concerned. Forexample, a major World Bank study in Chinaestimated environmental damage from
pollution alone at between 3.5 and 7.7 percent ofGNP.31 While large scale development projectsare inevitably the primary focus of attention byenvironmental and social agencies and thepublic, in many countries the vast numbers ofinadequately designed and implemented smallscale projects frequently pose a greaterenvironmental and social threat. Consequentlythere is a need for all government ministries toincorporate environmental and socialconsiderations into their planning and projectappraisal mechanisms.
Environmental issues arising in respect ofinfrastructure in Vietnam include:● Serious environmental and health concerns
are caused by water pollution fromuntreated human waste and unregulateddischarge of industrial wastewater. In 2004no city collected or treated municipalwastewater, although several treatmentplants were under construction. Residentialand commercial premises are required tohave on-site septic tanks, but they are rarelyproperly designed or constructed and
57
31. World Bank (1997).
The Bali Urban Infrastructure Project wasdesigned to improve urban infrastructure servicesthroughout the island of Bali, with majorsubprojects in urban roads and trafficmanagement, water supply and sanitation,drainage and flood control. Although it was not alegal requirement, Strategic EnvironmentalAssessment (SEA) was carried out in order to helpaddress the most critical environmental issues inBali, with water catchments, forests, and culturalproperty all being threatened by populationgrowth, industrial development, and tourism.
The SEA was designed to ensure that urbaninfrastructure development would take place inthe context of, and be sensitive to, this overridingconcern. The SEA involved extensive publicconsultation at local levels, which led to several
concrete recommendations about implementationof the sub-projects as well as selection ofpriorities, which included the importance ofmaintaining cultural and historic heritage. TheSEA also included detailed recommendations forinstitutional capacity building required to ensureproper execution of the investment program.
The SEA produced a comprehensiveenvironmental profile of Bali, and in particular aset of maps defining environmental zones, placingsub-projects and their potential impacts in relationto the different zones, and helping to avoidadverse environmental and social consequences ofurban infrastructure development programs.
Source: Warford (2004).
Box 3.5: Strategic Environmental Assessment in Bali

effluent frequently leaks out, contaminatingthe groundwater table. Due to lack ofenforcement of regulation, many newhousing constructions in Ho Chi Minh Cityhave direct contributions to the city drainagesystem without the obligatory septic tank.
● Only 17 out of 91 solid waste disposal dumpsare properly designed with leachate collectionand treatment facilities. Fifty have beenofficially declared environmental hazardsthat must be closed as soon as possible.
● In major urban centers, transport is asignificant contributor to air pollution -particulates (PM10 and PM2.5), ozoneformation and carbon monoxide. Oldmotorcycles and diesel trucks are the biggestpolluters. Motorcycle emissions are entirelyuncontrolled.
● The Government's attempts to smooth theprice of petroleum products have effectively
resulted in a net subsidy for fuel, withimplications for the level of emissions fromthe transport sector.
● The siting of infrastructure investments, suchas new roads or power plants, can have
58
Vietnam’s Land Law of 2003 requires compensation tobe paid for land compulsorily acquired by thegovernment. The Vietnam Development Report 2005contained a discussion of Vietnam’s compensationpolicies, concluding that they are largely inaccordance with international practice, but in practiceless than full compensation tends to be provided forthe dislocation suffered.
While social policy objectives suggest thatVietnam’s compensation regime could be moregenerous, infrastructure development objectiveswould seek to contain resettlement costs. Aparticularly prominent cost arises from the high priceof land. For example, a 10 km road proposed as partof a Hanoi Urban Transport Development projectwould resettle about 1100 households. The cost ofroad construction is estimated at about US$ 60million, while the resettlement costs are estimated tobe in the range of US$ 170-210 million. In the case ofa recently-completed, JBIC-financed flyover in Hanoi,resettlement accounted for over 80% of project costs.Clearly resettlement costs can add significantly to thetotal cost of developing urban infrastructure.
High land prices are certainly not a reason toavoid paying proper compensation to people
who suffer from compulsory resettlement. But inVietnam high prices are partly a product of landpolicies which serve to push up pricesartificially:● In Hanoi in particular, the Government holds a
large proportion of the land, so that the supply ofland tradable in private markets is very limited.Limited supply combined with high demand servesto push up market prices.
● Throughout the country, there are high transactioncosts in legally registering land, so that manypeople occupying land do not have full legal titleto the land. The Vietnam Development Report2006 contains a useful discussion of theconsequences. Again, the scarcity of land with fulltitle serves to drive up the price of such land, andthis price then becomes the reference point forpeople seeking resettlement compensation.
Releasing government land and reforming landregistration arrangements would improve theefficiency of land markets, raise revenue for thegovernment, and have the happy side-effect ofreducing resettlement costs for infrastructuredevelopment.
Box 3.6: Resettlement and Land Markets
Waste water interceptor tunnel being constructed in HoChi Minh City

59
significant local environmental impacts. Inprinciple these should be addressed throughenvironmental impact assessments andfollow-up mitigation activities required underexisting legislation. In practice the quality ofimpact assessments is often inadequate.
● The choice of fuel mix in the energy sectorhas important implications for greenhousegas emissions and for other forms of airpollution. At present this choice is distortedby under-pricing of coal, relative to itseconomic value. Addressing these issues will require a mix of
specific investments, such as waste watertreatment plants or improved public transportsystems, introduction of new environmentalstandards (eg emission control for motorcycles),and policy changes that ensure higher priorityis given to environmental issues.
On the policy side, an important recentdevelopment is the passage in November 2005of a revised Law on Environmental Protection,to take effect in July 2006. The majordevelopments under the revised law include:● The introduction of strategic environmental
assessment (SEA), a process forsystematically mainstreaming environmentinto the appropriate levels of policy making.Strategic Environmental Assessments can beused, for example, when preparing spatialplans for land use in regions or river basins.Box 3.5 discusses an example of SEA fromBali, Indonesia.
● Greater detail about the types of projectsthat require environmental impactassessments, and how those assessmentsshould be conducted.
● Introduction of a licence system for wasteproducers.
● A community 'right to know', under whichenvironmental protection authorities mustreport to their communities the names ofestablishments causing pollution.
These are all very positive developments. Achallenge in coming years will be to ensureadequate resources to environmental agencies,and enforcement of the new regulations.
Vietnam's large infrastructure investmentprogram inevitably involves considerablerequirements for land acquisition andresettlement. For example, an urbanredevelopment program in Danang involvedthe resettlement of one in five households overa seven year period. In such circumstances,there is a risk that the costs of social dislocationcould severely undermine the benefits newinfrastructure. To mitigate such risks,international practice is to ensure that adequatecompensation is provided for any loss of land,other assets, and income-earning possibilities.
The Vietnam Development Report 2005contained a discussion of Vietnam'scompensation policies, noting that "it is by nowaccepted that compensation should beprovided for the loss of land and propertiesattached to the land. Assistance measures forstabilizing the living standards of affectedpopulations have been introduced, and thegeneral principle that resettlement sites shouldoffer conditions which are equal or better thanthe previous ones has been acknowledged.Many of the gaps between internationalprinciples and Vietnamese policiesdisappeared, on paper at least, with the 2003Land Law."
Difficulties remain in the provision ofcompensation for those without formal legaltitle and compensation for loss of business.Another gap in the current legal framework isconsultation with resettled populations andactive steps to help them integrate in their newhost communities. While provincialgovernments can undertake these additionalsteps if they wish, they are not mandated to doso. Independent monitoring of theimplementation of resettlement plans is not partof Vietnamese policies either, although it tends
60
to be required on donor-funded projects. Inaddition to weaknesses in the degree to whichcompensation is provided for loss of well-being, asdiscussed in Box 3.6 the interaction of landacquisition policies with weak land markets posespractical problems for infrastructure development.
To be effectively implemented, environmentaland social objectives need to be incorporated intothe "mainstream" activities of infrastructureministries, and their planning and financingoverseers. For example, environmental objectivessuch as avoidance of water pollution should be partof the objectives of agencies responsible for waterand sanitation. And reliance should not be placedsolely on project level appraisals. For example,EVN is planning an expansion of its hydro-electricgeneration capacities. Individually, theenvironmental and social impact of the plannedprojects may lead to only marginal impacts, but theprogram also needs to be examined at the countrylevel during the planning stage, to ensure that thecumulative impacts of the individual projects areacceptable.
3.6 Recommendations
In the long-term, it seems likely that different tiersof government will evolve exclusive areas ofresponsibility (to avoid costly revisions of decision-making), while some domains will remain shared,providing for central government oversight. Muchof the necessary reform should occur in response todevelopments, and so requires a framework ofconstant monitoring and reaction to problems. Thismonitoring and reaction could take place withinthe Prime Minister's department. There is apressing need to better integrate financingdecisions into the investment approvals process,and a starting point for this would be agovernment-led review. The most urgent area forsystematic review is coordination of planningprocesses for urban areas. An ideal response islikely to take some time to implement, and so therecommendations are placed in a medium-termsetting. Nevertheless, the urban problems are of asignificance demanding that solutions begin to bedeveloped immediately.
The following actions are recommended:
Establish a system of evaluation of investment projects to measure the rates of returnachieved.
Improve the quality of feasibility studies, addressing all areas identified in Box 3.1
Develop a results framework for each sector, setting out sectoral goals, strategies forachieving them, and performance indicators for measuring progress towards the goals.Ensure that all proposed projects fit within this framework, and provide for monitoring ofprojects' contribution toward the goals.
Develop a governmental process for integrating budgeting decisions with investmentplanning, ensuring that projects are allocated budget funding in accordance with theirpriority. The process should not allocate budget funding to projects capable of obtainingfinance elsewhere.
Develop budgeting processes that ensure an appropriate balance between spending onmaintenance and on new investment. Ideally, rates of return from maintenance spendingshould be estimated.
Review the costs and benefits of promoting growth of mid-sized cities to determine whetherrevised policies are needed to support the objectives of the Orientation Master Plan for Urban
(3.1)
(3.2)
(3.3)
(3.4)
(3.5)
(3.6)
(M)
(M)
(S)
(S)
(S)
(S)

61
Development to 2020.Develop financial tools for aligning provincial priorities with regional or national priorities.Examples include conditional or matching grant facilities, and ring-fenced minimumexpenditure requirements.
Monitor the effects of dual subordination. Where the principle results in excessively slowdecision-making or conflicts between decisions, consideration should be given to eitherrevised processes to improve coordination across levels of government, or else exclusivepowers being granted to one level. Consideration should be given to exclusive domains ofdecision-making to lower governments in areas in which local governments are rarelyoverruled.
Develop urban planning institutions to better deal with a mixed economy. The planningsystem should move toward performance standards, decentralization, and stakeholderparticipation. A strategy to deal with this issue should promote:● Public benefit analysis - the urban planning and approval process must be able to
judge public benefits and negative externalities in proposed developments. ● Best Practices and Performance Standards - the adherence to rigid single purpose
technical master planning specifications will need to be relaxed and replaced withperformance standards, particularly as more development comes from the non-statesector and must be made to fit and benefit local situations rather than prescribednational standards. Performance standards (transport capacity, waste management,open space, height limits, setbacks, mixed use compatibility, noise, etc) should beintroduced to the planning system as minimums that need to be met, but that allowflexibility in meeting them. Decentralized planning with more local control,transparency, and stakeholder involvement should replace adherence to formulae andspecific physical design standards.
● Integrated Planning - cooperation among the elements of the fragmented planningprocess (including financing and budgeting for the state sector) is necessary torationalize urban planning and management.
● Financial Reality - plans at all levels are made without apparent reference tofinancial reality or cost. For urban planning to be useful, financing and budgeting forstate sector responsibilities and projects must be part of the process.
● Decentralization of Planning - planning will need to be decentralized to be able toaddress local conditions and greater transparency and public participation. A concertedprogram to develop local planning skills and facilitate integration will be necessary.Planners must establish enough credibility that their analysis will be recognized andgiven credence by ultimate decision-makers.
Ensure that environmental and social considerations are considered in the objectives ofagencies responsible for investment planning, that they are adequately addressed in projectfeasibility studies, and that overall plans for series of projects are similarly subject toassessment of environmental and social impacts.
Ensure the National Environment Agency has the resources and the mandate to set,monitor, and enforce appropriate environmental standards.
(3.7)
(3.8)
(3.9)
(3.10)
(3.11)
(S)
(M)
(M)
(M)
(S)

62

63
ore efficiently operated infrastructureservices achieve greater output for giveninputs. Operational improvements can
thus directly lead to cheaper services, helping toaddress poverty objectives and providing astimulus to growth. Improvements inoperational efficiency are also part of thesolution to Vietnam's infrastructure financingdifficulties. For example, reductions in water orelectricity technical losses can delay the need forsystem expansion and so generate capitalsavings.
This chapter considers the various tools thatare available to improve the operationalperformance of infrastructure service providers.In general, the strongest incentives are providedby active competition between commerciallyfocused service providers. In general, acommercial focus (ie profit motivation) is a pre-requisite for other tools that provide additionalincentives to improve performance.Unfortunately, for most infrastructure servicesactive competition between providers is notpossible. In these cases, periodic competition
between private operators for the right toprovide a service can provide an alternativemeans of identifying efficient operators. Byproviding increased profits in return forperformance improvements, regulation can alsoprovide incentives for improvement.
Finally, corruption can significantlyundermine the performance of infrastructureservice providers. Happily, many of the othermeasures that can be taken to improveefficiency will reduce the opportunities forcorruption. But these measures do need to besupplemented by explicit anti-corruptionmeasures, such as regular physical and financialauditing and a system for prosecutingcorruption when it occurs.
4.1 Current Effciency Levels
Overall, Vietnam's infrastructure serviceproviders are reasonably efficient for thecountry's level of development, but of coursethere is room for improvement.● Figure 4.1 indicates that Ho Chi Minh City is
4. Efficiency
Issues
(i) Infrastructure service providers in Vietnam are reasonably efficient, given Vietnam’s level ofdevelopment, but of course improvements can always be made. More efficient infrastructureservices would lower costs to consumers and businesses, and potentially reduce the amount ofinfrastructure financing required.
(ii) Tools for improving the efficiency of Vietnam’s infrastructure services include public sectorreform, competition, private participation, and regulation. There is much the Governmentcould do in all of these areas.
(iii) Corruption can also have an impact on efficiency, and measures must be taken to combat itwhere possible.
M
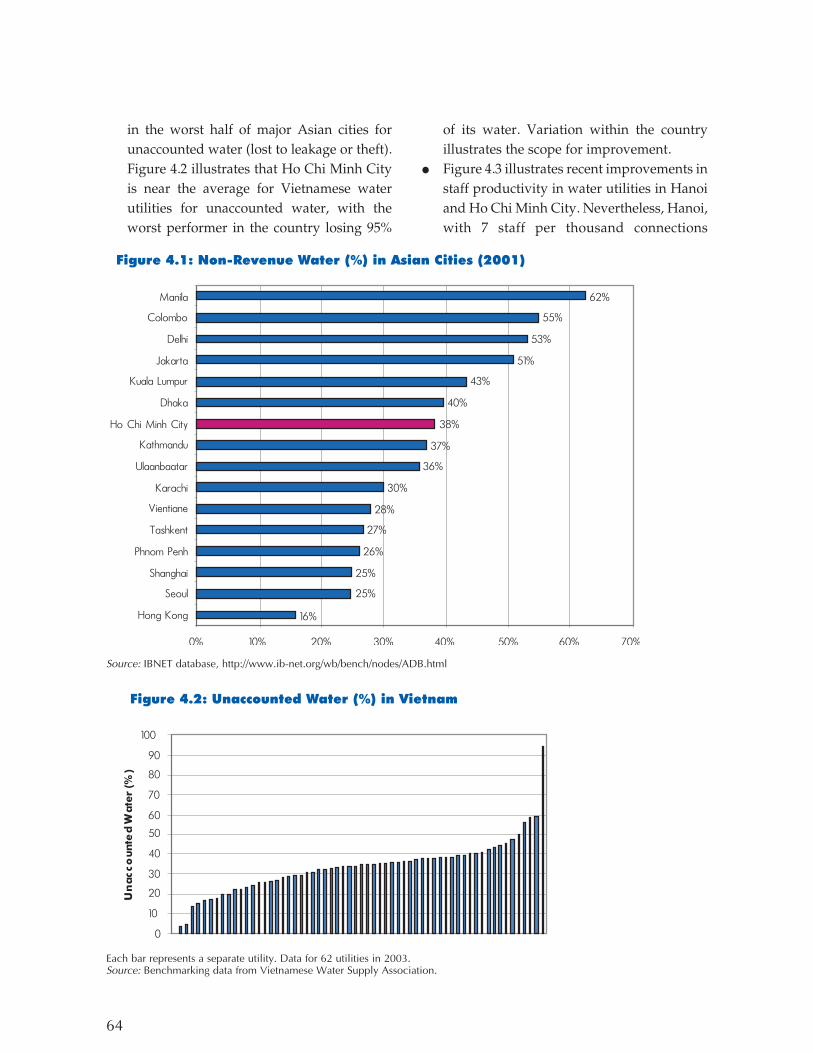
in the worst half of major Asian cities forunaccounted water (lost to leakage or theft).Figure 4.2 illustrates that Ho Chi Minh Cityis near the average for Vietnamese waterutilities for unaccounted water, with theworst performer in the country losing 95%
of its water. Variation within the countryillustrates the scope for improvement.
● Figure 4.3 illustrates recent improvements instaff productivity in water utilities in Hanoiand Ho Chi Minh City. Nevertheless, Hanoi,with 7 staff per thousand connections
64
Source: IBNET database, http://www.ib-net.org/wb/bench/nodes/ADB.html
Each bar represents a separate utility. Data for 62 utilities in 2003.Source: Benchmarking data from Vietnamese Water Supply Association.

performs worse than the average for thesample regional cities (6 staff). Ho Chi MinhCity's utility performs better with 3.5 staffper thousand connections.
● Figure 4.4 highlights that the Hanoi and HoChi Minh City water utilities are among the
nation's best performers in staffproductivity. The national average is 11 staffper 1000 connections, and the worst quarterof firms have over 15 staff per 1000connections.
● Figure 4.5 illustrates that labor productivityin telecommunications is poor compared toproductivity in neighboring countries.
● Figure 4.6 illustrates that despite steadyreductions in losses of electricity intransmission and distribution, still performspoorly in comparison with China andThailand. To some extent this comparison isunfair. For example, China has a higherproportion of businesses receiving highvoltage supply, and so has lower distributionlosses. More recent data than is shown in thegraph puts transmission and distributionlosses in Vietnam at 12.2% in Vietnam, butthere is still room for further improvement.
65
Leak detection activities in Ho Chi Minh City
Source: ADB, JBIC, World Bank (2005).

● Figure 4.7 reports the proportion of roadexpenditure devoted to maintenance. At7.1% of total road expenditure in 2003,Vietnam has the lowest maintenanceexpenditure in the sample. See also Figure3.2 which highlights the downward trend inroad maintenance. Neglect of maintenanceis inefficient since it is likely to increaselong-term maintenance costs.
● Vietnam's trains have low operating speedsof 40 km/h for passenger trains and 22km/h for freight trains, because for lack ofmaintenance and new investment the railnetwork has deteriorated. Laborproductivity is low at 124,000 trafficunits/employee, compared with 548,000 inThailand and 610,000 in Indonesia.
● Accident statistics for Vietnam's railways
66
Each bar represents a separate utility. Data for 60 utilities in 2003.Source: Benchmarking data from Vietnamese Water Supply Association
Source: WDI (2005). Data are from 2003 for Cambodia, Laosand Vietnam; 2002 for the Philippines and Thailand; 2001 forIndonesia; and 1999 for China.
Source: WDI (2005)

67
suggest a neglected network. In 1998 therewere 41 deaths per 1,000 km of track. Thisfigure increased to 271 in 2003.Corresponding figures for Indonesia were11 in 1998 and 16 in 2003, and for Thailand:5 and 2.
● Performance appears to vary acrossVietnam's ports. Some ports are reported asachieving 15-20 moves per hour perstevedoring gang, compared, for example,with 25-30 moves in the Philippines.32 Onthe other hand, Vinalines reportsthroughput on container berths in Saigon of20-25 containers per hour and 30 containersper hour in the new port of Cai Lan.All of these measures suggest there is
room for reducing costs of infrastructureservices. This is not simply an issue forresidential consumers. Businesses useinfrastructure services as inputs. High costinputs force up the final price of their goods,reducing their international competitiveness.Reducing input costs would permit lowerprices for exports, and thus greaterinternational demand for Vietnam's exports.
Failure to reduce input costs willmean that Vietnam benefits less fromopening to international trade than itotherwise would.
4.2 Reforming InfrastructureEnterprises
Until the 1980s, around the world therewas little competition or privateparticipation in the financing oroperation of infrastructure. Attemptingto improve efficiency many countriesattempted reform within the publicsector. The international experience hasbeen that these measures offeredimprovements in commercialoperation, but that even greater
improvements have been delivered bysubsequent competition and ownershipreforms. A notable difference between thesesorts of reform is that public sector reforms areeasier to reverse, and hence less durable, thanmeasures that establish new competitors orprivate property rights. A good public sectormanager may improve performance until his orher replacement occurs, but the introduction ofcompetition provides an enduring pressure forperformance enhancement.
Internationally, one of the major problems ofstate ownership has been inadequatecommercial focus of state-owned enterprises. Acompany whose objective is profitmaximization will actively seek to keep costsdown. While the politicians and officials whomake government decisions would like to seeprofitability increased they may also seek othernon-commercial goals such as maximization ofemployment. While some non-commercialgoals are legitimate goals of public policy,mixing them together with commercial goalshides their true cost, reduces the ability to
Source: ADB, JBIC, World Bank (2005).
32. PDP Australia Pty Ltd/Meyrick and Associates (2005).

examine trade-offs, de-motivates managers, andprovides them with plausible reasons for poorfinancial performance.
In many cases non-commercial goals can beachieved at less cost through alternative means.For example, the provision of social servicesmight be best achieved through direct transfersto the poor, while leaving infrastructure firmsfree to pursue directly commercial goals. Inaddition, the weight attached to non-commercial goals may not be communicated tothe public. Most governments with a policy oftransparency and public policy debate find thatan informed public can play an important rolein improving the quality of public policies.
To encourage greater commercial focusmany governments have "corporatized" theirenterprises, applying private sector companylaw. Company law is designed to provideprivate owners with rules that allow them tomanage the enterprise effectively, makestrategic decisions about the enterprise'sdirection, and hold the enterprise managersaccountable for its performance. The same sortsof rules are desired by the government asowner. Of course, the effectiveness ofcorporatization in imparting a commercialfocus and providing necessary information toowners depends on the strength of companylaw in each country.
In Vietnam most infrastructure services areprovided by state-owned enterprises. Corporategovernance is under the Law on State-OwnedEnterprises. SOEs are not subject to the generalprinciples of private sector corporategovernance, and are not able to make their ownautonomous commercial decisions. To theextent that business strategies exist they areembodied in sectoral Master Plans prepared byline ministries, personnel policies are controlledby the Ministry of Labour, Invalids and Social
Affairs, the Ministry of Planning andInvestment approves their investment projects,and the Ministry of Finance grants funds.
Corporate governance in Vietnam isgenerally said to be weak. A new UnifiedEnterprise Law (UEL) was enacted in 2005 forimplementation from April 1, 2006. It isintended to provide common and improvedrules of corporate governance for domestic andforeign private firms. But SOEs will only besubjected to the new UEL if they are specificallyconverted into either single member limitedliability or joint stock companies. Subjectinginfrastructure SOEs to the UEL would be alogical element of any corporatization program,but there currently seems to be little impetus inthis direction.
In addition to subjecting public enterprisesto the corporate governance rules of the privatesector, there may be a need for state-ownedinfrastructure enterprises to be governed byadditional rules, to ensure a transparent debateabout the trade-off between commercial goalsand non-commercial goals. A possible set ofadditional rules to support a commercial focusand allow balancing with non-commercialobjectives might, for example: 33
● give the enterprise the objective of operatingas profitably as possible;
● set up procedures for negotiating contractsor business plans between the governmentand the enterprise as the only procedure forpoliticians or officials to direct or influencethe enterprise;
● provide for the government to pay theenterprise to pursue non-commercial goalsand prevent it from directing the enterpriseto pursue such goals without paying;
● require the appointment of directors whoare not government employees and thuscannot be directed on a day to day basis by
68
33. These suggestions are taken from Irwin, and Yamomoto (2004.

the government, and don't face the threat ofpunishment if they resist politicalinterference;
● specify the procedure the government mustuse to appoint directors;
● establish performance pay for directors(who in turn may establish it formanagers); and
● require additional public reporting ofperformance and policies not required forprivate companies, such as:- economic profitability taking into
account an estimated cost of the government'sequity in the enterprise;
- any directions given to the enterprise bythe government;
- performance in billing and collection;and
- the number of employees.Appointment of privately successful
business people as directors may help to instilla commercial culture. Listing a minority ofshares in an enterprise brings to bear the stockexchange rules for information disclosure, andalso brings close monitoring of financialperformance by the minority shareholders.Similarly, requiring the enterprise to borrowfrom commercial lenders, rather than seekgovernment financing, brings close monitoringof financial performance by those lenders.
Vietnam has not used such measures topromote commercial focus and to ensuretransparent trade-offs between commercial andnon-commercial goals. The suggestions abovecould be used as an agenda to be explored forpurposes of improving public sectorinfrastructure efficiency.
Apart from a weakness of commercial focus,the second major difficulty with publicownership encountered internationally is thatgovernments face a conflict of interest thatundermines the quality of policy. For example,as owner of a firm the government is morelikely to protect it from competition than if it
were not the owner. And as owner of amonopoly, the government can regulate theindustry in arbitrary fashion, without resistancefrom persons representing the commercialinterests of the firm.
While these conflicts of interests cannot beentirely removed their negative effects can belessened by measures such as:● Separating the ministries responsible for
being the shareholder of a state-ownedenterprise and those responsible forindustry policy. For example, in NewZealand the Ministers of State-OwnedEnterprises and Finance hold shares in NewZealand's public electricity companies,while the Ministers of Energy andCommerce have responsibility for electricitypolicy. The ministry responsible forindustry policy could also be given the taskof purchasing or subsidizing services notfully paid for by customers.
● Creating and using independent regulatorsand competition agencies to enforce some ofthe rules (regulation is discussed in moredetail below in Part 4.5).
● Establishing high-level rules that create abias in favor of competition that politiciansand officials cannot easily undermine whenmaking lower-level decisions.In addition to reforms to encourage better
general commercial and policy decisions, thereare some public sector reforms which could beundertaken to address particular problemsencountered in Vietnam. Vietnam couldincrease the use of performance based pay formanagers to address specific measurableproblems. For example, Figure 4.1 highlights aproblem with unaccounted for water.Performance pay linked to reductions inunaccounted for water could be a useful toolfor addressing the problem. Care must betaken in the design of such schemes, however,since a manager could, in an extreme case,achieve zero unaccounted for water by
69
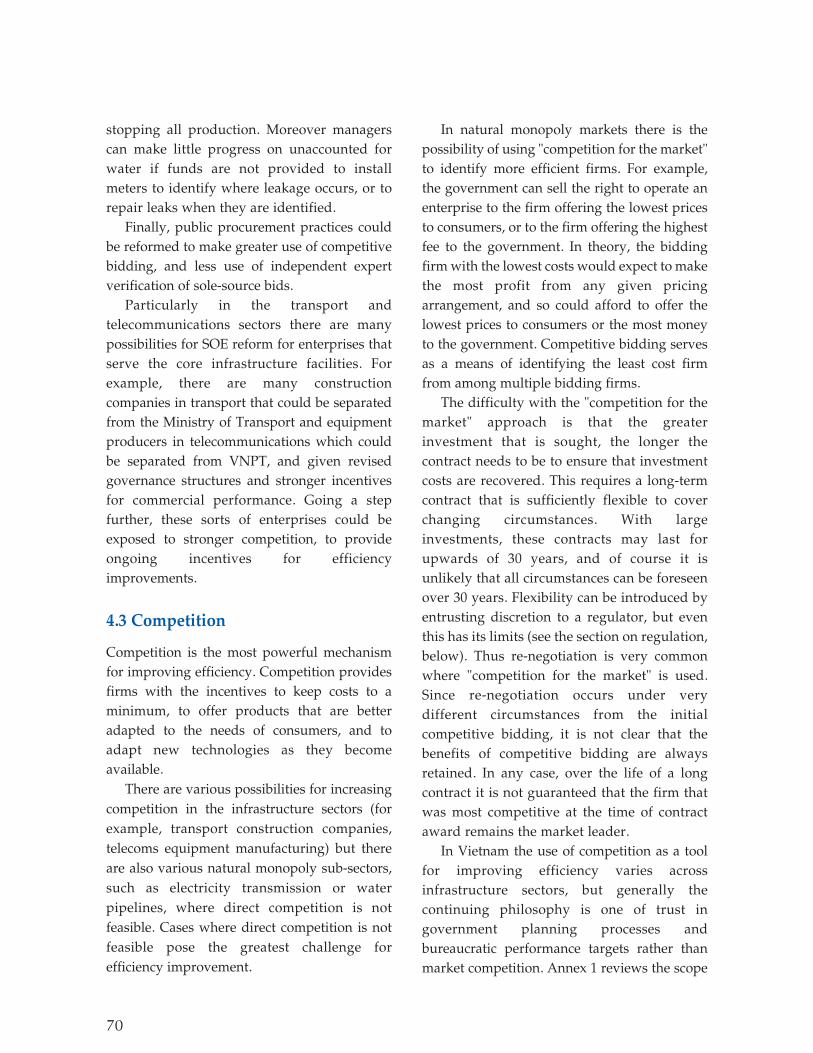
stopping all production. Moreover managerscan make little progress on unaccounted forwater if funds are not provided to installmeters to identify where leakage occurs, or torepair leaks when they are identified.
Finally, public procurement practices couldbe reformed to make greater use of competitivebidding, and less use of independent expertverification of sole-source bids.
Particularly in the transport andtelecommunications sectors there are manypossibilities for SOE reform for enterprises thatserve the core infrastructure facilities. Forexample, there are many constructioncompanies in transport that could be separatedfrom the Ministry of Transport and equipmentproducers in telecommunications which couldbe separated from VNPT, and given revisedgovernance structures and stronger incentivesfor commercial performance. Going a stepfurther, these sorts of enterprises could beexposed to stronger competition, to provideongoing incentives for efficiencyimprovements.
4.3 Competition
Competition is the most powerful mechanismfor improving efficiency. Competition providesfirms with the incentives to keep costs to aminimum, to offer products that are betteradapted to the needs of consumers, and toadapt new technologies as they becomeavailable.
There are various possibilities for increasingcompetition in the infrastructure sectors (forexample, transport construction companies,telecoms equipment manufacturing) but thereare also various natural monopoly sub-sectors,such as electricity transmission or waterpipelines, where direct competition is notfeasible. Cases where direct competition is notfeasible pose the greatest challenge forefficiency improvement.
In natural monopoly markets there is thepossibility of using "competition for the market"to identify more efficient firms. For example,the government can sell the right to operate anenterprise to the firm offering the lowest pricesto consumers, or to the firm offering the highestfee to the government. In theory, the biddingfirm with the lowest costs would expect to makethe most profit from any given pricingarrangement, and so could afford to offer thelowest prices to consumers or the most moneyto the government. Competitive bidding servesas a means of identifying the least cost firmfrom among multiple bidding firms.
The difficulty with the "competition for themarket" approach is that the greaterinvestment that is sought, the longer thecontract needs to be to ensure that investmentcosts are recovered. This requires a long-termcontract that is sufficiently flexible to coverchanging circumstances. With largeinvestments, these contracts may last forupwards of 30 years, and of course it isunlikely that all circumstances can be foreseenover 30 years. Flexibility can be introduced byentrusting discretion to a regulator, but eventhis has its limits (see the section on regulation,below). Thus re-negotiation is very commonwhere "competition for the market" is used.Since re-negotiation occurs under verydifferent circumstances from the initialcompetitive bidding, it is not clear that thebenefits of competitive bidding are alwaysretained. In any case, over the life of a longcontract it is not guaranteed that the firm thatwas most competitive at the time of contractaward remains the market leader.
In Vietnam the use of competition as a toolfor improving efficiency varies acrossinfrastructure sectors, but generally thecontinuing philosophy is one of trust ingovernment planning processes andbureaucratic performance targets rather thanmarket competition. Annex 1 reviews the scope
70

71
for introducing greater competition acrossinfrastructure sectors, with the greatestpotential being in the telecommunications andelectricity sectors.
In telecommunications internationalexperience strongly suggests that the speed ofnetwork rollout is accelerated by greatercompetition. Several new entrants have beenauthorized to compete with VNPT in fixed lineand mobile services, but VNPT remainsdominant. Effective regulation, in particularspectrum management and resolution ofinterconnection disputes, will be important infacilitating the progress of the new entrants.Faster progress could be made by allowing theentry of foreign firms. In this respect, the UnitedStates has obtained an early advantage,obtaining preferential access for its firms undera Bilateral Trade Agreement. But even theseadvantages limit foreign ownership to 49% and45% in the mobile and fixed line servicesmarkets. These limits restrict the potential forcompetition to drive greater investment andimproved services.
The 2004 Electricity Law sets out plans for aphased transition over 20 years to directcompetition in electricity generation, witheventual choice of generators for consumers.There are various obstacles to theimplementation of these plans, including thedifficulty of encouraging private investment inIPPs (a major sectoral priority) when the futuremarket structure is uncertain. Managing thetransition to a competitive electricity sector willbe one of the most difficult policy challenges ininfrastructure.
In other sectors, the introduction ofcompetition could occur with the introductionof private participation by means of"competition for the market".
4.4 Private Participation
At the moment Vietnam's efforts to involve theprivate sector in infrastructure sectors is largelyfocused on meeting financing needs, throughthe equitization program and BOTs, rather thanimproving infrastructure efficiency. But privateparticipation can be introduced as a means ofimproving efficiency, especially whenintroduced through competitive bidding for theright to serve a market. Greater use of privateparticipation as a means of improvingenterprise efficiency could be encouraged withvarious institutional reforms.
4.4.1 Equitization
Equitization provides for a simple change ofownership. International evidence suggests thatcompared to the introduction of competition,ownership changes of themselves are likely todeliver relatively small efficiencyimprovements. There is strong empiricalevidence that private firms in competitive marketsoutperform public firms across a host ofmeasures, including total social welfare.34 Thus,for example, telecommunications markets couldbe strengthened by eliminating the existingbarriers to competition and introducing newprivate competitors. But in infrastructurenatural monopolies the international evidenceis much weaker concerning efficiencyimprovements induced by mere changes ofownership. Changes of ownership ininfrastructure natural monopolies do, however,offer the potential for improved performancewhen linked to competition for the market.
Vietnam's equitization program introduces alevel of private ownership into infrastructurefirms, and provides an injection of funds thatcan be used for investment. But as a means of
34. See, for example, Megginson and Netter (2001) and references cited therein.
72
delivering efficiency improvements ininfrastructure the current program hasimportant weaknesses:● Equitization tends to be focused on current
workers and managers. While providingworkers with stronger incentives has helpedto improve productivity in various smallerenterprises in Vietnam, in largeinfrastructure enterprises these incentivesare likely to be weaker. When the benefits ofbetter performance are shared across moreworkers, workers have stronger incentivesto free-ride on the efforts of others.
● Equitization is not used as a means ofintroducing new management ininfrastructure, so it is unlikely to find newsolutions to poor management.
● It is rare for equitized firms to be listed onthe share market. This is unfortunate as animportant element of privatization is thepossibility for outside shareholders to takecontrol when they see the possibility ofefficiency improvements.If the equitization program is to be used as a
means of improving efficiency of infrastructurefirms the current rules (see section 2.3.10)requiring that the State retain majority ownershipeven in competitive segments of infrastructureindustries should be relaxed. Such rules are notnecessary in markets where there is a choice ofsupplier as, for example, in electricity generationor mobile telecommunications. Moreover, withrelaxation of these rules, equitization should beused to introduce new management in at least aselection of infrastructure operators, to provide acompetitive spur towards innovation andefficiency improvement.
4.4.2 BOTs
Table 4.1 sets out instances of privateparticipation in infrastructure in Vietnam. A
majority of the contracts are BOTs. (Thetelecommunications business cooperationcontracts (BCCs) are a means of introducingprivate financing without transferringmanagement control). Competitive bidding for aBOT project can be used to identify efficientservice providers. Because the winning bidder isresponsible for operations, management, andinvestment it also offers strong ongoingcommercial incentives for efficient performance.
Unfortunately, the Government hashistorically tended to award BOTs on anegotiated basis, rather than throughcompetitive bidding. International evidencesuggests that competitive bidding of BOTsyields lower final prices than directnegotiation.35 This was certainly observed withthe Phu My 2.2 project (see Box 4.1).International experience also suggests thatcompetitive bidding tends to be less susceptibleto corruption than direct negotiations.
A number of BOTs have been negotiatedwith state-owned construction companies.While local financing has advantages in termsof foreign exchange risks, the use of foreignenterprises with specialist infrastructureexperience could provide a stronger infusion ofmanagement expertise, new technology, andnew ideas for efficiency improvements. And adifficulty with state-owned enterprises is thatweak governance structures may provide weakcommercial incentives, undermining the aimsof a BOT program. There is scope for greateropenness toward foreign private enterprises ininfrastructure investment.
The legal basis for BOTs is set out in the 1996Foreign Investment Law, and the relatedDecrees 62/1998/ND-CP and 02/1999/ND-CP.These laws encourage foreign investment intransport, communications, power productionand trading, water supply and drainage, wastetreatment, and other fields decided by the
35. Albouy, and Bousba (1998).

Prime Minister. They offer tax exemptions andset out procedures for the conduct of feasibilitystudies, procedures for government approvals,contractual terms, and mechanisms for disputeresolution, although not in great detail.
The current BOT legal regime permits, butdoes not require competitive bidding. The 1999Country Framework Report (PPIAF, 1999)
identified several further problems with thelegal regime for BOTs, including investors'concerns about how priorities would beallocated in the event of foreign exchangeshortages, which State bodies had the legalauthority to provide and honor guarantees, thepossibilities for land-use rights to be transferredin the event of sales of buildings, the "step-in"
73
Table 4.1: Private Participation Contracts in Vietnam
type date (years) What Where Sponsor
BOT 1994 25 Deep water port Phu My, 70 km from HCMC
France, Norway
BCC† 1995 10 MobiFone mobile network National Sweden
BOT 1996 Air cargo terminal Ho Chi Minh City Singapore
ROT‡ 1996 50 Diesel power generation, transmission lines & toll-road
Hiep Phuoc, EPZ 15 km from HCMC
Taiwan
BCC 1996 10 Network development Four provinces South Korea BCC 1997 15 Network development North-east Hanoi Japan BCC 1997 15 Internal network HCMC France BCC 1997 15 Network development East Hanoi UK BOT 1997 VICT container terminal Ho Chi Minh City Japan BOT 1997 30 Diesel power generation Bien Hoa Thailand BOT 1998 20 Water treatment plant Ho Chi Minh City Malaysia BCC 1998 6 International telecom network National Australia
BOT* 2001 25 Water treatment plant Ho Chi Minh City France, Malaysia
BOT 2002 Approx. 20 Gas field, transmission pipeline, & processing facility
Nam Con Son UK, US
BOT 2002 20 Gas-fired power generation Phu My 2.2 France, Japan
BCC† 2003 15 S-Fone mobile network National South Korea
BOT 2003 23 Natural gas power generation Phu My 3 UK, Japan, Singapore
BCC 2005 15 CDMA mobile phone network Hanoi UK Source: BCC information from USAID (2005); other information from PPI database. † BCC – Business Cooperation Contract. ‡ ROT – Rehabilitate, Operate, Transfer. * In February 2003 Suez Lyonnaise (France) and Pilecon Engineering (Malaysia) withdrew from the Thu Duc water project followingdisputes with the construction company and local partners. In August 2005 a Vietnamese consortium led by Ho Chi Minh CityInfrastructure Investment Joint Stock Company (CII) won the tender to replace the foreign investors under a revised BOO scheme.
Contract Closure Duration Country of
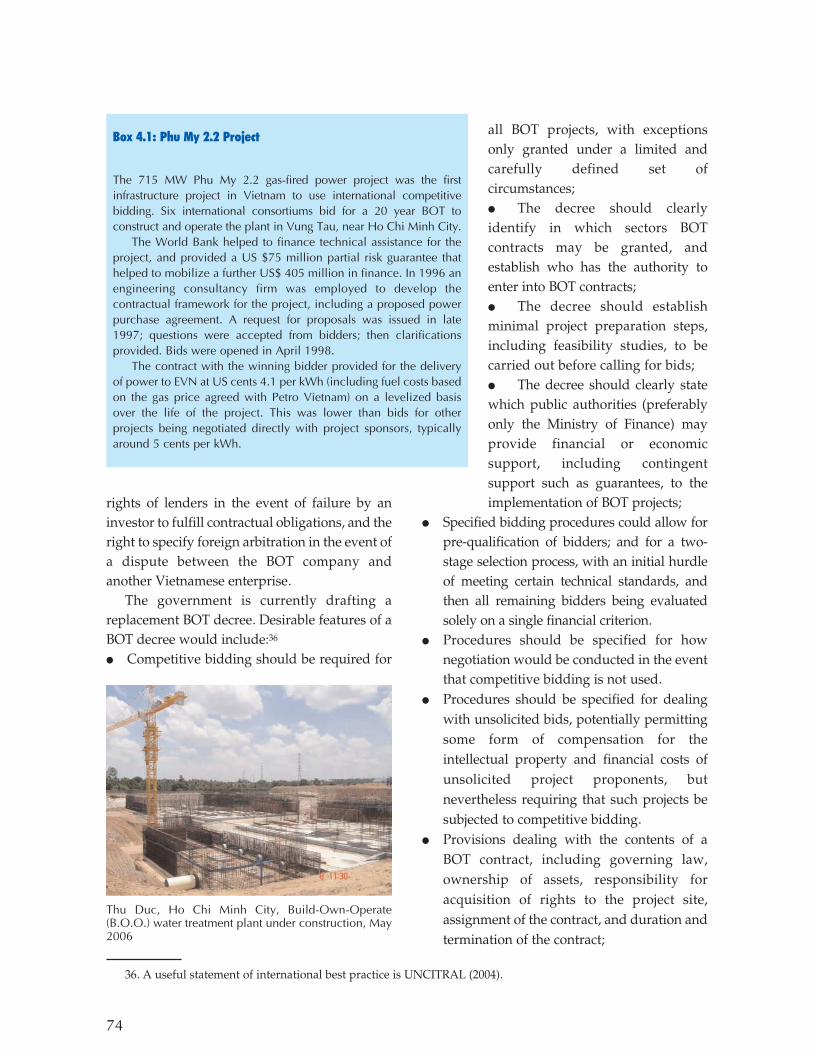
74
rights of lenders in the event of failure by aninvestor to fulfill contractual obligations, and theright to specify foreign arbitration in the event ofa dispute between the BOT company andanother Vietnamese enterprise.
The government is currently drafting areplacement BOT decree. Desirable features of aBOT decree would include:36
● Competitive bidding should be required for
all BOT projects, with exceptionsonly granted under a limited andcarefully defined set ofcircumstances;● The decree should clearlyidentify in which sectors BOTcontracts may be granted, andestablish who has the authority toenter into BOT contracts;● The decree should establishminimal project preparation steps,including feasibility studies, to becarried out before calling for bids;● The decree should clearly statewhich public authorities (preferablyonly the Ministry of Finance) mayprovide financial or economicsupport, including contingentsupport such as guarantees, to theimplementation of BOT projects;
● Specified bidding procedures could allow forpre-qualification of bidders; and for a two-stage selection process, with an initial hurdleof meeting certain technical standards, andthen all remaining bidders being evaluatedsolely on a single financial criterion.
● Procedures should be specified for hownegotiation would be conducted in the eventthat competitive bidding is not used.
● Procedures should be specified for dealingwith unsolicited bids, potentially permittingsome form of compensation for theintellectual property and financial costs ofunsolicited project proponents, butnevertheless requiring that such projects besubjected to competitive bidding.
● Provisions dealing with the contents of aBOT contract, including governing law,ownership of assets, responsibility foracquisition of rights to the project site,assignment of the contract, and duration andtermination of the contract;
Thu Duc, Ho Chi Minh City, Build-Own-Operate(B.O.O.) water treatment plant under construction, May2006
36. A useful statement of international best practice is UNCITRAL (2004).
Box 4.1: Phu My 2.2 Project
The 715 MW Phu My 2.2 gas-fired power project was the firstinfrastructure project in Vietnam to use international competitivebidding. Six international consortiums bid for a 20 year BOT toconstruct and operate the plant in Vung Tau, near Ho Chi Minh City.
The World Bank helped to finance technical assistance for theproject, and provided a US $75 million partial risk guarantee thathelped to mobilize a further US$ 405 million in finance. In 1996 anengineering consultancy firm was employed to develop thecontractual framework for the project, including a proposed powerpurchase agreement. A request for proposals was issued in late1997; questions were accepted from bidders; then clarificationsprovided. Bids were opened in April 1998.
The contract with the winning bidder provided for the deliveryof power to EVN at US cents 4.1 per kWh (including fuel costs basedon the gas price agreed with Petro Vietnam) on a levelized basisover the life of the project. This was lower than bids for otherprojects being negotiated directly with project sponsors, typicallyaround 5 cents per kWh.
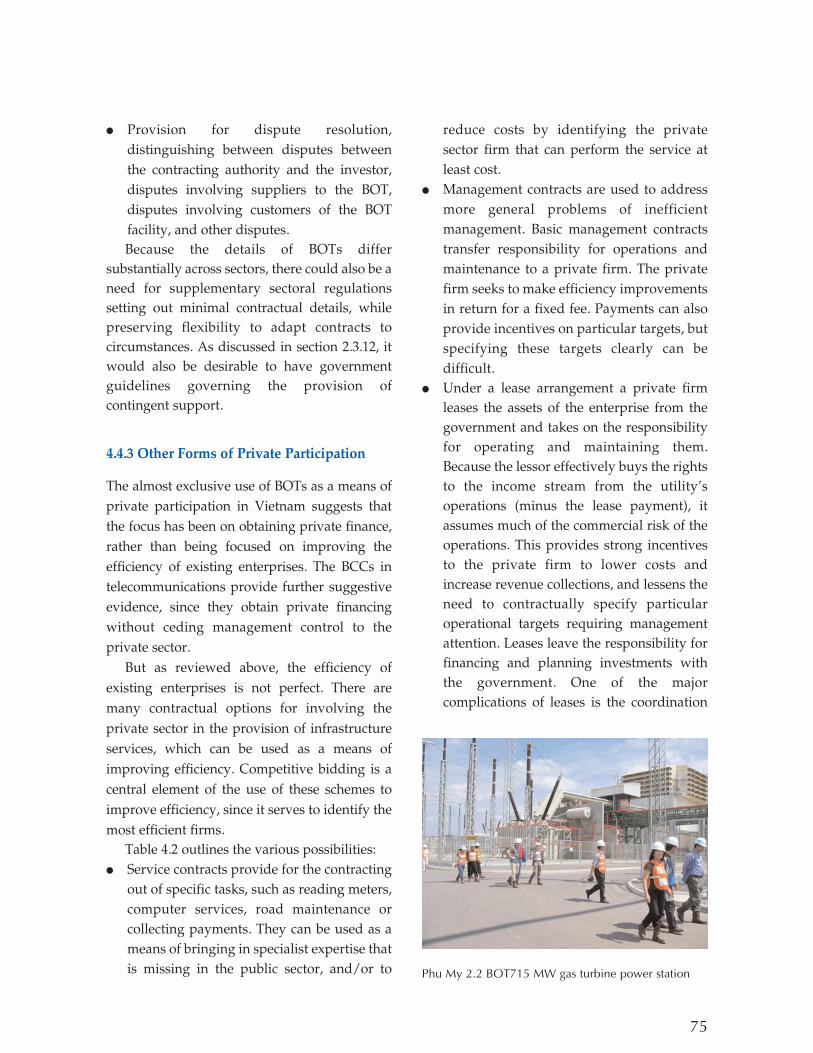
75
● Provision for dispute resolution,distinguishing between disputes betweenthe contracting authority and the investor,disputes involving suppliers to the BOT,disputes involving customers of the BOTfacility, and other disputes.Because the details of BOTs differ
substantially across sectors, there could also be aneed for supplementary sectoral regulationssetting out minimal contractual details, whilepreserving flexibility to adapt contracts tocircumstances. As discussed in section 2.3.12, itwould also be desirable to have governmentguidelines governing the provision ofcontingent support.
4.4.3 Other Forms of Private Participation
The almost exclusive use of BOTs as a means ofprivate participation in Vietnam suggests thatthe focus has been on obtaining private finance,rather than being focused on improving theefficiency of existing enterprises. The BCCs intelecommunications provide further suggestiveevidence, since they obtain private financingwithout ceding management control to theprivate sector.
But as reviewed above, the efficiency ofexisting enterprises is not perfect. There aremany contractual options for involving theprivate sector in the provision of infrastructureservices, which can be used as a means ofimproving efficiency. Competitive bidding is acentral element of the use of these schemes toimprove efficiency, since it serves to identify themost efficient firms.
Table 4.2 outlines the various possibilities:● Service contracts provide for the contracting
out of specific tasks, such as reading meters,computer services, road maintenance orcollecting payments. They can be used as ameans of bringing in specialist expertise thatis missing in the public sector, and/or to
reduce costs by identifying the privatesector firm that can perform the service atleast cost.
● Management contracts are used to addressmore general problems of inefficientmanagement. Basic management contractstransfer responsibility for operations andmaintenance to a private firm. The privatefirm seeks to make efficiency improvementsin return for a fixed fee. Payments can alsoprovide incentives on particular targets, butspecifying these targets clearly can bedifficult.
● Under a lease arrangement a private firmleases the assets of the enterprise from thegovernment and takes on the responsibilityfor operating and maintaining them.Because the lessor effectively buys the rightsto the income stream from the utility'soperations (minus the lease payment), itassumes much of the commercial risk of theoperations. This provides strong incentivesto the private firm to lower costs andincrease revenue collections, and lessens theneed to contractually specify particularoperational targets requiring managementattention. Leases leave the responsibility forfinancing and planning investments withthe government. One of the majorcomplications of leases is the coordination
Phu My 2.2 BOT715 MW gas turbine power station

required between the government'sinvestment plans and the private operator'soperational plans.
● Concessions give the private partnerresponsibility not only for the operation andmaintenance of a utility's assets but also forinvestments. Asset ownership remains withthe government, however, and rights to allthe assets revert to the government whenthe contract ends. Concessions are often bidby price: the bidder that proposes to operatethe enterprise and meet the investmenttargets for the lowest tariff wins theconcession. The concession is governed by acontract that sets out such conditions asmechanisms for adjusting tariffs,performance targets such as quality andservice coverage, and arrangements forresolving disputes. The main advantage of aconcession is that it passes full responsibilityfor operations and investment to the privatesector and so brings to bear incentives forefficiency in all the utility's activities.
● Build-operate-transfer (BOT) arrangementsare basically the same as concessions, with theadded requirement that the private firmconstruct the infrastructure facility concerned.These contracts help the government reducethe public risks of construction cost overruns
and delays. Build-operate-own (BOO)contracts provide that the built assets remainindefinitely with the private firm.
● Divestiture can occur through a sale of assetsor shares. A complete divestiture gives theprivate sector full responsibility foroperations, maintenance, and investment. Butunlike a concession, a divestiture transfersownership to the private sector. With aconcession, the government needs to deviserules that ensure the assets are returned ingood condition. Such rules are not neededwith divestiture since the private owner hassufficient incentive to maintain assets.Consideration should be given to use of
these PPI alternatives as a means ofimproving the efficiency of existinginfrastructure enterprises. Pilot exercisesshould be undertaken across theinfrastructure sectors, to gain experience inproject preparation, and also to assess theeffectiveness of private participation as ameans of improving efficiency. Because of thedifficulties in attracting private investment insectors where there has been little history ofprivate investment, initial experimentsshould focus on projects that are likely to becommercially attractive. In order to assesseffectiveness it would be important that these
76
Table 4.2: Responsibilities under the Main Private Participation Options
Option Operations and
maintenance Commercial risk
Capital investment
Asset Ownership Typical Duration
Service contract Public and
private Public Public Public 1-2 years
Management contract
Private Public Public Public 3-5 years
Lease Private Shared Public Public 8-15 years Concession Private Private Private Public 25-30 years
BOT/BOO Private Private Private Private and
public 20-30 years
Divestiture Private Private Private Private Indefinite

pilot projects be accompanied by carefulmonitoring and evaluation of their effects.
4.4.4 Preparing for Private Participation
Competitive bidding requires carefulpreparation by the Government. Ideally,projects will be sufficiently well prepared that acommon set of conditions can be offered to allbidders, without the need for any furthernegotiation after the winning bidder has beenidentified. Even if competitive bidding is notmade automatic, careful preparation by theGovernment before approaching private firmscan help to reduce the time and expense for theprivate sector, and so help to reduce final costs.
Preparatory work that should occur prior tobidding includes identification of the scope ofthe project, an assessment of the potentialeconomic benefits of the project, anenvironmental and social impacts appraisal, amarket appraisal, an assessment of the likelycosts of private sector capital, preparation of afinancial model for the project, an assessment ofwhether the implied tariffs are compatible withthe government's policies on affordability, andan overall appraisal of the likely social costs andbenefits of the project. All relevant documentsshould be available for inspection by allpotential bidders.
Where the project involves sales to finalconsumers, there is often a need for regulatoryarrangements governing tariffs and servicequality. Regulatory reforms should bedeveloped and enacted prior to bidding.
To identify the most efficient operator it iscommon practice to use a two-stage process inwhich bidders' proposals must first meet aspecified technical standard, and then thewinning bidder is chosen purely on the basis offinancial proposals (eg. the firm proposing thelowest tariff to consumers, or the highestpayment to government, or asking for the lowestsubsidy from government). For such bidding to
work, the government should have alreadyidentified sufficient technical standards, andmust have clear financial criteria for evaluationof the bids, and all of these should be included inthe bidding documents.
Finally, winning bidders have been known touse the period after bidding to negotiate revisedterms and conditions. This risk can be lessened ifall of the terms and conditions are set out in adraft contract prior to bidding occurring, withthe only remaining detail to be filled in being thefinancial result of the bid. Bidders should beinformed that no modification of the contractwill be permitted after the bidding. In theabsolute best of international practice, the draftcontract is pre-approved by Government, andthe winning bidder is required to fill in thefinancial bid and sign the contract immediatelyafter selection.
Preparing for a competitive bid is a time-consuming process. But all of these steps wouldneed to be performed even with a negotiatedproposal, and the benefit of careful preparationis that the full force of competition can be usedto generate greater cost savings in procurementof the desired infrastructure service.
Careful project preparation also requiresspecialist economic, accounting, and legal skills.Most governments, even those with extensivePPI experience, find that the skills withingovernment need to be supplemented with theskills of consultants with expertise in projectpreparation. Recognizing the difficulty in tryingto reproduce such skills across many ministriesand tiers of government, some countries haveopted for specialist institutions to be involved indeveloping a pipeline of projects, projectpreparation and, in some cases, projectapproval. Good examples include thePhilippines BOT Center, South Africa's Public-Private Partnerships Unit (PPP Unit), or in India,the Gujarat Infrastructure Development Board(see Box 4.2).
In supporting provincial and municipal
77

governments, a central "PPP Unit" or "BOTCenter" could be given an advisory role(providing support when requested by lowerlevels of government) or a mandatory role(approval of the unit would be required for theproject to advance). Alternatively, LDIFs couldbe developed as the centers of expertise inpreparation of PPPs, although this strategywould not work for the many provinces thathave not established LDIFs.
4.5 Regulation
Where competition is not present, effectiveregulation is the key to efficient operation.Regulation can provide incentives to firms toreduce their costs and can mandate pricesdesigned to achieve efficiency. Moderneconomic theory recognizes a trade-offbetween the goal of keeping prices close to
costs and the incentive for regulated firms toreduce costs over time. The design ofregulatory schemes involves specific sorts ofrules to manage these trade-offs (Box 4.3) aswell as institutional arrangements to balancethe interests of consumers and investors (Box4.4). Annex 2 provides an overview of furtherissues that need to be addressed in the designof a modern regulatory system.
At present, Vietnam has very limitedexperience with the establishment of the sortsof regulatory schemes and institutions found inmore developed market economies. Thetraditional regulatory institutions have beengovernment ministries. A good first steptowards a specialist infrastructure regulatoryinstitution was taken in 2005 with theestablishment of the Electricity RegulatoryAgency of Vietnam (ERAV), described in thePower Strategy paper.
78
The State of Gujarat in India, located on thecoast next to Pakistan, has a population of over50 million people, and has had an annualgrowth rate of 10 to 12% over the past fiveyears. The Gujarat Infrastructure DevelopmentBoard (GIDB) is headed by the State’s ChiefMinister, and consists of various ministersresponsible for infrastructure. It is supported bya technical secretariat with expertise in eachaffected sector.
The GIDB’s mandate is to pave the way forfast-track implementation of infrastructureprojects. Planning processes identified 383infrastructure projects required to meet demandduring 2000-2010. This list of projects was thenassessed on economic criteria to determinepriorities. Projects are being assessed in order ofpriority for their potential for privateparticipation.
Where it is decided to involve the privatesector in a project, the GIDB undertakesproject preparation, including the riskallocation framework, the financing
framework, and the bidding criteria.Preparation to the point of a bankable projectis expensive. The GIDB operates a revolvingfund to pay for pre-feasibility studies. Someprojects are feasible, others are not. When afeasible project proceeds to selection of aprivate operator, a fee is charged by GIDB,enabling the development costs to berecovered and used for further pre-feasibilitystudies.
Much of GIDB’s early efforts were focused ondeveloping clear policies, such as biddingcriteria and model concession agreements toguide future development. At the same time, realprogress on introducing private participation hasbeen made, with 6 port projects, 10 independentpower projects, 6 toll-road projects and 2railroad projects completed since 2000,involving over US$ 5 billion of investment. Anumber of other projects are close tocompletion.
Source: GIDB website:
Box 4.2: Gujarat Infrastructure Development Board
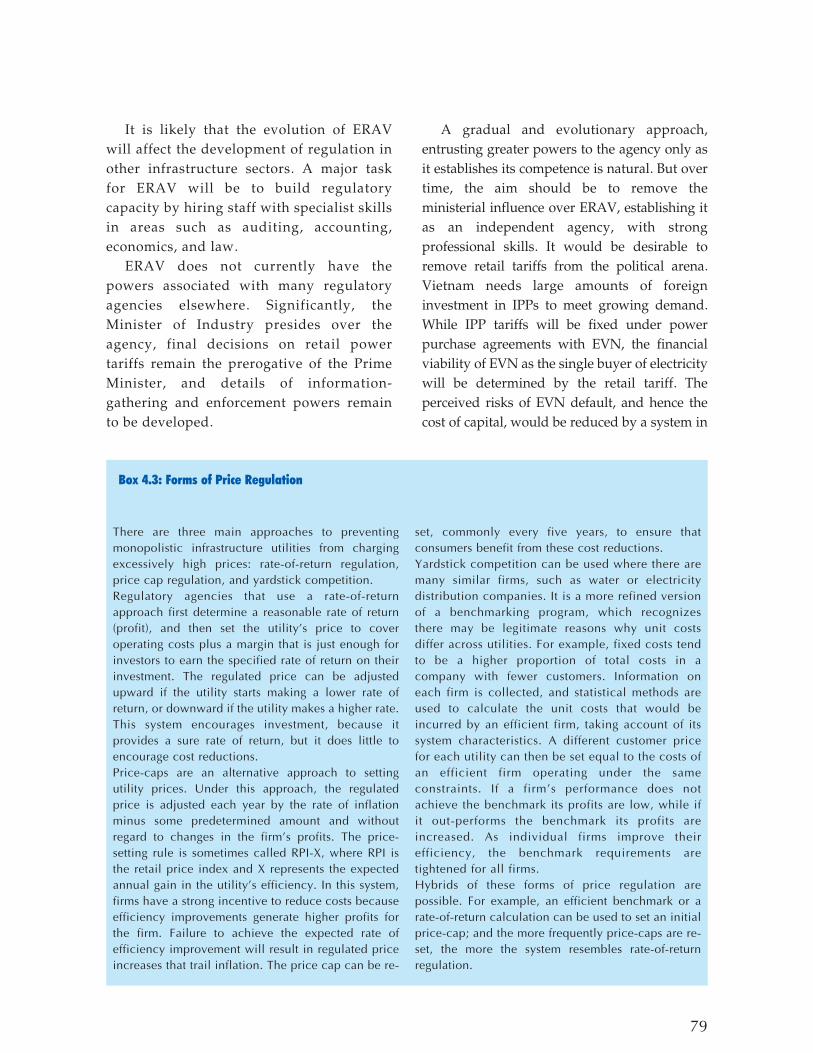
79
It is likely that the evolution of ERAVwill affect the development of regulation inother infrastructure sectors. A major taskfor ERAV will be to build regulatorycapacity by hiring staff with specialist skillsin areas such as auditing, accounting,economics, and law.
ERAV does not currently have thepowers associated with many regulatoryagencies elsewhere. Significantly, theMinister of Industry presides over theagency, final decisions on retail powertariffs remain the prerogative of the PrimeMinister, and details of information-gathering and enforcement powers remainto be developed.
A gradual and evolutionary approach,entrusting greater powers to the agency only asit establishes its competence is natural. But overtime, the aim should be to remove theministerial influence over ERAV, establishing itas an independent agency, with strongprofessional skills. It would be desirable toremove retail tariffs from the political arena.Vietnam needs large amounts of foreigninvestment in IPPs to meet growing demand.While IPP tariffs will be fixed under powerpurchase agreements with EVN, the financialviability of EVN as the single buyer of electricitywill be determined by the retail tariff. Theperceived risks of EVN default, and hence thecost of capital, would be reduced by a system in
There are three main approaches to preventingmonopolistic infrastructure utilities from chargingexcessively high prices: rate-of-return regulation,price cap regulation, and yardstick competition.Regulatory agencies that use a rate-of-returnapproach first determine a reasonable rate of return(profit), and then set the utility's price to coveroperating costs plus a margin that is just enough forinvestors to earn the specified rate of return on theirinvestment. The regulated price can be adjustedupward if the utility starts making a lower rate ofreturn, or downward if the utility makes a higher rate.This system encourages investment, because itprovides a sure rate of return, but it does little toencourage cost reductions.Price-caps are an alternative approach to settingutility prices. Under this approach, the regulatedprice is adjusted each year by the rate of inflationminus some predetermined amount and withoutregard to changes in the firm's profits. The price-setting rule is sometimes called RPI-X, where RPI isthe retail price index and X represents the expectedannual gain in the utility's efficiency. In this system,firms have a strong incentive to reduce costs becauseefficiency improvements generate higher profits forthe firm. Failure to achieve the expected rate ofefficiency improvement will result in regulated priceincreases that trail inflation. The price cap can be re-
set, commonly every five years, to ensure thatconsumers benefit from these cost reductions.Yardstick competition can be used where there aremany similar firms, such as water or electricitydistribution companies. It is a more refined versionof a benchmarking program, which recognizesthere may be legitimate reasons why unit costsdiffer across utilities. For example, fixed costs tendto be a higher proportion of total costs in acompany with fewer customers. Information oneach firm is collected, and statistical methods areused to calculate the unit costs that would beincurred by an efficient firm, taking account of itssystem characteristics. A different customer pricefor each utility can then be set equal to the costs ofan efficient firm operating under the sameconstraints. If a firm's performance does notachieve the benchmark its profits are low, while ifit out-performs the benchmark its profits areincreased. As individual firms improve theirefficiency, the benchmark requirements aretightened for all firms.Hybrids of these forms of price regulation arepossible. For example, an efficient benchmark or arate-of-return calculation can be used to set an initialprice-cap; and the more frequently price-caps are re-set, the more the system resembles rate-of-returnregulation.
Box 4.3: Forms of Price Regulation

80
which an independent regulator establishedretail tariffs on purely technical criteria relatedto costs.
There are greater weaknesses in regulatoryinstitutions in other sectors. Intelecommunications, regulation rests with theMinistry of Post and Telematics. The Ministry'sownership of VNPT establishes a conflict ofinterest between maximizing VNPT's profitsand developing strong competition for VNPT.This will be particularly apparent in disputes inwhich competitors seek access to VNPT's
network. If a competitive and cost-effectivetelecommunications industry is desired,regulation should be performed by an agencythat is separate from the Ministry and has nointerest in the regulated firms.
The ports sector provides an even starkerexample of a conflict of interest. Vinamarineregulates port operations, but also operates anumber of small ports. Effective regulationcannot be expected in cases where regulatoryenforcement would diminish Vinamarine'sprofits.
The regulation of consumer tariffs for infrastructureservices is subject to conflicting forces:
● Governments would generally like to keeptariffs down to protect consumers, and facepolitical pressures to reduce tariffs afterinvestments have been made (effectively, toexpropriate the investment).
● Investors are aware of these pressures, and willnot invest in the first place unless thegovernment makes a credible commitment torules that permit a reasonable return on capitalinvested. The lower the credibility, the higherthe cost of capital.
● The long-term nature of most infrastructureinvestment makes it difficult to create crediblecommitments. Detailed rules specifying howprices will be established over time couldprovide a degree of certainty to investors, butthis would leave little flexibility to pursueefficiency as circumstances change inunforeseen ways.
There is thus an important tradeoff betweenreducing the risk of expropriation and with it thecost of capital, and retaining the flexibility topursue efficiency and deal with unexpectedcircumstances. Policy makers need to decide howmuch discretion to introduce into regulatorysystems, and how best it should be exercised.
The discretion in regulatory systems differswidely across countries. At one extreme, USregulators typically have wide powers to set pricesthat are “just and reasonable.” But the UnitedStates has more than a century of experience inregulation of private utilities, with an establishedbody of jurisprudence as to what constitutes a “just
and reasonable” price, and a reputation forprotecting the legitimate interests of investors. In adeveloping country with limited reputation forrespecting private property rights, such widediscretionary powers would not provide credibleprotection of investors’ rights. To compensate forthe perceived risk of expropriation, investorswould demand a high rate of return for theircapital.
At the other extreme, some countriesimplement regulation through tightly specifiedlaws or contracts that seek to eliminate discretion.This approach has often been favored by investorswho perceive a high risk of misuse of discretion byministers or regulators. But the internationalexperience of the past decade suggests that suchcontracts are highly vulnerable to changedcircumstances, resulting in frequent disputes andrenegotiations.
Most regulatory systems lie somewherebetween these extremes. Key policies andprinciples tend to be defined in laws, licenses, orcontracts, which carefully delimit residualdiscretion through reference to criteria, factorsand objectives. When discretion is retained ontariffs or other issues of concern to investors, thechallenge is to manage it in a way that minimizesthe risk of misuse. The exercise of discretionneeds to be insulated from short-term politicalpressures and other improper influences and tobe based on competent analysis. Internationalexperience suggests that these requirements arebest satisfied by specialist regulatory agencies,desirably independent of ministerial influence.
Source: Smith (1997).
Box 4.4: Discretion in the Regulation of Private Infrastructure Enterprises
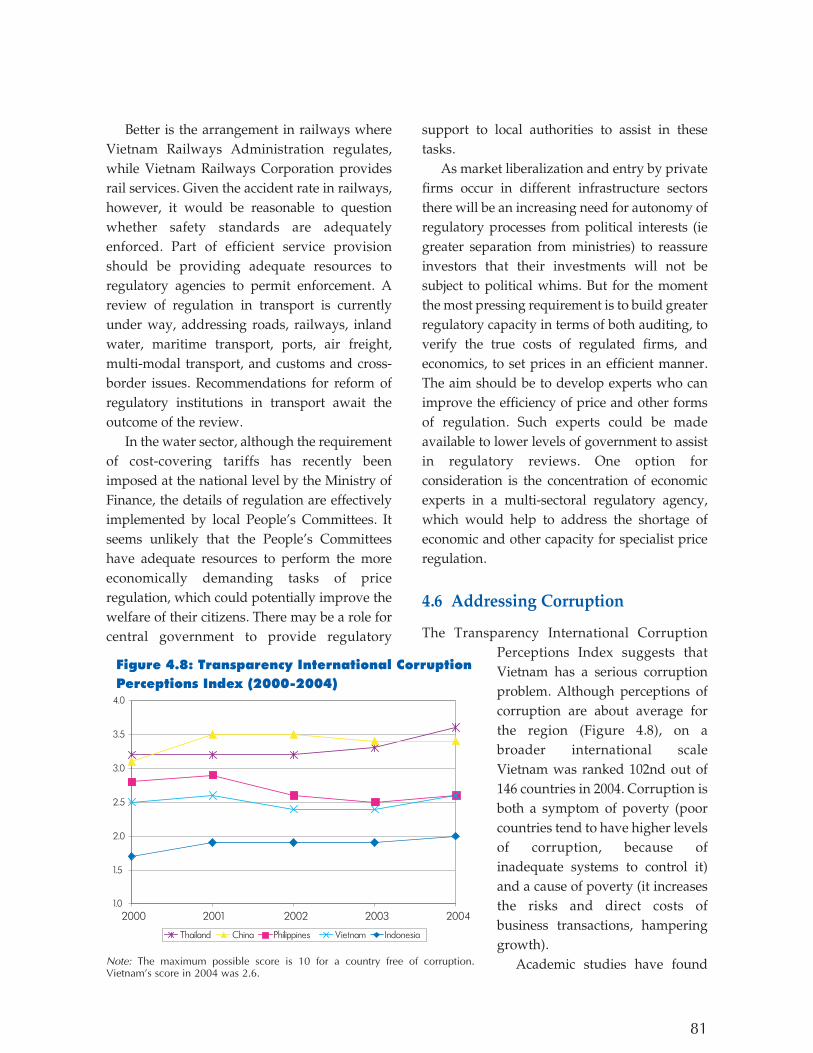
81
Better is the arrangement in railways whereVietnam Railways Administration regulates,while Vietnam Railways Corporation providesrail services. Given the accident rate in railways,however, it would be reasonable to questionwhether safety standards are adequatelyenforced. Part of efficient service provisionshould be providing adequate resources toregulatory agencies to permit enforcement. Areview of regulation in transport is currentlyunder way, addressing roads, railways, inlandwater, maritime transport, ports, air freight,multi-modal transport, and customs and cross-border issues. Recommendations for reform ofregulatory institutions in transport await theoutcome of the review.
In the water sector, although the requirementof cost-covering tariffs has recently beenimposed at the national level by the Ministry ofFinance, the details of regulation are effectivelyimplemented by local People's Committees. Itseems unlikely that the People's Committeeshave adequate resources to perform the moreeconomically demanding tasks of priceregulation, which could potentially improve thewelfare of their citizens. There may be a role forcentral government to provide regulatory
support to local authorities to assist in thesetasks.
As market liberalization and entry by privatefirms occur in different infrastructure sectorsthere will be an increasing need for autonomy ofregulatory processes from political interests (iegreater separation from ministries) to reassureinvestors that their investments will not besubject to political whims. But for the momentthe most pressing requirement is to build greaterregulatory capacity in terms of both auditing, toverify the true costs of regulated firms, andeconomics, to set prices in an efficient manner.The aim should be to develop experts who canimprove the efficiency of price and other formsof regulation. Such experts could be madeavailable to lower levels of government to assistin regulatory reviews. One option forconsideration is the concentration of economicexperts in a multi-sectoral regulatory agency,which would help to address the shortage ofeconomic and other capacity for specialist priceregulation.
4.6 Addressing Corruption
The Transparency International CorruptionPerceptions Index suggests thatVietnam has a serious corruptionproblem. Although perceptions ofcorruption are about average forthe region (Figure 4.8), on abroader international scaleVietnam was ranked 102nd out of146 countries in 2004. Corruption isboth a symptom of poverty (poorcountries tend to have higher levelsof corruption, because ofinadequate systems to control it)and a cause of poverty (it increasesthe risks and direct costs ofbusiness transactions, hamperinggrowth).
Academic studies have foundNote: The maximum possible score is 10 for a country free of corruption.Vietnam’s score in 2004 was 2.6.

82
that corruption tends to slow the rate ofeconomic growth. Econometric studies by Mo(2001) and Pellegrini and Gerlagh (2004) agreein the broad magnitude of this effect, suggestingthat an increase of one point in the TICPIcorresponds to an increase in economic growthof around half a percentage point. For Vietnaman increase of one point in the TICPIcorresponds to the corruption level of Thailand,while two points roughly corresponds to thecorruption level of Malaysia. Pellegrini and
Gerlagh (2004) present evidence that theprincipal transmission mechanism iscorruption's effect in constraininginvestment, by increasing costs andrisks of investing.
With around 10% of GDP beingchanneled into infrastructure investmentin Vietnam, infrastructure is an obviousarea for potential corruption, and therehave been several documented instancesof corrupt behavior in connection withinfrastructure projects (see Box 4.6). Themagnitude of investment combined withhigh social returns to infrastructure raisethe opportunity costs of corruption to veryhigh levels. For example, suppose theaverage infrastructure project yields a totalreturn of 20%, and corruption boostsproject costs by 10%. Without corruption,investment of 10% of GDP ininfrastructure would yield social benefitsworth 2% of GDP. With corruption,criminals would receive a transfer of 0.9%of GDP, and the social benefits flowingfrom infrastructure investment would bereduced to 0.9% of GDP, a reduction of1.1% of GDP.
Opportunities for corruption arise atmost stages of the infrastructure projectcycle. Corruption in the projectpreparation phase typically involves thechoice of project location, choice of design,relocation and resettlement plans, and land
acquisition. Internationally, the majority of casesinvolve corruption in the project implementationphase: particularly during procurement, but also inthe approval and payment of invoices. In additionto collusion among bidders, infrastructure projectsare especially vulnerable to change orderschemes (bids are set artificially low to securethe contract, and subsequently adjusted bychange orders) and the use of inadequateand/or inferior materials (e.g., road constructioncontractors cut costs by laying insufficient
Box 4.5: Bangladesh Rural Electrification Board
In Bangladesh, the Rural Electrification Board (REB) and its ruralelectric cooperatives (Pally Bidyut Samities) have protectedthemselves from the corrupt practices commonly seen in otherpower sector utilities through a number of innovativearrangements:
Administrative Arrangements: The Board of each PBS is electedby consumers. This Board and REB management approve thesalary structure for the PBS, which is usually market based (de-linked from the government salary scale). Since meter reading isa common source of corruption, meter readers are hired oncontracts of only one year. With good performance record thecontract may be extended, but never can it exceed threeyears—after which the meter reader will have to seek a differentcareer. A good performance record as a meter reader can leadto a linesman or other job with a PBS, and this job expectationis a strong incentive to maintain a good track record as meterreader.
Operational Arrangements: Every year the management of eachPBS negotiates a results agreement with REB. This is known asPerformance Target Agreement (PTA). If a PBS meets the PTA,its management receives a bonus. Not meeting the PTA targetsresults in penalties. A standard PTA has about 20 targets, withhigh weights given to system loss, collection efficiency,revenue/km of line, cost of supply/km of line, and debtrepayment.
Investment Decisions: PBSs use independent consulting firmsto survey rural areas to identify potential consumers and todesign the electricity distribution network. These firms alsocalculate the revenue that is expected to be generated by eachproposed line, and the lines generating the highest revenue areselected first for construction. The list of lines to be constructednext year is disclosed to the public on the notice board of eachPBS. These practices reduce the risk of corruption and nepotismin investment decisions, and help PBSs to avoid constructinguneconomic lines.

foundation and improper drainage, the results ofwhich might not be exposed until some time in thefuture when potholes appear or when portions ofthe pavement wash away).
Once projects are operational there are myriadopportunities for low-level corruption, such asweigh-bridge operators who falsify truck weightsand thereby induce excessive road deterioration,or technicians who assist in the theft of electricity.The 2005 Investment Climate Survey found that17% of manufacturing firms reported that anunofficial "gift" to officials was required to obtainan electricity connection. For a water connectionthe corresponding figure was 11%. For a mainlinetelephone connection, just 8% of firms reportedthat a gift was required, suggesting that thepossibilities for corruption diminish in the
presence of competition, in this case competitionfrom mobile phone companies.
The Government has placed greateremphasis on fighting corruption in recentyears. The Government's main anti-corruptionagency is the Government Inspection Office(GIO). The GIO is governed by the InspectionOrdinance (1990), the Law of Complaint andDenunciation (1998) and the Anti-CorruptionOrdinance (1998). The General Inspector of theGIO holds the rank of minister. But the GIO'smandate is general, and there is an emphasis onresponding to public complaints and"denunciations", and reviews of civil servants'assets. While the GIO has the power to inspectcompliance with the law by the executivebranch in all its areas of operation, it is not clear
83
The following cases from the past decade in Vietnamillustrate some of the possibilities for corruption ininfrastructure projects.
In 1995 a former Minister of Energy was sentencedto 3 years in prison for accepting side-payments for theaward of construction contracts for the 500 kVA north-south electricity transmission line. Source: VietnamToday (2002).
In 1997 tens of thousands of peasants in ThaiBinh province demonstrated against State abuse ofland-use rights, official corruption, unfair taxation,and compulsory labor contributions. Their twoprincipal grievances were additional local taxes (e.g.a grass-replacement tax levied on flocks of more than30 ducks) imposed on peasants to financeoverambitious government infrastructure projectsand the misappropriation of public funds for thepersonal enrichment of Party officials. The officialreport on the incident noted that a sewerage pipeinstalled by the authorities cost VND 21 million,whereas a pipe installed by the peasants cost onlyVND 7.5 million, and that prominent rural officialsgrew extraordinarily rich over the course of fiveyears. Source: UNHCR (1998).
In 2003 questions were raised about the award ofprocurement contracts by VNPT, with media allegationsthat 90% of the contracts handed out between 1998 and2003 were to favored suppliers, and contravened lawson tendering. During the investigation investmentcontracts were frozen, posing network capacity
problems for the company as it tried to meet thegrowing demand for mobile phones. Ultimately thecompany was cleared of illegal practices, but fivecontracts awarded to a company run by the son-in-lawof the Minister for Posts and Telecommunications werecancelled. Sources: Vietnam News (2004), VietnamTrade (2004).
The World Bank recently investigated 400construction contracts under six credits. Noirregularities in financial management or disbursementswere uncovered, and the majority of works physicallyinvestigated were of satisfactory overall quality.Nevertheless most bidding prices fell within a verynarrow range, suggesting collusion between bidders.There are possible explanations for this, such as state-owned bidding companies using the same officialcosting norms. But if this is the case, it suggests aninadequate level of competition between these firms.Source: Vietnam Development Report (2005), p.97f.
In April 2006 newspapers reported instances ofmisdirection of funds in transport projects managed byProject Management Unit 18 (PMU 18). Many roadsand bridges constructed by the unit are reported to havequickly degraded due to inadequate materials used ininitial construction. One bridge alone is reported tohave required VND 31 billion (US$ 2 million) to repairwithin one year of its completion. Reportedly, corruptofficials were detected by their use of misdirected fundsto place large bets on European football matches.Source: Thanh Nien News (2006).
Box 4.6: Opportunities for Corruption
84
that it is adequately resourced to perform theforensic audits and physical inspections thatwould be required to detect corruption ininfrastructure procurement. Reliance cannotsimply be placed on the GIO to detectcorruption. Systems for the detection ofcorruption should be implemented in allinfrastructure agencies, particularly in the areaof procurement, with detected cases passed onto the GIO for prosecution.
The Government has endorsed the "Anti-Corruption Action Plan for Asia and thePacific" developed by the ADB and the OECDin the Anti-Corruption Initiative for Asia andthe Pacific (ADB/OECD, 2000). In its 2004 "SelfAssessment Report" under this initiative theGovernment indicated that it hadimplemented measures to address most of theareas of the Action Plan (ADB/OECD, 2004). Adraft anti-corruption law was issued for publiccomment in July 2005. Some of the proposedarticles require declaration of assets andincomes by public officials, encourage citizensto report instances of corruption, and requirepublic agencies to report information to themass media. It is too early to assess thepractical effect of recent measures.Nevertheless, a review focused on detection ofcorruption in infrastructure could revealadditional potential measures, such asparticular attention to change-orders, orimproved systems for inspection ofconstruction works.
Happily, many of the measuresrecommended in this chapter to improveefficiency will simultaneously help to preventcorruption. Measures to promote greatercommercial focus, such as corporatization,equitization, and privatization, will providestronger pressure on managers to identify
innovative means of combating pettycorruption, such as corrupt meter readers. Box4.5 presents examples of some specificpreventive measures.
Effective competition is one of the bestmeans of narrowing the scope for corruption.The 2005 PER-IFA provides a number ofrecommendations to encourage competition inprocurement, including a requirement forcompetitive bidding, preparation of standardbid documents, mass media advertising of bids,and elimination of restrictions on the province(and country) of origin of the biddingcompanies. This needs to be supported byevaluation criteria that do not allow theexclusion of firms on spurious grounds.Competition in the construction industry couldbe promoted by a program of equitization: theindustry is currently dominated by state-owned enterprises that prepare their bids usingcommon public sector norms.
Measures to promote effective competitionneed to be sustained by laws against collusion.One of the priorities for Vietnam's CompetitionAuthority should be investigation intoallegations of bid-rigging. A potential pool forrecruitment of competition investigators couldbe construction company staff involved in bidpreparation.
4.7. Recommendations
The recommendations for improving efficiencyof infrastructure services follow the structure ofthis Chapter, addressing in turn public sectorreform, competition, private participation,regulation, and anti-corruption measures. Asstressed in the main text, competition offers thegreatest incentives for ongoing efficiencyimprovements.

85
(4.1) Undertake governance reform s of SOEs w hich provide infrastructure services, to
provide a greater com m ercial focus (ie profit m otivation). Such reform s should
include subjecting the SOEs to the new Unified Enterprise Law ,and could include
additionalm easures as suggested in section 4.2.W here the Governm entseeks non-
profitable objectives to be achieved, it should explicitly purchase non-profitable
services from the SOEs.
(M )
(4.2) Review the possibilities for SOE reform in transport service com panies and for
corporate restructuring ofVN PT’sancillary service providers (such as equipm ent
m anufacturers), having regard to the provision of stronger incentives for
com m ercialperform ance,separation ofpotentiallycom petitive operations from the
core natural m onopoly operations, and introduction of com petition for such
operations.
(S)
(4.3) Increase directcom petition in telecom m unications,by relaxing foreign ow nership
constraints,and opening the m arkettoallforeign entrants,notjustAm erican firm s.
(S)
(4.4) Introduce com petition betw een portterm inals,including com petitive stevedoring
services,on apilotbasisin atleastone port.
(S)
(4.5) Require stock m arket listing, including full com pliance w ith all stock m arket
procedures,for any infrastructure firm thatisequitized.
(S)
(4.6) Revise the BOT Law to ensure that com petitive bidding is the usual form of
procurem ent,to develop procedures for subjecting unsolicited bids to com petitive
bidding, and providing criteria and processes for rare instances w here non-
com petitive bidding m ightbe appropriate.
(S)
(4.7) Conductpilotexercises in the introduction ofprivateparticipation by m eans other
than BOTs. Exam ples could be a m anagem ent contract for w ater services for an
under-perform ing w ater utility, and a landlord port operation w here the public
sector retains responsibility for infrastructure and privateoperator conductsdaily
operations. The pilot exercises should be w elldocum ented to ensure thatlessons
can be learntfor w ider application across Vietnam .
(M )
(4.8) Develop a regular benchm arking program for services beyond w ater, including
portperform ance and perform ance ofelectricitydistribution businesses.
(S)
(4.9) Encourage m oves to set tariffs for greater cost recovery across all infrastructure
sectors.
(S)
(4.10) Conduct thorough econom ic review s of tariff structures in telecom m unications,
electricity,w ater services,and transport,w ith aview to developing structures that
ensure the greatestsocialw elfare for agiven levelofrevenue.
(M )
(4.11) Establish a non-m inisterialregulatory agency for telecom m unications,responsible
for the prom otion of com petition and investm ent. Consider the institutional
possibilities for regulation of transport and w ater as discussed in section 4.5.4.
Ensure that regulatory institutions are provided w ith adequate financial and
hum an resources.
(M )

86
hum an resources.
(4.12) Conduct a review of corruption in infrastructure services, w ith a view to
identifying particular areas that are prone to corruption and m echanism s for
im proved detection.
(S)
(4.13) Adoptm easures to prom ote com petition in procurem ent,as recom m ended in the
2005PER-IFA.
(S)
(4.14) Accelerateequitization in the construction industry. (M )
(4.15) Assign infrastructure construction com pany bid-rigging as a m ajor priority for
investigations bythe Com petition Authority
(S)

87
hapter 1 reviewed the progress thatVietnam has made in reducing povertythrough a growth-led strategy, and
noted that at the same time inequality betweenregions has increased. Access to infrastructureservices has improved across all quintiles, butthe poorest quintiles have benefited less thanother quintiles. Where poverty was oncerelatively equally spread across the country it isnow more concentrated in difficult to reachmountainous areas, and new pockets of povertyare emerging in peri-urban areas. Vietnam'sComprehensive Poverty Reduction and GrowthStrategy signals the government'sdissatisfaction with these trends and anintention to address the issue of growinginequality while maintaining a focus on growthas the best means of poverty alleviation.
Programs that seek to address povertyusually contain an element of targeting. Publicfunds are wasted when money intended for the
poor flows instead to the non-poor. Vietnam'srural areas tend to have high concentrations ofpoverty, permitting geographic targeting. Inurban areas, the poor and non-poor may tend tobe more geographically mixed, requiring eithera finer geographic mapping of poverty and/oralternative targeting mechanisms for deliveringassistance to the poor. Of course, even withinrural areas, targeting could be improved withadditional criteria for identifying the poor.
5.1 Rural Poverty
The high concentrations of poverty in ruralareas permit simple geographic targeting as ameans of channeling public funds to the poor.Much is already known about the sorts ofprojects that reduce poverty in the provinceswhere public funds are spent.
Using provincial data on agriculturalproduction, rural non-farm employment,
5. Poverty
Issues
(i) In rural areas, with relatively high concentrations of poverty, simply increasing publicinvestment in poor provinces is a low transaction cost means of targeting the poor. Road andwater investment are particularly well adapted to reducing poverty in the poorest ruralprovinces.
(ii) In urban areas, geographic targeting of investments will only be effective with a fine degreeof poverty mapping, and quick responsiveness to shifting settlement patterns, demandinggreatly improved planning competence at municipal level.
(iii) In both rural and urban areas, targeting can be improved with the aid of non-geographiccriteria aimed at identifying the poor. In general, there is a trade-off between the transactioncosts involved in identifying the poor and the effectiveness of targeting.
(iv) In addition to targeting, a further criterion for evaluation of public support for the poor is theextent to which costs of service delivery (and hence the need for public support) arerestrained. Output-based aid is designed to provide incentives to keep costs down.
C

poverty, and government investments,Shenggen Fan, Pham Lan Huong and TrinhQuang Long (2004) developed an econometricmodel to estimate the marginal returns inagricultural growth and poverty reduction tovarious types of government spending. Theresults reveal that government investment inagricultural research has the largest povertyreduction impact, immediately followed byroad investment. Very little is actually spent onagricultural research so in practice roadinvestment has a higher total return. Educationis also found to yield positive, albeit lesser,reductions in poverty. 37
Larsen, Pham and Rama (2004) have studiedthe effects of investment in transport, water andelectricity, and find that provinces with greaterinvestment in transport and water projects tendto see greater reductions in provincial povertyrates. The effects of electricity projects tend notto be concentrated in particular provinces.
Deolalikar (2001) found that rural roadprojects in Vietnam had a significant povertyreduction impact. The establishment of a newroad in a village raised the per capita income ofa household by 30 percent between 1993 and1998, after controlling for other factors, such ashousehold size and education. Moreover, thespatial location of roads increased thehousehold probability of moving out ofpoverty by 68 percent over the same period oftime. In parallel, rural roads expanded schoolenrolment of children at all levels, andimproved the utilization of public healthservices. Furthermore, Deolalikar found that
the benefits of rural roads are significantlylarger in poorer provinces than in the richerones.38 This finding was also reflected byLarsen, Pham and Rama (2004).
Unfortunately there is no evidence fromVietnam concerning the contribution oftelephone access to poverty reduction. A recentpaper suggests that an extra 10 mobile phonesper hundred people boosts economic growth by0.6%.39 The linkages from phones to growth arethrough shortening the "economic distance" tomarkets (farmers can get a better idea of marketprices, do deals with distant merchants,facilitate job-finding, permit rapid transfer offunds, etc). The telecommunications section ofthis strategy suggests ways to increase ruralaccess to telecommunications services, whichcould thus be expected to help reduce poverty.
Summarizing the available findings, roadand water investments are good means oftargeting particular provinces in which poverty
88
37. Among all types of government spending, the authors found that agricultural research has the largest returnon poverty reduction–for every billion dong spent, 339 poor people would be lifted above the poverty line. Roadinvestment yields the second largest return, with every billion dong spend on roads lifting 132 poor people above thepoverty. Education investment has also favorable returns, with every billion dong spend on education lifting 76 poorpeople above the poverty line.
38. Deolalikar (2001) found that the positive effect of roads on household living standards was more pronouncedamong the poorest provinces and fell rapidly with an increase in provincial level of income.
39. Fuss et al (2004).
Telecommunication access for all
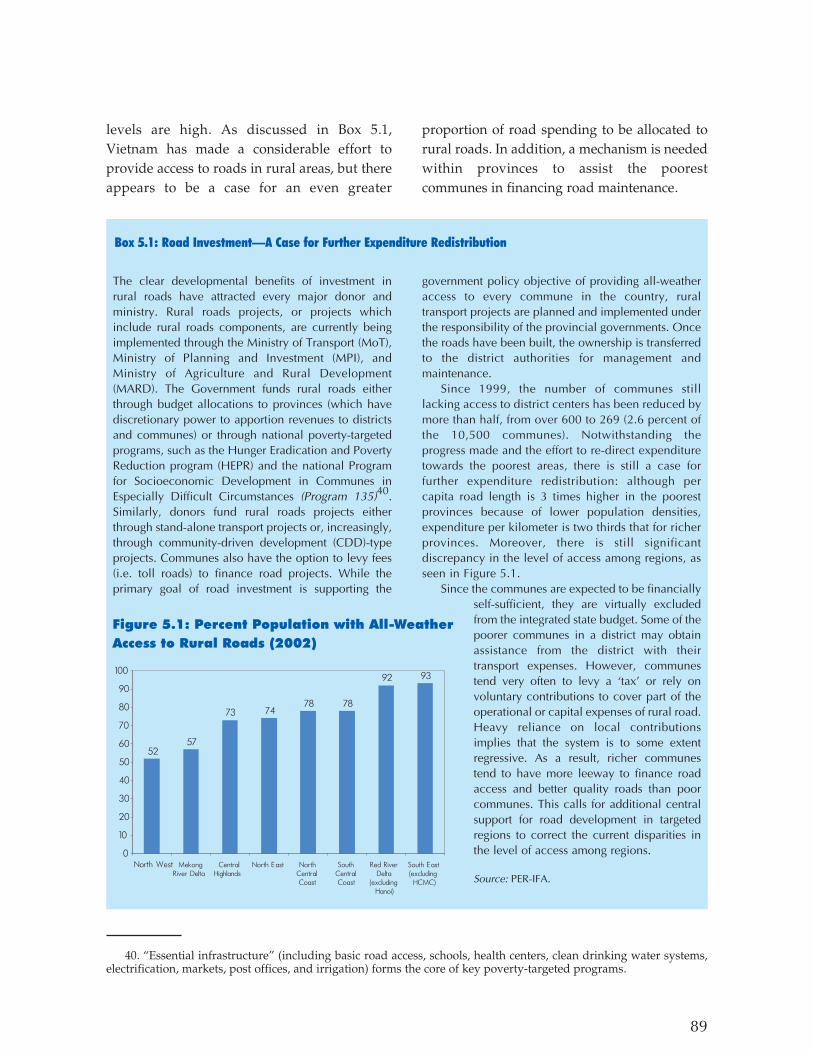
levels are high. As discussed in Box 5.1,Vietnam has made a considerable effort toprovide access to roads in rural areas, but thereappears to be a case for an even greater
proportion of road spending to be allocated torural roads. In addition, a mechanism is neededwithin provinces to assist the poorestcommunes in financing road maintenance.
89
The clear developmental benefits of investment inrural roads have attracted every major donor andministry. Rural roads projects, or projects whichinclude rural roads components, are currently beingimplemented through the Ministry of Transport (MoT),Ministry of Planning and Investment (MPI), andMinistry of Agriculture and Rural Development(MARD). The Government funds rural roads eitherthrough budget allocations to provinces (which havediscretionary power to apportion revenues to districtsand communes) or through national poverty-targetedprograms, such as the Hunger Eradication and PovertyReduction program (HEPR) and the national Programfor Socioeconomic Development in Communes inEspecially Difficult Circumstances (Program 135)40.Similarly, donors fund rural roads projects eitherthrough stand-alone transport projects or, increasingly,through community-driven development (CDD)-typeprojects. Communes also have the option to levy fees(i.e. toll roads) to finance road projects. While theprimary goal of road investment is supporting the
government policy objective of providing all-weatheraccess to every commune in the country, ruraltransport projects are planned and implemented underthe responsibility of the provincial governments. Oncethe roads have been built, the ownership is transferredto the district authorities for management andmaintenance.
Since 1999, the number of communes stilllacking access to district centers has been reduced bymore than half, from over 600 to 269 (2.6 percent ofthe 10,500 communes). Notwithstanding theprogress made and the effort to re-direct expendituretowards the poorest areas, there is still a case forfurther expenditure redistribution: although percapita road length is 3 times higher in the poorestprovinces because of lower population densities,expenditure per kilometer is two thirds that for richerprovinces. Moreover, there is still significantdiscrepancy in the level of access among regions, asseen in Figure 5.1.
Since the communes are expected to be financiallyself-sufficient, they are virtually excludedfrom the integrated state budget. Some of thepoorer communes in a district may obtainassistance from the district with theirtransport expenses. However, communestend very often to levy a ‘tax’ or rely onvoluntary contributions to cover part of theoperational or capital expenses of rural road.Heavy reliance on local contributionsimplies that the system is to some extentregressive. As a result, richer communestend to have more leeway to finance roadaccess and better quality roads than poorcommunes. This calls for additional centralsupport for road development in targetedregions to correct the current disparities inthe level of access among regions.
Source: PER-IFA.
Box 5.1: Road Investment—A Case for Further Expenditure Redistribution
40. “Essential infrastructure” (including basic road access, schools, health centers, clean drinking water systems,electrification, markets, post offices, and irrigation) forms the core of key poverty-targeted programs.
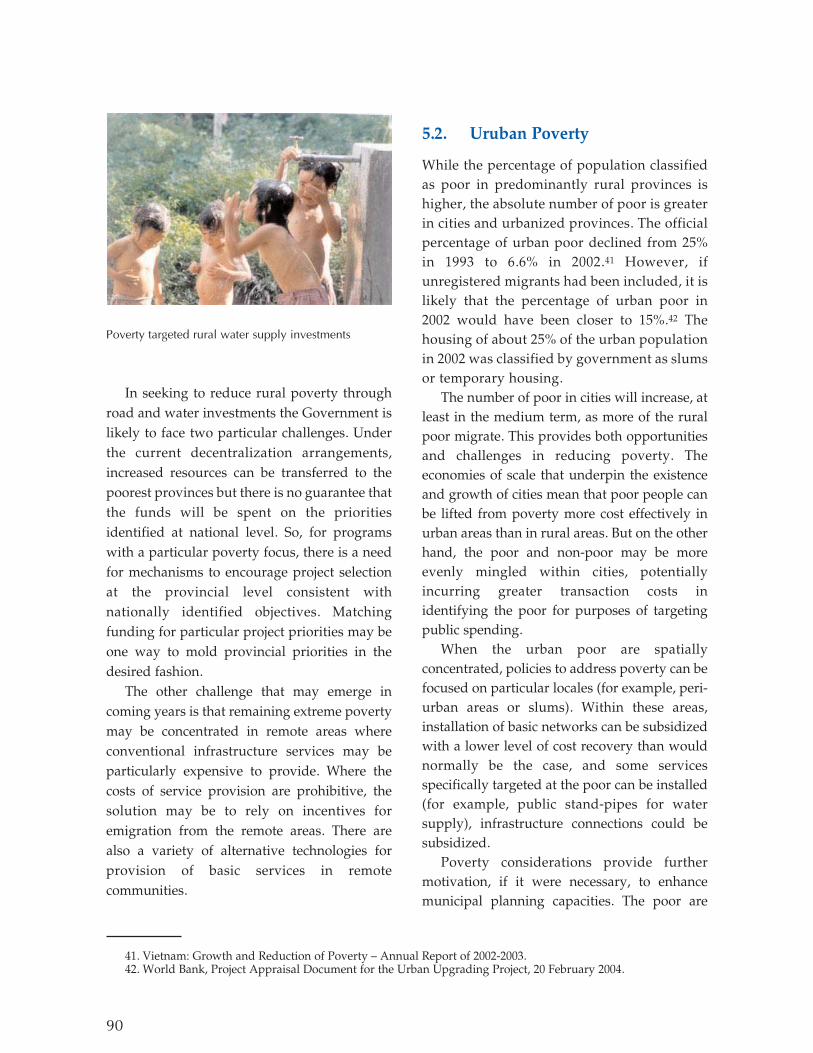
In seeking to reduce rural poverty throughroad and water investments the Government islikely to face two particular challenges. Underthe current decentralization arrangements,increased resources can be transferred to thepoorest provinces but there is no guarantee thatthe funds will be spent on the prioritiesidentified at national level. So, for programswith a particular poverty focus, there is a needfor mechanisms to encourage project selectionat the provincial level consistent withnationally identified objectives. Matchingfunding for particular project priorities may beone way to mold provincial priorities in thedesired fashion.
The other challenge that may emerge incoming years is that remaining extreme povertymay be concentrated in remote areas whereconventional infrastructure services may beparticularly expensive to provide. Where thecosts of service provision are prohibitive, thesolution may be to rely on incentives foremigration from the remote areas. There arealso a variety of alternative technologies forprovision of basic services in remotecommunities.
5.2. Uruban Poverty
While the percentage of population classifiedas poor in predominantly rural provinces ishigher, the absolute number of poor is greaterin cities and urbanized provinces. The officialpercentage of urban poor declined from 25%in 1993 to 6.6% in 2002.41 However, ifunregistered migrants had been included, it islikely that the percentage of urban poor in2002 would have been closer to 15%.42 Thehousing of about 25% of the urban populationin 2002 was classified by government as slumsor temporary housing.
The number of poor in cities will increase, atleast in the medium term, as more of the ruralpoor migrate. This provides both opportunitiesand challenges in reducing poverty. Theeconomies of scale that underpin the existenceand growth of cities mean that poor people canbe lifted from poverty more cost effectively inurban areas than in rural areas. But on the otherhand, the poor and non-poor may be moreevenly mingled within cities, potentiallyincurring greater transaction costs inidentifying the poor for purposes of targetingpublic spending.
When the urban poor are spatiallyconcentrated, policies to address poverty can befocused on particular locales (for example, peri-urban areas or slums). Within these areas,installation of basic networks can be subsidizedwith a lower level of cost recovery than wouldnormally be the case, and some servicesspecifically targeted at the poor can be installed(for example, public stand-pipes for watersupply), infrastructure connections could besubsidized.
Poverty considerations provide furthermotivation, if it were necessary, to enhancemunicipal planning capacities. The poor are
90
41. Vietnam: Growth and Reduction of Poverty – Annual Report of 2002-2003.42. World Bank, Project Appraisal Document for the Urban Upgrading Project, 20 February 2004.
Poverty targeted rural water supply investments

91
likely to be concentrated in areas of newsettlement. Accordingly the burden of non-responsive planning and slow infrastructureprovision in newly settled areas is likely to fallparticularly on the poor. Planning which doesnot recognize the presence of unregisteredmigrants is also likely to have an adverseimpact on the poor.
Where the poor are distributed relativelyevenly within the general urban population,alternative methods of targeting the poorshould be considered. Such alternatives arediscussed in the next section.
5.3 Designing Subsidies
Addressing inequality through investmentplanning is a broad-brush policy: aiding a poorregion through infrastructure investment willaid many individuals who are not poor. Thereare also many poor who live in regions that arerich on average.
A review of Vietnam's subsidy policies inthe infrastructure sectors would be useful, toexamine the cost and targeting effectiveness ofthe existing subsidy mechanisms and toconsider whether those mechanisms could beimproved. In designing any infrastructuresubsidy scheme there is a need to:
● Compare the effectiveness of spending oninfrastructure as a means of alleviatingpoverty as compared with spending oneducation, health, or direct cash transfers(social security).
● Decide whether to subsidize consumptionor connections or both.
● Decide whether subsidies are to bepermanent or simply transitional.
● Determine the financing source: cross-subsidies or budget funded.
● Determine how much the scheme will cost,including administrative costs.
● Assess the scheme on targetingeffectiveness: that all the poor actuallyreceive the subsidies (coverage); and thatpublic funds are not wasted by directingsubsidies to the non-poor (leakage).In comparing between different ways of
helping the poor, it is useful to know how mucheach scheme costs. On this criterion schemeswhich rely on direct fiscal grants can bepreferred to cross-subsidies, because the cost isimmediately obvious to all, based on budgetaryallocations. Where cross-subsidies are used it isdesirable that the implicit cross-subsidies bevalued and noted in public accounts, therebyfacilitating comparison with alternativeschemes.
Before AfterImproving basic infrastructure in low income areas
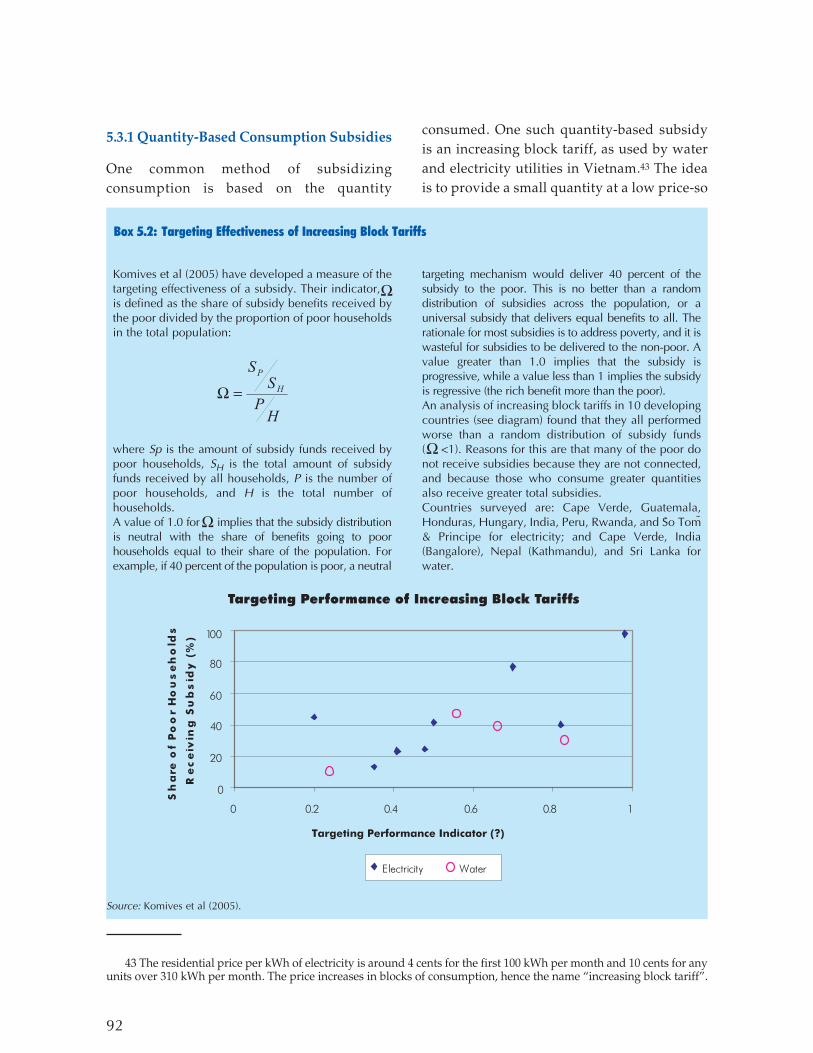
5.3.1 Quantity-Based Consumption Subsidies
One common method of subsidizingconsumption is based on the quantity
consumed. One such quantity-based subsidyis an increasing block tariff, as used by waterand electricity utilities in Vietnam.43 The ideais to provide a small quantity at a low price-so
92
HP
S
S
H
P
��
Komives et al (2005) have developed a measure of thetargeting effectiveness of a subsidy. Their indicator, ,is defined as the share of subsidy benefits received bythe poor divided by the proportion of poor householdsin the total population:
where Sp is the amount of subsidy funds received bypoor households, SH is the total amount of subsidyfunds received by all households, P is the number ofpoor households, and H is the total number ofhouseholds.A value of 1.0 for implies that the subsidy distributionis neutral with the share of benefits going to poorhouseholds equal to their share of the population. Forexample, if 40 percent of the population is poor, a neutral
targeting mechanism would deliver 40 percent of thesubsidy to the poor. This is no better than a randomdistribution of subsidies across the population, or auniversal subsidy that delivers equal benefits to all. Therationale for most subsidies is to address poverty, and it iswasteful for subsidies to be delivered to the non-poor. Avalue greater than 1.0 implies that the subsidy isprogressive, while a value less than 1 implies the subsidyis regressive (the rich benefit more than the poor).An analysis of increasing block tariffs in 10 developingcountries (see diagram) found that they all performedworse than a random distribution of subsidy funds( <1). Reasons for this are that many of the poor donot receive subsidies because they are not connected,and because those who consume greater quantitiesalso receive greater total subsidies.Countries surveyed are: Cape Verde, Guatemala,Honduras, Hungary, India, Peru, Rwanda, and São Tomé& Principe for electricity; and Cape Verde, India(Bangalore), Nepal (Kathmandu), and Sri Lanka forwater.
Box 5.2: Targeting Effectiveness of Increasing Block Tariffs
HPS
SH
P
=Ω
Ω
=Ω
Ω
43 The residential price per kWh of electricity is around 4 cents for the first 100 kWh per month and 10 cents for anyunits over 310 kWh per month. The price increases in blocks of consumption, hence the name “increasing block tariff”.
Source: Komives et al (2005).
that the poor can consume a minimal "lifeline"quantity at a low price-and to set higherprices for subsequent quantities-to assist incost-recovery.
But there are both errors of exclusion andinclusion in these schemes. Frequently thepoorest consumers are not connected toutility services, and so do not benefit fromthe subsidy of the lifeline tariff. And amongthose who do have utility connections, thenon-poor also receive the subsidies for theirinitial quantities so that much of the value ofthe subsidy goes to the non-poor.International evidence suggests that thesesorts of subsidies typically provide the non-poor with a share of total subsidy paymentswhich exceeds their share of the population(Box 5.2). The use of quantity-based subsidiesassumes that the poor consume less than therich. This may not be true if, for example, thepoor have larger families or if poor familiesshare a common connection.
In addition to being poorly targeted,consumption-based subsidies have in practiceoften served to undermine the financial viabilityof infrastructure service providers. Frequently,low quantity consumers pay less than full cost,high quantity consumers pay for theiroperational and maintenance costs, and theenterprise fails to recover full costs. If quantity-based subsidies are to be used, the prices shouldbe calibrated to be consistent with cost-recoveryor explicit budget funding should be providedto fund the subsidized consumption.
5.3.2. Alternative Criteria for Targeting
An alternative to quantity-based consumptionsubsidies is direct means testing. In Chile,households' incomes are assessed based on asurvey in which households interested inreceiving subsidies can take part. The subsidycan cover between 25% and 85% of an eligiblehousehold's consumption of water, up to a
maximum of 15 cubic meters per month. Theproportion of water that is subsidized for eachhousehold is determined by the household'sestimated income. The subsidies are intended toensure that no household spends more than 5%of its income on water. The water companiessend one bill to the household customers andone to the municipal government. Municipalgovernments are given grants by the centralgovernment to cover the cost of subsidies. Theadvantage of this scheme is that there is lessleakage of subsidy funds to non-poorhouseholds than with increasing block tariffs.On the other hand, the transaction costs ofdetermining eligibility are higher than in ascheme where eligibility is determined by thequantity consumed.
In Honduras, Wodon et al. (2003) found thatmore than 80% of the subsidy in a lifelineelectricity consumption program went to thenon-poor. The same study found that housingcharacteristics were a more accurate predictorof poverty than the quantity of electricityconsumed, suggesting that housingcharacteristics would be a better criterion for theallocation of public funds to alleviate poverty.
5.3.3. Connection Subsidies
Connection subsidies are frequently preferredas a subsidy mechanism, since it is usually thepoorest who lack connections to infrastructure,and because the fiscal burden is not recurrent.When taxpayer funds are used to financeinfrastructure connections, Vietnam iseffectively subsidizing connections.
A more targeted subsidy scheme is Program135. Created in 1998, Program 135 provides aseries of grants to finance small-scaleinfrastructure investments, given to the mostdifficult and remote communes. Over 1998-2000around VND 760 billion in grants were spent. Inusing the grant communes can choose from alist of infrastructure projects. Out of 2,274
93

94
proposed projects under the scheme in 2000,39% were for roads, 27% for school building,19% for small-scale irrigation, 7% for watersupply, 5% for electrification, 1% for healthcenter building, and 0.5% for local marketbuilding (Yukio, 2000). Communes obtainingthe grants must have at least 40% of householdsclassified as poor. The Vietnam DevelopmentReport 2004 suggested that the criteria used toidentify poor households are fairly accurate.
Efforts could be made to better targetconnection subsidies to the level of householdswhere there is some attempt at cost recovery forconnections. The existing Hunger Eradication andPoverty Reduction (HEPR) program includes ascheme for the allocation of "poor-householdcertificates" which could be used as a criterion forconnection subsidies. Alternatively, Vietnam couldabandon a policy of subsidizing infrastructuresubsidies and connections, and simply give cash tothose with poor-household certificates.
Connection charges are a barrier to theobjective of expanding access. It is possible totreat the costs of connection as part of theenterprise's general fixed costs, and to recoverthem through consumption prices. This policycan be thought of as a cross-subsidy from thecurrently connected to those who are notalready connected.
Finally, enhanced access to micro-credit canhelp the poor to meet connection charges.
5.3.4. Transitional Subsidies
Some subsidies are designed as transitionalmeasures, typically to give greater time toconsumers to adjust to higher tariffs, or toobtain public acceptance of higher tariffs by firstproviding better services. For example, inGuinea in the early 1990s the governmententered into a 10 year lease agreement for thesupply of water by a private company. Beforereform the price of water was US$ 0.12/m3. Itwas estimated the average tariff would need torise to US$ 0.76 to cover costs. The governmentwas committed to the tariff increases, butwanted them to proceed gradually to lessen thespeed of adjustment for consumers, and also toallow the private sector the time to show serviceimprovements before the tariff increases wereapparent to consumers. During a transitionalperiod of six years, the government paid adecreasing proportion of the consumers' bills.Thus, the private company received the tariffincrease immediately (thus covering its costs),but the effect on consumers was delayed. Thescheme allowed the government to escape froma cycle of recurrent subsidies for consumption,thereby limiting the total cost of the subsidy.
If, for example, municipalities discoverresistance to the current goal of full-costrecovery in water services, or to paying for anincrease in the coverage of sewerage systems, atransitional form of subsidy may help to buildpublic acceptance of higher tariffs.
5.3.5. Output Based Aid
Output based aid (OBA) is a strategy for usingexplicit performance based subsidies tocomplement or replace user fees in the deliveryof basic services (see Box 5.3). A classic OBAscheme involves competitive bidding among
School built under Program 135

95
private operators for the right to provide a service(encouraging cost reductions in serviceprovision), and payment of the subsidy onlywhen the requisite outputs have been achieved
(transferring the implementation risk tothe private sector). OBA is "explicit" inthat it ensures explicit recognition of whythe subsidy is being provided, who isreceiving the subsidy, who is providing it,what activity is being subsidized, and theamount of the subsidy.44 It isperformance-based because it links thepayment of service providers to theirdelivery of specified services, or outputs.This linkage to output transfersperformance risks to the service provider,providing strong incentives to ensure theoutputs are achieved at least cost.
An OBA scheme is being developedfor the Ho Chi Minh City water utility.The scheme would provide incentives tothe utility and its private contractors toreduce leakage and connect targetedpoor customers. The service providerswill be paid for connections made onlyafter demonstrating that leakage levelshave also been reduced.
5.4. Recommendation
Recommended actions are:
44. Contrast OBA with subsidies implemented through increasing block tariffs, where many people may notrealize any subsidy is occurring and would usually be surprised to hear that users with high consumption levelsreceive greater subsidies than low consumers, and where the total amount of the subsidy is very difficult to calculate.
Box 5.3: Output-based Aid: Tying Subsidies to ServiceDelivery for the Poor
Two output-based aid (OBA) schemes, one in Cambodia andthe other in Paraguay, utilize local private operators to deliverwater to the poor. The operators—selected under least-costsubsidy bidding—are assured payment for connecting the poor,but are for the most part paid after service delivery. The twoschemes utilize different forms of targeting—proxy meanstesting and geographic targeting—to help ensure that subsidiesgo to the intended recipients.
In Cambodia, it was decided that subsidies would betargeted directly to individual households: of the 13,000households in the four towns, the 3,000 poorest households (asdetermined by a community-administered survey and verifiedby an independent consultant) would receive a subsidizedconnection. In Paraguay, aguateros (small-scale waterentrepreneurs) which usually only operate in peri-urban areas,teamed together with local construction companies to providewater services to poor rural communities.
In the Paraguay case, un-served rural areas and small townswhere most residents are poor were selected to receive thesubsidies. In addition, the very poorest customers were giventhe option to provide labor during construction as part of theirpayment to the service provider.
(5.1) Develop a subsidy strategy for each infrastructure sector, identifying w hether
subsidies are to be delivered to the poor, and if so, how best to m axim ize the
benefitsofthose subsidies.Ensure across-sectoralassessm entofthese strategies,to
ensure thatthe m ostefficientsubsidy delivery m echanism s are used,and thatthere
isnotunnecessary duplication ofsubsidies across sectors.
(S)
(5.2) Incorporate equity objectives into the planning process, and provide a m eans of
prioritizing projectsand allocating adequatefunds toachieve these objectives.
(M )
(5.3) Develop m echanism s atprovinciallevelto ensure thatadequateroad m aintenance
funding isprovided tocom m unes.
(M )

96
(5.3) Develop m echanism s atprovinciallevelto ensure thatadequateroad m aintenance
funding isprovided tocom m unes.
(M )
(5.4) Review utility pricing schem es to ensure that equity objectives are actually
achieved atm inim um costtothe utilities.
(S)
(5.5) W hen subsidies are used in the delivery of infrastructure services, consider
specifying outputsas the criterion for subsidy (eg num ber ofnew connections,not
am ountofm oney invested)and consider w hether com petition can be used in the
delivery ofthe subsidy (tom inim ize costs).
(M )
t would be difficult to implement all of therecommendations identified in this reportsimultaneously. The Government, as with
governments everywhere, has limited capacitiesto manage reform; some of the reformsrecommended here, particularly thoseadvancing private participation ininfrastructure, may pose political challenges;and some may face public resistance,particularly any recommendations that wouldresult in price increases. The most politicallychallenging reforms can be dealt with usingpilot programs: political difficulties may besurmounted when reform effectiveness can bedemonstrated. In other areas, choosing whichreforms to focus on for early attention, theGovernment could be guided by variouspossible criteria, including:● If Vietnam's businesses are to be
internationally competitive, Vietnam'sinfrastructure should be broadly on par withits regional competitors. Regionalcomparisons can provide a basis forassessing where Vietnam lags. Surveys ofbusiness attitudes can also providesuggestions about the particular areas thatbusinesses find important.
● Some idea of the potential benefit ofdifferent types of reforms can be obtainedthrough basic economic modeling. Suchestimates can suggest which infrastructureindustries are likely to give rise to thegreatest benefits, and hence warrant thegreatest attention. Modeling can also beextended to distributional analysis, to helpGovernment determine who are thewinners and who are the losers fromdifferent reforms.
● Another way of prioritizing reforms is onthe basis of reform bottlenecks: identifyingwhere there is capacity to manage reformsand the complexity that can be managed at agiven time.
6.1 International Competitiveness
Sections 1.2, 2.3.1, and 4.1 present a range ofinternational comparisons, indicating theindustries where Vietnam performs less wellthan its regional competitors. Among the accessindicators presented, Vietnam lags in terms ofsanitation and teledensity. Regional efficiencycomparisons suggest room for improvement interms of unaccounted water,telecommunications labor productivity, theprice of international telephone calls, electricitytransmission and distribution losses, and roadmaintenance financing.
If the government's focus is on businesscompetitiveness, business inputs such astelecommunications and electricity areparticularly important. Inadequate roadmaintenance can reduce competitiveness, byincreasing the time and expense of transportinggoods to market.
An alternative perspective on what isimportant for competitiveness can be providedby business perceptions surveys. The WorldBank's investment climate surveys asked small,medium and large manufacturing businessesabout 18 potential constraints to their businesses.Transport and electricity were ranked the 3rdand 4th most severe constraints. Transport isseen as a major or severe constraint for 24% ofmanufacturing firms, and electricity is a major orsevere constraint for 19%. Transportation is seen
97
6. Reform Prioritization
I

as a greater constraint in Vietnam than inneighboring countries for which these surveyshave been undertaken (see Figure 6.1). Figure 6.2sets out the reasons why infrastructure is rated abusiness constraint, for firms that rankinfrastructure as the most or second-mostimportant constraints on their businesses.
For electricity, the main problems areperceived to be the price and the quality. Sixtypercent of firms consider the price of electricityto be excessive. In fact, EVN isreasonably efficient in terms ofcost, and a requirement forEVN's sustainability is thattariffs cover costs, so that thereis little to be done about theseconcerns in the short term.More significantly, forty-onepercent of firms are concernedabout the poor quality ofelectricity services. Poweroutages and surges areestimated to cost manufacturingfirms the equivalent of 3.2% oftheir sales. About a third offirms have bought generators tocope with EVN's unreliability.On average, generators costaround VND 79 million (US$11,500) each to purchase, andcost VND 1,649/ kWh tooperate (about 10 cents/kWh,or twice EVN's average tariff),so that unreliability imposessubstantial costs even for thosewith generators. These concernssuggest that investment inincreased generating,transmission and distributioncapacity, as well as reductionsof system losses, are the mainpriorities for electricity.
In telecommunications, themain problems are perceived to
be price and quality. As argued in Chapter 4,the best solution to these problems may begreater competition. Greater competition wouldhelp to drive down prices, and would provideconsumers with a choice in the event that theyhad problems with the quality of services fromparticular providers.
6.2 Estimates of Reform Effects
Simple economic modeling techniques can
98
Source: Investment Climate Survey (2005), feedback from firms rating specificinfrastructure sectors as either the 1st or 2nd highest priority for infrastructureimprovements.
Source: Vietnam Investment Climate Survey (2005)

provide an alternative means for thegovernment to determine its reform priorities.Table 6.1 summarizes results from simplemodeling of possible reforms in the water andtransport sectors. The models measure theadditional consumer surplus obtained overseveral years, as a result of hypotheticalreforms. Details of the modeling assumptionsand methodologies are given in the annexes tothe Water Supply and Sanitation Strategy andTransport Strategy volumes.
Care should be taken in interpreting theresults in Table 6.1. The simple models used donot capture the full benefits of the assumedreforms. For example, the results for water donot include public health benefits. The resultsfor road maintenance are calculated on the basisof the value of time saved and vehicle damageavoided, and do not adequately include theboost to growth that is provided by improvedroad networks. More detailed models could,however, be prepared with better knowledge ofspecific reforms proposed in Vietnam.
The purpose of these examples is to illustratethe technique of simple modeling to assist insetting priorities. For tariff reforms,assumptions about the level of prices can bedetermined by reference to existing costbenchmarks, such as the cost of operations,maintenance and new capital costs. For costreductions, assumptions can be made aboutpossible room for efficiency improvements byreference to international experience. Consumerdemand can be simply modeled withknowledge of international estimates of theprice elasticity of demand, the current level ofconsumption, and knowledge of the historicgrowth rate of consumption. Using suchassumptions, an idea can be obtained of therelative magnitude of the benefits of differentsorts of reforms.
The modeling techniques are more difficultto apply to institutional reforms or cross-sectoral reforms. But usually, such reforms canbe mapped into either expanded investments,avoided costs or some sort of cost or price
99
Table 6.1: Benefits of Possible Reforms
Sector Reform Net Present Value of Benefits ($)
Benefits (% GDP)
Water (i) 40% increase in urban water tariffs over 4 years, reinvested to expand water connections.
$2.2 billion 0.7%
(ii) 40% increase in urban water tariffs over 4 years; & 25% decrease in energy costs over 2 years; & reduction in average capital costs to the top performing quartile of water utilities; with extra revenue reinvested to expand water connections.
$5.1 billion 1.3%
Roads (i) a budget adequate to maintain roads in their current condition is spent on maintenance (ie around $73 million annually compared to current expenditure of around $39 million).
$2.5 billion 0.7%
(ii) an optimal maintenance budget (around $93 million) is spent, in which the greatest net benefits of maintenance are achieved.
$6.3 billion 1.8%
Note: The assumed reforms generate a stream of net benefits, which are discounted at the rate of 10% to give the net present value. Benefits as a % of GDP are calculated as the simple sum of the annual benefits, divided by the sum of annual GDPs for the relevant period. Annual GDPs are calculated using the 2003 figure of US$ 39,157 million, projected forward at a growth rate of 7%.

change in individual sectors. For example,institutional reforms that give rise to improvedplanning processes might help to eliminate thesort of problems encountered when SOCBs lentto transport projects that had not yet obtainedfinancing approval. The value of losses incurredby SOCBs and construction companies could becomputed in present value terms, relative to thesituation that would have occurred if theproblematic projects had not been undertaken.
Such a measure could give a sense of the valueof the proposed institutional reform, in terms ofavoiding similar losses in future.
Upper and lower bounds to reform benefitscan be calculated, to give an idea of the range ofpossible reform benefits when the exactoutcome is difficult to determine. A specialistinstitution, such as Australia's ProductivityCommission (Box 6.1), could be established tohelp in the ongoing task of identifying potential
100
In the early 1990s the Council of AustralianGovernments (CoAG), comprising the national, state,and territory governments, established a review ofnational competition policy. The resulting reportrecommended wide-ranging reforms to increasecompetition systematically across the economy. Alsounder consideration by CoAG at the time weresectoral reform programs, including the establishmentof national competitive markets in electricity and gas,implementation of a national approach to roadcharging that would reflect damage to road surfaces byheavy vehicles, and a pricing and trading system forwater resources.
Together, this group of reforms became known asthe National Competition Policy (NCP).Implementation of such wide-ranging reforms hadmany potential benefits and costs, including greaterefficiency, but also possible job losses fromrestructuring, other distributional impacts, and effectson the fiscal relations between the national and sub-national governments.
Prior to agreeing to implement the NCP, CoAGrequested a review of its likely effects from theProductivity Commission, a government body withspecialist economic skills in assessing the effects ofpotential reforms. The Productivity Commission used acomputable general equilibrium (CGE) model toestimate the effects of the proposed reforms. The basicapproach was to assume that greater competitionwould lead to cost reductions as infrastructure andother industries approached international bestpractice. The Commission found the reforms werelikely to increase Australia’s GDP by about 5.5%, an“outer envelope” estimate of likely benefits. This reporthelped to gain inter-governmental support foradoption of the NCP in 1995.
In 1999, political concerns were raised that the
competition policy reforms were having an adverseeffect on rural areas. The same CGE model and “outerenvelope” methodology was used to assess the effectsof a subset of NCP reforms of particular relevance forrural areas. The report presented results disaggregatedby regions. Overall, the report found benefits of 2.5%of GDP from the subset of reforms, and indicated thatcurrent adverse effects felt in rural areas were the resultof economic trends independent of the NCP.
In 2005, the Commission conducted a review ofthe actual effects of the NCP to date. The Commissionfound it difficult to separate the effects of the NCP frommany other factors influencing economic outcomes.To provide a partial indication, the Commissionsought to quantify the economy-wide gains fromproductivity improvements and price changesobserved over the 1990s in the electricity, gas, urbanwater, telecommunications, urban transport, ports,and rail freight sectors. The modeling indicated thatproductivity and price changes had boosted Australia’sGDP by 2.5%.
In many of the sectors studied in 2005, NCP andrelated reforms are acknowledged to have been key,but there have been other influences drivingproductivity improvements so in this sense the benefitsare over-estimated. On the other hand, the modelingdoes not cover all areas encompassed by the NCPreforms; does not include effects since 2000 (theintroduction of a VAT in 2000 complicated analysisafter that year); and does not make allowance for thedynamic benefits of more competitive markets. TheCommission considers that the full benefits areconsiderably larger than the figure obtained from themodeling exercise.
Source: Productivity Commission (2005).
Box 6.1: Modeling the Benefits of Reform in Australia

reforms and measuring their likely effects, notonly in infrastructure but across the economy.
6.3 Capacity to Manage Reform
In every country there is a small handful ofpeople who are closely involved in making themajor reform decisions. Where countries differis in the definition of what is a "major" decision.When the Prime Minister can confidentlydelegate reform decisions to ministers so that allof the details will be sorted out before reformproposals are presented to the legislature, thecountry's reform capacity is multipliedmanifold compared to the situation where thePrime Minister must approve every detail alongthe way. And a much greater reform capacity isobtained where ministers can confidentlydelegate decisions to the bureaucracy,providing only occasional guidance andapprovals on key decisions.
In Vietnam, sectoral ministries can beentrusted to prepare the major outlines ofreforms that will improve the well-being of thecountry's citizens. But as identified in Chapter 2on planning, when cross-sectoral issues arise theGovernment does not have good procedures forensuring that adequate and timely consultationand coordination occur. This is likely to act as abrake on any sectoral reform efforts.
Whatever the existing ability to delegatepolicy-making, as senior decision-makers inVietnam review the priorities for infrastructurereform they must consider the ability of eachinfrastructure ministry to manage multiplereforms. Some of the reforms requirecoordination, requiring a special role for centralministries such as Finance, or Planning andInvestment. Because of the capacity-intensiveness of coordination roles, only a fewreforms requiring coordination can currently beimplemented. These capacity constraints willguide the priorities in choosing which proposedreforms to pursue.
Procedures are required in which inter-departmental consultation occurs prior to high-level decision-making. The consultation shouldbe designed to achieve the greatest consensuspossible at lower levels, highlighting anyremaining areas of dispute for resolution byhigh-level decision-makers. For such a systemto work, lower level bureaucrats must developpolicy skills so that ministers can haveconfidence that results presented to them willnot require re-visiting. In turn this requires thatbureaucrats are taught to question existingpolicies, to compare them with potentialalternatives, and to identify welfare-maximizing policies. The possibility ofquestioning policies may pose difficulties. Butthe alternative is limited policy skills in thebureaucracy, limited ability to delegate thedevelopment of policies, and a limited numberof reforms that can be developedsimultaneously.
6.4 Principal Reform Priorities
Supposing that each relevant ministry iscapable of managing at least one major reformpriority, combined with insights from the othertwo suggested methodologies for assessingpriorities, provides a basis for identifying thosepriorities.
6.4.1 Central Ministries
In the central ministries of Finance, Planningand Investment, and Construction, a majorpriority should be the development ofimproved mechanisms for project selection,monitoring, and evaluation. The centralministries could take the lead in cross-sectoralcapacity building to improve the quality ofproject feasibility studies and monitoring andevaluation activities. The aim should be toobtain high quality economic analysesindicating expected and attained rates of
101
economic return. These estimates should beused as central criteria in selection of projectsfor public financing approval.
Chapter 3 has highlighted the need for abetter integration of financial planning withother aspects of planning. A mechanism needsto be found by which available taxpayer fundsare allocated to infrastructure projects wherenecessary, by which taxpayer funds are notinvolved where not intended, and whichprovides financing alternatives for sociallyprofitable investments where taxpayer fundingis not required. These processes should be tiedto results frameworks providing strategies thatlink individual projects to development goals,and which should be prepared by sectoralministries.
Reforms of capital markets identified inChapter 2 will require a series of reforms, manywithin the responsibility of the Ministry ofFinance. Among these reforms, preparing theway for private infrastructure investment is aparticular priority, given the proposedimportance of the private investment in theelectricity sector and for its potential role infinancing and improving efficiency in othersectors. Here the Ministry of Planning andInvestment will have a key role. Reform of theBOT legal framework is one step, but muchbetter project preparation and improvedregulatory institutions will also be required.Efforts to build regulatory expertise could beginwith improved emphasis on rules-basedregulation within the public sector.
6.4.2 Line Ministries
Each ministry responsible for an infrastructuresector should prepare a results framework forthe sector, linking development goals,strategies, and key performance indicators. Anyproposed investment projects should bemapped into at least one of the identifiedstrategies. These results frameworks would
help to improve the overall alignment ofVietnam's investment approvals process withits socio-economic development goals.
A major challenge for the TransportMinistry is to develop institutions that canmeasure maintenance needs, procuremaintenance services at least cost, and ensureadequate financial resources to pay for theseservices. There are numerous indications thatinadequate attention is being paid tomaintenance, with very high returns availablefrom spending on maintenance. But improvedinformation is the first step towardsrecognizing and resolving the problem.
In electricity the greatest challenge isproviding sufficient capacity to satisfy growingdemand. While the magnitude of the publicinvestment program will increase relative toearlier years, the bigger challenge will beattracting large scale private investment in IPPs.The Ministry of Industry needs to put majorefforts into project preparation, ensuringcompetitive international bidding, and ensuringan appropriate allocation of risks between thepublic sector and investors.
The telecommunications industry hasbecome a highly competitive, privatelymanaged industry in many, if not most,countries around the world. Competitiveindustries have outperformed state monopolieson a host of measures. The reform priority intelecommunications for Vietnam should beincreasing the level of competition, throughincreased private sector involvement andimproved regulatory arrangements ensuringappropriate terms of access to VNPT's network.
In water and sanitation, the priorities aredriven by Vietnam's development objectives.Table 2.3 of the Water Supply and SanitationStrategy volume sets out different targets foraccess to improved water and sanitation, definedby Government sector strategies, the CPRGS, theVietnam Development Goals, and theGovernment's Environment Strategy. Whichever
102

103
of these targets is sought, much greaterinvestment is required in the sector. Tariffincreases for water will help in meeting theinvestment needs for water services. But privatewillingness to pay for sanitation is significantlyless than the public benefits. There is justification
for an increased role for public financing ofsanitation and wastewater treatment. Enforcingthe new obligations to increase water tariffs is thehighest priority in the sector, but the next priorityis obtaining higher state budget funding forinvestment in sanitation.
Roads
National roads are managed by the Ministry ofTransport, with half delegated to ProvincialDepartments of Transport. Local roads aremanaged by District Departments of Transportand Commune People's Committees.
Competition is used to procure roadconstruction, but the competition is betweenstate-owned companies who use the samenorms to prepare their bids, and typicallyprepare similarly priced bids. This suggestseither collusion in their bids or that a greaternumber of competitors is required to producevigorous competition.
Competition for the market can be introducedfor toll roads (to construct and/or simplymaintain roads), either through direct tolls or"shadow tolls" in which the government pays theoperator for each vehicle that uses the road. Suchcompetition can be used to lower the total cost ofroads since the toll road operator has an incentiveto find the optimal mix between construction andmaintenance costs-lower construction standardsimply higher maintenance costs.
Railways
Vietnam Railways Administration (VNRA)under the Ministry of Transport developsinvestment plans. Vietnam RailwaysCorporation (VNR) operates 2 passengercompanies, 1 freight company and a group ofregional infrastructure administrations. There isthus no competition within Vietnam's railwaysindustry, although the railways as a whole face
competition from the road industry. Internationally, "competition for the market"
has been introduced in many countries throughconcessions for regional railway companies. Inthe United Kingdom the railways infrastructure(the rails and stations) have been separated intoa separate company to allow for competitionbetween service companies (operating thelocomotives and carriages) over the same lines.This introduction of direct competition has beencontroversial, because there are economies ofcoordination of rail operation and serviceoperation in a vertically integrated company.An alternative approach with the sameobjective of competition between serviceoperators is to retain a vertically integratedentity, but to impose a duty to provide thirdparty access to new service operators.
Vietnam is currently debating the choicebetween separating infrastructure from trainservices, or whether simply to oblige VNR toprovide access to its network for third partyoperators.
Waterways
Vietnam has 8,000 km of commercialwaterways, 70% of which are managed byVietnam Inland Waterways Administration,with the remainder managed by provincialDepartments of Transport and Departments ofAgriculture. Ports and landing stages areoperated by provinces. Management of largebarges is a mix of private and SOE, whilesmaller boats are usually privately operated.There is little charging for the use of waterway
104
ANNEX 1 Scope for Greater Competition
in Infrastructure Sectors

105
infrastructure, limiting the scope forcompetition.
The importance of internal waterways inVietnam is rare internationally, so there isrelatively little international experience to drawon. While not physically impossible,concessioning of stretches of waterways wouldpose great practical difficulties in gatheringrevenues to cover maintenance and ongoinginvestment. More promising as revenue-raisingdevices is higher charging for use of ports andfor boat registration, measures that do notrequire competition for their introduction.Maintenance contracts should be procuredcompetitively.
Ports
Vietnam has 80 ports. The major ports of HaiPhong, Danang, Saigon and Can Tho areoperated by VINALINES, while smaller portsare operated by VINAMARINE, both of whichare SOEs. Limited competition exists in theindustry. Consideration is being given to thedevelopment of a deep sea port to serve Ho ChiMinh City, and the development of a trans-shipment hub.
International experience illustrates severalmechanisms for introducing competition intothe port sector. Competition for the market canbe introduced by concessioning individualports to the firm offering the highest sum to thegovernment, or lowest tariff for shippers. Withadequate surface linkage multiple ports cancompete directly with each other. For example,Ho Chi Minh City could be served from SaigonPort or by shipping to Can Tho and completingthe journey by rail or road. Finally, in largeports with multiple terminals, individualterminals concessioned to private operators cancompete directly with each other. In general,direct competition yields greater performanceimprovements than competition for the market.
At present the introduction of competitioninto the ports sector is not on the agenda. Itwould be possible to concession a major port ona pilot basis. The presence of alternative portswould serve as a safeguard in the case of failure,but it is more likely that the introduction of astrong competitor would stimulateimprovements in regional port performance.
Electricity
A high level of competition is possible inelectricity markets, with the most advancedcountries possessing spot wholesale markets inwhich the price of electricity and dispatch orderis determined every few minutes bycompetition between multiple generatingcompanies, and individual households canchoose their supplier of electricity.Transmission and distribution remain regulatednatural monopolies in all systems. Competitionin generation and retail supply eliminates theneed for governments to regulate these prices.Moreover, price serves as a signal of impendingcapacity constraints, inducing new investmentwhen required. The hope is that market signalswill provide for more efficient capitalexpenditure than public sector planning, but itis probably too early to evaluate the strength ofthis claim since such highly competitivemarkets have not been operating for long, andonly in a few countries.
Vietnam is a long way from such a businessmodel. Competition has been introduced in aminimal way through competitive bidding foran independent power producer (IPP) at PhuMy 2.2. In this model the "single buyer" (EVN)signs a long term "power purchase agreement"(PPA) with the private firm that bids to provideelectricity at the lowest price. In this waycompetition helps to lower the price ofelectricity obtained by EVN. IPPs also help indiversifying financing sources. EVN plans in

coming years to procure around 50% of therequired new generating capacity using IPPs. Itmakes sense for Vietnam to expand the use ofIPPs in procuring expansion of generationcapacity, but greater use of competitive biddingshould be used in procurement than in the past,and as mentioned in the financing section, tariffincreases are needed to ensure that EVN has thefinancial capacity to pay for the procuredelectricity.
Vietnam has plans for the introduction ofgreater competition in three phases. In the firstphase, commencing in 2009, generators wouldbid to sell electricity into a power pool, withEVN as the single buyer. In the second phase,commencing around 2014, large consumerssuch as distribution companies or majorindustrial firms would be given the right tomake bilateral contracts with generators,avoiding EVN as the single buyer. And in thethird phase, commencing around 2022, retailcustomers would be given the right to choosetheir supplier of electricity.
The competition provided by these reformswill unleash strong forces for efficiencyimprovements in the electricity sector, in bothoperations and in system expansion. But therewill be several difficulties in managing thistransition. In moving to competitivelydetermined prices for electricity in a situation ofcapacity shortage, market prices are likely to bevery high resulting in large rent transfers to thegeneration companies. In the short term there isa need for considerable investment in capacity,and IPPs will be needed to help supply thecapacity. But IPPs require reassurance about thetariffs they will receive. Plans to move touncertain competitive pricing may deter privateinvestment (notwithstanding that those tariffscould be quite high). Finally, the current plansseem to envisage ongoing ownership by EVN ofgeneration assets. It is not credible to expectequal treatment of its generation subsidiaries by
EVN in its role as single buyer. EVN's conflict ofinterest would deter private investment incompeting generation companies. Thesetransitional challenges are discussed in moredetail in the Power Strategy volume.
Telecommunications
Internationally, mobile telecommunicationsand even fixed line telephony have becomehighly competitive industries. Unfortunately,Vietnam is lagging behind international best-practice. State-owned VNPT dominates thesector, with a 90-94% share of the entiretelecommunications market (includingsegments such as equipment construction andinstallation). It dominates fixed line telephonyin all its forms: local, long-distance, leased linesand international services, and through twosubsidiaries, Vinaphone and Mobifone,dominates mobile telephony as well.
Nevertheless there is an official intention topromote competition. Vinaphone andMobifone, despite a common parent, do seem tocompete, perhaps in part because they havebusiness cooperation contracts with differentforeign partners. Four SOEs have been licensedto enter fixed and mobile markets: SPT, HanoiTelecom, Viet Power Telecom, and Viettel.These four companies already have a smallpresence in the fixed line market, because theyhave traditionally had their own privatenetworks. They are just beginning in the mobilemarket. SPT is present in Ho Chi Minh Cityonly, and is 18% owned by VNPT; HanoiTelecom is present only in Hanoi; Viettel is anSOE owned by the military; and Viet PowerTelecom is owned by EVN, the electricityutility.
It is perhaps too early to judge the recentintroduction of competition from SOEs. Butprogress is likely to be slow with VNPTdominating the market. The success ofinterconnection regulation will be crucial to
106
107
the success of the new entrants, since if thedominant firm refuses or impedes access toits network, customers of new entrants willhave few numbers they can call. There iscurrently no transparent process to set orappeal interconnection disputes or rates. Italso remains to be seen whether competitionbetween SOEs can be maintained. In arapidly growing market, risks of businessfailure are lessened, but failures can stilloccur. There is little reason for thegovernment to bear this risk.
Stronger levels of competition, and hencegreater likelihood of efficient services and rapidgrowth in consumer access, could be achievedby further opening the market to privateinvestors, including foreign firms. Through aBilateral Trade Agreement, United States firmshave gained preferential access to Vietnam'stelecommunications market. It is intended thatother nationalities will obtain access to themarket in the context of Vietnam's plannedWTO accession, possibly in 2006. But even theaccess obtained by United States firms isunnecessarily restrictive. Although US firmsalready have the right to up to 50% ownershipof firms offering value-added telecoms andinternet services, few firms have entered thesemarkets. For mobile and fixed line services US
ownership is capped at 49% and 45%respectively, so even less investor interest canbe expected when these markets open at the endof 2005 and 2006 respectively. Investors preferto control management decisions if they are toinvest large sums of money.
Water and Sanitation
The main possibility for the introduction ofcompetition in the water and sanitation sector isthrough competition for the market (e.g. formanagement contracts, leasing, or concessions).Internationally, concessions and leases haveheld great promise for water supply systems,but have been difficult to implement in practice.Fewer difficulties seem to have beenencountered in the concessioning of bulk watertreatment plants, and indeed Ho Chi Minh Citysigned a BOO contract for the construction of anew water treatment plant (Thu Duc) in March2005. Smaller water distribution systemsoperated by independent operators in Vietnamtypically have not been competitively bid, butcommunities could, in principle, usecompetitive bidding. Direct competition ispossible in the water vending market, althoughvendors typically provide service at a highertotal cost than piped water.

Benchmarking
A light-handed form of regulation consists ofpublicly revealing information, so that thepublic can compare their service provider withservice providers elsewhere in the country. Forinstance, publicly revealing the price of water atutilities across the country can motivateconsumers and local officials to ask why theirutility charges high prices, and to push forimproved efficiency to keep costs down. Thissort of regulation does not rely onbureaucratically mandated pricing, simply onpublic pressure. It can create a sort ofcompetition between utilities, whose managerswould like to be ranked as among the best in thecountry. Benchmarking can be applied wherethere are many firms providing similar services.
A benchmarking program is currently runby the Water Supply Association, and appearsto have been helpful in generating performanceimprovements across the country. Similarprograms would be possible for ports and forelectricity distribution businesses. Greaterattention could also be applied to internationalcomparisons as a spur to improvedperformance.
Price Regulation
Left to their own devices, infrastructuremonopolies could set prices well above cost, inorder to maximize their profits. To protectconsumers from this abuse it is usual to fixprices by regulation. The challenge is to setprices as low as possible to maximize the social
benefits of service provision, whilesimultaneously preserving the financialsustainability of the service (that is, stillallowing a "normal" profit for the firm). Manycountries have found it politically attractive toset infrastructure prices below cost, but havethen struggled to finance maintenance and newinvestment. Accumulated internationalexperience suggests the fundamentalimportance of setting cost-covering tariffs.
In recent years Vietnam has generally shiftedinfrastructure prices towards cost-recoverylevels-at least to the level of operations andmaintenance costs, in industries in which pricesare charged. The challenge for the future is togain a greater contribution from users towardsinvestment costs, to reduce the fiscal burden ofinfrastructure investment. There is an efficiencyreason for doing so: taxes distort the economyand impose deadweight losses over and abovethe direct cost of taxation to consumers. Byshifting the burden to user payments thesedeadweight losses are avoided. Simultaneously,imposing additional costs on consumersreduces demand and hence the total cost ofservice provision, reducing the financingrequirements.
Once cost recovery, including capital costs, isbroadly achieved, price regulation can be usedas a tool for providing incentives for improvedefficiency, particularly for private operatorswho are sensitive to profit. Box 4.3 discussesbroad approaches to setting prices. Rate-of-return regulation provides weak incentives tooperators to reduce their costs, because theyearn the same rate of profit regardless of system
108
ANNEX 2Infrastructure Regulation

performance. In fact, it may lead to a systemwith excessive capital investment, becausegreater investment leads to a higher total profit.On the other hand, there is uncertaintyassociated with the periodic re-setting of price-caps, and this uncertainty leads to a higher costof capital. This higher cost of capital needs to bereflected in higher initial tariffs. Internationally,the tendency seems to be to favor price-capregulation, since the long-term cost reductionsare judged to outweigh any initial riskpremium.
Standard discussions of price regulationtend to focus on the overall level of consumertariffs. For purposes of financial sustainabilityand investor interest this is clearly veryimportant. But there are also many possibletariff structures that can achieve any given levelof revenue. Depending on how tariffs arestructured (eg decreasing/uniform/increasingblock tariffs, connection charge versus volumecharge) differing levels of consumer welfare canbe achieved. Setting price structures to ensurethat for a given level of revenue the greatestsocial welfare is achieved (potentially includinga welfare weighting for poor consumers) is asubject that is well treated in theoreticaleconomics but has been neglected by regulatorypractitioners. Nevertheless, specialist skillsrequired for this task can be contracted and theinformation requirements are not impossible.Generating welfare improvements throughprice structure changes simply requires utilitiesor governments to take an interest in the issue.This sort of reform does not rely on utilities'profit incentives, and is thus equally as relevantfor public and private regulated firms.
Regulation of Quality
Regulation of the quality of infrastructureservices can take many forms, such as minimumoutput standards (eg hours of service, waterpressure, water quality), input standards (e.g.,
type of wiring to be used, qualification oftechnicians, vehicle safety inspections),environmental standards, provision ofinformation to consumers, or liability forunsatisfactory services. Usually, higher qualitystandards imply higher costs. Quality standardsmay be particularly important when privateoperators are employed, because cutting qualitycan help to lower costs and improve profits.Where such temptations exist, it is importantthat an appropriate effort be devoted to qualityinspection and enforcement. It is important,however, that cost implications be consideredwhen quality standards are devised. Settingquality standards at a level desired by the urbanelite may render services unaffordable to themajority of the population.
Regulatory Institutions
In any regulatory system there is a need tomonitor and enforce compliance with the rules.In even the most rigid regulatory system withclear rules on performance standards and howprices should be calculated, there is a need forspecialist staff with skills in areas such asauditing, accounting and law. In mostregulatory systems there is also an element ofdiscretion, in areas such as how prices shouldbe set (see Box 4.4), what firms should beallowed to enter a market (eg the licensing andallocation of spectrum to new mobileoperators), or in deciding appropriate technicalor environmental standards. In such systems,there is a need to supplement monitoring andenforcing skills with policy skills, includingeconomic analysis to determine the potentialsocial costs and benefits of alternative policies.
Where private investment is sought, theinternational tendency is to entrust the exerciseof discretion to specialist regulatoryinstitutions, independent of both ministers andregulated firms. While ministries design theoverall system, decisions within the rules are
109
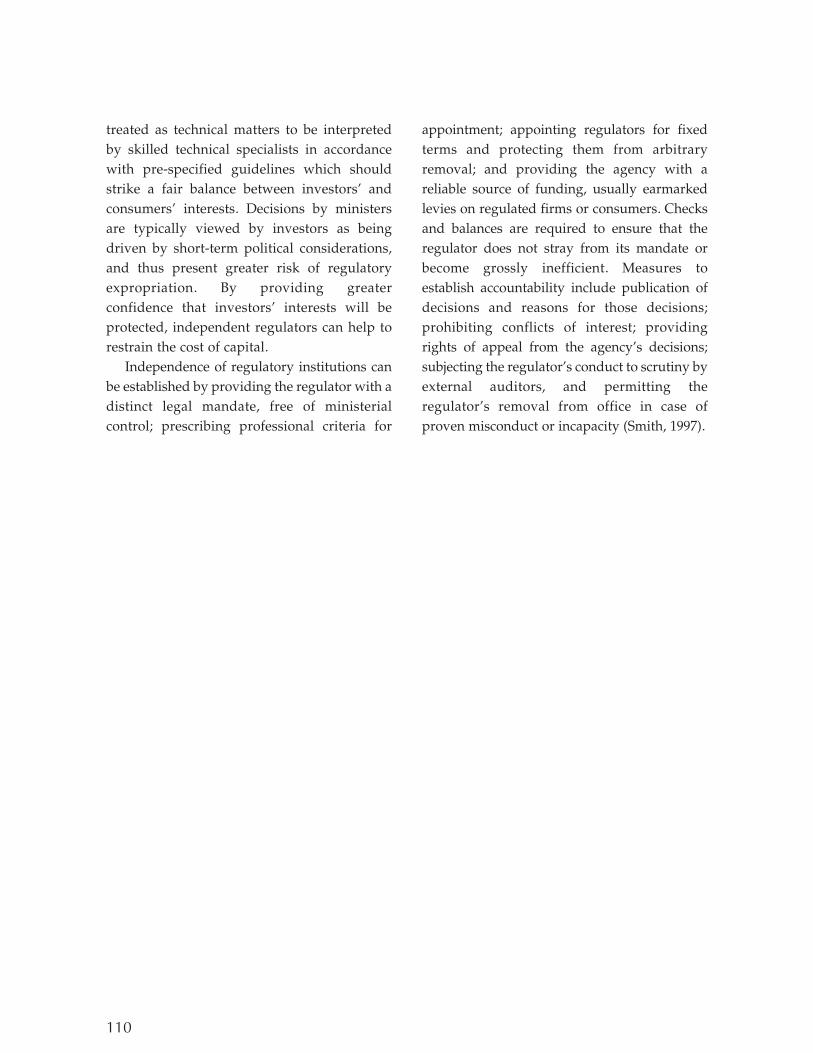
110
treated as technical matters to be interpretedby skilled technical specialists in accordancewith pre-specified guidelines which shouldstrike a fair balance between investors' andconsumers' interests. Decisions by ministersare typically viewed by investors as beingdriven by short-term political considerations,and thus present greater risk of regulatoryexpropriation. By providing greaterconfidence that investors' interests will beprotected, independent regulators can help torestrain the cost of capital.
Independence of regulatory institutions canbe established by providing the regulator with adistinct legal mandate, free of ministerialcontrol; prescribing professional criteria for
appointment; appointing regulators for fixedterms and protecting them from arbitraryremoval; and providing the agency with areliable source of funding, usually earmarkedlevies on regulated firms or consumers. Checksand balances are required to ensure that theregulator does not stray from its mandate orbecome grossly inefficient. Measures toestablish accountability include publication ofdecisions and reasons for those decisions;prohibiting conflicts of interest; providingrights of appeal from the agency's decisions;subjecting the regulator's conduct to scrutiny byexternal auditors, and permitting theregulator's removal from office in case ofproven misconduct or incapacity (Smith, 1997).

ADB (2003), Project Performance AuditReport on the Saigon Port Project (Loan1354-VIE[SF]) in the Socialist Republicof Vietnam. (March).
ADB, JBIC & World Bank (2005), ConnectingEast Asia—A New Framework forInfrastructure, Washington.
ADB & OECD (2000). Anti-Corruption ActionPlan for Asia and the Pacific.
Available at: http://www1.oecd.org/daf/asiacom/ActionPlan.htm#impcyc1.
ADB & OECD (2004), Anti-CorruptionPolicies in Asia and the Pacific: Self-Assessment Report Viet Nam. Availableat: http:// www1.oecd.org/daf/ASIAcom/countries/index_VTN.htm.
Albouy, Yves and Reda Bousba (1998). “TheImpact of IPPs in Developing Countries– Out of the Crisis and into the Future,”Public Policy for the Private Sector NoteNo. 162, World Bank.
Brixi, Hana (2005), “Addressing ContingentLiabilities and Fiscal Risk” in Anwar Shah(ed), Fiscal Management, World Bank.
Commonwealth of Australia (1998), Asia’sInfrastructure in the Crisis – HarnessingPrivate Enterprise.
Deolalikar, A. (2001). “The SpatialDistribution of Public Spending onRoads in Vietnam and Its Implications.”Manila: ADB. September.
Economic Planning Unit (2004),“Development Planning in Malaysia”,available at http://www.epu.jpm.my
Fan, Shenggen, Pham Huong Lan, TrinhQuang Long (2004), Government
spending and poverty reduction inVietnam. Project report prepared for theWorld Bank funded project “Pro-poorspending in Vietnam”, by InternationalFood Policy Research Institute,Washington DC, and Central Institutefor Economic Management, Hanoi.
Fuss, Melvyn, Meloria Meschi and LeonardWaverman (2004), “Development andTelecoms Infrastructure: Calling UpGrowth.”
Holmes, Malcolm & Alison Evans (2003), “AReview of Experience in ImplementingMedium Term ExpenditureFrameworks in a PRSP Context: ASynthesis of Eight Country Studies,”Overseas Development Institute,London.
Irwin, Tim and Chiaki Yamomoto (2004),“Some Options for Improving theGovernance of State-Owned ElectricUtilities,” Energy and Mining SectorBoard Discussion Paper No. 11, WorldBank.
Komives, Kristin, Vivien Foster, JonathonHalpern & Quentin Wodon (2005),Water, Electricity and the Poor: WhoBenefits from Utility Subsidies?, WorldBank.
Larsen, Theon Ib, Pham Huong Lan, andMartin Rama (2004), “The Impact ofInfrastructure Development on RuralPoverty Reduction in Vietnam”.Unpublished. World Bank.
Le Houerou, Philippe & Robert Taliercio,“Medium Term Expenditure
111
References

Frameworks: From Concept to Practice.Preliminary Lessons from Africa,”Africa Region Working Paper SeriesNumber 28, World Bank.
Megginson, William L. and Jeffrey M.Netter (2001), “From State to Market: ASurvey of Empirical Studies onPrivatization” Journal of EconomicLiterature 39(2) pp.321-389.
Mo P.H. (2001), “Corruption and EconomicGrowth,” Journal of ComparativeEconomics v.29, pp.66-79.
Pellegrini L. and R. Gerlagh (2004),“Corruption’s Effect on Growth and itsTransmission Channels,” Kyklos, v.57,Fasc. 3, pp.429-456.
PDP Australia Pty Ltd & Meyrick andAssociates (2005), Promoting Efficientand Competitive Intra-ASEAN ShippingServices—Vietnam Country Report,REPSF Project No. 04/001.
Available at http://www. aseansec.org/17485.htm.
Productivity Commission (2005), Review ofNational Competition Policy Reforms,Report No 33, Canberra.
Sarraf, F. (2005) “Integration of Recurrentand Capital ‘Development’ Budgets:Issues, Problems, Country Experiences,and the Way Forward,”Implementation Note, July. WorldBank, mimeo. Available atwww.pefa.org.
Smith, Warrick (1997). “Utility Regulators—The Independence Debate,” PublicPolicy Notes for the Private Sector, NoteNo. 127 (October), World Bank.
Socialist Republic of Vietnam & World Bank(2005), Vietnam: Managing PublicExpenditure for Poverty Reduction andGrowth. Public Expenditure and IntegratedFiduciary Assessment (PER-IFA),Financial Publishing House.
Thanh Nien News (2006), PMU 18. April 5.United Nations High Commissioner for
Human Rights (UNHCHR) (1998),Written statement submitted by theInternational Federation of Human RightsLeagues, Document E/CN.4/Sub.2/1998/NGO/27, 4 August.
Available at http://www.unhchr.ch/Huridocda/Huridoca.nsf/.
United Nations Commission onInternational Trade Law (UNCITRAL)(2004), Model Legislative Provisions onPrivately Financed Infrastructure Projects,United Nations, New York.
USAID (2005), Competition Review of theVietnamese Telecom Sector, VNCI PolicyPaper #3.
Vietnam Economy (2005), SOE equitisationfell short of 2004 target. January 5.Available at:
http://www.vneconomy.com.vn/eng/index.php?param=article&catid=05&id=050105141202
Vietnam News (2004), VNPT Probe UncoversNo Sign of Corruption, November 10.
Available at http://vietnamnews.vnagency.com.vn/2004-11/09/Stories/06.htm
Vietnam Today (2002), Corruption in VietnamToday, April 13.
Available at: http://www.vietquoc.com/news2002/na041302.htm
Vietnam Trade (2004), Minister Told toReview Responsibility for Misconduct inVNPT, November 8. Available at
http://www.info.vn/index.php?news=1&id=2&nid=2041&lang=en&start=300&archive=.
Warford, Jeremy (2004). “InfrastructurePolicy and Strategy in the East Asia andPacific Region: Environmental andSocial Aspects,” Background paper forADB, JBIC & World Bank (2005).
Warlters, M. & E. Auriol (2005). “TheMarginal Cost of Public Funds in
112

113
Africa”, Policy Research Working PaperNo.3679, World Bank.
Wodon, Q., M.I. Ajwad, & C. Siaens (2003).“Lifeline or Means-Testing: ElectricUtility Subsidies in Honduras,” in P.Brook & T. Irwin, Infrastructure for PoorPeople: Public Policy for Private Provision.Washington D.C., World Bank.
World Bank (1997), Clear Water, Blue Skies:China’s Environment in the 21st Century.
World Bank (1998), Public ExpenditureManagement Handbook.
World Bank (2004), Indonesia – Averting anInfrastructure Crisis: A Framework forPolicy and Action.
Yukio (2000), Poverty Alleviation Policies andEthnic Minority People in Vietnam,mimeo. Available at http://www.st-edmunds.cam.ac.uk/vhi/sen/papers/ikemoto.pdf
Zita, Ken (2005), South East Asia: TelecomBrief.
Available at http://topics.development-gateway.org/ict