vietnam airline ipo presentation (english) 2014
TRANSCRIPT

Company report
Vietnam Airlines

Content 4 About the IPO
4 The airline industry outlook
4 Vietnam Airlines
4 Financial Analysis
4 Operating forecast and Valuation

About Vietnam Airlines IPO
Par value 10,000 VND
Number of shares 49,009,008 shares
Offering price 22,300 VND per share
Offering proportion 3.475% of total charter capital
� The State
� IPO
� Strategic investors
� Employees
� Company Union75%
3.475%
20%
1.475% 0.05%

The Airline industry outlook
4Signs of recovery
4Vietnam’s advantageous location in a dynamic airline market
4Fast-paced growth of investments and tourism
4 Improved living standards in Vietnam

Signs of recovery Revenues growth and profit margins of the global airline industry
-6%
-4%
-2%
0%
2%
4%
0
200
400
600
800
2004 2005 2006 2007 2008 2009 2010 2011 2012 2013
Doanh thu Biên lợi nhuận gộp � Revenue (billion USD) � Profit margin Source: IATA
Take off, again: The global airlines industry saw growth after the economic downturn

Growth rates of world air transport markets
2%
11%
7%
4%
8%
7%
1%
13%
10%
5%
6%
8%
0% 2% 4% 6% 8% 10% 12% 14%
Bắc Mỹ
Trung Đông
Châu Mỹ
Châu Âu
Châu Á Thái Bình Dương
Châu Phi
Source: IATA � 2012 � 2013
Signs of recoveryAfrica
Asia-Pacific
Europe
America
Middle East
North America
Locational advantage: Vietnam is located in Asia Pacific, the 2nd fastest growing air transportation market

Dominant: Vietnam Airlines holds the largest market share of international on international routes, leading by a wide margin.
Vietnam Airlines’ positionMarket share of Vietnam Airlines’ international passenger operations
40.6%
59.4%
� Vietnam Airlines � Other
Revenue structure of Vietnam Airlines’ international transportation
12.10%
46.35%
21.94%
5.00%
14.61%
� Europe � North East Asia � South East Asia
� Australia � CLMV
Source: CAPA Source: Vietnam Airlines
Domestic market 4Accelerated growth in the tourism industry
4Large population and improving income per capita
4Stable growth of FDI capital
Vietnam Airlines 4The National Carrier of Vietnam
4A dominating market share of 51.8%
4Carried 15 million passengers and 184,606 tons of cargo, operating on 39 domestic routes and 52 international routes in 2013

An integrated value chain
Vietnam Airlines
Airline serVices Airline-relAted businessesAirlines

Investment highlights 4Valuable tangible and intangible assets
42014-2018 business plan with an emphasis on effi ciency
4Robust subsidiaries and affi liates

Operating Performance

Market sharePassenger operations
4 Revenue reached VND45,407 billion in 2013 (+5% yoy), accounting for 86% of Total revenue.
4 Vietnam Airlines dominates 51.8% of the total market share (63.2% of the domestic flights and 40.6% of the international flights).
Passenger revenue and volume
19 1827
3443 45
4
8
12
16
15
30
45
60
2008 2009 2010 2011 2012 2013
� Revenue (in thousand billion VND � Passenger volume (in million)

Market shareCargo operations
4 Revenue slightly rose to VND 4,377 billion in 2013, 8% of Total revenue.
4 Total market penetration was 29% (75% domestic and 7% international market). .
Cargo revenue and volume
2.21.5
2.6 2.8
4.4 4.4
50
100
150
200
250
1
2
3
4
5
2008 2009 2010 2011 2012 2013
� Revenues (million VND) � Cargo Volume (Thousand ton)
Nguồn: Vietnam Airlines

Valuable assets
4 Young fleet: As of 31 December 2013, Vietnam Airlines owned 83 aircrafts with an average age of 5.34 years, which are significantly younger than regional airlines.
4 Fast depreciation scheme: Vietnam Airlines’ accounting policy allows assets to be depreciated for a period of 12-15 years while the industry average was over 15 years.
Average fleet age of full-service carriers in Asia
0 2 4 6 8 10 12
China Southern
Air China
China Eastern
Cathay Pacific
Malaysia Airlines
Garuda Indonesia
Singapore Airlines
Thai Airways
Vietnam Airlines
Philippine Airlines
China Airlines

4 A network of 52 international routes and 39 domestic routes accompanied by over 400 landing & take-off slots at international airports are invaluable intangible assets for Vietnam Airlines
4 Prestigious brand name, strong repuation in the international airline industry
4 Young and professional workforce
Valuable assetsNumber of routes operated by airlines in Vietnam (as of 31 December 2013)
39
15 14
52
3 2
0
20
40
60
80
100
VietnamAirlines
Vietjet Air Jetstar
� Domestic � International
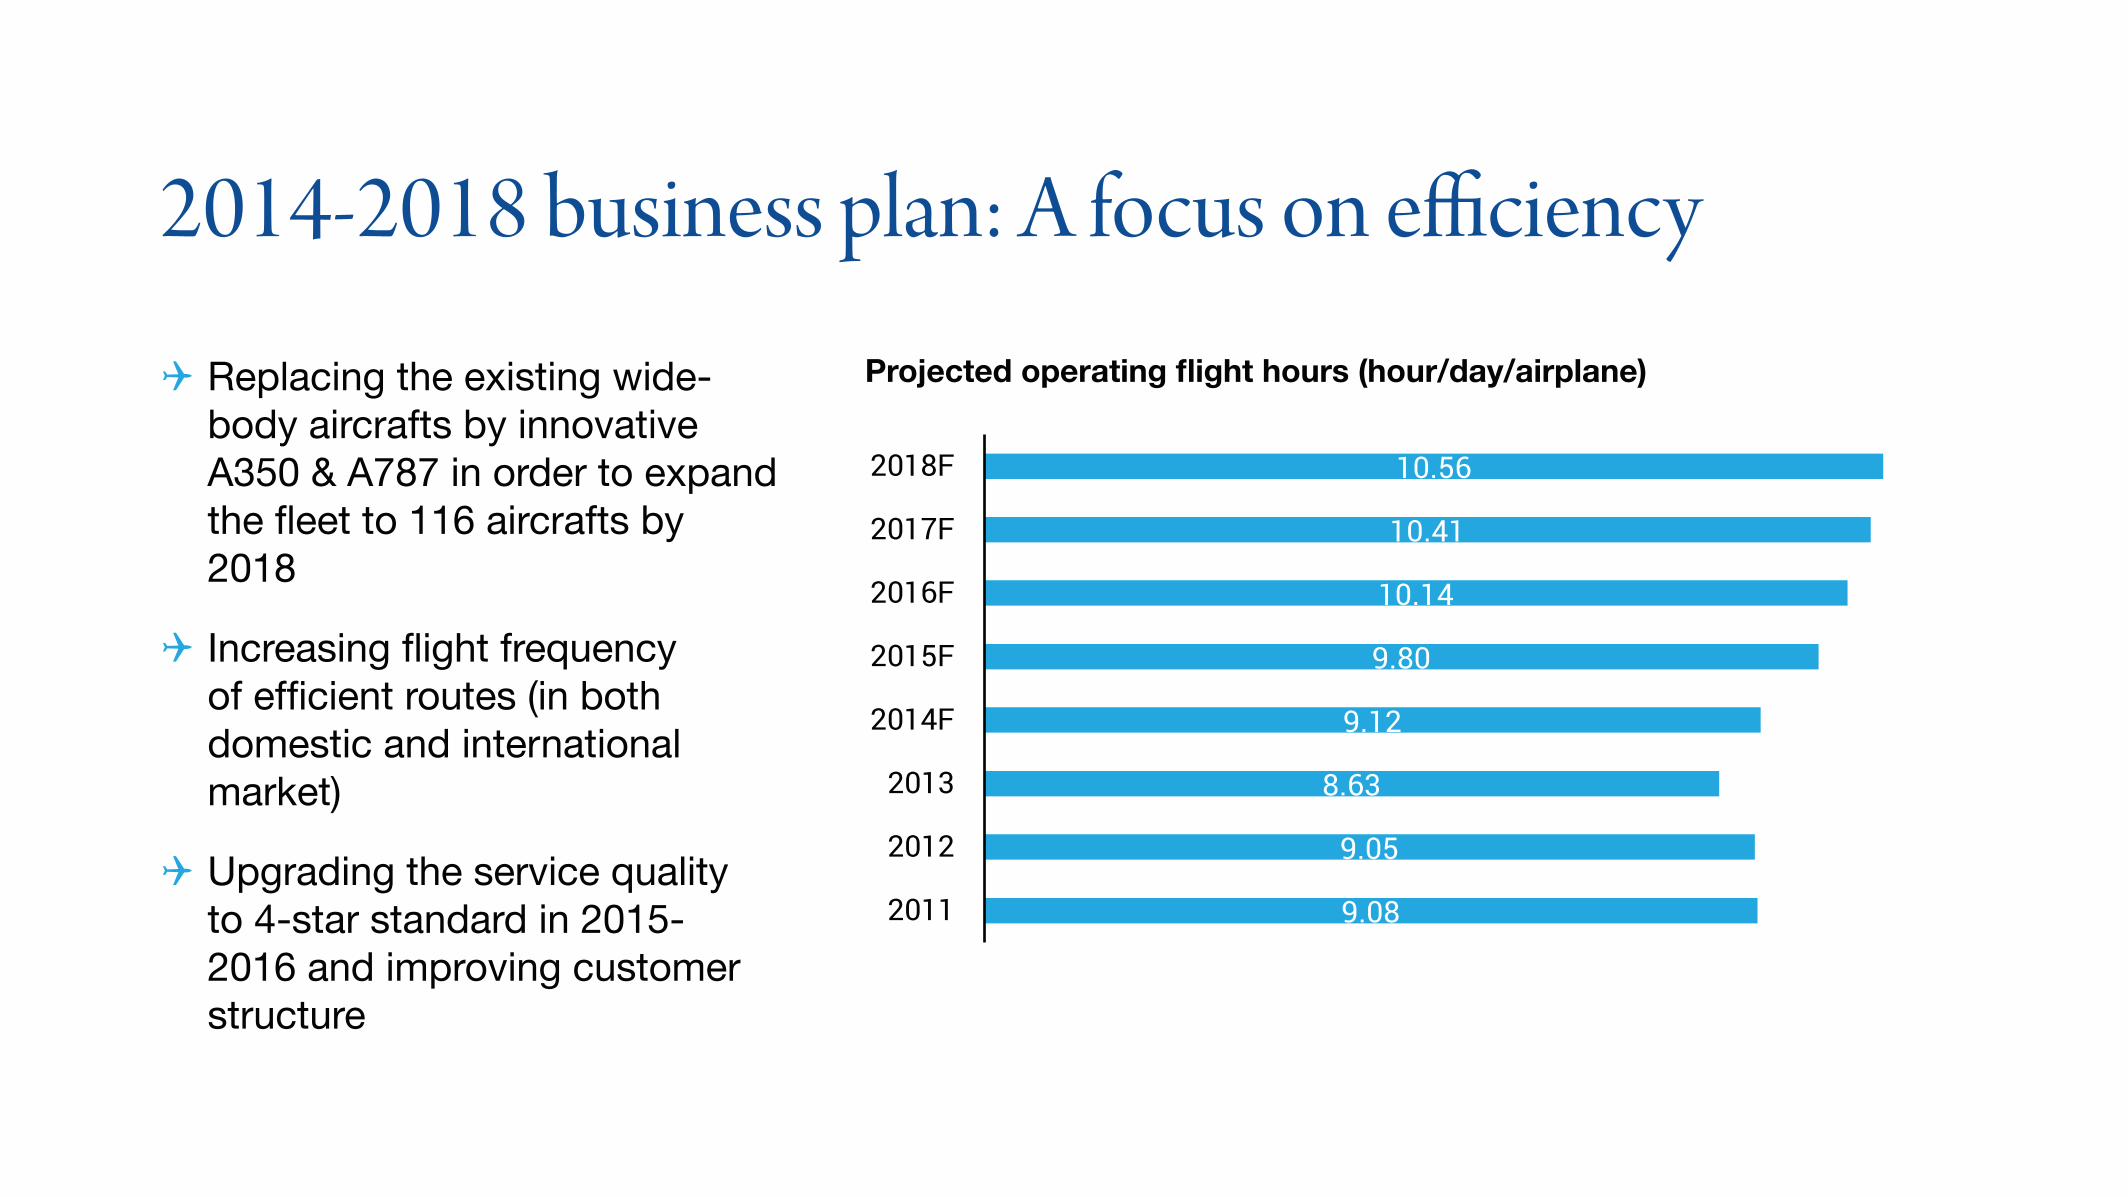
2014-2018 business plan: A focus on efficiency
4 Replacing the existing wide-body aircrafts by innovative A350 & A787 in order to expand the fleet to 116 aircrafts by 2018
4 Increasing flight frequency of efficient routes (in both domestic and international market)
4 Upgrading the service quality to 4-star standard in 2015-2016 and improving customer structure
Projected operating flight hours (hour/day/airplane)
9.08
9.05
8.63
9.12
9.80
10.14
10.41
10.56
2011
2012
2013
2014F
2015F
2016F
2017F
2018F

4 Enhancing the affiliation with theSkyteam members and other airlines
4 Considerable cost saving from increased proportion of Vietnamese pilots
2014-2018 business plan: A focus on efficiency
Projected pilot structure
0
200
400
600
800
1000
1200
2014 2015 2016 2017 2018
� Vietnamese � Foreign
Source: Vietnam Airlines

Tình hình tài chínhFinancial Analysis

The parent company 4 The average annual rate of revenue growth from 2008 to 2013 was 15.8%.
4 Revenues comes from four main sources
4 Vietnam Airlines’ profit margins improved significantly, up from 7.7% (2011) to 8.41% (2012) and reached 10.58% (2013).
23.20
35.60
44.87
49.58
52.83
0 10 20 30 40 50 60
2009
2010
2011
2012
2013
Revenues Profit margins
12.80%
13.79%
7.70%
8.41%
10.58%
0.00% 5.00% 10.00% 15.00%
2009
2010
2011
2012
2013

Assets
4 The total value of aircraft/ aircraft engines amounted to VND44,575 billion and accounted for 75.12% of total assets.
Capital Structure
4 The financial leverage is high, with an average Liabilities/Equity ratio of 4.92 in the last 3 years.
The parent companyAsset & Net Revenues
23.1
35.3 44
.5 49.1 52
.5
32.1 38
.5 48.5 55
.5 59.3
10
20
30
40
50
60
70
2009 2010 2011 2012 2013
� Net Revenues � Total Assets
Asset structure
84%
76%
82%
87%
85%
16%
24%
18%
13%
15%
0% 50% 100%
2009
2010
2011
2012
2013
�Long-term assets �Short-term assets
Source: Vietnam Airlines
Source: Vietnam Airlines

Operation and Liquidity Ratios
4 Vietnam Airlines owns an excellent cash conversion cycle with low level of Days in Inventory and Days Sales Outstanding. On the contrary, its number of Days Payable Outstanding has been at high level.
The parent company
2010 2011 2012 2013Days in Inventories 5.84 3.99 3.05 2.69
Days Sales Outstanding 18.99 18.32 16.72 15.02Days Payable Outstanding
46.99 47.13 50.00 57.52

Cost structure
The parent company
2009 2010 2011 2012 2013
Value % of total cost Value % of total
cost Value % of total cost Value % of total
cost Value % of total cost
Raw material 36.89% 13,492 39.01% 17,716 39.34% 19,597 40.10% 20,351 39.68%
Compensation 8.97% 2,720 7.86% 3,843 8.53% 3,892 7.96% 3,849 7.50%
Depreciation 6.90% 1,791 5.18% 2,171 4.82% 2,796 5.72% 3,419 6.67%
Outsourced expense 45.88% 16,177 46.77% 20,573 45.69% 21,559 44.12% 23,108 45.05%
Other operational expenses 1.35% 406 1.17% 726 1.61% 1,023 2.09% 567 1.11%
Total 22,601 100.00 34,587 100.00 45,028 100.00 48,867 100.00 51,294 100.00

4 Current assets: (1) VND2,112 billion of bank deposits of Vinapco; (2) VND3,188 billion of the inventory of Vinapco
4 Long-term debts: the subsidiary with the highest value of long-term debt of VND190.14 billion was Vietnam Airlines Engineering Company (VAECO) to finance its Hangar A76 factory.
4 Short-term loans: Vinapco contributed VND5,226.79 billion of short-term loans.
Financial Analysis | ConsolidatedConsolidated Revenues and As-sets Growth
32.6
1 46.3
5
56.4
7
64.8
6
68.8
6
35.4
3
43.0
6 56.3
8
64.7
2
69.6
4
10
20
30
40
50
60
70
80
2009 2010 2011 2012 2013
Doanh thu thuần Tổng tài sản
Cosolidated Assets struc-ture
25%
34%
30%
25%
25%
75%
66%
70%
75%
75%
0% 20% 40% 60% 80% 100%
2009
2010
2011
2012
2013
Tổng tài sản Tài sản dài hạn � Short-term assets � Long-term assets � Net revenues � Total Assets

SWOTtrength SWOThreatsSWOTeakness SWOTpportunities
4 Unique location
4 Rapid growth of tourism industry
4 Ranking 11th among top investment destinations in 2012
4 Population of 88.7 million people with improving income per capita
4 Forecast GDP growth rate of 5% per annum
4 Arrivals/departures to/from Vietnam continues to rise at a rate of 10%/year
4 The Skyteam membership
4 Political instabilities in the destination countries
4 Macroeconomic risks such as high infl ation, local currency depreciation and soaring fuel cost
4 Fierce competition with established international full-service and low-cost carriers in the domestic, regional and European market
4 Insuffi cient infrastructure to keep up with the rapid growth of the industry: limited landing spaces at HAN and SGN
4 Scarce professionals specializing in airline industry, especially pilots and technicians.
4 The prestige brand name as Vietnam national airlines with a strong position in domestic market as well as in CLMV regions
4 The only full service carrier in Vietnam, accompanied by differentiated domestic products such as Class C and GLP program
4 Diverse input system to reduce the dependence on suppliers
4 The leader in direct fl ight from Vietnam to Europe, Vietnam to CLM and within the country
4 Pioneer in regional technology and enhanced competitive advantages from the innovated fl eet with the acquisition of A350-900 and B787-9 aircraft since 2015
4 Tình hình kinh tế chính trị tại các quốc gia là điểm đến của Vietnam Airlines còn nhiều biến động;
4 Low revenue from international fl ights for small proportion of high income customers
4 Poor service quality compared to major regional airlines
4 Relatively low competitive advantage in the global stage
4 High fi xed cost
4 Limited fi nancial capacity
SWOT Analysis

Forecasting and valuation

MethodologyRevenue forecast
4Passenger and baggage transportation
4Cargo and parcel transportation
4Other services
4Financial investment
Expenses
4Direct cost
4 Indirect cost
4Depreciation and amortization
4Financial expenses

Operating forecast
Income statement 2014 2015 2016Net revenues (bil. VND) 57,357 65,423 78,752Gross profi t (bil. VND) 49,319 55,918 66,031
Financial expenses (bil. VND) 8,038 9,505 12,722
Profi t after tax (bil. VND) 754 1,382 2,666 ROE 269 615 2,084
EPS (VND) 1.82% 4.06% 9.95%
Dividends 190 436 1,118
The forecast of major accounts for the period 2014-2016
Ballance sheet 2014 2015 2016
Current assets (bil. VND) 14,583 16,108 23,148Non-current assets (bil. VND) 55,499 72,688 90,023
Total assets (bil. VND) 70,082 88,796 113,171
Current liabilities (bil.VND) 19,735 24,369 29,963Long term liabilities (bil.VND) 35,562 49,274 62,264
Equity (bil. VND) 14,784 15,153 20,944
Book value (VND) 10,359 10,631 11,142

4 The Adj. EV/EBITDAR multiple applied for Vietnam Airlines’ valuation is 8.19x, which is the average of EV/EBITDAR multiples of similar Asian airlines.
4 Multiple of rent is the factor of the average of fleets and the cost of flying. The most common multiply used in calculating the market value of leased aircraft is 7x
EBIT-DAR
12,101
Adj EV/EBITDAR
8.19
Short term debt 7,516
Long term debt
35,233
Cash 6,769
Operat-ing lease
6,129
Multiple of Rent 7
Adjusted firm value
99,107
Net debt 35,980 Capitalized operat-
ing lease 42,900
The parent company value 20,227
Sơ đồ định giá Công ty mẹ (tỷ đồng)
Parent company valuation

4 P/E: The P/E of VN-Index (15.3x) is discounted to reflect their unlisted condition. The calculated P/E (12x) is then multiplied by PAT and the ownership percentage of Vietnam Airlines as of 31 December 2013.
4 P/B: Book value of the remaining companies is assumed to remain unchanged. Hence, P/B is estimated at 1x (discounted from P/B of VN index of 2x).
Subsidiaries & Affiliates valuation

ResultSum of the parts
The value of Vietnam Airlines Billion VND 24,760
The value of the parent company Billion VND 20,227The incremental value of Vietnam Airlines’ ownership in its subsidiaries and affiliates Billion VND 4,533
Number of shares Million shares 1,058
The stock price of Vietnam Airlines VND per share 23,412

Thank you! ContactHead Office 10th & 11th floor – BIDV Tower 35 Hàng Vôi – Hoàn Kiếm – Hà Nội Tel: 84 4 39352722 Fax: 84 4 22200669 Website: www.bsc.com.vn Facebook: www.facebook.com/BID-VSecurities
Tran Thang Long Head of Research [email protected] (+84) 43935 2722 ext. 118