video streaming over wireless -...
TRANSCRIPT

Video Streaming over Wireless
Research overview
Dr. Mohamed Rehan
CTO, AvidBeam Technologies
1

Contents
1. Video Streaming Challenges
2. Overview of DASH Standard
3. Simulation Platform
4. Research Examplesa) QoE aware streaming
b) Client/Server feedback
c) DASH manager
d) Peer-assisted DASH
2

Video Streaming Challenges
3

Mobile Video Is Exploding
Quality, Network Efficiency, and Cost/Revenue ($$/bit) are Critical
110101
110101010001010010101001001010011001010101001101011001010110101100
2011 2016
PB/month310
PB/month7614
25x
Source: Cisco VNI *
Traffic
$
$$$$$$$7x
2011 2016
686M
4591M
Source: ABI Research *
Revenue
86.4M
649.8M
2011 2016
8x
Source: ABI Research *
Consumer
4

New Media Services Are EmergingInteractive video
Video-on-demand
Deliver good QoE for any service, anytime, anywhere, on any device
Video conferencingLive streaming
*
Video sharing
* *
* * *
* *
* *
5

6

7

Media Optimization Options
8

9

Challenges for Vendors
Content Provider
Network Service
Provider
ClientApp Developer
Technology Provider
* * *
* * *
* * * *
*
**
* *
* *
* *
Video Delivery Ecosystem
**
*

Current Solutions
Poor (2.4) Excellent (4.6)
Use for research by permission from NTIA
Fixed Bitrate: Either bad quality or waste of resources
• Fixed Bitrate - Lack of Quality Management
11

What is of color gamut?
Why Subjective Testing?
How many pixels?
Cu
rren
t So
luti
on
s A
sk…
.
What is the resolution?
What is the frame rate?
Wh
at Solu
tion
s Sho
uld
Ask…
What does the person sitting in
front of the screen think?
12

• By 2018, over 66% of the world's mobile data traffic will be video.
• Between the years 2013 and 2018, mobile video will have increased by 14-fold
Source: Cisco Visual Networking Index: Global Mobile Data Traffic Forecast Update, 2013-2018. Technical report, 2014.
13

Challenges
• Competition over available network resources
• Adapting to fluctuations in server’s upload link capacity
• Optimizing for different contents streamed by clients
• Clients’ narrow vision of external factors
▫ Other clients streaming from the same server
▫ Content streamed by the clients
▫ Servers’ upload link capacity
14

Overview of DASH Standard
15

HTTP Adaptive Streaming
16

17

Adaptive Streaming
• Content encoded at different bitrates• Clients adapt to various factors by switching
seamlessly between different video qualities during playback

Dynamic Adaptive Streaming over
HTTP (DASH)
• 3GPP and MPEG standard
• Media Presentation Description (MPD)
• Content chopped into small media pieces
• HTTP used to pull content from servers

DASH Performance
20

Simulation Platform
21

Simulation Platform
22

Real Application Servers
Real devices (WLAN)
Real devices (LAN)
Simulated Environment
23

Motivation & Objectives
End-to-End Open Platform
Real-time measurements+
Simulator flexibility
Physical Wireless Networks:
=>Real-time measurements
=>limited customization/ implementation flexibility
Network Simulators :
=>Implementation/customization flexibility with
=> limited real-time performance monitoring
Motivation: Lack of accurate real traffic wireless simulation.Existing real traffic analyzers are expensive, difficult to monitor, andrequire large processing and long deployment and testing cycles.
Objective: Use OPNET simulator to combine simulation and actual data from physical devices for Accurate, Robust, and controllable simulation of Real Wireless Environment

Platform Description1. Use OPNET simulator to model any wireless network such as WiMax or
LTE with any user specified configuration2. Setup Real devices to achieve required functionality (Video streaming
for example).3. Connect all real devices to OPNET using OPNET SITL (system in the
loop) module.4. Using OPNET configuration, change network parameters to test required
behavior.
Real devices(servers , fixed or
mobile clients)
Real devices (servers, fixed or
mobile clients)
Simulated Network(LTE, WiMax, WiFi, etc.)
Real –
Simulat
ion
GTW
Real –
Simulati
on GTW

Simulation Platform – Evaluation Metrics
• Average download rate
• Average requested rate
• Buffer level
• Average Mean Opinion Score (MOS)
• Subjective metric based on the ratings of individuals for video matter
• Higher MOS values indicate higher QoE
• MOS value is estimated during the encoding stage1 and associated with every Segment in the MPD
• Baseline
• Use measured throughput as upper bound for bitrate of selected Representation
26

VALIDATION USE CASES

Example Use Cases
1. Single client with changing network loading conditions. The purpose is to
test network performance under different loading conditions where traffic can
have same or different priorities
2. Mobile vs. fixed clients: The purpose is to test the performance of moving
‘mobile” user against fixed user.
3. Multiple user with different loading: the purpose is to test the network
behavior when different user exist and attempt to use traffic beyond the
network capabilities. User can have different or same priorities.
Many use cases were tested on our simulation platform in order to validate
the performance and functionality of the platform and compare it against real
environment. Examples include
The outcome of these experiments did match the expected results. In
addition, the analysis results helped identifying potential weaknesses in
current technologies

Loading 1 (with no traffic
prioritization)
Applying loading conditions with
no traffic prioritization blocks the
video stream completely
Loading 2 (with traffic prioritization)
Prioritizing the video traffic, helps the
client stream to survive but still suffers
from severe loading conditions
No loading conditions
Dropped frame rate.
Measured CPU processor load
Estimated CPU load at next high bitrate
The highest possible download bitrate
Actual download bitrate
Current display bitrate
1.Single client with changing network loading conditions

Video traffic stopped when the client is out of reception
range
2. Mobile vs. stationary (Fixed) Client

Fixed client Mobile client
OPNETSimulation
Dropped frame rate.
CPU processor load
Estimated CPU load at
next high bitrate
highest possible download
bitrate
Actual download bitrate
Current display bitrate

Mobile userFixed user
When mobile user moves away from base station, throughput drops

Research Examples
33

Proposed Techniques
1. QoE Based Adaption for DASH
▫ Use of QoE metric for balancing DASH streams
2. Server Assisted DASH (SA-DASH)
▫ Introduces a feedback mechanism for server assisted content aware bandwidth allocation
3. DASH Manager
▫ Optimize Multi-client streaming
4. Collaborative DASH (C-DASH)
▫ Applies P2P model for DASH for expanding available resources
34

Quality-Based Adaptation
Content Analyzer
Device Detector
Objective Quality
Calculator
MOS Estimator
Spatial details (S)
Low High
Motion level (M)
Low
High
MS-SSIM
1920x1080
800x480
1280x720
Display Resolution (R)
Display Devices (D)
Estimated MOS (1-5)
[Quality1, rate1][Quality2, rate2][Quality3, rate3]...
Maximize QoE @ Minimum Network Resources
35

36

Subjective Testing Methodology
Rich Video Content
Compress
Compression• Bitrate • Resolution
6Mbps@1080p
3Mbps@720p
1Mbps@480p
500kbps@360p
30
30
30
Form Factors• HDTV• Tablet• Phone
Subjective Testing
Poor
Good
5-point scale
Excellent

Current Objective Quality Metrics• PSNR (Peak-Signal-to-Noise Ratio)
• MS-SSIM (Multi-Scale Structural SIMilarity)Compressed
Mathematical Model to Approximate Subjective Quality
Uncompressed
38

Main Issues for Accurate QoE Measurement
• Bitrate != Subjective quality (in many cases)
• Objective Quality ≠ Subjective Quality
• Quality can be device dependent, content dependent, etc.
• Solution
• A modified subjective quality model more accurate to objective quality and configurable for other dependencies such as device and content capabiltiites.
•

1 2 3 4 5Bad 1
Poor 2
Fair 3
Good 4
Excellent 5
Estimated Subjective Quality Based on MS-SSIM
Sub
jective
Qu
alit
y
R2 = 0.3979
Perfect Prediction
1 2 3 4 5Bad 1
Poor 2
Fair 3
Good 4
Excellent 5
Estimated Subjective Quality Based on Bitrate
Sub
jective
Qu
alit
y
R2 = 0.1997
Perfect Prediction
Estimation of Subjective QualityEstimation Based on Bitrate Estimation Based on MS-SSIM
40

1 2 3 4 5Bad 1
Poor 2
Fair 3
Good 4
Excellent 5
Estimated Subjective Quality
Sub
jective
Qu
alit
y
R2 = 0.7196
Perfect Prediction
Estimation of Subjective Quality• Quality is device-dependent
MS-SSIM + Device Based Estimation
41

1 2 3 4 5Bad 1
Poor 2
Fair 3
Good 4
Excellent 5
Estimated Subjective Quality
Sub
jective
Qu
alit
y
R2 = 0.9628
Perfect Prediction
Estimation of Subjective Quality• Quality is content-dependent
MS-SSIM+Content+Device Based Estimation
𝑄𝑜𝐸 = 𝛼 ∙ 𝑀𝑆−𝑆𝑆𝐼𝑀 + 𝛽
42

43

Quality-based Adaptation• Intel Quality Measurement Tool• Inside DASH MPD file
▫ Record quality of each segment in the DASH manifest file (MPD) using Intel quality measurement tool.<SegmentURL media=“bigbuckbunny_500kbit/bunny.m4s" MOS=“4.2"/>
• At the streaming client side▫ Use Quality information and buffer full-fillness information to select the next segment▫ If the buffer is empty (close to empty), request segment with lower quality to fill the buffer faster▫ If the buffer is full (almost full), request segments with higher quality
44

2. MPD Post Processing• Problem
▫ Content generation may encounter large quality variations => not desirable by viewer▫ Generated content segments have close quality and high bandwidth variations => not efficient for streaming
• Solution▫ Postprocssing of generated MPD to replace segments with other segments according to certain criteria ▫ (limited quality variation , maximum quality selection, …etc.)
• Outcome▫ Better bandwidth utilization. Around 7-10% saving in bitrate for almost the same quality
45

Server Assisted DASH (SA-DASH)
• Clients and servers share extra information via a feedback mechanism to enable server assisted content aware bandwidth allocation
• Shared information comprises:▫ QoE metrics measured by clients which include
Average MOS Throughput at which the previous Segment was downloaded MOS of requested Segment Bitrate of the Representation at which the current Segment is
to be downloaded Number of times the client is at risk of a playback stall (buffer
level drops below a specified threshold)▫ Available Representation Code (ARC) evaluated by servers
VideoClient
Get segment
Ok
Get segment
Error “00001111”
Supported set of representation is attached
VideoStreaming
Server

47/44
SA-DASH – Simulation Results
• Stable setting• 2 Clients streaming same content• Server upload rate fixed at 2.5 Mbps
SA-DASHBaseline
47

48/44
SA-DASH – Simulation ResultsFixed environment simulation
Baseline SA-DASH % Improvement
Avg. requested rate (Kbps)
1266.5 1043 -17.6%
Avg. D\L rate (Kbps)1414 1591 +12.5%
Avg. MOS 3.92 3.65 -6.9%
#Stall risks5 4 +20.0%
Stall Risk time(s) 8.45 1.12 +86.7%
• Decrease in average requested rate as:▫ Clients are sometimes notified beforehand of drops in server upload rate▫ Clients are restricted to particular data rates such that the maximum
possible requested rates does not exceed server’s bandwidth• Decrease in stall time with little effect on average MOS
48

SA-DASH – Simulation Results• 2 Clients streaming different content
• Server upload capacity fluctuates at 3 Mbps and 1.8 Mbps
4 m
in r
un
10+
min
ru
nSA-DASHBaseline

SA-DASH – Simulation Results4 minute run 10+ minute run
Baseline SA-DASH % Imprv. Baseline SA-DASH % Imprv.
Avg. requested rate (Kbps)
1136.5 1075.5 -5.4% 1228.5 936.5 -23.8%
Avg. D\L rate (Kbps)
1308 1420 +8.6% 1533 2003 +30.7%
Avg. MOS 3.73 3.66 -1.9% 3.53 3.34 -5.2%
#Stall risks 7 4 +42.9% 31 6 +80.6%
Stall Risk time (s) 13.98 9.44 +32.5% 56.6 4.1 +92.8%
• Decrease in average requested rate as:▫ Clients are sometimes notified beforehand of drops in server upload rate▫ Clients are restricted to particular data rates such that the maximum
possible requested rates does not exceed server’s bandwidth• Decrease in stall time with little effect on average MOS

SA-DASH – Demo
Rate-based adaptation
• More playback stalls
• Clients react poorly to unforeseen fluctuations in server’s upload link capacity
SA-DASH
• Less playback pauses
• Clients react swiftly to unforeseen fluctuations in server’s upload link capacity

DASH Manager
Server Status
List Available Servers
Streaming Clients
Client Status – QOE Metrics
DASH Manager (DM)
Content Servers
RegisterServer Status
Feedback – Available Representations
Different signaling between clients, servers, and DM
Optimize Multi-user QoE & Network Resources
Ping
52
Server A
Server B
DASH manager
Client 1
Client 2
T0
T4
T3
T2
T1
StartRegister
StartRegister
c
QoE
QoE
Upload
Upload c c c
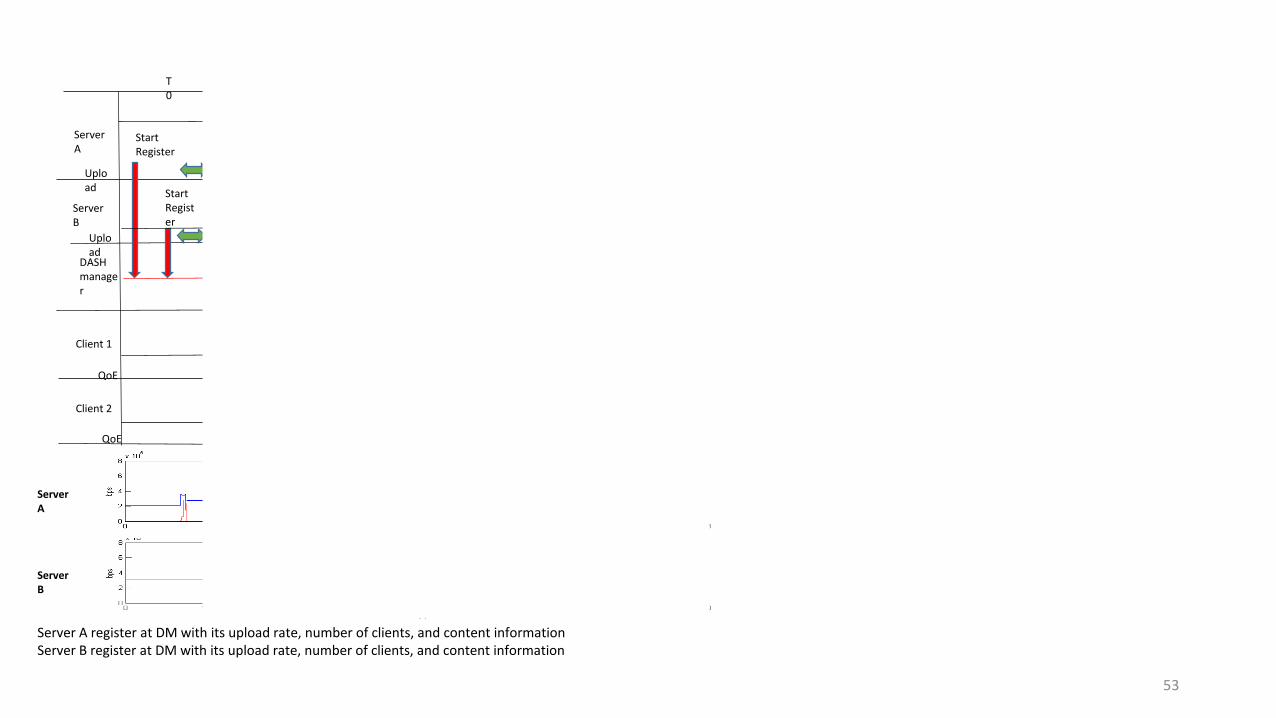
Server A register at DM with its upload rate, number of clients, and content informationServer B register at DM with its upload rate, number of clients, and content information
Server B
Server A
53

Server A
Server B
DASH manager
Client 1
Client 2
T0
T4
T3
T2
T1
StartRegister
StartRegister
c
QoE
QoE
Upload
Upload c c c
Server A
Client 1 sign-in, request server status from DMClient 1 picks server 1 (higher available bandwidth)
Clie
nt
1
Server B
54

1. Client 2 sign-in, request server status from DM2. DM responds to Client 2 with existing servers and their available upload rates3. Client 2 picks server B (higher available bandwidth)4. Client 2 starts to stream from server B
Server A
Server B
DASH manager
Client 1
Client 2
T0
T4
T3
T2
T1
StartRegister
StartRegister
c
QoE
QoE
Upload
Upload c c c
Clie
nt
1C
lien
t 2
Which server to stream from
?
Server A
Server B
55

Server A
Server B
DASH manager
Client 1
Client 2
T0
T4
T3
T2
T1
StartRegister
StartRegister
c
QoE
QoE
Upload
Upload c c c
Server A bandwidth is becoming smaller (network conditions)Client 1 less satisfied with streaming quality
Clie
nt
1C
lien
t 2
Server A
Server B
56

Server A
Server B
DASH manager
Client 1
Client 2
T0
T4
T3
T2
T1
StartRegister
StartRegister
c
QoE
QoE
Upload
Upload c c c
Client 1 video
DM notifies client 1 with updated server statusClient 1 switches to server B Client 1 is more satisfied with streaming quality
Clie
nt
1C
lien
t 2
Server A
Server B
57

Collaborative DASH (C-DASH)
• Clients compete for available resources such as the server’s upload link capacity

C-DASH
• Exploits clients’ upload links by adopting a P2P model for DASH
• Increase in available resources leads to a more sparse distribution of clients
• Number of clients streaming from a particular host is reduced
• More resources available to each individual enables clients to stream at higher quality
• High quality downloaded content is shared with other peers leading to an overall increase in streaming quality

C-DASH – System Components

C-DASH – System Components
• DASH Manager (DM):▫ Coordinating component ▫ Reachable by the streaming clients and content servers▫ Keeps track of critical information such as the statuses of
available servers connected to it▫ Transfers gathered information to clients to aid clients in the peer
selection process.

C-DASH – System Components
• Content Server: ▫ HTTP server that is assumed to contain the whole original content i.e. for each
Representation in the MPD, the server has the complete length of the media content
▫ Monitor its status which includes parameters such as: Number of streaming clients Upload rate Load
▫ Send information to DASH Manager

C-DASH – System Components
• Adaptive Streaming Clients:
▫ Pull media content from servers and peers
▫ Select bitrate based on predefined adaptation logic
▫ Serve media content to other streaming clients

C-DASH
Challenge Approach
Available content synchronization
• Clients periodically download an MPD from each peer• MPD contains a binary code with every Representation
to mark downloaded Segments
Host selection • Clients periodically receive servers’ and peers’ status updates
• Gathered information is used as input to an adaptation algorithm to select the best host for streaming
• Attempt to find host offering the required Segment at the highest bitrate which is less than the minimum of the client’s estimated and actual download rates for that host
MPD size • Associate binary code with template-based MPDs to mark downloaded Segments

C-DASH – Simulation Results
• Content server upload link capacity set to 3 Mbps
• 3 clients
• Every 40 seconds new client starts a streaming session
• All clients streaming the same content – Big buck bunny

• Client 1 = 2.5 Mbps • Client 2 = 2.1 Mbps • Client 3 = 2.7 Mbps• Client 1 = 1.6 Mbps • Client 2 = 1.4 Mbps • Client 3 = 1.6 Mbps
C-DASH – Simulation Results
• Higher download rates reached due to downloads via shared local network

• Client 1 = 1.5 Mbps • Client 2 = 1.2 Mbps • Client 3 = 1.3 Mbps• Client 1 = 1.4 Mbps • Client 2 = 1.3 Mbps • Client 3 = 1.4 Mbps
C-DASH – Simulation Results• Similar average requested bitrates• Did not meet expectations for high requested rates• Peer has Segmentx at bitratei
• Client finds it can download Segmentx at bitratej > bitrateifrom content server
• Client switches to content server leading to competition

C-DASH – Simulation Results
Baseline C-DASH % Improvement
Average requested rate (kbps) 1347.7 1335.7 -0.90
Average download rate (kbps) 1522.7 2418.3 +58.8
# Stall risks 6 5 +16.7
Stall risk time (s) 5.35 1.72 +67.9
• Higher download rates reached due to downloads via shared local network
• Similar requested rates due to continued competition
• Solution: Prioritized Collaborative DASH (PC-DASH)