victorias prison population 2005 to 2016 · the sentencing advisory council bridges the gap between...
TRANSCRIPT

Victoria’s Prison Population 2005 to 2016

The Sentencing Advisory Council bridges the gap between the community, the courts, and the government by informing, educating, and advising on sentencing issues.
The Sentencing Advisory Council is an independent statutory body established in 2004 under amendments to the Sentencing Act 1991. The functions of the Council are to:
• provide statistical information on sentencing, including information on current sentencing practices
• conduct research and disseminate information on sentencing matters
• gauge public opinion on sentencing
• consult on sentencing matters
• advise the Attorney-General on sentencing issues
• provide the Court of Appeal with the Council’s written views on the giving, or review, of a guideline judgment.
Council members come from a broad spectrum of professional and community backgrounds. Under the Sentencing Act 1991, Council members must be appointed under eight profile areas:
• two people with broad experience in community issues affecting the courts
• one senior academic
• one highly experienced defence lawyer
• one highly experienced prosecution lawyer
• one member of a victim of crime support or advocacy group
• one person involved in the management of a victim of crime support or advocacy group who is a victim of crime or a representative of victims of crime
• one member of the police force of the rank of senior sergeant or below who is actively engaged in criminal law enforcement duties
• the remainder must have experience in the operation of the criminal justice system.
For more information about the Council and sentencing generally, visit:www.sentencingcouncil.vic.gov.au
Victoria’s Prison Population 2005 to 2016
Sentencing Advisory Council November 2016

ii
Published by the Sentencing Advisory Council Melbourne, Victoria, Australia
© Copyright State of Victoria, Sentencing Advisory Council, 2016
This publication is protected by the laws of copyright. No part may be reproduced by any process except in accordance with the provisions of the Copyright Act 1968 (Cth).
ISBN 978-1-925071-24-5 (Online)
Authorised by the Sentencing Advisory Council, Level 3, 333 Queen Street, Melbourne VIC 3000
Publications of the Sentencing Advisory Council follow the Melbourne University Law Review Association Inc Australian Guide to Legal Citation (3rd ed., 2010).
This report reflects the law as at 1 September 2016.

Contents iii
Contents
Contributors vAcknowledgments v
Glossary vi
Executive summary ixPrison population ixOffending in Victoria ixSentencing trends xPrisoners in Victoria x
1. Recent research and the focus of this report 1Recent research 2
Growth in the remand population 2The costs of imprisonment 3Crime rates and the prison population 5
Focus of this report 6Data and data sources 7
2. The prison population in Victoria 9Adult prison population and imprisonment rate 9Legal status 11Male and female prisoners 12Aboriginal and Torres Strait Islander prisoners 13Prison population observations 14
3. Offences in Victoria 15Crime rates 15Unique alleged offenders by category of offending 16Offence data observations 19
4. Sentences of imprisonment in Victoria 21The number of sentences of imprisonment 21Custody rates 22Length of imprisonment 27Custodial sentences by principal proven offence 28
Principal proven offences across all courts 28Number of custodial sentences by principal proven offence 28Custodial sentence types by principal proven offence 29Custodial sentences by principal proven offence and court level 30
Principal proven offences in the Magistrates’ Court 30Number of custodial sentences in the Magistrates’ Court by principal proven offence 30Custodial sentence types in the Magistrates’ Court by principal proven offence 33Average sentence length of custodial sentences in the Magistrates’ Court by principal proven offence 33
iv
Principal proven offences in the higher courts 35Number of custodial sentences in the higher courts by principal proven offence 35Custody rates and custodial sentence types in the higher courts by principal proven offence 36Average sentence length of custodial sentences in the higher courts by principal proven offence 37
Sentencing observations 38
5. Prisoners in Victoria 39Prisoner receptions 39Offences and imprisonment 41
Most serious offence by sentenced prisoners 41Most serious charge for prisoners on remand 43
Length of time spent in custody 45Sentence lengths 45
Prisoners sentenced within the preceding 12 months 46Aggregate sentence length and expected time to serve 47
Time served on remand 48Observations on prisoners in Victoria 50
Sentenced prisoners 50Prisoners on remand 50
6. Other influences on the prison population 51Community correction orders and suspended sentences 51Remand and bail 53Parole reforms 54Conclusions 56
Appendix A: Principal proven offence categories 57
Appendix B: Custodial sentences in the higher courts, by offence category 59
Appendix C: Custodial sentences in the Magistrates’ Court, by offence category 61
References 62Bibliography 62Case law 65Legislation 65Quasi-legislative materials 65

Contributors v
Contributors
AuthorPaige Darby
Data analystAngela Volkov
Sentencing Advisory Council
ChairArie Freiberg AM
Deputy-ChairLisa Ward
Council DirectorsCarmel ArthurHugh de KretserFiona DowsleyHelen FatourosDavid Grace QCJohn Griffin PSMSherril HandleyBrendan Kissane QCShane PattonBarbara RozenesGeoff Wilkinson OAM
Chief Executive OfficerCynthia Marwood
AcknowledgmentsThe Council would like to thank the Australian Bureau of Statistics, Corrections Victoria, Court Services Victoria, and the Crime Statistics Agency, Victoria, for the provision of data.

vi
GlossaryCase In this report, a collection of one or more proven charges against
a person sentenced at the one hearing.
Charge In this report, a charge may refer to an alleged offence recorded by Victoria Police or a proven charge in a case.
Community correction order A sentencing order available since 16 January 2012 that may require an offender to comply with a range of conditions such as unpaid community work, treatment, supervision by a community corrections officer, curfews, restrictions on an offender’s movements, and non-association conditions (Sentencing Act 1991 (Vic) pt 3A).
Community order Community-based orders, intensive correction orders, and community correction orders. Community correction orders replaced community-based orders and intensive correction orders in 2012.
Custodial sentence In this report, any sentence for which a portion of the sentence is spent in custody, including a sentence of imprisonment, a partially suspended sentence, and a term of imprisonment combined with a community correction order.
Custody rate The proportion of all sentences imposed that involve a custodial sentence.
Higher courts In this report, the County Court of Victoria and the Supreme Court of Victoria.
Lower courts In this report, the Magistrates’ Court and ‘other’ courts such as the Children’s Court.
Mean A measure of central tendency represented by the sum of all values in a distribution divided by the number of values, also known as the ‘average’.
Most serious offence/charge The most serious offending behaviour of a prisoner. The most serious offence relates to sentenced prisoners and the most serious charge relates to unsentenced prisoners. When a person is in prison for more than one offence or has been sentenced more than once, the most serious offence or charge only measures the offender once.

Glossary vii
Principal proven offence The most serious offence in an offender’s sentence. The principal proven offence only applies to sentenced offenders. When the offender has received one sentence for multiple offences in a case, the principal proven offence only measures the offender once. The same offender may be measured more than once if sentenced in multiple cases.
Prisoner A person held in custody, either awaiting trial or sentence (unsentenced) or serving a sentence. In this report, only persons held in corrective services custody are counted. Persons held in police cells, court cells, mental health services, youth justice centres, and immigration detention are excluded.
Prisoner reception A person who enters custody, having been remanded in custody on charges pending court hearings or having received a sentence of imprisonment as an outcome of a court proceeding. Prisoner reception excludes prisoners received on transfer from other Victorian prisons or returned to prison custody after further court hearings. A person remanded in custody or sentenced to prison more than once is counted on each occasion that the person is received into the prison population.
Remand Unsentenced prisoners are held on remand. After criminal charges have been laid, the person may be remanded in custody if he or she has not applied for bail, has been refused bail, or is unable or unwilling to meet the conditions set out in the bail bond. Prisoners on remand may also be convicted but awaiting sentencing.
Sentenced prisoner A person who has received a term of imprisonment from a court. Also included are prisoners who are serving a sentence for non-payment of a fine (‘fine default’), prisoners who are sentenced but awaiting the outcome of an appeal, and prisoners who are sentenced but also have active remand warrants against them (‘dual status’).
Sentenced prisoner reception A person who enters custody having received a sentence of imprisonment as an outcome of a court proceeding. Sentenced prisoner reception includes persons sentenced to imprisonment while held in prison on remand (i.e. their status changes from remand to sentenced prisoner). Sentenced prisoners in custody who receive a further sentence of imprisonment are not counted as sentenced prisoner receptions.

viii
Statistical significance A statistical measurement of the likelihood that the difference between two numbers has not occurred by chance. The most widely used threshold of statistical significance, and the threshold used in this report, is 0.05, which means that there is a 5% likelihood or less that the observed difference occurred by chance alone.
Total effective sentence The product of individual sentences (and orders for cumulation or concurrency of those sentences) imposed on a person on the same occasion. In a case involving a single charge, the total effective sentence is the sentence imposed for that charge. The total effective sentence is also known as the ‘head sentence’.
Unique alleged offender A person who has been involved in one or more alleged offender incidents (i.e. incidents involving one or more offences that a person has been linked to as an alleged offender) within the year. If a person is involved in more than one incident in a year, only the first incident is counted.
Unsentenced prisoner A person who has been placed in custody while awaiting the outcome of a court hearing. The person may be unconvicted (remanded) or convicted but awaiting sentencing (remanded for sentencing). Persons who are held in an adult prison awaiting deportation are also included in this category.
Executive summary ix
Executive summaryThis report on Victoria’s prison population investigates statistical trends in adults held in Victorian corrective services custody between 2005 and 2016.1 As with the Council’s previous reports on this topic (released in 2007 and 2013),2 this report highlights a prison population growing at unprecedented rates, significantly outpacing general population growth. Between 30 June 2006 and 30 June 2016, Victoria’s prison population increased by 67%, from 3,908 to 6,520 prisoners.
This report examines a number of aspects of the expanding prison population. First, the broad demographics of the prison population are presented in order to analyse whether overall growth is being driven by particular groups within the prison population. Second, offending in Victoria is investigated in order to determine whether changing offending patterns are influencing prison population growth. Third, the report presents sentencing data in order to explore whether increases in the prison population are a result of changing sentencing practices. Finally, the offences, charges, sentences, and time served on remand of current prisoners are examined in order to measure changes in the composition of the prison population.
Prison populationThe Victorian prison population has increased significantly over the past decade. However, this growth has not been experienced equally by all groups within that population.
In particular, between 30 June 2006 and 30 June 2016:
• the number of female prisoners experienced higher percentage growth (up 75%) than the number of male prisoners (up 66%);
• the number of Aboriginal and Torres Strait Islander prisoners experienced higher percentage growth (up 147%) than the number of non-Indigenous prisoners (up 62%); and
• the number of unsentenced prisoners experienced higher percentage growth (up 154%) than the number of sentenced prisoners (up 46%).
Since 2014, the sentenced prisoner population has decreased by 7%, while the unsentenced prisoner population has increased by 65%. The unsentenced prisoner population grew from 19% of the total prison population on 30 June 2006 to 29% on 30 June 2016.
Offending in Victoria Both the number of offences and the rate of offending as a proportion of the population have increased in recent years, particularly since 2010–11. Prior to 2010–11, the number of recorded offences was relatively stable and the crime rate was declining.
When analysed by the number of unique alleged offenders, most of the increase in the crime rate since 2010–11 occurred as a result of an increase in unique alleged offenders apprehended for offences against the person. Further, since 2010–11, the number of unique alleged offenders apprehended increased across all offence categories except property and public order offences.
1. This report does not include data on prisoners held in police or court cells or persons held in mental health services, youth justice centres, or immigration detention.
2. Sentencing Advisory Council, Victoria’s Prison Population 2001 to 2006 (2007); Sentencing Advisory Council, Victoria’s Prison Population 2002 to 2012 (2013).

x
Sentencing trendsSentencing data demonstrates that most of the increase in the prison population can be attributed to an increase in the number of people entering the criminal justice system. In particular, the total number of custodial sentences imposed has increased significantly since 2010–11, despite the rate of custodial sentences as a proportion of all sentences remaining relatively stable.
Data on sentence lengths indicates that, in recent years, the increase in the number of cases may have been offset by the imposition of shorter custodial sentences. This, in turn, may have been influenced by the introduction, and increased use, of short terms of imprisonment combined with community correction orders.
When analysed by principal proven offence, the number of custodial sentences increased for all offence categories except property offences and ‘other’ offences. The primary driver of growth has been the increasing number of custodial sentences imposed in cases with an offence against the person as the principal proven offence. Within the principal proven offence category of offences against the person, the most substantial increase has been in the number of custodial sentences imposed for cause injury offences. Similar trends are observed when custodial sentences by principal proven offence are broken down by court level.
The decrease in the sentenced prisoner population since 2014 is reflected in a decreasing custody rate in the higher courts and decreasing mean sentence lengths across all courts since 2012–13 (after increases in previous years).
Prisoners in Victoria Between 2005 and 2015, sentenced prisoners were most likely to be imprisoned for an offence against the person. Those offenders imprisoned for an offence against the person were most likely to have been sentenced for a sexual assault offence. Additionally, the number of prisoners serving time for a cause injury offence as their principal proven offence more than tripled, from 210 prisoners on 30 June 2005 to 672 prisoners on 30 June 2015.
While the sentenced prisoner population decreased between 30 June 2014 and 30 June 2015, the number of sentenced prisoners received into Victorian prisons throughout the year did not similarly decrease. Rather, the decrease in the sentenced prisoner population in recent years can be attributed to an increase in the use of shorter custodial sentences (after a period of growth in both the number of custodial sentences and the average length of those sentences).
Overall, growth was driven by increases in the remand population. Between 2005 and 2015, there was a substantial increase in the number of prisoners received into Victorian prisons who did not enter the sentenced prisoner population in the same financial year, particularly in 2014–15. The data indicates that the growth in the remand population is not a cumulative effect of people spending longer periods on remand but, rather, is a result of an increased number of people charged with offences (particularly cause injury and drug offences) being remanded for short periods of time (particularly by the Magistrates’ Court).
1. Recent research and the focus of this report 1
1. Recent research and the focus of this report1.1 This report is the Sentencing Advisory Council’s (‘the Council’s’) third publication on statistical
trends in Victoria’s adult prison population. As with the Council’s previous publications on this topic, released in 2007 and 2013, this report highlights a prison population growing at unprecedented rates, outpacing general population growth.
1.2 As at 30 June 2016, there were 6,520 prisoners in Victorian prisons. This represents an increase of 2,612 prisoners in the preceding 10 years; Victoria’s prison population is now 67% larger than it was in 2006. Concurrently, Victoria’s imprisonment rate has increased from 93.3 persons per 100,000 adults in 2005–06 to 138 persons per 100,000 adults in the June quarter of 2016.3 During this period, annual growth rates in the prisoner population reached record levels. In particular, in the 12 months between 30 June 2013 and 30 June 2014, the Victorian prison population increased by more than 14%.
1.3 The growth in prisoner numbers far exceeds that in the decade observed in the Council’s Victoria’s Prison Population 2002 to 2012 (‘the 2013 report’). In the four years since that report, the prison population has increased by 34%, which is comparable to the growth that occurred across the decade observed in that report (38%). According to the Australian Bureau of Statistics, between 2005 and 2015, the growth in Victoria’s prisoner numbers was the third highest in Australia, behind South Australia and the Northern Territory. Nonetheless, Victoria currently has the third lowest rate of imprisonment in Australia, with the Australian Capital Territory and Tasmania imprisoning fewer adults on a per capita basis.4
1.4 A closer examination of Victoria’s growing prison population reveals that the composition of the prison population is changing dramatically. In particular, the number of people on remand, along with the proportion of the prison population they represent, has increased substantially. At 30 June 2016, close to one in three prisoners (29%) had not been sentenced for the charges for which they were in prison.
1.5 This high proportion of unsentenced prisoners is a combination of two factors: a decrease in the number of sentenced prisoners since 2014 and the growth in the number of prisoners on remand, particularly since 2013. Overall, the sentenced prisoner population increased by 46% between 2006 and 2016, while the remand population increased by 154% over the same period.
1.6 The continual growth in Victoria’s prison population has required capital investment in order for the number of prison places to keep up with demand. Successive governments have made significant investment in prison capacity in recent years, with capacity expanded in every Victorian prison during the time periods observed in this report. Investment has also been made in new prison projects, with the new Ravenhall prison to add 1,300 prison places to Victoria’s prison capacity from 2017.5
3. Australian Bureau of Statistics, Corrective Services, Australia, June Quarter 2016, cat. no. 4512.0 (2016) Table 3.
4. Ibid.
5. Department of Justice and Regulation, Victoria, Ravenhall Prison Project (Corrections, Prisons & Parole, 2016) <http://www.corrections.vic.gov.au/home/prison/ravenhall+prison+project.shtml> at 21 October 2016.
2 Victoria’s Prison Population 2005 to 2016
Recent research1.7 An increasing prison population and rising rates of incarceration have been observed in Victoria
for over a decade. This corresponds with growing prison populations observed in other Australian jurisdictions. In other comparable foreign jurisdictions, such as the United States and the United Kingdom, high rates of incarceration have seen the implementation of policies to actively reduce prison populations.6
1.8 The many drivers of these growing prison populations have been the subject of extensive research. The core drivers from within the criminal justice system, sometimes known as ‘proximal factors’, include:
• crime rates;
• offending patterns;
• the use of bail and remand;
• court flow and custody rates; and
• prisoner receptions and sentence length.
1.9 ‘Distal’ factors, that is, factors external to the criminal justice system such as socioeconomic indicators and broader public confidence influences, are not the subject of this report.
1.10 A comprehensive examination of literature on proximal drivers of prison population growth is provided in the Council’s 2013 report. The current report presents more recent research in three areas of increased significance since the 2013 report: the growing remand population, the costs of imprisonment, and the relationship between the crime rate and imprisonment.
Growth in the remand population1.11 A growing remand population, both in absolute numbers and as a proportion of the prison
population, is not unique to Victoria. According to a 2016 report by the NSW Bureau of Crime Statistics and Research (BOCSAR), New South Wales has also experienced growth in its remand population.7 That report attributes the growth in the remand population to four factors:
1. an increase in the number of people proceeded against by police for offences for which bail refusal is likely;
2. an increase in the number of persons proceeded against by police for breach of bail;
3. an increase in the time spent in custody on remand; and
4. a possible increase in the likelihood of bail refusal.8
6. See Council of State Governments, Justice Reinvestment Home (The Council of State Governments Justice Center, 2016) <https://csgjusticecenter.org/jr/> at 21 October 2016; Kevin Wong et al., Local Justice Reinvestment Pilot: Final Process Evaluation Report, Ministry of Justice Analytical Series (2015).
7. Don Weatherburn et al., Why Is the NSW Prison Population Still Growing? Another Look at Prison Trends between 2011 and 2015, Issue Paper no. 113 (2016) 1.
8. Ibid.
1. Recent research and the focus of this report 3
1.12 Importantly, the BOCSAR report found that both the number of people being remanded in custody and the number of people being refused bail at their first court appearance were trending upwards. A significant increase in the proportion of persons spending more time on remand in 2015 was attributed to possible delays in the processing of criminal trials in the New South Wales District Court.
1.13 For the sentenced prisoner population, increases were not due to longer sentence periods but rather a larger number of proceedings initiated against offenders who were likely to receive a term of imprisonment.9 Nonetheless, the BOCSAR report noted that:
a high proportion of remand prisoners end up convicted and given a prison sentence. Any growth in the remand population is therefore likely to be followed by an increase in the sentenced prisoner population.10
1.14 Overall, the New South Wales prison population is expected to ‘surge’ to 18,000 prisoners by 2020, with the New South Wales Government announcing funding in the 2016–17 budget of $3.8 billion to increase prison capacity by 7,000 places.11
1.15 Western Australia has also experienced a burgeoning remand population in recent years. According to a 2015 report by the Western Australian Office of the Inspector of Custodial Services, the number of people on remand doubled between 2009 and 2015, with the proportion of the prison population represented by prisoners on remand continuing to grow. While no single reason was provided for this growth, the Inspector noted a significant increase in the number of court appearances in recent years.12
The costs of imprisonment1.16 In its annual Report on Government Services, the Productivity Commission reports on average
daily costs per prisoner and per offender for each state and territory in Australia.13 In 2014–15, Victoria had the second highest average daily cost per prisoner in Australia, with each prisoner costing $297.34 per day. This was higher than the Australian average of $224.20, and lower only than the average daily cost per prisoner in Tasmania ($363.30). Since 2010–11, Victoria’s average daily cost per prisoner has increased by 9%. According to Victorian state budget papers, the cost of ‘providing constructive containment of prisoners’ increased from $316.5 million in 2004–05 to $901.1 million in 2014–15, with $1.1 billion budgeted for 2016–17.14
9. Ibid 6.
10. Ibid 2.
11. Deputy Premier of New South Wales, ‘Record Investment in Justice in NSW Budget’, Media Release (21 June 2016) <http://www.justice.nsw.gov.au/Pages/media-news/media-releases/2016/Record-investment-in-justice-in-NSW-budget.aspx> at 21 October 2016; Sean Nicholls, ‘NSW Budget 2016: $3.8 Billion for New Jail Capacity to Cover Surge in Prison Population’, Sydney Morning Herald (Sydney) 16 June 2016 <http://www.smh.com.au/nsw/nsw-budget-2016-38-billion-for-new-jail-capacity-to-cover-surge-in-prison-population-20160616-gpkhd5.html> at 21 October 2016.
12. Office of the Inspector of Custodial Services, Western Australia’s Rapidly Increasing Remand Population (2015) 21.
13. Productivity Commission, Report on Government Services 2016, vol. C (2016) 8.22; all time series financial data is adjusted to 2014–15 dollars.
14. State Government of Victoria, Getting it Done: Victorian Budget 16/17: Service Delivery, Budget Paper no. 3 (2016) 270–271; State Government of Victoria, 2006–07: Service Delivery, Budget Paper no. 3 (2006) 185.

4 Victoria’s Prison Population 2005 to 2016
1.17 Victoria’s overall average daily cost of community corrections per offender of $25.68 was also higher than the Australian average of $22.64. However, this was lower than the cost per offender in Western Australia ($46.94), the Northern Territory ($43.50), and the Australian Capital Territory ($31.78). Victoria’s average daily cost per offender has increased by 14% since 2010–11.
1.18 Victoria has the most prisoners in privately operated prisons of any Australian jurisdiction, both in absolute terms and as a proportion of Victoria’s prison population. In 2014–15, there were 1,839 Victorian prisoners in privately operated prisons, representing 29% of the Victorian prison population.15 The new Ravenhall prison will also be privately operated when it opens in 2017. According to a report by the University of Sydney Business School, ‘much higher utilisation of private prisons [in Victoria] has not translated into obvious cost efficiencies’.16
1.19 The Victorian Auditor-General noted in a 2012 report that prisons should maintain capacity at less than ‘the nationally accepted limit’ of 95% to ensure safe management and the fulfilment of human rights obligations.17 Operational utilisation has not consistently remained below the 95% limit, despite investment in prison expansion projects that have seen Victoria’s operational prison capacity increase from 3,926 prisoners on 30 June 2005 to 6,565 prisoners on 30 June 2014.18 The operational utilisation rate across all prisons exceeded this limit when measured on 30 June 2007, 2011, and 2013. The operational utilisation rate in male prisons exceeded the 95% limit in five of the years between 2006 and 2016 (at 30 June). The female prison operational utilisation rate remained below 90% in all years except 30 June 2010, when female prisoner numbers peaked at 99.7% of operational capacity.19
1.20 The costs of imprisonment increase when the system is at capacity. According to written responses to questions without notice asked in the Victorian Legislative Council, costs were awarded against Corrections Victoria for failing to present prisoners at court in 689 matters between September 2013 and 7 June 2016, amounting to $528,928.64 in costs.20
1.21 The Victorian Auditor-General found that prisoners were not being accepted into court-located police cells because those cells were ‘being used to detain sentenced and remand prisoners’ and had no spare capacity.21 On 30 June 2016, there were 171 persons held in custody in police cells, down from a peak of 372 on 18 November 2013.22
1.22 The Magistrates’ Court has indicated that while the non-production of prisoners is a ‘by-product of the increasing prison population’, a longer term solution may be found in reducing the need to attend court through greater use of technology.23
15. Productivity Commission (2016), above n 13, Table 8A.1.
16. Jane Andrew et al., Prison Privatisation in Australia: The State of the Nation (2016) 43.
17. Victorian Auditor-General, Prison Capacity Planning (2012) 9.
18. Department of Justice and Regulation, Victoria, Key Statistics on the Victorian Prison System: 2009–10 to 2013–14 (2015) 9; Department of Justice, Victoria, Statistical Profile of the Victorian Prison System: 2005–06 to 2009–10 (2011) 9; Department of Justice, Victoria, Statistical Profile of the Victorian Prison System: 2003–04 to 2007–08 (2009) 9.
19. Ibid.
20. Victoria, ‘Prisoner Transport: Written Responses to Questions Without Notice’, Parliamentary Debates, Legislative Council, 9 June 2016, 2905 (Steve Herbert, Minister for Corrections); Victoria, ‘Community Correction Orders: Written Responses to Questions Without Notice’, Parliamentary Debates, Legislative Council, 26 May 2016, 2537 (Steve Herbert, Minister for Corrections).
21. Victorian Auditor-General, Prisoner Transportation (2014) 29.
22. Corrections Victoria, ‘Daily Prisoner and Police Cells Report for Thursday, 30 June 2016’ (1 July 2016).
23. Magistrates’ Court of Victoria, Annual Report 2013/14 (2014) 4; See Evidence (Miscellaneous Provisions) Act 1958 (Vic) s 42JA, inserted by Justice Legislation (Evidence and Other Acts) Amendment Act 2016 (Vic) s 3.

1. Recent research and the focus of this report 5
1.23 The increasing number of prisoners also puts pressure on other aspects of the system. The Victorian Ombudsman noted in a 2015 review of prisoner rehabilitation that:
The reasons for the increase in numbers and cost are many, including increased rates of reoffending and legislative changes affecting parole, sentencing and bail … The evidence is plain that heightened pressure on the system has resulted in reduced access to programs and services – unsurprisingly, accompanied by a rise in reoffending ... [T]he rapid growth in numbers of people in the system and behind bars has overwhelmed the capacity to deliver consistent and effective rehabilitation or reintegration for prisoners.24
1.24 The Ombudsman reported that a high recidivism rate and a growing proportion of prisoners choosing not to apply for parole were contributing to increasing prisoner numbers (see [6.22]–[6.23]). According to the Productivity Commission, the proportion of prisoners who return to prison within two years of being released has risen from 37% in 2010–11 to 44% in 2014–15.25
Crime rates and the prison population1.25 Increasing crime rates are not necessarily caused by increasing instances of crime in the
community. Importantly, crime rates measure crimes recorded by police and are influenced by increased reporting rates. An increasing crime rate may also be influenced by improved detection, investigation, and charging practices. For example, the increase in awareness and reporting of family violence incidents will necessarily result in more crimes captured by the data.26
1.26 Similarly, an increasing crime rate may reflect the creation of new offences, particularly when those offences lead to multiple charges for what would have previously been a single offence. For example, since 2013, when a person breaches bail by assaulting another person, the accused person can be charged with the assault offence as well as a separate offence of breach of bail.27
1.27 Nonetheless, if the increasing number of reported crimes and the rate of crimes are taken at face value, then it is worth considering the relationship between reported crime rates and imprisonment.
1.28 For example, longer terms of imprisonment are often considered as a method of general deterrence aimed at reducing the incidence of certain crimes through the threat of severe penalties. Such deterrence should, in theory, reduce the demand for prison places. The prison population would not necessarily drop as a result of deterrence, however, due to the cumulative effect of prisoners being incarcerated for longer periods.
24. Victorian Ombudsman, Investigation into the Rehabilitation and Reintegration of Prisoners in Victoria (2015) 2, 8.
25. Productivity Commission (2016), above n 13, C.19.
26. See Sentencing Advisory Council, Sentencing for Contravention of Family Violence Intervention Orders and Safety Notices: Second Monitoring Report (2015) 10; Victoria, Royal Commission into Family Violence, Report and Recommendations (2016) vol. 1, 52–55.
27. Bail Act 1977 (Vic) ss 30A–30B, inserted by Bail Amendment Act 2013 (Vic) s 8.

6 Victoria’s Prison Population 2005 to 2016
1.29 Deterrence theory has long been criticised as a motivation for longer sentences:
Policy makers, the public and the media have been content to assume that any policy that increases the risk of arrest, the likelihood of imprisonment or the length of a prison term will of necessity result in a decrease in crime. Academics, on the other hand, have traditionally been rather sceptical.28
1.30 Menendez and Weatherburn recently investigated whether there was any evidence that mandatory minimum penalties effectively deter crime, using the New South Wales standard non-parole period scheme for assaults as a case study. The standard non-parole period scheme was used because it was a highly publicised policy aimed at higher sentencing severity that also had little effect on actual sentence lengths. In this way, any deterrent effect of the policy’s publicised intent could be measured separately from any effect that longer incapacitation would have, that is, without any reduction in assaults being attributable to the longer incapacitation of offenders. Overall, the authors found that:
There is no evidence in the current study to suggest that the threat of longer prison terms reduces the incidence of assault. This is not surprising. The current study is just one in a long line to cast doubt on the effectiveness of tougher penalties as a general deterrent.29
1.31 The findings in the New South Wales study correspond with the Council’s previous research.30
1.32 Imprisonment can affect crime rates in other ways. While longer sentences do not increase deterrence, the threat of a term of imprisonment does generate a deterrent effect.31 In addition, the incapacitation of people with a propensity to offend will have an impact on the crime rate while they are in prison. Conversely, imprisonment can criminalise offenders who may have only committed the offence for which they have been imprisoned, leading to more offending post-release. Overall, the relationship between imprisonment and crime is complex.
Focus of this report1.33 This report provides descriptive statistics for the current adult prison population in Victoria,
as well as discussion of the potential drivers of change observed between 2005 and 2016. The report does not measure the causal connections between these drivers and the prison population.
1.34 The focus of this report is trends in the adult prisoner population. The report does not include data on persons held in police and court cells, or those in mental health services or immigration detention. The report does not examine children and young people held in detention, either on remand or as a result of an order for detention in a youth justice centre or youth residential centre.
28. Wai-Yin Wan et al., The Effect of Arrest and Imprisonment on Crime, Crime and Justice Bulletin: Contemporary Issues in Crime and Justice no. 158 (2012) 1.
29. Patricia Menendez and Don James Weatherburn, ‘Does the Threat of Longer Prison Terms Reduce the Incidence of Assault?’ (2016) 49(3) Australian & New Zealand Journal of Criminology 389, 398–399.
30. Sentencing Advisory Council, Does Imprisonment Deter? A Review of the Evidence (2011).
31. Ibid 23. Ultimately, perception of an increased likelihood of detection is the best deterrent.

1. Recent research and the focus of this report 7
1.35 In Chapter 2, the demographics of the Victorian prison population are presented, including the number of prisoners, the imprisonment rate, gender representation, rates of imprisonment based on Indigenous status, and the number of sentenced versus unsentenced prisoners.
1.36 In Chapter 3, the crime rate and trends in recorded offences are discussed in relation to their influence on the prison population.
1.37 In Chapter 4, trends in sentencing are explored, including custody rates, imprisonment lengths, and the types of offences receiving custodial sentences.
1.38 In Chapter 5, the changing nature of the Victorian prison population is then unpacked, with statistics presented on prisoner receptions, prisoners’ most serious offences, aggregate sentence lengths, and expected time to serve.
1.39 In Chapter 6, discussion of broader influences – such as new sentencing dispositions, changes in the use of bail and remand, and parole reforms – is presented before some conclusions are drawn.
Data and data sources1.40 This report presents data on adult prisoners held in Victoria and sentences handed down
in the Magistrates’ Court and higher courts (County and Supreme Courts). The data on prisoners only includes adults held in corrective services custody.32
1.41 Prisoner data was obtained from the Australian Bureau of Statistics and Corrections Victoria. Two primary types of prisoner data were examined: the number in prison at a given point in time (sometimes referred to as the ‘stock’) and the number received into prison (sometimes referred to as the ‘flow’).
1.42 For prisoner stock numbers, the count taken on 30 June each year (known as the prisoner census) was used. Corrections Victoria data was used for 2016 only, with all other years sourced from the Australian Bureau of Statistics.33
1.43 For imprisonment rates, the crude rates reported by the Australian Bureau of Statistics were used for 2006 to 2015. Rates were calculated in 2016 using prisoner stock data from Corrections Victoria and projected population data from the Australian Bureau of Statistics.
1.44 All data in Chapter 2 refers to the prisoner census taken between 30 June 2006 and 30 June 2016. In all other chapters in this report, data is only available up to the 2014–15 financial year or the 2015 prisoner census.
1.45 Prisoner reception data was obtained from multiple Corrections Victoria sources including statistical profile publications and direct communication with the Department of Justice and Regulation.
32. Corrective services custody means persons held in gazetted Victorian prisons. In 2016 this includes Barwon Prison, Beechworth Correctional Centre, Dhurringile Prison, Fulham Correctional Centre, Hopkins Correctional Centre, Judy Lazarus Transition Centre, Langi Kal Kal Prison, Loddon Prison, Marngoneet Correctional Centre, Melbourne Assessment Prison, Metropolitan Remand Centre, Port Phillip Prison, Dame Phyllis Frost Centre, and Tarrengower Prison.
33. This data was ‘perturbed’ by the Australian Bureau of Statistics for the first time in 2015. This does not affect the trends observed in the data but may mean some data does not sum to the reported total. According to the Australian Bureau of Statistics: ‘Perturbation involves small random adjustment of the statistics and is considered the most satisfactory technique for avoiding the release of identifiable statistics while maximising the range of information that can be released’. See Australian Bureau of Statistics, Prisoners in Australia, cat. no. 4517.0 (2015) Explanatory Note 107.

8 Victoria’s Prison Population 2005 to 2016
1.46 Court data was obtained from Court Services Victoria. Magistrates’ Court data was supplied to the Council in extracts from the CourtLink case management system. Higher courts sentencing data was supplied to the Council as a database known as the higher courts sentencing database.
1.47 Court data was used to calculate custody rates, imprisonment sentence lengths, and custodial sentences by principal proven offence. The most recent data available is current to the end of the 2014–15 financial year. Magistrates’ Court sentence length data is only available from 2006–07 onwards.
1.48 The most recent police data was obtained from the Crime Statistics Agency, Victoria. Data on recorded offences has been reported from 2004–05 to 2014–15. Data on unique alleged offenders has been reported for the period from 2010–11 to 2014–15.
1.49 Throughout this report, all percentages have been rounded to whole numbers unless small changes are being reported. Data may not sum to the total due to rounding.
2. The prison population in Victoria 9
2. The prison population in Victoria2.1 This chapter presents trends in the prison population and the imprisonment rate based on
broad demographic data. The figures in this chapter paint an overall picture of the Victorian prison population as it continued to grow in the decade to 2016. For this chapter, data to 30 June 2016 is presented to capture the most recent trends.34 This chapter includes data on:
• the adult prison population (Figure 1);
• the imprisonment rate for all prisoners (Figure 2);
• the number of prisoners by legal status (Figure 3).
• the imprisonment rate for male and female prisoners (Figure 4); and
• the imprisonment rate for Aboriginal and Torres Strait Islander prisoners and non-Indigenous prisoners (Figure 5).
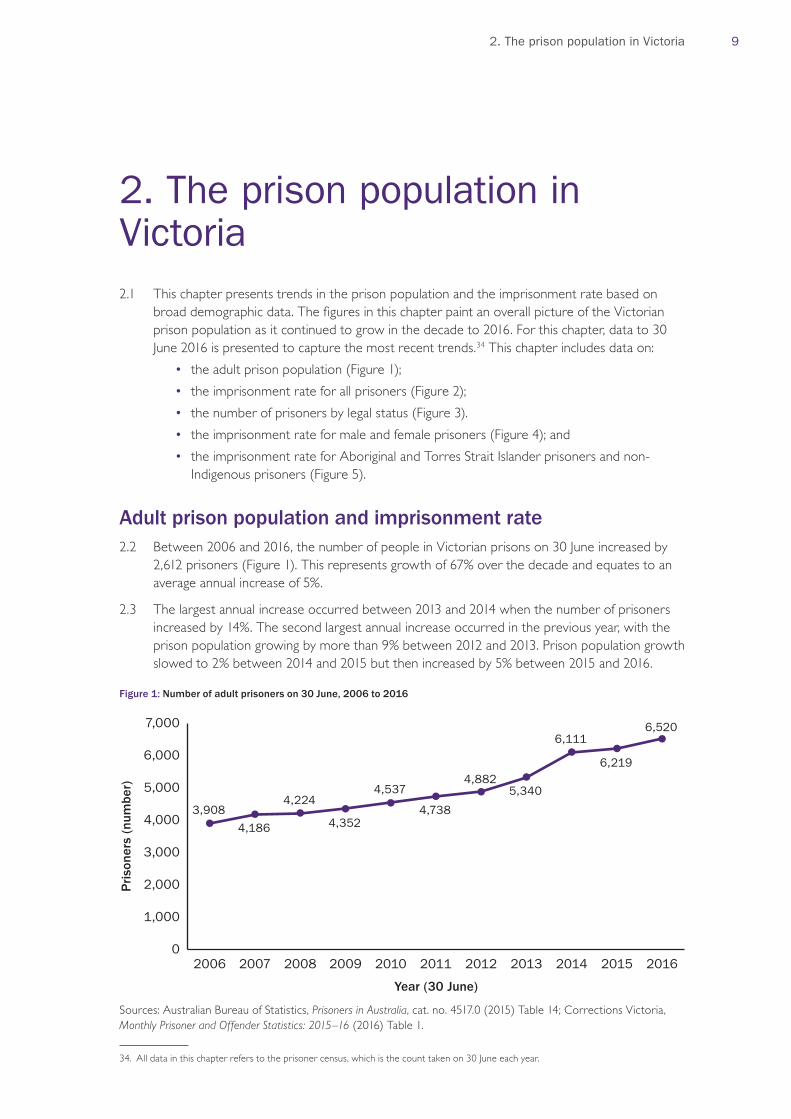
Adult prison population and imprisonment rate2.2 Between 2006 and 2016, the number of people in Victorian prisons on 30 June increased by
2,612 prisoners (Figure 1). This represents growth of 67% over the decade and equates to an average annual increase of 5%.
2.3 The largest annual increase occurred between 2013 and 2014 when the number of prisoners increased by 14%. The second largest annual increase occurred in the previous year, with the prison population growing by more than 9% between 2012 and 2013. Prison population growth slowed to 2% between 2014 and 2015 but then increased by 5% between 2015 and 2016.
Figure 1: Number of adult prisoners on 30 June, 2006 to 2016
3,908
4,186
4,224
4,352
4,537
4,738
4,8825,340
6,111
6,219
6,520
0
1,000
2,000
3,000
4,000
5,000
6,000
7,000
2006 2007 2008 2009 2010 2011 2012 2013 2014 2015 2016
Pri
sone
rs (
num
ber)
Year (30 June)
Sources: Australian Bureau of Statistics, Prisoners in Australia, cat. no. 4517.0 (2015) Table 14; Corrections Victoria, Monthly Prisoner and Offender Statistics: 2015–16 (2016) Table 1.
34. All data in this chapter refers to the prisoner census, which is the count taken on 30 June each year.

10 Victoria’s Prison Population 2005 to 2016
2.4 All things remaining equal, the prison population can be expected to increase as a consequence of increases in the general population. Figure 2 accounts for this increase by measuring the number of prisoners per 100,000 adults in Victoria. When measured as a rate, it can be seen that the prison population did plateau between 2014 and 2015, before increasing by 3% in 2016. The largest period of growth continued to be between 2012 and 2014 when the imprisonment rate increased by 20% in two years. The only year in which the imprisonment rate decreased was 2008.
Figure 2: Imprisonment rate (prisoners per 100,000 adults), 30 June, 2006 to 2016
100.5
105.7
104.4
104.9
107.2
110.2
111.6119.8
134.4
134.4
138.3
0
20
40
60
80
100
120
140
160
2006 2007 2008 2009 2010 2011 2012 2013 2014 2015 2016
Pri
sone
rs (
per
10
0,0
00
adu
lts)
Year (30 June)
Sources: Australian Bureau of Statistics, Prisoners in Australia, cat. no. 4517.0 (2015) Table 18; Corrections Victoria, Monthly Prisoner and Offender Statistics: 2015–16 (2016) Table 1; Australian Bureau of Statistics, Population Projections, Australia, 2012 (Base) to 2101, cat. no. 3222.0 (2013) Table B2.

2. The prison population in Victoria 11
Legal status2.5 The prison population includes offenders serving a sentence of imprisonment (sentenced
prisoners) and persons charged with a criminal offence who have not been granted bail and are being held on remand while awaiting trial or sentencing (unsentenced prisoners).
2.6 The two categories are affected by different processes. The remand population reflects the seriousness of charges and the willingness of the police and the judiciary to grant bail; the remand population can also be affected by the capacity to house remand prisoners. The sentenced prisoner population is a result of guilty pleas or findings of guilt that have led to a sentence of imprisonment; the sentenced prisoner population is therefore affected by the seriousness of offending and the punitiveness of sentencing practices.
2.7 The remand population has grown substantially in Victoria over the decade to 2016, both in raw numbers and as a proportion of the total prison population. Figure 3 shows that the number of prisoners on remand has increased by 154% since 2006. The increase has been most marked since 2013.
2.8 The sentenced prisoner population increased by 46% over this decade. While the number of sentenced prisoners decreased in 2015 and 2016, the number of sentenced prisoners in 2016 still exceeded the number of sentenced prisoners in any of the years prior to 2014.
2.9 Even though the number of people on remand fell in 2010 and 2013, overall growth in the remand population outpaced growth in the sentenced prisoner population between 2006 and 2016. As a result, the unsentenced prisoner population grew from 19% of the prison population to 29% over this decade.
2.10 The increase in the proportion of the prison population represented by unsentenced prisoners is due to two factors: the increase in the unsentenced prisoner population since 2013 and the decrease in the sentenced prisoner population since 2014 (after a period of substantial growth). The number of sentenced prisoners increased by 13% in 2014, before falling by 4% in 2015, and falling by a further 3% in 2016. Over the same three years, the remand population increased by 19%, 26%, and 31% respectively.
Figure 3: Prisoners by legal status, 30 June, 2006 to 2016
3,168
3,378
3,414
3,538
3,731
3,861
3,8864,384
4,973
4,788
4,637
740
808
810
814
806
877
996
956
1,1381,434
1,883
0
1,000
2,000
3,000
4,000
5,000
6,000
2006 2007 2008 2009 2010 2011 2012 2013 2014 2015 2016
Pri
sone
rs (
num
ber)
Year (30 June)
Sentenced
Unsentenced
Sources: Australian Bureau of Statistics, Prisoners in Australia, cat. no. 4517.0 (2015) Table 16; Corrections Victoria, Monthly Prisoner and Offender Statistics: 2015–16 (2016) Table 1.

12 Victoria’s Prison Population 2005 to 2016
Male and female prisoners2.11 The vast majority of Victorian prisoners are male (approximately 93%). Between 2006 and
2016, the number of male prisoners increased from 3,660 prisoners in 2006 to 6,092 in 2016 (a 66% increase). As a proportion of the Victorian adult male population, the number of male prisoners increased by 37%, from 192.8 male prisoners per 100,000 male adults to 263.9 male prisoners per 100,000 male adults (Figure 4).
2.12 While female prisoners represent a much smaller proportion of the prison population (approximately 7%), the number of females in Victorian prisons has grown substantially over the decade to 2016. Between 30 June 2006 and 30 June 2016, the female prisoner population increased by 75%, from 245 females to 428 females. Although the female imprisonment rate continues to be much lower than the male imprisonment rate, the female rate experienced more growth between 2006 and 2016 (45%) than the male rate (Figure 4).
2.13 The male and female imprisonment rates both decreased in 2008. The male imprisonment rate also fell slightly in 2009 and 2015, but this was counteracted by an increase in the female imprisonment rate in those years.
Figure 4: Imprisonment rate by gender (prisoners per 100,000 female/male adults), 30 June, 2006 to 2016
192.8
202.6
201.0
199.9
203.4
209.7
212.2
227.3
256.2
256.1
263.9
12.3 12.7 11.5 13.4 14.5 14.6 15.2 16.5 17.5 17.8 17.8
0
100
200
300
2006 2007 2008 2009 2010 2011 2012 2013 2014 2015 2016
Pri
sone
rs (
per
10
0,0
00
mal
e/fe
mal
e ad
ults
)
Year (30 June)
Male
Female
Sources: Australian Bureau of Statistics, Prisoners in Australia, cat. no. 4517.0 (2015) Table 14; Corrections Victoria, Monthly Prisoner and Offender Statistics: 2015–16 (2016) Table 1; Australian Bureau of Statistics, Population Projections, Australia, 2012 (Base) to 2101, cat. no. 3222.0 (2013) Table B2.

2. The prison population in Victoria 13
Aboriginal and Torres Strait Islander prisoners2.14 The number of Aboriginal and Torres Strait Islander people in Victorian prisons increased from
approximately 215 prisoners on 30 June 2006 to 531 prisoners on 30 June 2016 (an increase of 147%). Over the same period, the number of non-Indigenous prisoners increased by 62%. Overall, the proportion of the Victorian prison population represented by Aboriginal and Torres Strait Islander prisoners increased from less than 6% in 2006 to more than 8% in 2016. Aboriginal and Torres Strait Islander people over the age of 18 accounted for less than 0.7% of the Victorian population aged over 18 in 2016.
2.15 At 30 June 2015, the Aboriginal and Torres Strait Islander prisoner population was 9% female and 91% male. The non-Indigenous prisoner population was 7% female and 93% male. On the same day, 10% of the female prisoner population was Aboriginal and Torres Strait Islander and 8% of the male prisoner population was Aboriginal and Torres Strait Islander.
2.16 Figure 5 shows that the rates of imprisonment of Aboriginal and Torres Strait Islander prisoners as a proportion of the Indigenous population are markedly different from the imprisonment rates for the non-Indigenous population.35
2.17 Between 30 June 2006 and 30 June 2016, the imprisonment rate for Aboriginal and Torres Strait Islander prisoners increased by 70%. This growth was staggered, with some years experiencing steep increases in the imprisonment rate and others experiencing small decreases. This is largely due to the small size of the Aboriginal and Torres Strait Islander population in Victoria, which means that small changes in the number of prisoners will have a large effect on the imprisonment rate.
Figure 5: Imprisonment rate by Indigenous status (prisoners per 100,000 Aboriginal and Torres Strait Islander/non-Indigenous adults), 30 June, 2006 to 2016
968.9
1,027.8
1,012.9
956.7
1,106.4
1,080.7
1,317.7
1,330.2
1,573.2
1,540.8
1,649.1
95.6 100.3 98.9 99.7 101.0 104.0 103.8 111.8 124.5 124.6 127.9
0
600
1,200
1,800
2006 2007 2008 2009 2010 2011 2012 2013 2014 2015 2016
Pri
sone
rs (
per
10
0,0
00
adu
lts)
Year (30 June)
Aboriginal and Torres Strait Islander
Non-Indigenous
Sources: Australian Bureau of Statistics, Prisoners in Australia, cat. no. 4517.0 (2015); Corrections Victoria, Monthly Prisoner and Offender Statistics: 2015–16 (2016) Table 1; Australian Bureau of Statistics, Estimates and Projections, Aboriginal and Torres Strait Islander Australians, 2001 to 2026, cat. no. 3238.0 (2014) Series B.36
35. The reported imprisonment rates have not been age-standardised to account for the fact that the likelihood of imprisonment is correlated with age. It is likely that the imprisonment rate in the Aboriginal and Torres Strait Islander population will be higher due to the larger proportion of young people in this population. Caution is therefore advised in making direct comparisons as to the likelihood of imprisonment based on Indigenous status.
36. Rates from 2012 onwards are based on the Series B (assumed moderate population growth) projection instead of estimated resident population figures. Population projections are based on assumptions about future fertility and mortality rate trends.

14 Victoria’s Prison Population 2005 to 2016
2.18 At 30 June 2016, the number of Aboriginal and Torres Strait Islander prisoners represented 1.6% of the Victorian adult Aboriginal and Torres Strait Islander population. This is compared with non-Indigenous prisoners representing 0.1% of the adult non-Indigenous population.
2.19 For Aboriginal and Torres Strait Islander prisoners, the years with the largest increase in imprisonment rates were:
• 2010 (16%);
• 2012 (22%); and
• 2014 (18%).
2.20 Between 2006 and 2016, the non-Indigenous imprisonment rate increased by 34%. The largest increase in the non-Indigenous imprisonment rate was in 2014 (11%).
Prison population observations2.21 The above figures demonstrate that, while the Victorian prison population has grown
substantially over the past decade, this growth has not been experienced equally by all groups within that population.
2.22 In particular, between 30 June 2006 and 30 June 2016:
• the number of unsentenced prisoners experienced higher percentage growth than sentenced prisoners (a 154% increase compared with 46%);
• the proportion of the prison population represented by unsentenced prisoners increased by 53% (compared with a 12% decrease in the sentenced population);
• the number of female prisoners experienced higher percentage growth than male prisoners (a 75% increase compared with 66%);
• the female imprisonment rate grew more quickly than the male imprisonment rate (a 45% increase compared with 37%);
• the number of Aboriginal and Torres Strait Islander prisoners experienced higher percentage growth than non-Indigenous prisoners (a 147% increase compared with 62%); and
• the Aboriginal and Torres Strait Islander imprisonment rate grew more quickly than the non-Indigenous imprisonment rate (a 70% increase compared with 34%).
2.23 An analysis of growth in the number of prisoners on 30 June 2006 and 30 June 2016 reveals that:
• 56% of the growth was represented by sentenced prisoners and 44% was represented by unsentenced prisoners;
• 93% of the growth was in male prisoners and 7% was in female prisoners; and
• 88% of the growth was in non-Indigenous prisoners and 12% was in Aboriginal and Torres Strait Islander prisoners.

3. Offences in Victoria 15
3. Offences in Victoria3.1 This chapter examines whether the prison population is being influenced by an increasing
demand for prison places as a result of increased offending. The number of recorded offences is presented in Figure 6, and the rate of offending as a proportion of the Victorian population is presented in Figure 7. The types of offending behaviour are discussed in relation to the number of unique alleged offenders processed by police (Figure 8). This chapter presents data for the decade between the 2004–05 and 2014–15 financial years.
Crime rates3.2 Increases in the prison population and the imprisonment rate may be influenced by an increase
in the amount of crime. It is important to note, however, that the data only captures recorded crime that has been reported to police and a person may not have been identified, prosecuted, or sentenced for a reported offence.
3.3 Figure 6 shows the number (in thousands) of offences recorded by police. Overall, the following trends occurred:
• the number of offences recorded by police increased by 24%, from 377,706 in 2004–05 to 469,830 in 2014–15;
• the number of offences recorded per year was relatively stable until 2010–11, increasing with each subsequent financial year; and
• the stability experienced between 2004–05 and 2010–11 came after a steady decrease in the number of offences recorded by Victoria Police, from a peak of 451,609 recorded offences in 2000–01.37
Figure 6: Number of offences recorded by police (thousands), 2004–05 to 2014–15
378
378
380
381
386
380
378
407
425
449
470
0
100
200
300
400
500
600
Rec
orde
d of
fenc
es (
num
ber
'00
0s)
Financial year
2004−05
2005−06
2006−07
2007−08
2008−09
2009−10
2010−11
2011−12
2012−13
2013−14
2014−15
Source: Crime Statistics Agency, Victoria, Offences Recorded: Year Ending 30 June 2015 (2015).
37. See Victoria Police, Crime Statistics 2006/2007 (2007) 5.

16 Victoria’s Prison Population 2005 to 2016
3.4 As with the prison population (see [2.2]–[2.4]), the number of recorded offences will necessarily increase as the population grows. The number of offences per 100,000 population38 therefore provides an accurate measure of whether the rate of offending is increasing. Figure 7 shows the rate per 100,000 population in Victoria of offences recorded by police.
3.5 Between 2004–05 and 2014–15, the crime rate increased by 4%. Specifically, the crime rate:
• decreased steadily between 2004–05 and 2010–11;
• increased in each financial year between 2010–11 and 2014–15; and
• increased the most between 2010–11 and 2011–12 (up 6%).
Figure 7: Offences recorded by police per 100,000 population, 2004–05 to 2014–15
2004−05
2005−06
2006−07
2007−08
2008−09
2009−10
2010−11
2011−12
2012−13
2013−14
2014−15
7,570
7,463
7,382
7,250
7,177
6,952
6,825
7,223
7,409
7,691
7,895
0
2,000
4,000
6,000
8,000
10,000
Off
ence
s (p
er 1
00,0
00
peo
ple)
Financial year
Source: Crime Statistics Agency, Victoria, Offences Recorded: Year Ending 30 June 2015 (2015).
Unique alleged offenders by category of offending3.6 The above analysis demonstrates that both the number of offences and the rate of offending
have increased in recent years, particularly since 2010–11. The drivers of these increases, and whether offending behaviour has changed in ways that may influence the prison population, can be examined by analysing the number of unique alleged offenders processed and the crimes for which they have been apprehended.
3.7 Throughout this report, offences have been grouped into six categories: person, property, drug, public order, justice procedures, and other (Table 1). In this chapter, Crime Statistics Agency data has been grouped into these categories. In the remaining chapters, offences have been grouped using Australian and New Zealand Standard Offence Classification codes prepared by the Australian Bureau of Statistics. Appendix A contains an explanation of how the categories differ between the Crime Statistics Agency data and the Australian Bureau of Statistics data.
38. In this chapter, offence rates are calculated per 100,000 population because offences can be committed by non-adults (as per the Crime Statistics Agency data). Data in the remainder of the report is calculated per 100,000 adults (as per the Australian Bureau of Statistics data). Where resident population data was not available, Victoria’s estimated resident population in the June quarter of each year was taken from Australian Bureau of Statistics, Population Projections, Australia, 2012 (Base) to 2101, cat. no. 3222.0 (2013) Table B2.

3. Offences in Victoria 17
Table 1: Most serious offence categories
Offence category (short title) Offence subcategory (short title)
Offences against the person (person)
Homicide and related offences (homicide)
Acts intended to cause injury (cause injury)
Sexual assault and related offences (sexual assault)
Dangerous or negligent acts endangering persons (dangerous acts)
Abduction, harassment, and other offences against the person (abduction)
Robbery, extortion, and related offences (robbery)
Property and deception offences (property)
Arson
Property damage
Burglary/break and enter
Theft
Deception
Bribery
Drug offences (drug)
Drug dealing and trafficking
Cultivating or manufacturing drugs
Drug use and possession
Public order offences (public order)
Weapons and explosives offences
Disorderly and offensive conduct
Public nuisance offences
Public security offences
Justice procedures offences (justice procedures)
Justice procedures
Breaches of orders
Other offences (other)
Regulatory driving offences
Transport regulation offences
Other government regulatory offences
Miscellaneous offences
Modified from Crime Statistics Agency, Victoria, Offence Classification (2016).

18 Victoria’s Prison Population 2005 to 2016
3.8 Figure 6 shows the number of all recorded offences, even when committed by the same person in the same criminal interaction. By contrast, the number of unique alleged offenders counts the number of individual persons processed by Victoria Police (Figure 8). This means that no matter how many offences or incidents a person was involved in during that financial year, that person is only counted once. Changes in this measure therefore demonstrate whether increases in the number of recorded offences can be attributed to a growth in the number of unique alleged offenders committing crimes (and thereby whether there is an increase in the number of individuals who could be sentenced to a term of imprisonment).
3.9 Figure 8 shows the number of unique alleged offenders by offence type for the 2010–11 to 2014–15 period. The total number of unique alleged offenders increased by 11% over this period. The rate per 100,000 population increased from 1,531.2 unique alleged offenders in 2010–11 to 1,582.3 unique alleged offenders in 2014–15 (an increase of 3%).
3.10 The number of unique alleged offenders increased for offences against the person, drug offences, and justice procedures offences, with the category of offences against the person having the largest number of unique alleged offenders.
Figure 8: Number of unique alleged offenders recorded, by offence category, 2010–11 to 2014–15
23,268
25,539
29,17430,920
32,879
23,696
22,396 22,579 21,48019,284
6,8417,736
8,495 8,7029,846
15,15614,013 14,232
12,951 12,417
4,5175,440 5,760 6,309
7,414
0
5,000
10,000
15,000
20,000
25,000
30,000
35,000
2010–11 2011–12 2012–13 2013–14 2014–15
Uni
que
alle
ged
offe
nder
s (n
umbe
r)
Financial year
Person
Property
Drug
Public order
Justice procedures
Source: Crime Statistics Agency, Victoria, Unique Alleged Offenders: Year Ending 30 June 2015 (2015) Table 3.

3. Offences in Victoria 19
3.11 Between 2010–11 and 2014–15, the number of unique alleged offenders:
• increased by 64% for justice procedures offences;
• increased by 44% for drug offences;
• increased by 41% for offences against the person;
• decreased by 19% for property offences; and
• decreased by 18% for public order offences.
3.12 Within the category of offences against the person, the largest increases in the number of unique alleged offenders occurred in the subcategories of abduction offences (up 76%), cause injury offences (up 44%), and sexual assault (up 34%). The only subcategory to decrease over the period was robbery (down 20%). In 2014–15, cause injury offences were the most common subcategory: 72% of unique alleged offenders who were apprehended for an offence against the person were apprehended for a cause injury offence.
3.13 For justice procedures offences, the majority of the increase in unique alleged offenders was in the subcategory of breaches of orders, which increased by 79% between 2010–11 and 2014–15.
3.14 Between 2010–11 and 2014–15, the number of unique alleged offenders increased in all drug subcategories, including drug dealing and trafficking (up 53%), cultivate or manufacture drugs (up 26%), and drug use and possession (up 43%). In 2014–15, the most common drug subcategory that unique alleged offenders were apprehended for was drug use and possession (57% of unique alleged offenders who were apprehended for a drug offence).
3.15 While there was an overall decrease in property offences, the number of unique alleged offenders in the arson and deception subcategories increased (up 68% and 27% respectively). These were overshadowed by decreases in theft (down 34%) and burglary (down 20%).
3.16 Similarly, there were reductions in the number of unique alleged offenders in all subcategories of public order offences, with the exception of weapons and explosives offences, which increased by 69% over the period.
Offence data observations3.17 The number of recorded offences and the crime rate have both increased since 2010–11.
Therefore, assuming a constant rate of offences per offender, the number of sentences and sentenced prisoners would also be expected to increase.
3.18 The analysis of unique alleged offenders demonstrates that between 2010–11 and 2014–15, the majority of unique alleged offenders were apprehended for offences against the person. Within the category of offences against the person, most unique alleged offenders were apprehended for cause injury offences. The variety of offence seriousness captured within the cause injury subcategory makes the relationship between the increase in this type of offending and any increases in custodial sentences uncertain.
3.19 The increase in unique alleged offenders apprehended for drug offences has a more direct relationship with the prison population as people apprehended for this type of offending are more likely to be held on remand and more likely to receive a custodial sentence. This is particularly the case for persons apprehended for offences in the drug subcategory of drug dealing and trafficking, which includes the Commonwealth offences of drug importation and exportation (see [6.13]).

20 Victoria’s Prison Population 2005 to 2016
3.20 Conversely, while unique alleged offenders apprehended for justice procedures offences have a high likelihood of being held on remand (due to breaches of previous orders), this category may involve less serious offending that is unlikely to receive a custodial sentence.
3.21 As a result, the above trends indicate that, while the number of unique alleged offenders does not directly translate into the number of custodial sentences, an increase may be expected in the number of custodial sentences imposed for offences against the person, particularly for cause injury offences. The increase in the number of unique alleged offenders may also result in an increase in the number of people on remand for justice procedures offences and drug offences.

4. Sentences of imprisonment in Victoria 21
4. Sentences of imprisonment in Victoria4.1 Changes in the number of recorded offences and in patterns of offending are drivers of the
imprisonment rate and prison population. However, these changes represent influences at only the initial stage of the criminal justice process. The most direct factor affecting the size of the sentenced prisoner population is the frequency with which courts impose sentences of imprisonment and the length of those imprisonment sentences.
4.2 This chapter presents sentencing data to examine influences on the sentenced prisoner population. In particular, this chapter analyses the growth in the sentenced prisoner population observed over the decade from 2004–05 to 2014–15, including the substantial increase between 30 June 2012 and 30 June 2014 and the subsequent decrease since 2014 presented in Chapter 2 (Figure 3).
4.3 This chapter examines court data on the number of custodial sentences, the rate of custodial sentences, and imprisonment sentence lengths. Sentencing data is then broken down by categories of offending in the Magistrates’ Court and higher courts.
4.4 For the purposes of this chapter, a custodial sentence includes any sentence for which a portion of the sentence is spent in custody, including a sentence of imprisonment, a partially suspended sentence, and a combined sentence (such as a short term of imprisonment combined with a community correction order).
The number of sentences of imprisonment4.5 The number of prisoners necessarily varies depending on the number of offenders sentenced
to a term of imprisonment. As shown in Figure 9 (page 22), the number of offenders receiving custodial sentences has increased for both the Magistrates’ Court and, to a lesser extent, the higher courts.
4.6 The number of custodial sentences imposed across all courts increased by 34%, from 5,323 custodial sentences in 2004–05 to 7,134 in 2014–15. This can largely be attributed to growth in the number of custodial sentences imposed in the Magistrates’ Court, which increased by 40% between 2004–05 and 2014–15 (compared with an increase of 9% in the higher courts). As a result, of the total number of custodial sentences imposed across all courts for this period, the proportion imposed in the Magistrates’ Court increased from 80% in 2004–05 to 84% in 2014–15.
4.7 The increase in the number of custodial sentences imposed in the Magistrates’ Court is largely a product of an overall increase in the number of cases sentenced by the Magistrates’ Court (up 30%). In contrast, the proportion of offenders before the Magistrates’ Court that received a custodial sentence remained relatively stable over the same period (see Figure 10).

22 Victoria’s Prison Population 2005 to 2016
Figure 9: Number of custodial sentences by court level, 2004–05 to 2014–15
4,276
4,301
4,212
4,024
4,297
4,866
4,196
4,459
5,2995,531
5,993
1,047
1,061
1,127
1,206
1,125
1,220
1,243
1,216
1,309 1,287 1,141
0
1,000
2,000
3,000
4,000
5,000
6,000
Off
ende
rs (
num
ber)
Financial year
Higher courts
Magistrates' Court
2004−05
2005−06
2006−07
2007−08
2008−09
2009−10
2010−11
2011−12
2012−13
2013−14
2014−15
Source: Court Services Victoria, unpublished data.
4.8 The small increase in the number of custodial sentences imposed in the higher courts occurred despite a 14% decrease in the overall number of cases sentenced in the higher courts (from 2,060 sentences in 2004–05 to 1,774 in 2014–15). This is due to a 27% increase in the custody rate for the higher courts over the same period (see Figure 10). The number of custodial sentences imposed in the higher courts has dropped since 2012–13, with the number of custodial sentences imposed in 2014–15 being below the average of 1,180 for the decade to 2014–15.
4.9 An increase in the number of custodial sentences imposed in the higher courts has a longer lasting influence on the prison population than an increase in the Magistrates’ Court. This is due to custodial sentences imposed by the higher courts being longer on average than those imposed in the Magistrates’ Court (see Figure 13).
4.10 Therefore, an increase in the proportion of custodial sentences imposed in the Magistrates’ Court, which are on average shorter than those imposed in the higher courts, can lead to an overall decrease in the sentenced prisoner population.
Custody rates4.11 The custody rate is a measure of the proportion of all sentences that receive any term of
imprisonment (i.e. a custodial sentence). Custody rates are calculated by obtaining the total number of offenders who received a custodial sentence and dividing it by the total number of offenders who were proven guilty (i.e. offenders who either pleaded guilty or were found guilty in court). An increase in the custody rate may therefore lead to an increase in the prison population as more offenders receive terms of imprisonment, independent of any increase in the number of offenders.

4. Sentences of imprisonment in Victoria 23
4.12 On the one hand, changes in the custody rate could suggest that the type of offending before the courts has also changed, through either different offences or more or less serious examples of the same offences. On the other hand, fluctuations in the custody rate can measure how punitive a court is, whereby offending of the same level of seriousness is more or less likely to result in a custodial sentence. For example, sentences for offences of the same level of seriousness could become more punitive as a consequence of legislative reform, such as the abolition of suspended sentences or the introduction of community correction orders that may be combined with terms of imprisonment.39
4.13 It is worth noting, however, that not all offenders who receive a custodial sentence subsequently enter the sentenced prisoner population. For instance, some offenders who receive a custodial sentence have already served their entire sentence while on remand, in advance of their sentence date.
4.14 The overall custody rate for all sentences imposed by Victorian courts remained low and stable between 2004–05 and 2014–15. The custody rate across all courts increased 0.3 of a percentage point, with 7.1% of offenders receiving a custodial sentence in 2004–05 and 7.4% of offenders receiving a custodial sentence in 2014–15. This is a consequence of custodial sentences comprising only a small percentage of sentences imposed in the Magistrates’ Court, where the majority of offenders are sentenced.
4.15 Different trends can be seen by taking a closer look at the custody rates at each court level. Figure 10 details the custody rates for the Magistrates’ Court and the higher courts by financial year. The custody rate for offenders sentenced in the Magistrates’ Court has remained relatively stable, increasing from 5.9% of offenders in 2004–05 to 6.3% of offenders in 2014–15 (an increase of 8%).
Figure 10: Custody rates by court level, 2004–05 to 2014–15
5.9 6.1 5.9 5.0 5.2 5.9 5.4 5.5 6.3 6.1 6.3
50.8 52.5 53.8 54.857.4
64.1 62.6 62.368.5 66.5 64.3
0
20
40
60
80
Cus
todi
al s
ente
nces
(pr
opor
tion
%)
Financial year
Higher courts
Magistrates’ Court
2004−05
2005−06
2006−07
2007−08
2008−09
2009−10
2010−11
2011−12
2012−13
2013−14
2014−15
Source: Court Services Victoria, unpublished data.
39. See for example, Sentencing Act 1991 (Vic) s 44, amended by Sentencing Amendment (Emergency Workers) Act 2014 (Vic) s 18.

24 Victoria’s Prison Population 2005 to 2016
4.16 In contrast, the custody rate in the higher courts increased by a statistically significant 27% between 2004–05 and 2014–15. The custody rate peaked in the higher courts in 2012–13, when over 68% of offenders sentenced in the higher courts received a custodial sentence. Nonetheless, the slight reduction in the custody rate since 2012–13 still sees a higher proportion of offenders receiving a custodial sentence in 2014–15 than in any of the years prior to the peak.
4.17 The increasing custody rate, particularly in the higher courts, is likely to have been influenced by a number of legislative reforms. This includes the abolition of suspended sentences, the introduction and subsequent reform of community correction orders, and changes to parole (see [6.2]–[6.11]).
4.18 As the custody rate can be influenced by the availability of sentencing dispositions, Figures 11 and 12 detail the rates of imposition of the major types of sentences in the Magistrates’ Court and higher courts respectively.
4.19 The types of sentencing dispositions measured in Figures 11 and 12 are:
• imprisonment only;
• imprisonment combined with community orders;40
• community orders only;
• partially suspended sentences; and
• wholly suspended sentences.
4.20 Sentences of imprisonment only, imprisonment combined with community orders, and partially suspended sentences are all custodial sentences. They are encompassed in the custody rate as they involve a period of imprisonment.
4.21 Figure 11 (page 25) shows that, between 2004–05 and 2014–15, the use of imprisonment-only sentences in the Magistrates’ Court fluctuated slightly, between 4.1% and 5.0% of sentences imposed in that jurisdiction. The use of wholly suspended sentences fell dramatically following the phasing out of their use for serious and significant offences in 2011.
4.22 Since the abolition of suspended sentences in the Magistrates’ Court for offences committed on or after 1 September 2014, there was a marked increase in the use of community correction orders on their own and imprisonment combined with community correction orders. Between 2013–14 and 2014–15, the rate of community correction orders increased by 21%, and the rate of imprisonment combined with community orders doubled.
4.23 When the number, rather than the rate, of various sentencing orders is measured, sentences in the Magistrates’ Court between 2004–05 and 2014–15:
• increased from 124 to 1,559 sentences for imprisonment combined with community orders (up 1,157%);
• increased from 6,026 to 9,192 sentences for community orders (up 53%);
• increased from 3,478 to 4,106 sentences for imprisonment only (up 18%);
• decreased from 674 to 328 sentences for partially suspended sentences (down 51%); and
• decreased from 5,176 to 2,672 sentences for wholly suspended sentences (down 48%).
40. Community orders include community-based orders, intensive correction orders, and community correction orders. Community correction orders replaced community-based orders and intensive correction orders in 2012.

4. Sentences of imprisonment in Victoria 25
Figure 11: Rates of sentence types, Magistrates’ Court, 2004–05 to 2014–15
4.8 5.0 4.8
4.1 4.14.7
4.3 4.34.7
4.3 4.3
0.2 0.2 0.2 0.2 0.2 0.2 0.2 0.30.6 0.8
1.7
8.3 8.3 8.1
7.27.7
8.1
8.17.6 7.9 8.0
9.7
0.9 0.9 0.9 0.7 0.9 1.0 1.0 0.9 0.9 0.90.3
7.16.9 6.7 6.9
7.88.3
7.9
5.8
5.55.0
2.8
0
1
2
3
4
5
6
7
8
9
10
Sen
tenc
e ty
pes
(pro
port
ion
%)
Financial year
Imprisonment only
Imprisonment combinedwith community orders
Community orders only
Partially suspended sentences
Wholly suspended sentences
1 May 2011(b)1 Nov 2006(a)
16 Jan 2012(c)
1 Sep 2014(d)
2004−05
2005−06
2006−07
2007−08
2008−09
2009−10
2010−11
2011−12
2012−13
2013−14
2014−15
Source: Court Services Victoria, unpublished data.
(a) Wholly suspended sentences only available under exceptional circumstances for serious offences committed on or after 1 November 2006.
(b) Suspended sentences abolished for serious and significant offences committed on or after 1 May 2011.
(c) Community correction orders introduced on 16 January 2012.
(d) Suspended sentences abolished in the Magistrates’ Court for all offences committed on or after 1 September 2014.
4.24 Similar trends occurred in the higher courts. Figure 12 (page 26) shows that the use of imprisonment-only sentences decreased as a proportion of total sentences (from 59% of sentences to 48%) following the abolition of suspended sentences in the higher courts for offences committed on or after 1 September 2013. At the same time, the use of imprisonment combined with community orders increased as a proportion of total sentences (from 2% of sentences to 12%).
4.25 Following the replacement of various community orders with the community correction order on 16 January 2012, the use of community orders increased by 103% between 2011–12 and 2014–15 (from 10% of sentences to 21%).
4.26 When the number, rather than the rate, of various sentencing orders is measured, sentences in the higher courts between 2004–05 and 2014–15:
• increased from 12 to 215 sentences for imprisonment combined with community orders (up 1,692%);
• increased from 262 to 377 sentences for community orders (up 44%);
• increased from 820 to 857 sentences for imprisonment only (up 5%);
• decreased from 539 to 125 sentences for wholly suspended sentences (down 77%); and
• decreased from 215 to 69 sentences for partially suspended sentences (down 68%).
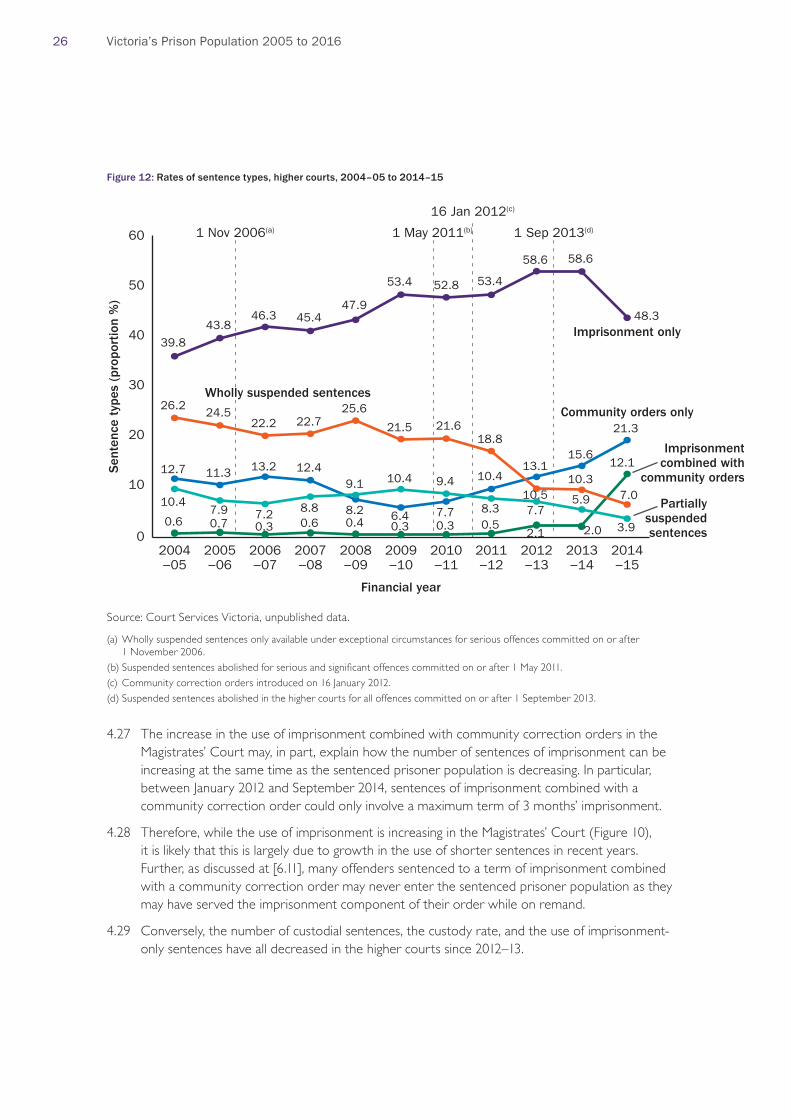
26 Victoria’s Prison Population 2005 to 2016
Figure 12: Rates of sentence types, higher courts, 2004–05 to 2014–15
39.8
43.846.3 45.4
47.9
53.4 52.8 53.4
58.6 58.6
48.3
0.6 0.7 0.3 0.6 0.4 0.3 0.3 0.52.1 2.0
12.112.7 11.3 13.2 12.4
8.2 6.4 7.7
10.413.1
15.6
21.3
10.47.9 7.2 8.8
9.1 10.4 9.4
8.3 7.75.9
3.9
26.224.5
22.2 22.725.6
21.5 21.618.8
10.510.3
7.0
0
10
20
30
40
50
60
Sen
tenc
e ty
pes
(pro
port
ion
%)
Financial year
Imprisonment only
Imprisonmentcombined with
community orders
Community orders only
Partiallysuspendedsentences
Wholly suspended sentences
1 May 2011(b)1 Nov 2006(a)
16 Jan 2012(c)
1 Sep 2013(d)
2004−05
2005−06
2006−07
2007−08
2008−09
2009−10
2010−11
2011−12
2012−13
2013−14
2014−15
Source: Court Services Victoria, unpublished data.
(a) Wholly suspended sentences only available under exceptional circumstances for serious offences committed on or after 1 November 2006.
(b) Suspended sentences abolished for serious and significant offences committed on or after 1 May 2011.
(c) Community correction orders introduced on 16 January 2012.
(d) Suspended sentences abolished in the higher courts for all offences committed on or after 1 September 2013.
4.27 The increase in the use of imprisonment combined with community correction orders in the Magistrates’ Court may, in part, explain how the number of sentences of imprisonment can be increasing at the same time as the sentenced prisoner population is decreasing. In particular, between January 2012 and September 2014, sentences of imprisonment combined with a community correction order could only involve a maximum term of 3 months’ imprisonment.
4.28 Therefore, while the use of imprisonment is increasing in the Magistrates’ Court (Figure 10), it is likely that this is largely due to growth in the use of shorter sentences in recent years. Further, as discussed at [6.11], many offenders sentenced to a term of imprisonment combined with a community correction order may never enter the sentenced prisoner population as they may have served the imprisonment component of their order while on remand.
4.29 Conversely, the number of custodial sentences, the custody rate, and the use of imprisonment-only sentences have all decreased in the higher courts since 2012–13.

4. Sentences of imprisonment in Victoria 27
Length of imprisonment4.30 The average (mean) length of a sentence of imprisonment has an effect on the prison
population because when mean sentence lengths increase, the cumulative effect of more prisoners remaining in prison for longer causes the prison population to grow (and vice versa).
4.31 The data presented below refers to the total effective sentence. The total effective sentence is imposed by the court in cases in which there are multiple proven charges, and it takes into account sentences attached to all charges. In cases in which there are multiple sentences, the total effective sentence is a more accurate representation of the true sentence length than, for example, the length attached to an individual charge.
4.32 It is possible, however, that offenders are released before the end of their total effective sentence if a non-parole period is set.41 Similarly, offenders sentenced to imprisonment combined with a community correction order will continue to serve their sentence in the community, sometimes for substantial periods of time.42
4.33 Figure 13 details the combined and individual average custodial sentence lengths for the Magistrates’ Court and the higher courts for cases sentenced between 2006–07 and 2014–15. The average imprisonment sentence length for all cases decreased over the period, from 1 year and 2 months in 2006–07 to 11 months and 15 days in 2014–15 (a decrease of 18%). Since the option of combining a term of imprisonment with a community correction order was introduced in January 2012, average sentence lengths across all courts have decreased by 23%.
Figure 13: Average (mean) imprisonment sentence length by court level, 2006–07 to 2014–1543
5.3 5.7 5.7 5.9 6.0 5.8 5.8 5.3 5.0
46.443.8
47.1
51.848.9 48.5 48.8 48.5
45.5
14.0 14.4 14.3 15.1 15.8 14.9 14.3 13.411.5
0
10
20
30
40
50
60
2006–07
2007–08
2008–09
2009–10
2010–11
2011–12
2012–13
2013–14
2014–15
Mea
n im
pris
onm
ent
leng
th (m
onth
s)
Financial year
Magistrates’ Court
Higher courts
Combined Magistrates’ Court and higher courts
Source: Court Services Victoria, unpublished data.
41. Under section 11 of the Sentencing Act 1991 (Vic), a non-parole period must be set for sentences of imprisonment of two years or more unless the court considers that a non-parole period is inappropriate due to the nature of the offending or the past history of the offender. For sentences of imprisonment of one year or more but less than two years, the court may exercise discretion as to whether it imposes a non-parole period. For sentences of less than one year, the court cannot impose a non-parole period.
42. Sentencing Act 1991 (Vic) s 44.
43. Due to a high volume of missing data on sentence lengths for the Magistrates’ Court in 2004–05 and 2005–06, these years have been excluded from the analysis. For partially suspended sentences, only the custodial portion of the total effective sentence was included, in contrast to the Council’s previous reports on Victoria’s prison population. Missing total effective sentence lengths were substituted with the charge imprisonment length for the principal proven offence for a minority of cases sentenced in the Magistrates’ Court (between 52 and 165 per financial year). Cases that received a life sentence (n = 31) in the higher courts were excluded.

28 Victoria’s Prison Population 2005 to 2016
4.34 Given the decrease in the sentenced prisoner population in 2015 and 2016 (Figure 3), it is clear that the drop in average sentence lengths in both the Magistrates’ Court and the higher courts in recent years has had an influence on the size of the sentenced prisoner population.
Custodial sentences by principal proven offence4.35 In order to examine how sentencing practices are changing, it is important to investigate
whether the trends observed above are occurring uniformly across all sentences or whether they only apply to the sentencing of particular offence types.
4.36 This section analyses trends in sentencing by principal proven offence. The principal proven offence is the charge for each offender that attracted the most serious sentence in that offender’s case. Many offences are not represented by principal proven offence data, however, because prisoners are often serving sentences for multiple offences concurrently, and less serious offending is masked by more serious offences.
4.37 Sentencing data is presented by principal proven offence to examine whether the increase in the number of custodial sentences (particularly in the Magistrates’ Court), the decrease in the custody rate (particularly in the higher courts), and the decrease in average sentence lengths in recent years have been influenced by sentencing practices for particular offence types. The influence of the introduction of imprisonment combined with a community correction order is also analysed from 2012–13 onwards.
4.38 In this chapter, data on principal proven offences has been separated into the offence categories set out in Table 1 using Australian and New Zealand Standard Offence Classification codes. Appendix A contains an explanation of how the data used in this chapter concords with the Crime Statistics Agency data used in Chapter 3.
4.39 This section analyses trends across all courts by principal proven offence category. Data is then examined for the Magistrates’ Court and the higher courts separately. Due to the increase in the number of custodial sentences imposed in the Magistrates’ Court (see Figure 9), principal proven offence data is broken down by the number of custodial sentences and average (mean) sentence length in the Magistrates’ Court. Conversely, the number of custodial sentences was relatively stable in the higher courts and so the principal proven offence data focuses on the fluctuating custody rate in the higher courts (see Figure 10).
Principal proven offences across all courts4.40 Using principal proven offence data, this section examines the number of custodial sentences,
the proportion of custodial sentences represented by new sentencing orders, and the proportion of custodial sentences by court level between 2004–05 and 2014–15.
Number of custodial sentences by principal proven offence 4.41 Figure 14 (page 29) shows that, across all courts, custodial sentences were most commonly
imposed in cases in which the principal proven offence was an offence against the person or a property offence. Custodial sentences in cases with a property offence as the principal proven offence decreased over the period while custodial sentences in cases with an offence against the person as the principal proven offence increased.
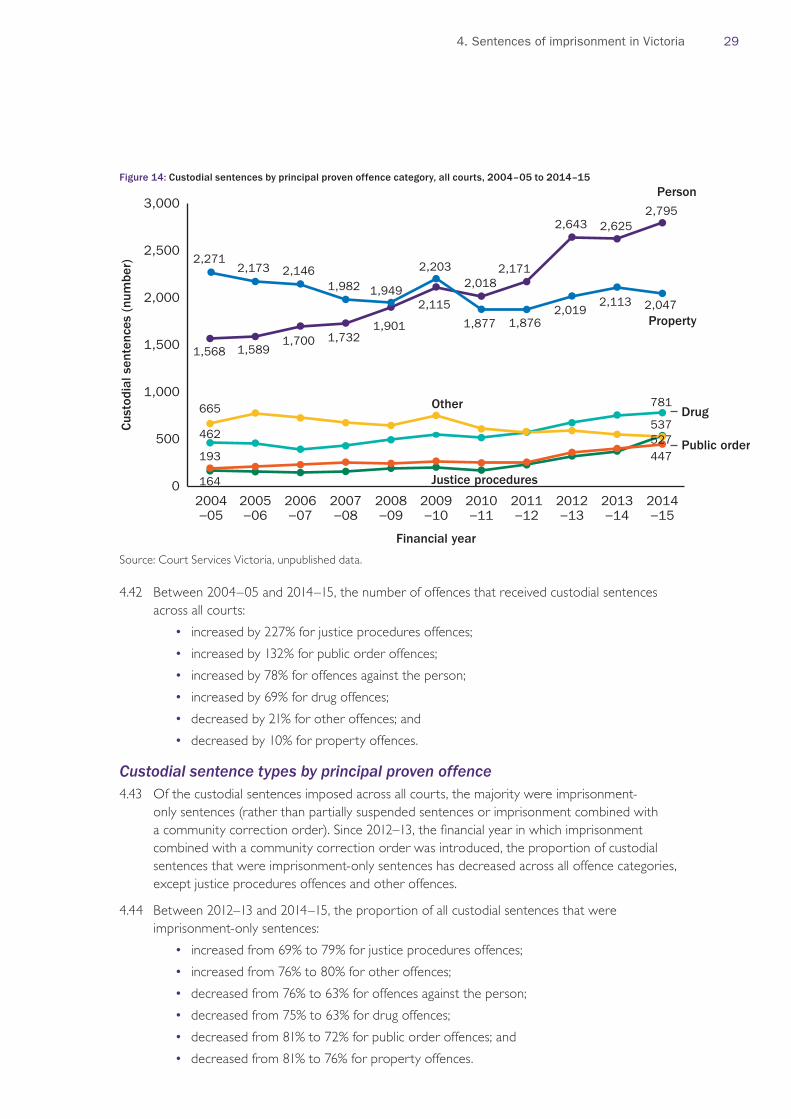
4. Sentences of imprisonment in Victoria 29
Figure 14: Custodial sentences by principal proven offence category, all courts, 2004–05 to 2014–15
1,568 1,5891,700 1,732
1,901
2,115
2,0182,171
2,643 2,6252,795
2,2712,173 2,146
1,982 1,949
2,203
1,877 1,8762,019
2,113 2,047
462
781
164
537665
527193 447
0
500
1,000
1,500
2,000
2,500
3,000
Cus
todi
al s
ente
nces
(nu
mbe
r)
Financial year
Person
Property
Drug
Justice procedures
Other
Public order
2004−05
2005−06
2006−07
2007−08
2008−09
2009−10
2010−11
2011−12
2012−13
2013−14
2014−15
Source: Court Services Victoria, unpublished data.
4.42 Between 2004–05 and 2014–15, the number of offences that received custodial sentences across all courts:
• increased by 227% for justice procedures offences;
• increased by 132% for public order offences;
• increased by 78% for offences against the person;
• increased by 69% for drug offences;
• decreased by 21% for other offences; and
• decreased by 10% for property offences.
Custodial sentence types by principal proven offence4.43 Of the custodial sentences imposed across all courts, the majority were imprisonment-
only sentences (rather than partially suspended sentences or imprisonment combined with a community correction order). Since 2012–13, the financial year in which imprisonment combined with a community correction order was introduced, the proportion of custodial sentences that were imprisonment-only sentences has decreased across all offence categories, except justice procedures offences and other offences.
4.44 Between 2012–13 and 2014–15, the proportion of all custodial sentences that were imprisonment-only sentences:
• increased from 69% to 79% for justice procedures offences;
• increased from 76% to 80% for other offences;
• decreased from 76% to 63% for offences against the person;
• decreased from 75% to 63% for drug offences;
• decreased from 81% to 72% for public order offences; and
• decreased from 81% to 76% for property offences.

30 Victoria’s Prison Population 2005 to 2016
4.45 In 2014–15, the largest proportion of custodial sentences represented by imprisonment combined with a community correction order was in the categories of offences against the person (31%) and drug offences (30%).
4.46 Within offences against the person, more than one-third (34%) of offenders who received a custodial sentence for a principal proven offence in the cause injury subcategory received a term of imprisonment combined with a community correction order. Conversely, 60% of custodial sentences for offences in the cause injury subcategory were imprisonment-only sentences.
Custodial sentences by principal proven offence and court level4.47 The proportion of custodial sentences (as presented in Figure 14) that were imposed in the
Magistrates’ Court, rather than in the higher courts, increased in all offence categories over the period.
4.48 For all custodial sentences imposed between 2004–05 and 2014–15, the proportion that were imposed in the Magistrates’ Court:
• increased from 64% to 76% for offences against the person;
• increased from 86% to 98% for public order offences;
• increased from 94% to 99% for other offences;
• increased from 67% to 71% for drug offences;
• increased from 89% to 91% for property offences; and
• increased from 91% to 93% for justice procedures offences.
Principal proven offences in the Magistrates’ Court4.49 This section examines the custodial sentences imposed in the Magistrates’ Court by principal
proven offence categories (see Table 1). Data is separated by the number of custodial sentences, custodial sentence types, and mean sentence lengths.
Number of custodial sentences in the Magistrates’ Court by principal proven offence4.50 Figure 15 (page 31) presents the number of custodial offences by the principal proven offence
categories of person, property, and drug. It shows that the most common principal proven offence categories for which offenders received a custodial sentence in the Magistrates’ Court in 2014–15 were offences against the person and property offences. Figure 16 (page 31) presents the remaining principal proven offence categories of justice procedures, public order, and other.
4.51 Between 2004–05 and 2014–15, the number of custodial sentences imposed in the Magistrates’ Court:
• increased by 236% for justice procedures offences;
• increased by 163% for public order offences;
• increased by 111% for offences against the person;
• increased by 79% for drug offences;
• decreased by 17% for other offences; and
• decreased by 8% for property offences.
4.52 The combination of the increase in offences against the person and the decrease in property offences meant that offences against the person became the most common offence category from 2012–13 onwards (Figure 15). Between 2004–05 and 2014–15, the number of custodial sentences
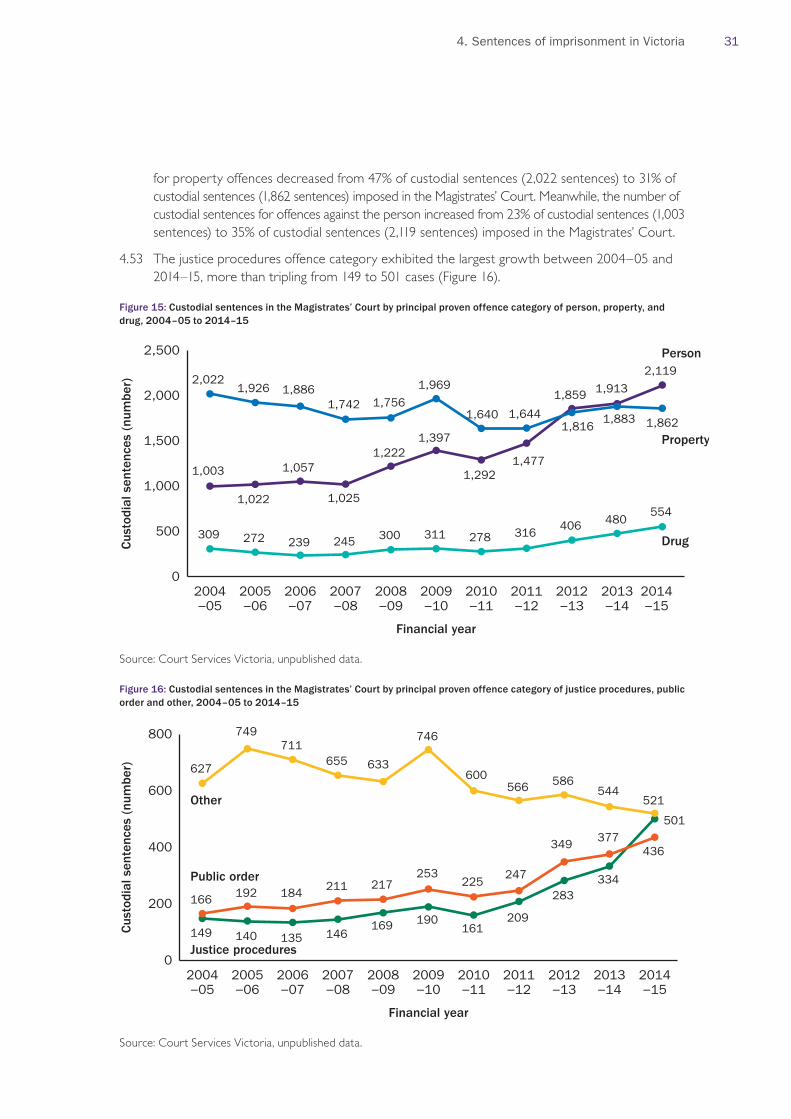
4. Sentences of imprisonment in Victoria 31
for property offences decreased from 47% of custodial sentences (2,022 sentences) to 31% of custodial sentences (1,862 sentences) imposed in the Magistrates’ Court. Meanwhile, the number of custodial sentences for offences against the person increased from 23% of custodial sentences (1,003 sentences) to 35% of custodial sentences (2,119 sentences) imposed in the Magistrates’ Court.
4.53 The justice procedures offence category exhibited the largest growth between 2004–05 and 2014–15, more than tripling from 149 to 501 cases (Figure 16).
Figure 15: Custodial sentences in the Magistrates’ Court by principal proven offence category of person, property, and drug, 2004–05 to 2014–15
1,003
1,022
1,057
1,025
1,2221,397
1,2921,477
1,859 1,913
2,1192,022
1,926 1,8861,742 1,756
1,969
1,640 1,6441,816
1,883 1,862
309 272 239 245 300 311 278 316406 480
554
0
500
1,000
1,500
2,000
2,500
Cus
todi
al s
ente
nces
(nu
mbe
r)
Financial year
Person
Property
Drug
2004−05
2005−06
2006−07
2007−08
2008−09
2009−10
2010−11
2011−12
2012−13
2013−14
2014−15
Source: Court Services Victoria, unpublished data.
Figure 16: Custodial sentences in the Magistrates’ Court by principal proven offence category of justice procedures, public order and other, 2004–05 to 2014–15
149 140 135 146169 190
161209
283334
501
166 192 184 211 217253
225247
349 377436
627
749711
655 633
746
600566 586
544521
0
200
400
600
800
Cus
todi
al s
ente
nces
(nu
mbe
r)
Financial year
Public order
Justice procedures
Other
2004−05
2005−06
2006−07
2007−08
2008−09
2009−10
2010−11
2011−12
2012−13
2013−14
2014−15
Source: Court Services Victoria, unpublished data.

32 Victoria’s Prison Population 2005 to 2016
4.54 The number of cases with justice procedures offences as the principal proven offence grew rapidly from 2010–11 (up 211% between 2010–11 and 2014–15). Public order offences similarly experienced substantial growth from 2010–11 onwards (up 94%).
4.55 In order to examine the growth in the number of custodial sentences imposed for offences against the person, Figure 17 presents the Magistrates’ Court data by the subcategories of cause injury, sexual assault, robbery, abduction, and dangerous acts. Cause injury offences are presented on a secondary Y axis due to large numbers of custodial sentences in this subcategory.
4.56 Between 2004–05 and 2014–15, the number of custodial sentences increased for all subcategories. Over this period, the number of custodial sentences in the Magistrates’ Court:
• increased by 248% for abduction offences;
• increased by 127% for sexual assault offences;
• increased by 121% for cause injury offences;
• increased by 49% for dangerous act offences; and
• increased by 7% for robbery offences.
4.57 In 2014–15, custodial sentences for offences against the person were primarily imposed for cause injury offences (1,478 or 70%), followed by dangerous act offences (248 or 12%) and abduction offences (219 or 10%). These proportions are similar to the proportions in 2004–05.
4.58 The fluctuations in the number of custodial sentences for the cause injury offence subcategory from 2004–05 to 2014–15 mirror the pattern of increase in the offences against the person category. Custodial sentences with a principal proven offence in the subcategory of cause injury represented 67% of all custodial sentences imposed for offences against the person over the decade observed, and 20% of all custodial sentences imposed by the Magistrates’ Court.
Figure 17: Custodial sentences in the Magistrates’ Court by principal proven offence subcategories for offences against the person, 2004–05 to 2014–15
166 165 165203 221 212 203
237268 263
248
63
219
51
11654
58
669
654717
655
792
955
856
983
1,2451,296
1,478
0
600
900
1,200
1,500
0
150
300
225
75
Custodial sentences for cause injury offences (num
ber)
Cus
todi
al s
ente
nces
(nu
mbe
r)
Financial Year
Dangerous acts
Abduction Sexual assault
Robbery
Cause injury
2004−05
2005−06
2006−07
2007−08
2008−09
2009−10
2010−11
2011−12
2012−13
2013−14
2014−15
Source: Court Services Victoria, unpublished data.

4. Sentences of imprisonment in Victoria 33
Custodial sentence types in the Magistrates’ Court by principal proven offence4.59 Between 2012–13 and 2014–15, the proportion of custodial sentences imposed in the
Magistrates’ Court by custodial sentence type:
• increased from 10% to 26% for imprisonment combined with a community correction order;
• decreased from 76% to 69% for imprisonment-only sentences; and
• decreased from 15% to 5% for partially suspended sentences.
4.60 The decrease in the proportion of custodial sentences represented by imprisonment-only sentences did not occur uniformly across offence types. In particular, the use of imprisonment-only sentences increased for the justice procedures category; imprisonment combined with a community correction order only replaced some of the partially suspended sentences in this category.
4.61 By principal proven offence category, the proportion of custodial sentences represented by imprisonment-only sentences between 2012–13 and 2014–15:
• decreased from 70% to 55% of custodial sentences for drug offences;
• decreased from 71% to 60% of custodial sentences for offences against the person;
• decreased from 80% to 72% of custodial sentences for public order offences;
• decreased from 81% to 76% of custodial sentences for property offences;
• increased from 73% to 78% of custodial sentences for justice procedures offences; and
• increased from 77% to 80% of custodial sentences for other offences.
4.62 Likewise, between 2012–13 and 2014–15, the proportion of custodial sentences imposed in the Magistrates’ Court represented by sentences of imprisonment combined with a community correction order:
• increased from 13% to 38% of custodial sentences for drug offences;
• increased from 13% to 34% of custodial sentences for offences against the person;
• increased from 7% to 22% of custodial sentences for public order offences;
• increased from 8% to 20% of custodial sentences for property offences;
• increased from 8% to 18% of custodial sentences for justice procedures offences; and
• increased from 6% to 12% of custodial sentences for other offences.
Average sentence length of custodial sentences in the Magistrates’ Court by principal proven offence4.63 Figure 18 (page 34) details the average (mean) length of custodial sentences by principal
proven offence category for offenders sentenced in the Magistrates’ Court. The data is presented in order to determine whether the increase in custodial sentences in the Magistrates’ Court is being counteracted by a reduction in sentence lengths. The data is only available from 2006–07 in the Magistrates’ Court.
4.64 Average imprisonment length was longest for drug offences and shortest for justice procedures and other offences. Average imprisonment length by offence category was highly variable from 2006–07 to 2014–15, particularly for drug offences, which saw a spike in the mean sentence length in 2010–11.
4.65 Justice procedures and public order offences showed the greatest increase in average imprisonment length between 2006–07 and 2014–15, while the average imprisonment length for property offences showed the greatest decrease over the period.

34 Victoria’s Prison Population 2005 to 2016
Figure 18: Average (mean) imprisonment length of custodial sentences in the Magistrates’ Court by principal proven offence category, 2006–07 to 2014–15
6.46.9
7.1
6.4
8.6
7.3 7.4
6.5 6.5
6.2
7.0
6.9
7.17.5
7.0 7.0
6.35.8
4.2
5.34.9 4.8
4.54.8
5.2
4.7
5.3
1.9
2.62.0
2.72.2 2.4
2.0
2.4 2.42.7 2.8
2.53.0
2.7 2.72.4
2.3 2.2
6.0 6.2 6.2 6.46.1 6.0 6.1
5.55.1
0
1
2
3
4
5
6
7
8
9
Impr
ison
men
t le
ngth
(m
onth
s)
Financial year
Drug
Person
Public order
Justice procedures
Other
Property
2006–07
2007–08
2008–09
2009–10
2010–11
2011–12
2012–13
2013–14
2014–15
Source: Court Services Victoria, unpublished data.
4.66 Over the same period that the number of custodial sentences experienced steady growth in the Magistrates’ Court (between 2010–11 and 2014–15), the average imprisonment length:
• increased by 18% for public order offences;
• increased by 8% for justice procedures offences;
• decreased by 25% for drug offences;
• decreased by 22% for offences against the person;
• decreased by 20% for other offences; and
• decreased by 17% for property offences.
4.67 Overall, sentencing data in the Magistrates’ Court demonstrates that, while the number of custodial sentences has steadily increased, particularly since 2010–11, the average custodial sentence length has decreased for most serious offending. For justice procedures and public order offences, both the number of custodial sentences and the average imprisonment sentence length have increased substantially. These offences started from low numbers in 2006–07, however.
4.68 Nonetheless, the majority of growth in the prison population sentenced in the Magistrates’ Court is primarily due to growth in the number of custodial sentences imposed in cases in which the principal proven offence was an offence against the person. Since 2010–11, sentences for offences against the person have been shorter on average; however, they continue to be the second longest average sentence length by offence category.
4.69 This paradox may be due to the increased use of imprisonment combined with community correction orders for cause injury offences. Average custodial sentence lengths only measure the custodial portion of a sentencing order, and so conclusions cannot be made on the punitiveness of these sentences given that lengthy community correction orders can also be significantly punitive, particularly when combined with imprisonment.44
44. Boulton v The Queen (2014) 46 VR 308, 340 [141].

4. Sentences of imprisonment in Victoria 35
Principal proven offences in the higher courts4.70 This section presents the number of custodial sentences imposed in the higher courts by
principal proven offence category. This section examines whether there are similar trends to those observed in the Magistrates’ Court, despite the overall number of custodial sentences imposed in the higher courts remaining relatively stable. Due to the increase in the custody rate observed for the higher courts in Figure 10, this section also presents data on the rate of custodial sentences by principal proven offence category in the higher courts.
Number of custodial sentences in the higher courts by principal proven offence4.71 Figure 19 demonstrates that between 2004–05 and 2014–15, the number of custodial sentences:
• increased by 20% for offences against the person;
• increased by 48% for drug offences; and
• decreased by 26% for property offences.
4.72 The number of custodial sentences in the remaining offence categories fluctuated due to low numbers, and so these have not been included in the figures in this section (for more information see Appendix B).
4.73 Within the category of offences against the person, the number of custodial sentences in the higher courts between 2004–05 and 2014–15 by subcategory:
• increased by 48% for sexual assault offences (from 152 sentences to 225);
• increased by 36% for abduction offences (from 25 sentences to 34);
• increased by 32% for dangerous act offences (from 22 sentences to 29);
• increased by 19% for cause injury offences (from 130 sentences to 155);
• increased by 16% for robbery offences (from 159 sentences to 185); and
• decreased by 38% for homicide offences (from 77 sentences to 48).
Figure 19: Custodial sentences in the higher courts by principal proven offence category of person, property, and drug, 2004–05 to 2014–15
153187
154184 193
236 238 253 268 276227
565 567
643707 679
718 726 694
784712
676
249 247 260 240193
234 237 232203 230
185
0
300
600
900
Cus
todi
al s
ente
nces
(nu
mbe
r)
Financial year
Person
Property
Drug
2004−05
2005−06
2006−07
2007−08
2008−09
2009−10
2010−11
2011−12
2012−13
2013−14
2014−15
Source: Court Services Victoria, unpublished data.

36 Victoria’s Prison Population 2005 to 2016
Custody rates and custodial sentence types in the higher courts by principal proven offence4.74 Figure 20 details the proportion, by principal proven offence, of offenders sentenced in the
higher courts that received a custodial sentence between 2004–05 and 2014–15. The custody rate for drug offences was the highest, with between 58% and 81% of offenders in the higher courts receiving a sentence of imprisonment for drug offences over the period.
4.75 Between 2004–05 and 2014–15, the proportion of offenders receiving a custodial sentence in the higher courts:
• increased by 39% for property offences;
• increased by 26% for drug offences; and
• increased by 17% for offences against the person.
4.76 While the custody rate in the higher courts trended upwards for these offence categories, there were slight decreases in the custody rate for offences against the person and drug offences from 2012–13 onwards.
4.77 As discussed at [4.72], a low number of custodial sentences were imposed in the higher courts for a principal proven offence in the justice procedures, public order, and other categories. As such, their custody rates were highly variable between 2004–05 and 2014–15 and have not been included here. For further information, see the higher courts data included in Appendix B.
Figure 20: Custody rate by principal proven offence category in the higher courts, 2004–05 to 2014–15
53.7
59.258.5 59.4
67.9 65.9
62.5
66.8
63.7
62.8
44.9 45.449.7
52.1 53.5
60.656.8
61.265.5
66.7
62.5
62.7
57.7
67.061.3
67.5
67.8 68.0
71.5
81.5 81.278.8
0
30
60
90
80
70
50
40
Cus
todi
al s
ente
nces
(pr
opor
tion
%)
Financial year
Drug
Person
Property
2004−05
2005−06
2006−07
2007−08
2008−09
2009−10
2010−11
2011−12
2012−13
2013−14
2014−15
57.2
Source: Court Services Victoria, unpublished data.

4. Sentences of imprisonment in Victoria 37
4.78 Since 2012–13, which followed the introduction of imprisonment combined with a community correction order, there has been a change in the composition of custodial sentences and what the custody rate represents.
4.79 For offences against the person, 703 of the 784 custodial sentences imposed in the higher courts in 2012–13 (90%) were imprisonment-only sentences. In 2014–15, only 494 of the 676 custodial sentences imposed in the higher courts for offences against the person (73%) were imprisonment-only sentences, with 23% of custodial sentences involving imprisonment combined with a community correction order.
4.80 A similar trend occurred in the composition of custodial sentences with a principal proven offence in the property category. The proportion of custodial sentences imposed in the higher courts for property offences that were imprisonment-only sentences decreased from 86% in 2012–13 to 75% in 2014–15.
4.81 The introduction of imprisonment combined with a community correction order did not influence sentences for drug offences in the same way. Sentences of imprisonment represented the same proportion of custodial sentences imposed in the higher courts for drug offences in 2012–13 and 2014–15 (81%). Instead, imprisonment combined with a community correction order appeared to replace partially suspended sentences.
Average sentence length of custodial sentences in the higher courts by principal proven offence4.82 Average (mean) custodial sentence lengths remained relatively stable in the higher courts
between 2004–05 and 2014–15 (Figure 13). However, the data presented in Appendix B demonstrates that on an offence category level, the average length of custodial sentences:
• increased by 64% for drug offences (from 2.4 years to 3.9 years);
• increased by 29% for property offences (from 2.2 years to 2.9 years);
• decreased by 50% for justice procedures offences (from 2.4 years to 1.2 years);
• decreased by 10% for offences against the person (from 4.7 years to 4.2 years); and
• decreased by 7% for public order offences (from 2.1 years to 1.9 years).
4.83 The sentencing data for the higher courts indicates that there have been increases in both the custody rate and the number of custodial sentences for offences against the person and drug offences. Further, for drug offences, average custodial sentence lengths have also increased. This signifies that either more serious offending is appearing before the higher courts within these offence categories or sentencing practices are changing in these matters.
4.84 The number of custodial sentences imposed has decreased in cases with a principal proven offence in the property category. Nonetheless, a custodial sentence was imposed in a higher proportion of property cases in 2014–15 than in 2004–05. Those custodial sentences were also more likely to be longer in 2014–15 than they were in 2004–05.
4.85 The number of custodial sentences imposed in the higher courts remained low for cases with a justice procedures offence as the principal proven offence. Despite this, the number of custodial sentences for justice procedures offences more than doubled between 2004–05 and 2014–15 (from 15 offenders to 36 offenders). Of those 36 offenders, 31 (86%) received an imprisonment-only sentence. Similarly, the proportion of all offenders guilty of justice procedures offences sentenced to a custodial sentence in the higher courts increased from 27% to 54%. The average imprisonment sentence length for justice procedures offences halved over the period, however, which indicates that shorter sentences are being used more frequently for this type of offending.
38 Victoria’s Prison Population 2005 to 2016
Sentencing observations4.86 A number of competing trends can be observed in the sentencing data that influenced
the rapid increase in the sentenced prisoner population between 2012 and 2014 and the subsequent decrease since 2014 (Figure 3). The data demonstrates that increasing prisoner numbers can only marginally be attributed to increasing custody rates, while the majority of growth can be attributed to an increase in the number of people entering the criminal justice system.
4.87 Although the number of custodial sentences imposed in the higher courts fell between 2012–13 and 2014–15, this was more than made up for by substantial growth in the number of custodial sentences imposed in the Magistrates’ Court over the same period (Figure 9). Similarly, while the custody rate decreased in the higher courts in these years, the custody rate in the Magistrates’ Court increased (Figure 10). Nonetheless, the increase in the proportion of the custody rate represented by imprisonment combined with a community correction order in both the Magistrates’ Court and the higher courts indicates that this may be influencing growth in the use of shorter sentences (Figures 11 and 12).
4.88 The data suggests that, in recent years, the influx of offenders may have been counteracted by the imposition of shorter custodial sentences (Figure 13). It is therefore important to note that the decrease in the sentenced prisoner population observed in Figure 3 does not equate to fewer persons receiving custodial sentences throughout the year.
4.89 An increase in the number of offences against the person across all court levels suggests that there is a greater volume of relatively serious offending that, generally speaking, is more likely to receive a sentence of imprisonment than other types of offending. However, it is difficult to measure offence seriousness given the breadth of offending behaviour encompassed within the subcategory of cause injury offences that have experienced substantial growth.
4.90 In the Magistrates’ Court, the use of shorter sentences can be seen in the growth in the number of justice procedures offences receiving custodial sentences; shorter average imprisonment sentence lengths can also be seen for high-volume offences like property offences. Increases in the proportion of custodial sentences represented by imprisonment combined with community correction orders suggest that the use of shorter sentences is also increasing, particularly for offences against the person (in all courts) and drug offences (in the Magistrates’ Court).
4.91 Nonetheless, increases in the number of custodial sentences for sexual assaults and drug offences, particularly in the higher courts, point towards more serious offending appearing before the courts. The increase in the number of offenders with a drug offence as their principal proven offence is likely to also have an effect on the remand population given the presumption against bail for persons charged with certain drug offences.45
4.92 Between 2004–05 and 2014–15, there was an increase in the likelihood of a person spending time on remand prior to receiving a custodial sentence in the higher courts. Over the same period, prisoners spent more time on average on remand. In 2014–15, 81% of offenders who received a custodial sentence in the higher courts had spent time on remand prior to sentencing, and the average amount of time spent on remand reckoned by the court was 214 days (approximately 7 months).
45. These offences include trafficking in a drug of dependence and cultivating a narcotic plant (large commercial quantity and commercial quantity), conspiring to commit any of these offences (and previous forms of these offences), and Commonwealth drug importation offences. See Bail Act 1977 (Vic) s 4(2).

5. Prisoners in Victoria 39
5. Prisoners in Victoria5.1 This section presents data on the Victorian prison population in order to analyse how
offending behaviour and sentencing practices measured in previous chapters are influencing the growth in the number of prisoners. Data is presented for both sentenced and unsentenced prisoners in regard to:
• the number of prisoners received into custody;
• the most serious offence/charge for which prisoners are in custody; and
• the length of time prisoners spend in custody.
5.2 The majority of the data in this chapter, with the exception of data on prisoner receptions, is measured as part of the prisoner census and therefore represents changes in the prison population as measured on 30 June each year, from 2005 to 2015.
Prisoner receptions5.3 The prison population varies continuously over time, as prisoners enter or leave each day. As
a result, a measure of the population on 30 June each year (as presented in Figure 3) does not capture the total number of prisoners entering prison throughout the year – for example, prisoners who entered and left the prison population prior to 30 June. Instead, prisoner receptions are measured to examine the flow of prisoners (both unsentenced and sentenced) into prison throughout the year.
5.4 Figure 21 (page 40) details the number of people received into prison throughout the financial year. In addition, Figure 21 shows the number of prisoners who became sentenced prisoners each financial year and the number of prisoners who were received into prison but did not become sentenced prisoners in the same financial year. The sentenced and unsentenced prisoners do not sum to the total receptions because some prisoners are counted as a reception in a different financial year to the one in which they become sentenced prisoners.
5.5 Prisoners become sentenced prisoners either when they are received as a sentenced prisoner from the community or when they change status from an unsentenced prisoner (on remand) to a sentenced prisoner. An additional sentence imposed on a prisoner already in the sentenced population does not count as another reception.
5.6 Prisoners who do not become sentenced prisoners are received on remand but never enter the sentenced prisoner population. This includes unconvicted prisoners held on remand, convicted prisoners awaiting sentencing, convicted prisoners who receive a non-custodial sentence, or prisoners who are acquitted. A convicted prisoner sentenced to a custodial sentence equal to the time already served on remand also does not enter the sentenced prisoner population.
5.7 The total number of prisoners received into custody increased by 89%, from 4,840 prisoners in 2004–05 to 9,155 prisoners in 2014–15. On an annual basis, the largest growth occurred in the 2014–15 financial year when 1,868 more prisoners than the previous financial year were received into Victorian prisons (an increase of 26%). On average, total prisoner receptions increased by 7% every year.

40 Victoria’s Prison Population 2005 to 2016
Figure 21: Prisoner receptions, 2004–05 to 2014–15
4,840 4,8625,364 5,396
5,626 5,877 5,7716,293
7,116
7,287
9,155
3,632
3,723
3,857
3,830
3,941
4,317
4,130 4,270
4,946 5,103
5,197
1,521
1,497
1,881
1,983
2,141
2,045
2,1262,518
2,742
2,777
4,592
0
2,000
4,000
6,000
8,000
10,000
Priso
ner
rece
ptio
ns (
num
ber)
Financial year
All prisoner receptions
Prisoners becoming sentencedprisoners
Prisoners not becoming sentenced prisoners
2004−05
2005−06
2006−07
2007−08
2008−09
2009−10
2010−11
2011−12
2012−13
2013−14
2014−15
Sources: Department of Justice and Regulation, Victoria, Key Statistics on the Victorian Prison System: 2009–10 to 2013–14 (2015) Table 14; Department of Justice, Victoria, Statistical Profile of the Victorian Prison System: 2004–05 to 2008–09 (2010) Table 32. Data on sentenced prisoner receptions and data for the 2014–15 financial year were sourced directly from Corrections Victoria.
5.8 The number of prisoners who became sentenced prisoners increased by 43% between 2004–05 and 2014–15. The largest increase in prisoners becoming sentenced prisoners occurred in 2012–13 (up 16%), with growth slowing in the subsequent two financial years.
5.9 The number of prisoners who were received into prison and not sentenced in the same financial year increased by 202%, from 1,521 prisoners to 4,592. The largest percentage increase in the number of prisoners received into custody who did not go on to be sentenced in the same financial year occurred in 2014–15 (up 65%). Across the decade from 2004–05 to 2014–15, the average annual increase in prisoners who did not become sentenced prisoners was 13%, while the average annual increase for prisoners who did become sentenced prisoners was 4%.
5.10 Due to these varied growth rates, the proportion of prisoners who did not become sentenced prisoners increased from 31% of all prisoner receptions in 2004–05 to 50% in 2014–15.
5. Prisoners in Victoria 41
Offences and imprisonment5.11 As noted in Chapter 4, the size of the prison population is influenced by the type of offending
sentenced, as offence type influences the number of offenders who receive a custodial sentence. That chapter examined sentencing data on the type of offending for which custodial sentences are imposed, by principal proven offence. An examination of offence types can also be made using data on the most serious offence for which prisoners are currently serving a sentence of imprisonment. This allows for an examination of the cumulative effect of sentences over time and establishes whether any changes in the prison population are visible in the proportion of prisoners serving longer sentences for more serious crimes, compared with the number of prisoners serving shorter sentences for less serious crimes.
5.12 Similarly, an analysis of the most serious charge for prisoners on remand enables an evaluation of whether the increasing remand population is due to changes in offending behaviour and the types of offences for which people are being remanded. This is particularly helpful given that sentencing data is not available as a comparison for these unsentenced prisoners.
5.13 In line with the principal proven offence data in the previous chapter, prisoners are often in custody in relation to multiple offences, and therefore an analysis of prisoners’ most serious offence or charge may mask less serious offending that may have contributed to their imprisonment.
Most serious offence by sentenced prisoners5.14 Figures 22 and 23 present the number of sentenced prisoners on 30 June each year from
2005 to 2015, categorised by their most serious offence. Figure 22 (page 42) presents the number of sentenced prisoners categorised by the most serious offence categories of person, property, drug, public order, and justice procedures. Given the large proportion of sentenced prisoners with offences against the person as their most serious offence (50% in 2015), Figure 23 (page 42) presents a breakdown of this offence category according to the four largest subcategories: homicide, cause injury, sexual assault, and robbery.
5.15 In line with the data presented in Chapter 4, Figure 22 demonstrates that the number of prisoners sentenced to an offence against the person as their most serious offence has increased substantially since 2005. Unlike the data presented in the previous chapter, however, the number of prisoners sentenced for property offences has not decreased.
5.16 Overall, the number of sentenced prisoners increased for all offence categories between 30 June 2005 and 30 June 2015. Specifically, the number of prisoners by most serious offence category:
• increased by 108% for justice procedures offences;
• increased by 102% for public order offences;
• increased by 75% for offences against the person;
• increased by 58% for drug offences; and
• increased by 17% for property offences.
5.17 Notably, between 2014 and 2015, the number of sentenced prisoners decreased substantially for property and justice procedures offences.

42 Victoria’s Prison Population 2005 to 2016
Figure 22: Sentenced prisoners by most serious offence category, 30 June, 2005 to 2015
1,372 1,4171,552
1,7191,818
1,8871,957 1,980
2,100
2,359 2,405
820 824891
745 747857 856 821
8891,010 958
330
407 386 402
400
425 435 502 781885 688
343
331 349 375
411
405 431 402 458 525 542
43 43 38 49 52 35 46 68 49 89 87
500
0
1,000
1,500
2,000
2,500
2005 2006 2007 2008 2009 2010 2011 2012 2013 2014 2015
Sen
tenc
ed p
riso
ners
(nu
mbe
r)
Year (30 June)
Person
Property
Justiceprocedures
Drug
Public order
Source: Australian Bureau of Statistics, Prisoners in Australia, cat. no. 4517.0 (2005–2015).
5.18 Figure 23 shows that, within offences against the person, sexual assault is the most common subcategory for which sentenced prisoners are in custody, and this offence has experienced substantial growth over the past decade (up 77%). This is in contrast to the sentencing data presented in the previous chapter, which saw cause injury offences as the most common subcategory of offences against the person for which offenders received a custodial sentence. This indicates that offenders are serving longer sentences for sexual assault offences than cause injury offences.
Figure 23: Sentenced prisoners for offences against the person by most common offence subcategory, 30 June, 2005 to 2015
210252
281381
410434
464 474511
626672
382
386422 428 440 442
464 468 477
466442
405436
503
572
625644 662 656 653
700 716
308
288
267 267 273 289 289 307354
434 434
0
100
200
300
400
500
600
700
800
2005 2006 2007 2008 2009 2010 2011 2012 2013 2014 2015
Sen
tenc
ed p
riso
ners
(nu
mbe
r)
Year (30 June)
Cause injury
Homicide
Sexual assault
Robbery
Source: Australian Bureau of Statistics, Prisoners in Australia, cat. no. 4517.0 (2005–2015).
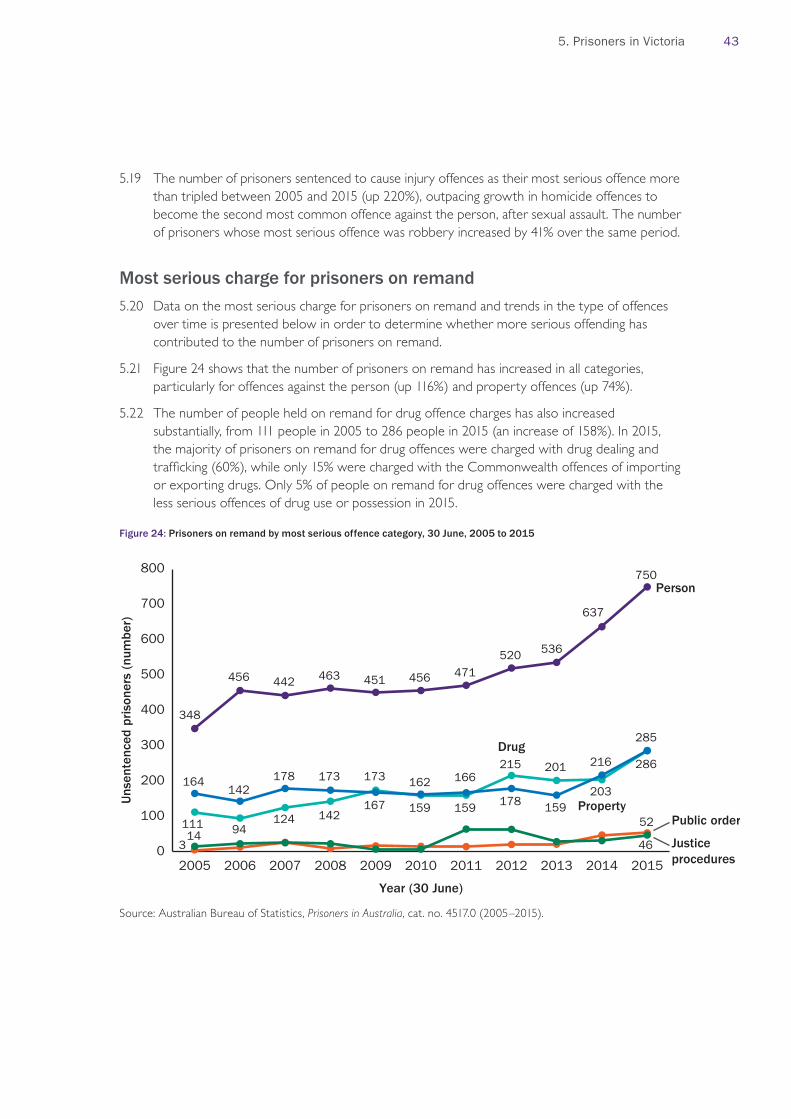
5. Prisoners in Victoria 43
5.19 The number of prisoners sentenced to cause injury offences as their most serious offence more than tripled between 2005 and 2015 (up 220%), outpacing growth in homicide offences to become the second most common offence against the person, after sexual assault. The number of prisoners whose most serious offence was robbery increased by 41% over the same period.
Most serious charge for prisoners on remand5.20 Data on the most serious charge for prisoners on remand and trends in the type of offences
over time is presented below in order to determine whether more serious offending has contributed to the number of prisoners on remand.
5.21 Figure 24 shows that the number of prisoners on remand has increased in all categories, particularly for offences against the person (up 116%) and property offences (up 74%).
5.22 The number of people held on remand for drug offence charges has also increased substantially, from 111 people in 2005 to 286 people in 2015 (an increase of 158%). In 2015, the majority of prisoners on remand for drug offences were charged with drug dealing and trafficking (60%), while only 15% were charged with the Commonwealth offences of importing or exporting drugs. Only 5% of people on remand for drug offences were charged with the less serious offences of drug use or possession in 2015.
Figure 24: Prisoners on remand by most serious offence category, 30 June, 2005 to 2015
348
456 442 463 451 456 471520 536
637
750
111 94124 142
173
159 159
215 201
203
286
164142
178 173
167
162 166
178 159
216
285
3
5214
46
100
0
200
300
400
500
600
700
800
2005 2006 2007 2008 2009 2010 2011 2012 2013 2014 2015
Uns
ente
nced
priso
ners
(nu
mbe
r)
Year (30 June)
Person
Drug
PropertyPublic order
Justiceprocedures
Source: Australian Bureau of Statistics, Prisoners in Australia, cat. no. 4517.0 (2005–2015).

44 Victoria’s Prison Population 2005 to 2016
5.23 Unsentenced prisoners with justice procedures offences as their most serious charge increased from 14 prisoners in 2005 to 46 prisoners in 2015 (an increase of 229%). In 2015, the majority (50%) of those 46 prisoners were charged with breach of a community order,46 and 41% were charged with breach of a violence and non-violence order.47 Nonetheless, prisoners on remand for justice procedures offences represented only 3% of the remand population in 2015.
5.24 Figures 25 and 26 present the number of prisoners on remand for offences against the person, separated by subcategory. Figure 25 shows that in 2015, 382 prisoners were on remand for cause injury offences, an increase of 649% from 51 prisoners in 2005. In 2015, 355 (93%) of those 382 prisoners were on remand for assault and related offences (including common assault and causing injury).48
5.25 Increases in the number of prisoners on remand are also observed for sexual assault offences (up by 123% between 2005 and 2015). The number of prisoners on remand for homicide offences decreased from 110 in 2005 to 94 in 2015 (a reduction of 15%).
5.26 Figure 26 (page 45) shows that the number of people on remand for robbery offences was highly variable between 2005 and 2015, but there was an overall decrease of 15%. Abduction and dangerous act offences increased over the period. The number of dangerous act offences spiked in 2015, more than doubling since 2014.
Figure 25: Prisoners on remand for offences against the person by subcategories of cause injury, homicide, and sexual assault, 30 June, 2005 to 2015
51
135 139159
195 209230
254
253
347
382
110
121 111
103 92 8971 73
82 7794
4074 66 68 70 78 67 69 81 74
89
0
100
200
300
400
2005 2006 2007 2008 2009 2010 2011 2012 2013 2014 2015
Uns
ente
nced
priso
ners
(nu
mbe
r)
Year (30 June)
Cause injury
Homicide
Sexual assault
Source: Australian Bureau of Statistics, Prisoners in Australia, cat. no. 4517.0 (2005–2015).
46. This category includes breach of community services order, breach of parole, breach of bail, breach of bond, and breach of community-based order.
47. This category includes breach of a family violence intervention order.
48. The category of ‘acts intended to cause injury’ is broad. It can be broken down into ‘assaults’ and ‘other acts intended to cause injury’. Assault covers offences ranging from serious assaults that result in injury (such as intentionally causing serious injury) to less serious common assaults. ‘Other acts intended to cause injury’ includes behaviour such as stalking.

5. Prisoners in Victoria 45
Figure 26: Prisoners on remand for offences against the person by subcategories of dangerous acts, abduction, and robbery, 30 June, 2005 to 2015
114
104 101107
72
53
75
86 8882
97
17 16 19 19 16 19 1923
19
30
62
166 6 7 6 8 9
15 13
27 26
0
20
40
60
80
100
120
2005 2006 2007 2008 2009 2010 2011 2012 2013 2014 2015
Uns
ente
nced
priso
ners
(nu
mbe
r)
Year (30 June)
Robbery
Dangerous acts
Abduction
Source: Australian Bureau of Statistics, Prisoners in Australia, cat. no. 4517.0 (2005–2015).
Length of time spent in custody5.27 In addition to changing offending patterns, the length of time that prisoners spend in
custody affects the size of the prison population due to the cumulative effect of longer prison sentences. Analysis of the time that both sentenced and unsentenced prisoners can expect to serve demonstrates whether the length of time prisoners spend in custody is contributing to the changing prison population (see also the sentencing data presented in the previous chapter).
5.28 This section presents data for sentenced prisoners at 30 June each year from 2005 to 2015, including the number of prisoners sentenced in the preceding 12 months, the aggregate sentence lengths prisoners are serving, and the expected time that prisoners have left to serve. In addition, the length of time prisoners are spending on remand is broken down by mean and imprisonment length category.
Sentence lengths5.29 For sentenced prisoners, three aspects were examined using data at 30 June each year:
prisoners sentenced within the preceding 12 months, aggregate sentence length, and expected time to serve. Aggregate sentence length is the longest period that a prisoner may be detained for in relation to all current offences for which the prisoner has been sentenced. Expected time to serve generally refers to the time between the date of reception and the earliest possible date of release.49
49. Australian Bureau of Statistics (2015), above n 33, Explanatory Notes.

46 Victoria’s Prison Population 2005 to 2016
Prisoners sentenced within the preceding 12 months5.30 A broad measure of the length of sentences imposed on prisoners is the proportion of
sentenced prisoners who were sentenced within the preceding 12 months. Figure 27 demonstrates that the proportion of prisoners sentenced within the preceding 12 months decreased by 19% from 2005 to 2015, declining from 62% of sentenced prisoners in 2005 to 52% of sentenced prisoners in 2015. Nonetheless, prisoners who were sentenced within the preceding 12 months have comprised a majority of all prisoners since 2005, ranging from a low of 58% in 2012 to a high of 62% in 2005 and 2007.
5.31 As this data is based on the prisoner census on 30 June each year, it does not capture prisoners who have entered and left the sentenced prisoner population within the preceding 12 months. Nor does it measure prisoners who serve their entire custodial sentence on remand. Nonetheless, Figure 27 shows an increase in the percentage of prisoners receiving sentences longer than 12 months, particularly since 2013.
Figure 27: Sentenced prisoners by proportion sentenced in the preceding 12 months, 30 June, 2005 to 2015
3,0433,168 3,378 3,414
3,5383,731 3,861
3,886
4,384
4,973 4,788
0
2,000
3,000
4,000
5,000
2005 2006 2007 2008 2009 2010 2011 2012 2013 2014 2015
Sen
tenc
ed p
riso
ners
(nu
mbe
r)
Year (30 June)
All sentenced prisoners
61.7% 61.3% 61.7% 59.0% 59.1%60.4% 59.5% 57.7%
60.1%55.6%
51.8%
Percentage sentenced within preceding 12 months
1,000
Source: Australian Bureau of Statistics, Prisoners in Australia, cat. no. 4517.0 (2015).

5. Prisoners in Victoria 47
Aggregate sentence length and expected time to serve5.32 Figure 28 presents the average (mean) expected time to serve and aggregate sentence
lengths.50 This figure demonstrates that between 2005 and 2015, the average aggregate sentence being served by prisoners has not increased overall. The average expected time to serve increased by 10% over the period.
5.33 Both the average aggregate sentence and the expected time to serve of sentenced prisoners decreased between 2012 and 2014 after a small increase between 2008 and 2012. This mirrors other data in this report indicating that, in recent years, the use of shorter custodial sentences has increased.
5.34 As noted at [5.29], a prisoner’s aggregate sentence length is the maximum period that he or she must serve in custody for current sentences. Additional sentences a prisoner receives while in the sentenced prisoner population extend their aggregate sentence.
5.35 The most common category of aggregate sentence length was two to less than five years, which includes approximately one-quarter of the sentenced prisoner population. Any prisoner with an aggregate sentence length of two or more years (approximately 66% of the sentenced population, on average) very likely has a non-parole period fixed.
5.36 A prisoner’s expected time to serve is the time between reception as a sentenced prisoner and the earliest possible release date. This is the case even though prisoners are now less likely to be released on their earliest eligibility date (see [6.23]). For sentenced prisoners with a non-parole period, the non-parole period is likely to be their earliest possible release date.51 For all other sentenced prisoners, their earliest release date is likely to be their total effective sentence after the court has reckoned and deduced any pre-sentence detention (that is, time spent on remand).52
Figure 28: Average (mean) expected time to serve and aggregate sentence length, sentenced prisoners, 30 June, 2005 to 2015
5.0 5.0 5.05.3 5.3 5.4 5.4 5.5
5.14.9 5.0
3.7 3.7 3.73.9 4.0 4.0 4.0 4.1 3.9 3.8 4.0
0
1
2
3
4
5
6
2005 2006 2007 2008 2009 2010 2011 2012 2013 2014 2015
Mea
n se
nten
ce le
ngth
(ye
ars)
Year (30 June)
Expected time to serve
Aggregate sentence
Source: Australian Bureau of Statistics, Prisoners in Australia, cat. no. 4517.0 (2005–2015).
50. Prisoners with indeterminate, life with a minimum, and periodic detention sentences are excluded from calculations of mean aggregate sentence length.
51. An offender’s earliest eligible release date may also be influenced by the conversion of outstanding fines or infringement penalty notice debt into a period of imprisonment: see Sentencing Advisory Council, Imposition and Enforcement of Court Fines and Infringement Penalties in Victoria (2014).
52. Sentencing Act 1991 (Vic) s 18.

48 Victoria’s Prison Population 2005 to 2016
5.37 The proportion of offenders with an aggregate sentence of less than one year increased only slightly, from 18% in 2005 to 19% in 2015. The proportion of offenders with sentences of less than two years (which could potentially be combined with a community correction order) did not increase substantially over the period.
5.38 Similar trends are observed for prisoners’ expected time to serve. The proportion of offenders with an expected time to serve of less than two years decreased from 51% of sentenced prisoners in 2005 to 44% in 2015. Between 2005 and 2015, the proportion of sentenced prisoners increased slightly for offenders with an expected time to serve of both two to less than five years and five to less than 10 years.
Time served on remand5.39 Time served on remand measures the time a prisoner has spent on remand at 30 June. While
this is affected by particular prisoners on a given day, certain trends are observable in the data. In particular, the data indicates that the average time served on remand is decreasing.
5.40 Figure 29 shows that the average (mean) time served on remand dropped by 0.1 months in the higher courts, from 10 months in 2005 to 9.9 months in 2015. Between 2008 and 2013, however, the average time served on remand decreased steadily from 10.9 to 8.7 months, before increasing between 2013 and 2015.
5.41 For the lower courts,53 the average time served on remand fell by 48% over the decade. This average increased between 2006 and 2009, before decreasing every year from 2010 to 2015.
5.42 Since 2013, the average time served on remand has increased by 14% in the higher courts and has decreased by 13% in the lower courts.
Figure 29: Average (mean) time served on remand by unsentenced prisoners, 30 June, 2005 to 2015
10.0 10.4 10.5 10.9 10.810.0
9.5 9.58.7 9.1
9.9
3.12.1 2.4 2.6 2.9 2.9 2.6 2.6 2.4 2.2 2.1
0
2
4
6
8
10
12
2005 2006 2007 2008 2009 2010 2011 2012 2013 2014 2015
Mea
n tim
e on
rem
and
(mon
ths)
Year (30 June)
Higher courts
Lower courts
Source: Australian Bureau of Statistics, Prisoners in Australia, cat. no. 4517.0 (2005–2015).
53. Data on mean time spent on remand is reported by the Australian Bureau of Statistics using the variables of higher and lower courts. Lower courts include the Magistrates’ Court and ‘other’ courts such as the Children’s Court (however, this data only records adults).

5. Prisoners in Victoria 49
5.43 When analysed by category of time served on remand, it is clear that unsentenced prisoners are serving less time on remand (Figure 30). The proportion of prisoners on remand for less than one month increased from 25% in 2005 to 31% in 2015. At the same time, the proportion of prisoners on remand for one year or more fell from 15% of the remand population to 8% of the remand population. The proportion of prisoners on remand for less than six months increased from 68% of the remand population in 2005 to 79% of the remand population in 2015.
5.44 This data suggests that the increase in the remand population, observed in the prisoner census and in prisoner receptions throughout the year, is primarily due to increasing use of remand for more prisoners for shorter periods of time.
5.45 The increase in the number and proportion of prisoners serving shorter periods on remand may be attributed to the increasing number and proportion of prisoners who have been remanded for offences determined in the Magistrates’ Court.
5.46 Between 2005 and 2015, the number of prisoners on remand from the lower courts increased by 177%, while the number of prisoners on remand from the higher courts increased by 37%. As a proportion of the unsentenced population, prisoners on remand from the lower courts increased from 60% of unsentenced prisoners in 2005 to 75% in 2015.
Figure 30: Time served on remand, by remand length category, 30 June, 2005 to 2015
25.1
29.9
22.6
22.8
20.6
22.4
23.3
23.8
21.0
28.5
30.7
23.4
24.8
27.8
24.9
29.4
22.6
28.3
30.7
31.7
30.5
28.7
19.1
14.5
16.8
20.5
17.9
23.9
23.5
18.9
21.4
18.7
19.1
17.7
17.4
18.2
17.3
18.5
18.0
13.9
14.4
17.6
13.5
13.9
14.6
13.4
14.5
14.4
13.5
13.1
11.0
12.2
8.4
8.8
7.7
0 10 20 30 40 50 60 70 80 90 100
2005
2006
2007
2008
2009
2010
2011
2012
2013
2014
2015
Time served on remand (proportion %)
Year
(3
0 J
une)
% Less than1 month
% 1 toless than3 months
% 3 toless than6 months
% 6 toless than12 months
% 1 yearand over
Source: Australian Bureau of Statistics, Prisoners in Australia, cat. no. 4517.0 (2005–2015).
50 Victoria’s Prison Population 2005 to 2016
Observations on prisoners in Victoria5.47 The number of prisoner receptions by legal status (Figure 21) does not reflect the trends
observed in the prisoner census data (Figure 3). The decrease in the sentenced prisoner population observed between 30 June 2014 and 30 June 2015 is not reflected in a decrease in the number of prisoners who became sentenced prisoners in 2013–14, although the increase did slow in 2013–14 and 2014–15. Nonetheless, the increase in the number of unsentenced prisoners observed in Figure 3 is reflected in the increase in the number of prisoners received into Victorian prisons that remained unsentenced throughout the financial year.
Sentenced prisoners5.48 Sentenced prisoners were most likely to be imprisoned for an offence against the person.
Offenders imprisoned for an offence against the person were most likely to have been sentenced for a sexual assault offence. In line with the data presented in previous chapters, the number of sentenced prisoners serving time for a cause injury offence as their principal proven offence more than tripled between 2005 and 2015. This suggests that across the offending, sentencing, and prisoner data, an increase in cause injury and other offences against the person is having an observable influence on the prison population.
5.49 The average aggregate sentence lengths and average expected time to serve decreased between 2005 and 2015, particularly since 2012. This is possibly the result of the growing proportion of offenders in prison for cause injury offences and the substantial growth in offenders in custody for justice procedures offences since 2011.
5.50 Overall, the decrease in the sentenced prisoner population in recent years can be attributed to an increase in the use of shorter custodial sentences (after a period of growth in both the number of custodial sentences and the average length of those sentences).
Prisoners on remand5.51 It cannot be concluded from the data that the increase in the remand population is a result
of prisoners serving more time on remand. Rather, the data suggests that the number of prisoners serving shorter periods on remand is increasing, particularly for people appearing before the Magistrates’ Court. This could be due to changes around the presumption in favour of bail and cultural changes in the assessment of risk and granting of bail.
5.52 Overall, the data indicates that the growth in the remand population is not a cumulative effect of longer periods served on remand, but is rather a result of an increased number of persons charged with offences (particularly cause injury and drug offences) being remanded for short periods of time (particularly by the Magistrates’ Court).

6. Other influences on the prison population 51
6. Other influences on the prison population6.1 The prison population is influenced by numerous factors external to offenders and offending
behaviour. This chapter presents some information on possible influences, including legislative drivers of change, developments in case law, and recent policy shifts, in order to contextualise the statistical trends observed in this report.
6.2 The most important areas of change include the creation and abolition of certain sentencing orders, reforms to bail and the use of remand, and an evolving parole landscape, although the individual effects of these developments cannot be easily quantified.
Community correction orders and suspended sentences6.3 One of the most noteworthy changes to influence the prison population since 2005 has been
to the sentencing orders available to Victorian courts.
6.4 Suspended sentences have been progressively abolished in Victoria. The higher courts are unable to impose suspended sentences for offences committed on or after 1 September 2013, and the Magistrates’ Court is unable to impose suspended sentences for offences committed on or after 1 September 2014.54 The use of suspended sentences for ‘serious and significant’ offences committed prior to these dates is also restricted.55
6.5 In January 2012, community correction orders replaced a number of other community orders, including community-based orders, intensive correction orders, and combined custody and treatment orders.56 When introduced, community correction orders could be imposed in addition to a three-month term of imprisonment. In September 2014, the maximum term of imprisonment that could be combined with a community correction order was increased to two years.57 In December 2014, the Court of Appeal imposed a guideline judgment that articulated the punitive aspects of community correction orders and their appropriateness for a variety of serious offending that would have previously attracted a sentence of imprisonment.58
6.6 Community correction orders therefore have two competing effects on the custody rate. On the one hand, community correction orders with punitive and lengthy conditions may be imposed in cases that would have previously received a sentence of imprisonment,59 thereby reducing the custody rate. On the other hand, cases that may have previously received a wholly suspended sentence may now receive a community correction order combined with a short term of imprisonment, thereby increasing the custody rate.
54. Sentencing Amendment (Abolition of Suspended Sentences and Other Matters) Act 2013 (Vic).
55. The Sentencing Amendment Act 2010 (Vic) restricted courts from imposing a suspended sentence for ‘serious’ and ‘significant’ offences committed on or after 1 May 2011. The Sentencing (Suspended Sentences) Act 2006 (Vic) restricted courts from imposing a wholly suspended sentence for serious offences committed on or after 1 November 2006 unless there were exceptional circumstances and it would be in the interests of justice.
56. Sentencing Amendment (Community Correction Reform) Act 2011 (Vic).
57. Sentencing Act 1991 (Vic) s 44, amended by Sentencing Amendment (Emergency Workers) Act 2014 (Vic) s 18.
58. Boulton v The Queen (2014) 46 VR 308.
59. Boulton v The Queen (2014) 46 VR 308.

52 Victoria’s Prison Population 2005 to 2016
6.7 According to the Council’s previous research, short terms of imprisonment combined with community correction orders replaced some wholly and partially suspended sentences in both the higher courts and the Magistrates’ Court.60 However, in the higher courts, imprisonment combined with a community correction order was used more commonly to replace what would have previously been a sentence of imprisonment without a community correction order.61 Similar trends are observed in Figures 11 and 12.
6.8 In particular, in the higher courts, sentences of imprisonment combined with community correction orders are being used instead of imposing non-parole periods.62 While this would not have an effect on the custody rate, it would provide greater certainty in relation to the prison population, as these offenders serve out the full length of their term of imprisonment as opposed to prisoners sentenced to a non-parole period who merely become eligible for release at the end of that period (see [6.25]).
6.9 Overall, the Council’s previous research and the sentencing data presented in this report indicate that the abolition of suspended sentences has not driven the increase in the prison population.
6.10 The increasing use of remand may be influencing the use of sentences that combine imprisonment and community correction orders. In general, the time that a person serves on remand is deducted from any subsequent sentence of imprisonment.63 This means that, for example, a person who has served 60 days in custody prior to being sentenced to a 90-day term of imprisonment only serves a further 30 days of imprisonment upon sentencing. Prisoners who spend time on remand prior to receiving a non-custodial sentence do not have their time on remand reckoned.
6.11 In 2015, 37% of offenders who spent time on remand prior to being sentenced to imprisonment combined with a community correction order in the higher courts received a term of imprisonment equal to the time served on remand.64 This suggests that sentences of imprisonment combined with community correction orders are being used to recognise time served on remand that would otherwise go unrecognised. Such sentences influence the custody rate, but the offenders subjected to them are not counted as becoming sentenced prisoners in the receptions data or as sentenced prisoners in the prison census. There will therefore be a disparity between the number of custodial sentences imposed and the number of prisoners who move from the remand population into the sentenced prisoner population.
60. Sentencing Advisory Council, Community Correction Orders: Third Monitoring Report (Post-Guideline Judgment) (2016) 36–38.
61. Ibid 38.
62. Ibid.
63. Sentencing Act 1991 (Vic) s 18(1). Under this provision, the court retains the discretion to ‘otherwise order’ that pre-sentence detention not be reckoned as time served. Where pre-sentence detention is not reckoned as time served, the offender serves the sentenced term of imprisonment in addition to the time already served on remand. When the court combines a term of imprisonment with a community correction order, the court has the discretion to order that time served is not reckoned, but this discretion cannot be exercised purely to avoid setting a non-parole period: Director of Public Prosecutions v Grech [2016] VSCA 98 (10 May 2016).
64. Sentencing Advisory Council (2016), above n 60, 27–28.

6. Other influences on the prison population 53
Remand and bail6.12 The Bail Act 1977 (Vic) creates a general presumption in favour of bail being granted to persons
in custody. However, if a person is charged with certain serious offences, or is considered to be an ‘unacceptable risk’, the court must be satisfied that there are ‘exceptional circumstances’ that justify the granting of bail.65 The onus is also reversed for other listed circumstances that require a person to ‘show cause’ as to why their detention in custody is not justified.66 As these circumstances are broadened, an increase in the remand population can be expected.67
6.13 Successive governments have expanded the list of circumstances in which the onus is reversed, as well as the consequences for breach.68 Importantly, in 2005 the Bail Act 1977 (Vic) was amended, creating a presumption against bail for Commonwealth offences of drug importation unless the court is satisfied that there are exceptional circumstances justifying the grant of bail.69 This was added to the existing presumption against bail for the Victorian drug offences of trafficking in a large commercial or a commercial quantity of a drug of dependence and cultivation of narcotic plants in a large commercial or a commercial quantity.70 Alongside an increase in the amount of drug offending, this may partly explain the increase in the number of prisoners on remand for drug offences (see Figure 24).
6.14 In addition to legislative changes around the presumption of bail, it is also possible that changes in risk perception influence the number of prisoners on remand. Traditionally, the decision to grant bail was based primarily on assessing the risk regarding the person’s attendance at court (or ‘flight risk’). However, there may have been a shift to broader considerations of risk to the community, and it is possible that decision-making around bail is more risk averse or more reliant on actuarial risk assessment tools.71
6.15 This is supported by growing community concern around offences committed by people already in contact with the criminal justice system (including offences committed while on bail or on parole).72 In 2013, the Victorian Government introduced separate offences in relation to offences committed while on bail or on parole, as well as offences in relation to the breach of certain conduct conditions while on bail.73
6.16 Bail applications in the Magistrates’ Court have increased from 14,150 in 2009–10 to 29,074 in 2014–15 (up 106%).74 Applications for revocation of bail have similarly increased, from 1,675 applications in 2009–10 to 4,252 in 2014–15 (up 154%).75
65. Bail Act 1977 (Vic) s 4(2).
66. Bail Act 1977 (Vic) s 4(4).
67. See for example, the expansion of the presumption against bail inserted by the Bail Amendment Act 2016 (Vic). The amendments introduced by this Act are not yet captured by the data.
68. See Road Safety and Other Acts (Vehicle Impoundment and Other Amendments) Act 2005 (Vic); Bail Amendment Act 2010 (Vic); Bail Amendment Act 2013 (Vic); Serious Sex Offenders (Detention and Supervision) and Other Acts Amendment Act 2015 (Vic); Bail Amendment Act 2016 (Vic); Crimes Amendment (Carjacking and Home Invasion) Bill 2016 (Vic).
69. Bail Act 1977 (Vic) s 4(2)(aa)(iii), inserted by the Road Safety and Other Acts (Vehicle Impoundment and Other Amendments) Act 2005 (Vic) s 13(2).
70. Bail Act 1977 (Vic) s 4(2)(aa)(i)–(ii).
71. An approach to setting bail based solely on risk was recommended in Victorian Law Reform Commission, Review of the Bail Act: Final Report (2007) 9.
72. See for example, Cameron Houston and Chris Vedelago, ‘Victoria’s Bail System Is in Disarray’, The Age (Melbourne) 1 October 2015 <http://www.theage.com.au/victoria/victorias-bail-system-is-in-disarray-20151001-gjz5w2.html> at 21 October 2016; Elissa Hunt and Katie Bice, ‘Profile of Several Criminals Who Were on Parole When They Killed’, Herald Sun (Melbourne) 20 August 2013 <http://www.heraldsun.com.au/news/law-order/we-profile-several-killers-who-were-on-parole/story-fnat7jnn-1226558400521> at 21 October 2016; Louise Milligan, ‘Murder Victims’ Families Demand Reform of Victoria’s Parole System’, ABC News (Melbourne) 29 July 2013 <http://www.abc.net.au/news/2013-07-29/pressure-builds-for-reform-for-victorias-parole-system/4851466> at 21 October 2016.
73. Bail Act 1977 (Vic) ss 30A–30B, inserted by Bail Amendment Act 2013 (Vic); Corrections Act 1986 (Vic) s 78A, inserted by Corrections Amendment (Breach of Parole) Act 2013 (Vic).
74. Magistrates’ Court of Victoria, Annual Report 2014–15 (2015) 76; Magistrates’ Court of Victoria (2014), above n 23, 80.
75. Ibid.

54 Victoria’s Prison Population 2005 to 2016
6.17 The Victorian Ombudsman has noted that ‘the increased bail hearings before the Magistrates’ Court shows that there has been a substantial decrease in the exercise of police discretion to release people on bail’.76 This contributes to the remand population as people wait for bail applications to be heard. In its review of the Bail Act 1977 (Vic), the Victorian Law Reform Commission indicated that the expansion of the list of offences for which the presumption in favour of bail is reversed has led to police automatically leaving such bail decisions to the courts.77
6.18 People who commit bail offences are likely to be held on remand, as they have demonstrated risk. Breach of bail offending is less likely to be reflected in the most serious charge or offence data, however, as breach of bail offences are usually accompanied by more serious offending that constitutes the actual breach of bail. In the Magistrates’ Court, the number of charges that have been finalised for failure to answer bail has increased from 6,590 charges in 2008–09 to 11,610 charges in 2014–15 (an increase of 76%).78 According to the Crime Statistics Agency, breach of order offences recorded by police increased by 199% between the year ending March 2012 and the year ending March 2016, from 18,810 breach of order offences (April 2011 to March 2012) to 56,261 offences (April 2015 to March 2016).79
6.19 As the remand population increases, it can be expected that the sentenced prisoner population will also increase. Not all prisoners on remand will be found guilty or receive a custodial sentence. Historically, however, prisoners on remand are more likely to have committed a serious offence and/or are less likely to be suitable for a non-custodial sentence if found guilty. If the increase in the number of people receiving custodial sentences does not mirror a similar increase in the remand population, then the question arises as to whether remand is being used in an appropriate and sustainable manner.
Parole reforms6.20 A number of reforms over the past decade have decreased the likelihood that a prisoner will
be granted parole. Prisoners who are not granted parole remain in prison for longer (adding to the prison population) and may be released without any transitional programs (which can increase the likelihood of reoffending; see [1.23]–[1.24]).
6.21 A number of reforms to Victoria’s system of parole were implemented following several reviews conducted in 2012 and 2013, including the Callinan Review of the Parole System, the Ogloff Review of Parolee Reoffending by Way of Murder, and the Council’s Review of the Victorian Adult Parole System.80 The reforms included:
• changes to the onus for consideration of parole;
• time limits on when an offender may be reconsidered for parole after cancellation for breach;
• changes to how sexual and serious violent offenders are dealt with (including automatic cancellation of their parole if they commit an offence while on parole);
• the insertion of an overarching obligation to the protection of the community; and
• the creation of a new offence for the breach of parole.81
76. Victorian Ombudsman (2015), above n 24, 23.
77. Victorian Law Reform Commission (2007), above n 71, 40.
78. Magistrates’ Court of Victoria (2015), above n 74, 76; Magistrates’ Court of Victoria, 2008–09 Annual Report (2009) 90.
79. Crime Statistics Agency, Victoria, Offences Recorded: Year Ending 31 March 2016 (2016) Table 1.
80. Ian Callinan, Review of the Parole System in Victoria (2013); James Ogloff and the Office of Correctional Services Review, Review of Parolee Reoffending by Way of Murder (2013); Sentencing Advisory Council, Review of the Victorian Adult Parole System: Report (2012).
81. Corrections Amendment Act 2013 (Vic); Justice Legislation Amendment (Cancellation of Parole and Other Matters) Act 2013 (Vic); Corrections Amendment (Breach of Parole) Act 2013 (Vic); Corrections Amendment (Parole Reform) Act 2013 (Vic); Corrections Amendment (Parole) Act 2014 (Vic); Corrections Amendment (Further Parole Reform) Act 2014 (Vic).

6. Other influences on the prison population 55
6.22 Since 1 March 2015, eligible prisoners are only considered for parole if they make an application.82 The Victorian Auditor-General reported that between March and November 2015, approximately 8% of eligible prisoners did not apply for parole.83 This could be due to prisoners’ perceptions of an increased likelihood of breaching parole, which would therefore result in prisoners spending longer in the criminal justice system, following the new conditions and consequences for breach.
6.23 According to the Adult Parole Board, 7% of eligible prisoners chose not to apply for parole in 2015–16.84 Of the applications finalised during the financial year, 75% were approved for parole or re-parole. In addition, the number of prisoners who served their full term increased from 160 prisoners in 2012–13 to 538 prisoners in 2015–16 (an increase of 236%).85
6.24 The Council’s recent Parole and Sentencing: Research Report found a decline in the imposition of sentences involving the fixing of a non-parole period. Between 2010–11 and 2014–15, the proportion of imprisonment sentences that included a non-parole period decreased from 22% to 10% in the Magistrates’ Court and from 95% to 69% in the higher courts.86 The decrease in the use of parole was partly due to an increase in the use of terms of imprisonment of less than one year for which a non-parole period cannot be imposed.87
6.25 In addition, sentences of imprisonment combined with community correction orders have replaced some sentences of imprisonment with a non-parole period. The Council’s previous research found that:
Between the September quarter of 2014 and the June quarter of 2015, the proportion of imprisonment sentences of one year to less than two years that were combined with a CCO increased from 0.0% to 72.1% in the higher courts and 0.0% to 12.0% in the Magistrates’ Court.88
6.26 While the influence of reforms to parole on the prison population is not immediately quantifiable, they can be expected to have particular effects. Prisoners choosing to serve out their full terms will have a cumulative effect on, and contribute to, the prison population for longer.
6.27 Further, the decrease in the use of non-parole periods and the increase in the use of sentences of imprisonment combined with community correction orders are likely to lead to greater certainty in the size of the prison population, as the expected time to serve will equal the aggregate sentence length for an increasing number of prisoners.
82. Adult Parole Board, Parole Manual – Adult Parole Board of Victoria (5th ed., 2015) 16.
83. Victorian Auditor-General, Administration of Parole (2016) 10.
84. Josie Taylor, ‘Victorian Prisoners “Maxing Out” Jail Sentences to Avoid Strict Parole Law, Experts Warn of Risk to Community’, ABC News (Melbourne) 9 September 2016 <http://www.abc.net.au/news/2016-09-09/victoria-parole-laws-backfiring-more-prisoners-max-out-sentence/7826940> at 21 October 2016.
85. Ibid.
86. Sentencing Advisory Council, Parole and Sentencing: Research Report (2016) 41.
87. Sentencing Act 1991 (Vic) s 11.
88. Sentencing Advisory Council (2016), above n 86, 41.

56 Victoria’s Prison Population 2005 to 2016
Conclusions 6.28 Similar to the Council’s previous reports on Victoria’s prison population, this report finds that
the prison population continues to increase. The Council’s 2013 report found that the growth in the prison population between 2002 and 2012 could largely be attributed to a combination of longer terms of imprisonment and an increase in particular serious offences. In the years since the 2013 report, however, trends in the prison population have changed significantly.
6.29 Specifically, the sentenced prisoner population has started to decrease. This is largely due to the use of shorter sentences for high-frequency offences, increases in the number of offences that historically receive short terms of imprisonment, and greater use of short terms of imprisonment combined with community correction orders. The decrease in the sentenced prisoner population is not due to a reduction in offending or a drop in the number of offenders receiving custodial sentences. Nonetheless, while the crime rate has increased in recent years, growth in the number of prisoners received into the sentenced prisoner population has slowed.
6.30 The majority of the increase in the prison population in recent years can be attributed to a burgeoning remand population. This has been influenced by an increase in the number of prisoners on remand for cause injury offences and property offences, particularly since 2013. On average, prisoners are spending less time on remand. The increasing remand population is therefore a result of an increase in the use of remand.
6.31 The increasing number of unsentenced prisoners in Victorian prisons has significant ramifications for the criminal justice system in Victoria. Given that growth in the remand population is increasing year on year, consideration needs to be given as to whether current remand practices are appropriate and sustainable.

Appendix A: Principal proven offence categories 57
Appendix A: Principal proven offence categoriesCrime Statistics Agency Offence Classifications Australia and New Zealand Standard Offence
Classifications (Australian Bureau of Statistics)
Crimes against the person
A10 Homicide and related offences 01 Homicide and related offences
A20 Assault and related offences 02 Acts intended to cause injury
A30 Sexual offences 03 Sexual assault and related offences
A40 Abduction and related offences 04 Dangerous or negligent acts endangering persons
A50 Robbery 05 Abduction, harassment and other offences against the person
A60 Blackmail and extortion 06 Robbery, extortion and related offences
A70 Stalking,1 harassment and threatening behaviour
A80 Dangerous and negligent acts endangering people
Property and deception offences
B10 Arson 12 Property damage and environmental pollution
B20 Property damage 12 Property damage and environmental pollution2
B30 Burglary/break and enter 07 Unlawful entry with intent/burglary, break and enter
B40 Theft 08 Theft and related offences
B50 Deception 09 Fraud, deception and related offences
B60 Bribery3
Drug offences
C10 Drug dealing and trafficking 10 Illicit drug offences
C20 Cultivate or manufacture drugs 101 Import or export illicit drugs
C30 Drug use and possession 102 Deal or traffic in illicit drugs
C90 Other drug offences 103 Manufacture or cultivate illicit drugs
104 Possess and/or use illicit drugs
109 Other illicit drug offences
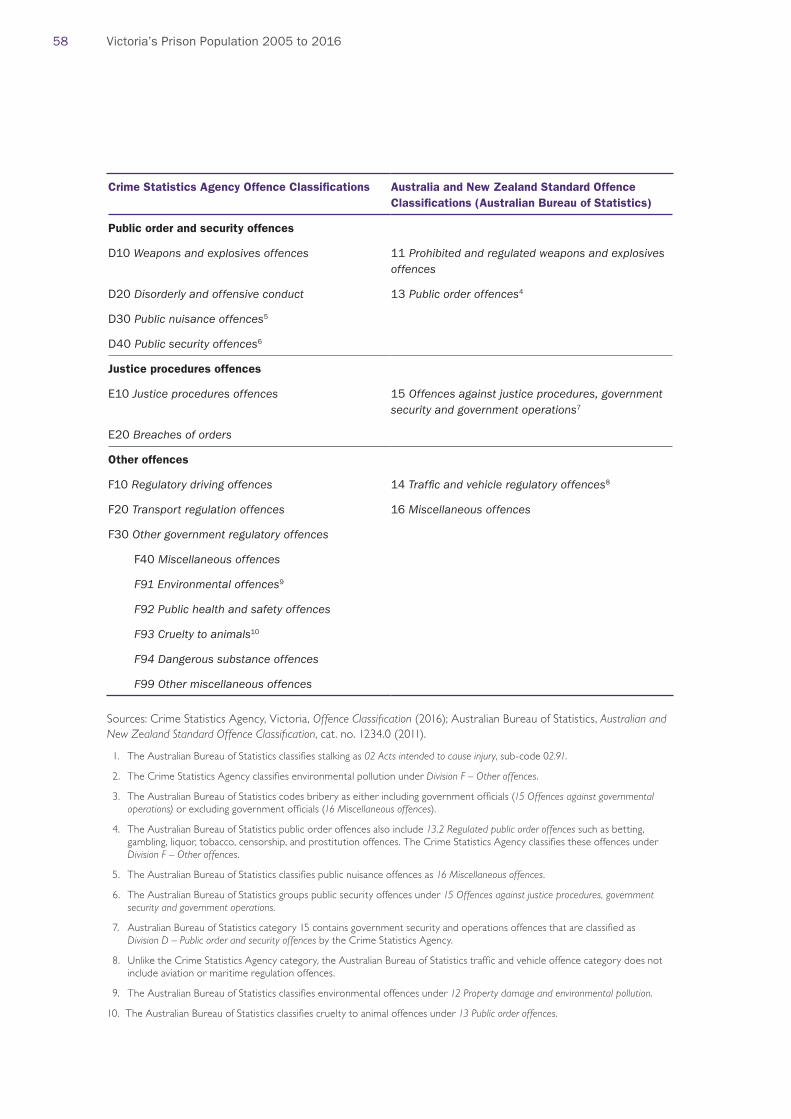
58 Victoria’s Prison Population 2005 to 2016
Crime Statistics Agency Offence Classifications Australia and New Zealand Standard Offence Classifications (Australian Bureau of Statistics)
Public order and security offences
D10 Weapons and explosives offences 11 Prohibited and regulated weapons and explosives offences
D20 Disorderly and offensive conduct 13 Public order offences4
D30 Public nuisance offences5
D40 Public security offences6
Justice procedures offences
E10 Justice procedures offences 15 Offences against justice procedures, government security and government operations7
E20 Breaches of orders
Other offences
F10 Regulatory driving offences 14 Traffic and vehicle regulatory offences8
F20 Transport regulation offences 16 Miscellaneous offences
F30 Other government regulatory offences
F40 Miscellaneous offences
F91 Environmental offences9
F92 Public health and safety offences
F93 Cruelty to animals10
F94 Dangerous substance offences
F99 Other miscellaneous offences
Sources: Crime Statistics Agency, Victoria, Offence Classification (2016); Australian Bureau of Statistics, Australian and New Zealand Standard Offence Classification, cat. no. 1234.0 (2011).
1. The Australian Bureau of Statistics classifies stalking as 02 Acts intended to cause injury, sub-code 02.91.
2. The Crime Statistics Agency classifies environmental pollution under Division F – Other offences.
3. The Australian Bureau of Statistics codes bribery as either including government officials (15 Offences against governmental operations) or excluding government officials (16 Miscellaneous offences).
4. The Australian Bureau of Statistics public order offences also include 13.2 Regulated public order offences such as betting, gambling, liquor, tobacco, censorship, and prostitution offences. The Crime Statistics Agency classifies these offences under Division F – Other offences.
5. The Australian Bureau of Statistics classifies public nuisance offences as 16 Miscellaneous offences.
6. The Australian Bureau of Statistics groups public security offences under 15 Offences against justice procedures, government security and government operations.
7. Australian Bureau of Statistics category 15 contains government security and operations offences that are classified as Division D – Public order and security offences by the Crime Statistics Agency.
8. Unlike the Crime Statistics Agency category, the Australian Bureau of Statistics traffic and vehicle offence category does not include aviation or maritime regulation offences.
9. The Australian Bureau of Statistics classifies environmental offences under 12 Property damage and environmental pollution.
10. The Australian Bureau of Statistics classifies cruelty to animal offences under 13 Public order offences.

Appendix B: Custodial sentences in the higher courts, by offence category 59
Appendix B: Custodial sentences in the higher courts, by offence categoryYear Person Property Drug Public
orderJustice
proceduresOther Total
Number of custodial sentences
2004–05 565 249 153 27 15 38 1,047
2005–06 567 247 187 17 14 29 1,061
2006–07 643 260 154 45 10 15 1,127
2007–08 707 240 184 45 11 19 1,206
2008–09 679 193 193 26 22 12 1,125
2009–10 718 234 236 14 13 5 1,220
2010–11 726 237 238 23 10 9 1,243
2011–12 694 232 253 9 19 9 1,216
2012–13 784 203 268 10 39 5 1,309
2013–14 712 230 276 23 39 7 1,287
2014–15 676 185 227 11 36 6 1,141
2004–05 to 2014–15 (% change)
19.6% –25.7% 48.4% –59.3% 140.0% –84.2% 9.0%
Custody rate
2004–05 53.7% 44.9% 62.7% 34.2% 27.3% 51.4% 50.8%
2005–06 59.2% 45.4% 57.7% 17.9% 31.1% 52.7% 52.5%
2006–07 58.5% 49.7% 67.0% 29.6% 18.2% 40.5% 53.8%
2007–08 57.2% 52.1% 61.3% 36.6% 39.3% 37.3% 54.8%
2008–09 59.4% 53.5% 67.5% 33.8% 50.0% 24.0% 57.4%
2009–10 67.9% 60.6% 67.8% 28.6% 37.1% 18.5% 64.1%
2010–11 65.9% 56.8% 68.0% 42.6% 28.6% 30.0% 62.6%
2011–12 62.5% 61.2% 71.5% 27.3% 39.6% 31.0% 62.3%
2012–13 66.8% 65.5% 81.5% 43.5% 63.9% 33.3% 68.5%
2013–14 63.7% 66.7% 81.2% 50.0% 55.7% 41.2% 66.5%
2014–15 62.8% 62.5% 78.8% 37.9% 53.7% 33.3% 64.3%
2004–05 to 2014–15 (% change)
17.0% 39.3% 25.7% 11.0% 97.0% –35.1% 26.5%

60 Victoria’s Prison Population 2005 to 2016
Year Person Property Drug Public order
Justice procedures
Other Total
Mean sentence length (years)
2004–05 4.7 2.2 2.4 2.1 2.4 5.7 3.7
2005–06 4.9 2.5 3.2 1.5 2.5 7.0 4.0
2006–07 4.8 2.2 3.7 2.1 1.4 2.6 3.9
2007–08 4.3 2.7 3.2 1.6 2.0 3.0 3.6
2008–09 4.6 2.7 3.0 3.1 4.6 2.8 3.9
2009–10 5.0 3.0 3.7 1.9 4.1 4.6 4.3
2010–11 4.8 3.1 3.2 2.9 2.0 4.1 4.1
2011–12 4.7 2.9 3.3 2.6 5.0 0.9 4.0
2012–13 4.6 3.0 3.7 2.9 1.2 2.4 4.1
2013–14 4.7 3.1 3.7 3.1 1.1 2.5 4.0
2014–15 4.2 2.9 3.9 1.9 1.2 2.9 3.8
2004–05 to 2014–15 (% change)
–10.4% 29.5% 64.2% –7.2% –50.5% –50.0% 2.7%

Appendix C: Custodial sentences in the Magistrates’ Court, by offence category 61
Appendix C: Custodial sentences in the Magistrates’ Court, by offence categoryYear Person Property Drug Public
orderJustice
proceduresOther Total
Number of custodial sentences
2004–05 1,003 2,022 309 166 149 627 4,276
2005–06 1,022 1,926 272 192 140 749 4,301
2006–07 1,057 1,886 239 184 135 711 4,212
2007–08 1,025 1,742 245 211 146 655 4,024
2008–09 1,222 1,756 300 217 169 633 4,297
2009–10 1,397 1,969 311 253 190 746 4,866
2010–11 1,292 1,640 278 225 161 600 4,196
2011–12 1,477 1,644 316 247 209 566 4,459
2012–13 1,859 1,816 406 349 283 586 5,299
2013–14 1,913 1,883 480 377 334 544 5,531
2014–15 2,119 1,862 554 436 501 521 5,993
2004–05 to 2014–15 (% change)
111.3% –7.9% 79.3% 162.7% 236.2% –16.9% 40.2%
Mean sentence length (months)
2004–05 – – – – – – –
2005–06 – – – – – – –
2006–07 6.2 6.0 6.4 4.2 1.9 2.7 5.3
2007–08 7.0 6.2 6.9 5.3 2.6 2.8 5.7
2008–09 6.9 6.2 7.1 4.9 2.0 2.5 5.7
2009–10 7.1 6.4 6.4 4.8 2.7 3.0 5.9
2010–11 7.5 6.1 8.6 4.5 2.2 2.7 6.0
2011–12 7.0 6.0 7.3 4.8 2.4 2.7 5.8
2012–13 7.0 6.1 7.4 5.2 2.0 2.4 5.8
2013–14 6.3 5.5 6.5 4.7 2.4 2.3 5.3
2014–15 5.8 5.1 6.5 5.3 2.4 2.2 5.0
2006–07 to 2014–15 (% change)
–7.1% –16.4% 0.6% 24.4% 27.9% –18.4% –6.5%

62 Victoria’s Prison Population 2005 to 2016
ReferencesBibliography Adult Parole Board of Victoria, Parole Manual – Adult Parole Board of Victoria (5th ed., Adult Parole Board of Victoria, 2015) <http://assets.justice.vic.gov.au/corrections/resources/e55ff13c-c723-42e6-8e18-c6171a5c96c3/apb_parole_manual1june15.pdf>.
Andrew, Jane, Max Baker, and Philip Roberts, Prison Privatisation in Australia: The State of the Nation (The University of Sydney, 2016) <http://sydney.edu.au/business/__data/assets/pdf_file/0008/269972/Prison_Privatisation_in_Australia-_The_State_of_the_Nation_June_2016.pdf>.
Australian Bureau of Statistics, Australian and New Zealand Standard Offence Classification, cat. no. 1234.0 (2011) <http://www.abs.gov.au/ausstats/[email protected]/Lookup/CC62FFFD85381287CA257B1F00100DD3?opendocument>.
Australian Bureau of Statistics, Corrective Services, Australia, June Quarter 2016, cat. no. 4512.0 (2016) <http://www.abs.gov.au/ausstats/[email protected]/mf/4512.0>.
Australian Bureau of Statistics, Estimates and Projections, Aboriginal and Torres Strait Islander Australians, 2001 to 2026, cat. no. 3238.0 (2014) <http://www.abs.gov.au/ausstats/[email protected]/mf/3238.0>.
Australian Bureau of Statistics, Population Projections, Australia, 2012 (Base) to 2101, cat. no. 3222.0 (2013) <http://www.abs.gov.au/AUSSTATS/[email protected]/mf/3222.0>.
Australian Bureau of Statistics, Prisoners in Australia, cat. no. 4517.0 (Australian Bureau of Statistics, 2005–2015) <http://www.abs.gov.au/ausstats/[email protected]/mf/4517.0>.
Callinan, Ian, Review of the Parole System in Victoria (Corrections Victoria, 2013) <http://assets.justice.vic.gov.au/corrections/resources/11ee85a1-67c5-4493-9d81-1ce49941cce5/reviewadultparoleboardv1.pdf>.
Corrections Victoria, Monthly Prisoner and Offender Statistics: 2015–16 (Department of Justice and Regulation, Victoria, 2016) <http://www.corrections.vic.gov.au/utility/publications+manuals+and+statistics/monthly+prisoner+and+offender+statistics>.
Council of State Governments, Justice Reinvestment Home (The Council of State Governments Justice Center, 2016) <https://csgjusticecenter.org/jr/>.
Crime Statistics Agency, Victoria, Offence Classification (Crime Statistics Agency, Victoria, 2016) <http://www.crimestatistics.vic.gov.au/about-the-data/classifications-and-victorian-map-boundaries/offence-classification>.
Crime Statistics Agency, Victoria, Offences Recorded: Year Ending 30 June 2015 (Crime Statistics Agency, Victoria, 2015) <http://www.crimestatistics.vic.gov.au/crime-statistics/historical-crime-data/year-ending-30-june-2015/recorded-offences>.
Crime Statistics Agency, Victoria, Offences Recorded: Year Ending 31 March 2016 (Crime Statistics Agency, Victoria, 2016) <https://www.crimestatistics.vic.gov.au/crime-statistics/latest-crime-data/recorded-offences>.
Crime Statistics Agency, Victoria, Unique Alleged Offenders: Year Ending 30 June 2015 (Crime Statistics Agency, Victoria, 2015) <http://www.crimestatistics.vic.gov.au/unique-alleged-offenders>.
Department of Justice and Regulation, Victoria, Key Statistics on the Victorian Prison System: 2009–10 to 2013–14 (Department of Justice and Regulation, Victoria, 2015) <http://assets.justice.vic.gov.au/corrections/resources/8d4eab63-fd36-4cd0-9382-dffa924910d5/key_stats_vicprisons2015.pdf>.
Department of Justice and Regulation, Victoria, Ravenhall Prison Project (Corrections, Prisons & Parole, 2016) <http://www.corrections.vic.gov.au/home/prison/ravenhall+prison+project.shtml>.
References 63
Department of Justice, Victoria, Statistical Profile of the Victorian Prison System: 2003–04 to 2007–08 (Department of Justice, Victoria, 2009) <http://assets.justice.vic.gov.au/corrections/resources/9c20af2f-1234-4b95-a164-bf0722f82e4f/statistical_profile_vic_prison_2003-04_2007-08.pdf>.
Department of Justice, Victoria, Statistical Profile of the Victorian Prison System: 2004–05 to 2008–09 (Department of Justice, Victoria, 2010) <https://assets.justice.vic.gov.au/corrections/resources/8c5f0cd3-b862-4a7a-8349-cccc5be1dd84/statistical_profile_victorian_prison_system_2004-05_to_2008-09.pdf>.
Department of Justice, Victoria, Statistical Profile of the Victorian Prison System: 2005–06 to 2009–10 (Department of Justice, Victoria, 2011) <http://assets.justice.vic.gov.au/corrections/resources/01736838-2683-43b2-917a-c411f4dae3bb/statistical_profile_victorian_prison_system_2005-06to2009-10.pdf>.
Deputy Premier of New South Wales, ‘Record Investment in Justice in NSW Budget’, Media Release (21 June 2016) <http://www.justice.nsw.gov.au/Pages/media-news/media-releases/2016/Record-investment-in-justice-in-NSW-budget.aspx>.
Houston, Cameron and Chris Vedelago, ‘Victoria’s Bail System Is in Disarray’, The Age (Melbourne) 1 October 2015 < http://www.theage.com.au/victoria/victorias-bail-system-is-in-disarray-20151001-gjz5w2.html>.
Hunt, Elissa and Katie Bice, ‘Profile of Several Criminals Who Were on Parole When They Killed’, Herald Sun (Melbourne) 20 August 2013 <http://www.heraldsun.com.au/news/law-order/we-profile-several-killers-who-were-on-parole/story-fnat7jnn-1226558400521>.
Magistrates’ Court of Victoria, 2008–09 Annual Report (Magistrates’ Court of Victoria, 2009) <https://www.magistratescourt.vic.gov.au/sites/default/files/Default/Annual_Report_08-09.pdf>.
Magistrates’ Court of Victoria, Annual Report 2013/14 (Magistrates’ Court of Victoria, 2014) <https://www.magistratescourt.vic.gov.au/sites/default/files/Default/Annual%20Report%202013-2014.pdf>.
Magistrates’ Court of Victoria, Annual Report 2014–15 (Magistrates’ Court of Victoria, 2015) <https://www.magistratescourt.vic.gov.au/publication/annual-report-2014-2015>.
Menendez, Patricia and Don James Weatherburn, ‘Does the Threat of Longer Prison Terms Reduce the Incidence of Assault?’ (2016) 49(3) Australian & New Zealand Journal of Criminology 389 <http://anj.sagepub.com/content/49/3/389.full.pdf+html>.
Milligan, Louise, ‘Murder Victims’ Families Demand Reform of Victoria’s Parole System’, ABC News (Melbourne) 29 July 2013 <http://www.abc.net.au/news/2013-07-29/pressure-builds-for-reform-for-victorias-parole-system/4851466>.
Nicholls, Sean, ‘NSW Budget 2016: $3.8 Billion for New Jail Capacity to Cover Surge in Prison Population’, Sydney Morning Herald (Sydney) 16 June 2016 <http://www.smh.com.au/nsw/nsw-budget-2016-38-billion-for-new-jail-capacity-to-cover-surge-in-prison-population-20160616-gpkhd5.html>.
Office of the Inspector of Custodial Services, Western Australia’s Rapidly Increasing Remand Population (Office of the Inspector of Custodial Services, 2015) <http://www.parliament.wa.gov.au/publications/tabledpapers.nsf/displaypaper/3913692ae42f62b654b8165748257f1c00169907/$file/3692.pdf>.
Ogloff, James and the Office of Correctional Services Review, Review of Parolee Reoffending by Way of Murder (Corrections, Prisons & Parole 2013) <http://www.corrections.vic.gov.au/utility/publications+manuals+and+statistics/review+of+parolee+reoffending+by+way+of+murder>.
Productivity Commission, Report on Government Services 2016, vol. C (Productivity Commission for the Steering Committee for the Review of Government Service Provision, 2016) <http://www.pc.gov.au/research/ongoing/report-on-government-services/2016/justice>.

64 Victoria’s Prison Population 2005 to 2016
Sentencing Advisory Council, Community Correction Orders: Third Monitoring Report (Post-Guideline Judgment) (Sentencing Advisory Council, 2016) <http://www.sentencingcouncil.vic.gov.au/publications/community-correction-orders-third-monitoring-report-post-guideline-judgment>.
Sentencing Advisory Council, Does Imprisonment Deter? A Review of the Evidence (Sentencing Advisory Council, 2011) <http://www.sentencingcouncil.vic.gov.au/publications/does-imprisonment-deter>.
Sentencing Advisory Council, Imposition and Enforcement of Court Fines and Infringement Penalties in Victoria (Sentencing Advisory Council, 2014) <http://www.sentencingcouncil.vic.gov.au/publications/imposition-and-enforcement-court-fines-and-infringement-penalties-victoria>.
Sentencing Advisory Council, Parole and Sentencing: Research Report (Sentencing Advisory Council, 2016) <http://www.sentencingcouncil.vic.gov.au/publications/parole-and-sentencing-research-report>.
Sentencing Advisory Council, Review of the Victorian Adult Parole System: Report (Sentencing Advisory Council, 2012) <http://www.sentencingcouncil.vic.gov.au/publications/review-of-victorian-adult-parole-system-report>.
Sentencing Advisory Council, Sentencing for Contravention of Family Violence Intervention Orders and Safety Notices: Second Monitoring Report (Sentencing Advisory Council, 2015) <http://www.sentencingcouncil.vic.gov.au/publications/sentencing-contravention-family-violence-intervention-orders-and-safety-notices-second>.
Sentencing Advisory Council, Victoria’s Prison Population 2001 to 2006 (Sentencing Advisory Council, 2007) <https://www.sentencingcouncil.vic.gov.au/publications/victorias-prison-population-2001-2006>.
Sentencing Advisory Council, Victoria’s Prison Population 2002 to 2012 (Sentencing Advisory Council, 2013) <https://www.sentencingcouncil.vic.gov.au/publications/victorias-prison-population-2002-2012>.
State Government of Victoria, 2006–07: Service Delivery, Budget Paper no. 3 (State Government of Victoria, 2006) <http://www.dtf.vic.gov.au/Publications/State-Budget-publications/2006-07-State-Budget/2006-07-Budget-Papers>.
State Government of Victoria, Getting it Done: Victorian Budget 16/17: Service Delivery, Budget Paper no. 3 (State Government of Victoria, 2016) <http://budgetfiles201617.budget.vic.gov.au/2016-17+State+Budget+-+BP3+Service+Delivery.pdf>.
Taylor, Josie, ‘Victorian Prisoners “Maxing Out” Jail Sentences to Avoid Strict Parole Law, Experts Warn of Risk to Community’, ABC News (Melbourne) 9 September 2016 <http://www.abc.net.au/news/2016-09-09/victoria-parole-laws-backfiring-more-prisoners-max-out-sentence/7826940>.Victoria Police, Crime Statistics 2006/2007 (Victoria Police, 2007) <http://www.police.vic.gov.au/content.asp?a=internetBridgingPage&Media_ID=20919>.
Victoria, Royal Commission into Family Violence, Report and Recommendations (2016) vol. 1.
Victorian Auditor-General, Administration of Parole (Victorian Auditor-General, 2016) <http://www.audit.vic.gov.au/publications/20160210-Parole/20160210-Parole.pdf>.
Victorian Auditor-General, Prison Capacity Planning (Victorian Auditor-General, 2012) <http://www.audit.vic.gov.au/publications/2012-13/20121128-Prisons/20121128-Prisons.pdf>.
Victorian Auditor-General, Prisoner Transportation (Victorian Auditor-General, 2014) <http://www.audit.vic.gov.au/reports_and_publications/latest_reports/2013-14/20140611-prisoner-transport.aspx>.
Victorian Law Reform Commission, Review of the Bail Act: Final Report (Victorian Law Reform Commission, 2007) <http://www.lawreform.vic.gov.au/projects/bail/bail-act-final-report>.
Victorian Ombudsman, Investigation into the Rehabilitation and Reintegration of Prisoners in Victoria (Victorian Ombudsman, 2015) <https://www.ombudsman.vic.gov.au/getattachment/5188692a-35b6-411f-907e-3e7704f45e17>.

References 65
Wan, Wai-Yin, Steve Moffatt, Craig Jones, and Don Weatherburn, The Effect of Arrest and Imprisonment on Crime, Crime and Justice Bulletin: Contemporary Issues in Crime and Justice no. 158 (NSW Bureau of Crime Statistics and Research, 2012) <http://www.austlii.edu.au/cgi-bin/sinodisp/au/journals/NSWCrimJustB/2012/4.html>.
Weatherburn, Don, Simon Corben, Stephanie Ramsey, and Jacqueline Fitzgerald, Why Is the NSW Prison Population Still Growing? Another Look at Prison Trends between 2011 and 2015, Issue Paper no. 113 (NSW Bureau of Crime Statistics and Research, 2016) <http://www.bocsar.nsw.gov.au/Documents/BB/Report-2016-Why-is-the-NSW-prison-population-still-growing-bb113.pdf>.
Wong, Kevin, Dan Ellingworth, and Linda Meadows, Local Justice Reinvestment Pilot: Final Process Evaluation Report, Ministry of Justice Analytical Series (UK Ministry of Justice, 2015) <https://www.gov.uk/government/uploads/system/uploads/attachment_data/file/449630/local-justice-reinvestment-pilot-process-evaluation-report.pdf>.
Case lawBoulton v The Queen (2014) 46 VR 308
Director of Public Prosecutions v Grech [2016] VSCA 98 (10 May 2016)
Legislation Bail Act 1977 (Vic)
Bail Amendment Act 2010 (Vic)
Bail Amendment Act 2013 (Vic)
Bail Amendment Act 2016 (Vic)
Corrections Act 1986 (Vic)
Corrections Amendment Act 2013 (Vic)
Corrections Amendment (Breach of Parole) Act 2013 (Vic)
Corrections Amendment (Further Parole Reform) Act 2014 (Vic)
Corrections Amendment (Parole) Act 2014 (Vic)
Corrections Amendment (Parole Reform) Act 2013 (Vic)
Crimes Amendment (Carjacking and Home Invasion) Bill 2016 (Vic)
Evidence (Miscellaneous Provisions) Act 1958 (Vic)
Justice Legislation (Evidence and Other Acts) Amendment Act 2016 (Vic)
Justice Legislation Amendment (Cancellation of Parole and Other Matters) Act 2013 (Vic)
Road Safety and Other Acts (Vehicle Impoundment and Other Amendments) Act 2005 (Vic)
Sentencing Act 1991 (Vic)
Sentencing Amendment Act 2010 (Vic)
Sentencing Amendment (Abolition of Suspended Sentences and Other Matters) Act 2013 (Vic)
Sentencing Amendment (Community Correction Reform) Act 2011 (Vic)
Sentencing (Suspended Sentences) Act 2006 (Vic)
Serious Sex Offenders (Detention and Supervision) and Other Acts Amendment Act 2015 (Vic)
Quasi-legislative materialsVictoria, Parliamentary Debates, Legislative Council, 26 May 2016 (Steve Herbert, Minister for Corrections).
Victoria, Parliamentary Debates, Legislative Council, 9 June 2016 (Steve Herbert, Minister for Corrections).

Sentencing Advisory Council
Level 3 333 Queen Street Melbourne VIC 3000
Telephone 1300 363 196 Facsimile 03 9908 8777 [email protected]
www.sentencingcouncil.vic.gov.au
Follow us on Twitter @SACvic