vibration issues for superkekb - slac national …€¦ · · 2011-06-08vibration issues for...
TRANSCRIPT

VIBRATION ISSUES FOR SUPERKEKB
M. Masuzawa#, R. Sugahara and H. Yamaoka, KEK, Tsukuba, Japan
Abstract
The KEKB B-Factory [1] will be upgraded to SuperKEKB [2] using the same tunnel as KEKB. The SuperKEKB design peak luminosity is 40 times higher than the world record luminosity that KEKB has achieved. The upgrade is based on the “nano-Beam” scheme, wherein the beam size is reduced to less than 100 nanometers in the vertical direction at the interaction point (IP). Vibration in the tunnel, especially around the IP, could be a critical issue which may result in luminosity degradation. Vibration measurements made at several locations, including the present KEKB tunnel, the BELLE detector, and the final focus quadruple magnets, will be reported.
INTRODUCTION SuperKEKB is a next-generation B-factory machine
which aims to achieve a peak luminosity a factor of 40 higher than that of KEKB. It will be built utilizing the existing KEKB tunnel and accelerator components as much as possible, to minimize the construction costs and time, as schematically shown in Fig. 1.
Figure 1: SuperKEKB.
The vibration of the KEKB tunnel floor and some
magnets has been measured and reported [3]. It is shown that the vibration amplitude is much smaller than the size of the colliding beams for KEKB. At SuperKEKB however, the luminosity boost is achieved by making the beam size at the IP much smaller and the vibration could be a critical issue. The vertical beam size at the IP is
about 70 nm in the present SuperKEKB design. Some new measurements, including the vibration of the BELLE detector and the final focusing superconducting magnets, have been carried out and evaluated for SuperKEKB.
VIBRATION MEASUREMENTS Servo accelerator sensors, MG-102, made by
Tokkyokiki corp., are used for the vibration measurements [3]. An output of 1 V corresponds to 1 gal with our setup. The frequency range of the sensors is from 0.1 Hz to 400 Hz. The measurement locations are indicated by triangle markers in Fig.2.
Figure 2: Locations of the measurements indicated by riangle markers.
KEKB tunnel floor near the IP
The tunnel is constructed in soil called “Kanto loam,” which is a volcanic ash soil covering the diluvial uplands of the Kanto region, and is known to have a natural vibration frequency of around 3 Hz. Figure 3 is a Power Spectrum Density (PSD) plot of the KEKB tunnel floor close to the IP. A clear 3 Hz peak is seen in the vertical direction. There are peaks at around 0.3 Hz, which are clearer in the horizontal direction than in the vertical direction. This vibration at low frequencies is caused by winds and ocean waves. There are also peaks observed at around 8 Hz and 12 Hz. The vibration at 12 Hz is more dominant in the vertical direction and was also first observed by the beam during KEKB operation some

years ago. The floor vibration amplitude is plotted against frequencies in Fig. 4. The amplitude at 3 Hz is comparable to the SuperKEKB vertical beam size at the IP.
Figure 3: PSD plot of the KEKB tunnel floor vibration near the IP. The red and pink lines correspond to the horizontal directions. The blue line corresponds to the vertical direction.
Figure 4: Integrated amplitude of the KEKB tunnel floor. The pink and blue lines correspond to the horizontal directions. The red line corresponds to the vertical direction.
QC1RE magnet and movable table
Figures 5 and 6 are PSD plots of one of the normal conducting magnet called QC1RE in the Interaction Region (IR) and the movable table on which the IR magnets are placed. The red line corresponds to the direction perpendicular to the KEKB beam line, while the pink line corresponds to the beam direction. The vertical direction is indicated by the blue line. A large peak appears at around 8 Hz in both PSD plots. The
vibration at 8 Hz is larger by about a factor 3 at QC1RE magnet than on the movable table, as seen in Figures 7 and 8, where the integrated amplitudes are plotted for QC1RE and the movable table, respectively. The amplitude of the vertical vibration at QC1RE is about 100 nm, which causes a COD of the vertical beam size at the IP. This indicates that we need to either suppress the vibration or prepare an orbital feedback to maintain a good collision condition at the IP.
Figure 5: PSD of the QC1RE magnet. The red and pink lines correspond to the horizontal directions. The blue line corresponds to the vertical direction.
Figure 6: PSD of the movable table. The red and pink lines correspond to the horizontal directions. The blue line corresponds to the vertical direction.

Figure 7: Integrated amplitude of the QC1RE magnet. The pink and blue lines correspond to the horizontal directions. The red line corresponds to the vertical direction.
Figure 8: Integrated amplitude of the movable. The pink and blue lines correspond to the horizontal directions. The red line corresponds to the vertical direction.
QCS CRYOSTAT SUPPORT The final focusing superconducting quadrupole
magnets (QCS) is contained in a cryostat, which is attached to a support (nicknamed the “QCS boat,” due to its shape) as shown in Fig. 9. The cryostats are supported on only on end and the other side, which is closer to the IP, is left free. The photograph was taken when the BELLE detector was rolled out.
The vibration measurements of the QCS boat were carried out in the past under various conditions after the BELLE detector was rolled in. The sensors were placed where the cryostats are attached to the tables as it was not possible to access the “free” side of the cryostats once the BELLE detector was rolled in. The integrated
amplitude data taken in 2003 and 2009 are plotted together in Fig. 10.
Figure 9: QCS cryostats and support tables. Photo taken from the outer side of the KEKB ring. QCS-L and QCS-R stand for QCS-Left and QCS-Right, where right and left is defined when viewed from the inner side of the KEKB ring.
It is shown that the QCS boat also vibrates at 8 Hz in the same direction as QC1RE. These three sets of data were taken during the shutdown periods when all the magnet power supplies were turned off and the BELLE detector solenoid fields were also brought down. The data which were taken in June 2009 show larger vibration even though the characteristic frequencies, at which frequencies it vibrates, are very similar to the other two plots. Therefore we conclude that the vibration at 8 Hz was there at the beginning of the KEKB operation and it probably comes from the design of the cryostat and how it is mounted on the movable table. Some mechanical and structural evaluation of the cryostat is underway, which includes simulation work using ANSYS.
Figure 10: Integrated amplitude of the QCS support obtained at different time and conditions. The red and blue lines correspond to the directions perpendicular and parallel to the beam line, respectively. The black line corresponds to the vertical direction.

SLOW MOTION OF THE CRYOSTATS Although vibration of the cryostats near the IP can not
be measured with BELLE rolled in, we can monitor a slow motion of the cryostats with the displacement sensors. Capacitive sensors were attached on both sides of the cryostat to measure the gap between the BELLE inner detector and the cryostat. As is seen in Fig. 9 there are two cryostats on both sides of the IP and they are not connected to each other. Figures 11 and 12 show the relative motion of the cryostats with respect to the BELLE detector in the horizontal and vertical directions, respectively, for a period of 1 second. The left and right sides are represented in blue and red, respectively. Both QCS-L and QCS-R are moving at around 4 Hz in the horizontal direction in phase. The amplitude of this frequency is as large as 1 µm. This indicates that it is not the cryostat which vibrates at this frequency but the BELLE detector. The vibration measurements on the BELLE detector are carried out and discussed in the following section. The motion in the vertical direction is quite different from that in the horizontal direction. The vibrations are at higher frequencies and not in phase. Figure 13 shows the motion of the cryostats when a small earthquake hit the area. The cryostats vibrated with as large as 15 µm of amplitude in the horizontal direction, resulting in beam loss.
Figure 11: Gap sensor output in the horizontal direction. Both QCS-L and QCS-R are vibrationg at ~4Hz in phase.
Figure 12: Gap sensor output in the vertical direction. Both QCS-L and QCS-R are vibrating at higher frequencies than in the horizontal direction.
Figure 13: The horizontal cryostat motion when an earthquake hit the area. 30 seconds of data are plotted.
MEASUREMENTS ON BELLE
The BELLE detector side view is shown in Fig. 14. The detector measures about 10 m from the floor and weights about 1300 tons. The measurements were carried out at various locations as indicated. There is a vibration peak at ~4 Hz, which is expected from the cryostat measurements. The amplitude of the 4 Hz component becomes larger when going up from the floor. This indicates that the axis of vibration is near the floor. Because the detector needs to be rolled in and out easily and smoothly, it is placed on rails, as shown in Fig. 15. Fig. 16 shows the vibration amplitude measured at various locations near and on the BELLE detector. A stronger and firmer supporting scheme to the table may be needed to reduce the BELLE vibration. Further study is on-going.

Figure 14: The BELLE detector side view. The detector is placed on the table shown in Fig. 15.
Figure 15: Rail for rolling the BELLE detector in and out.
Figure 16: Integrated amplitudes at various locations around the BELLE detector.
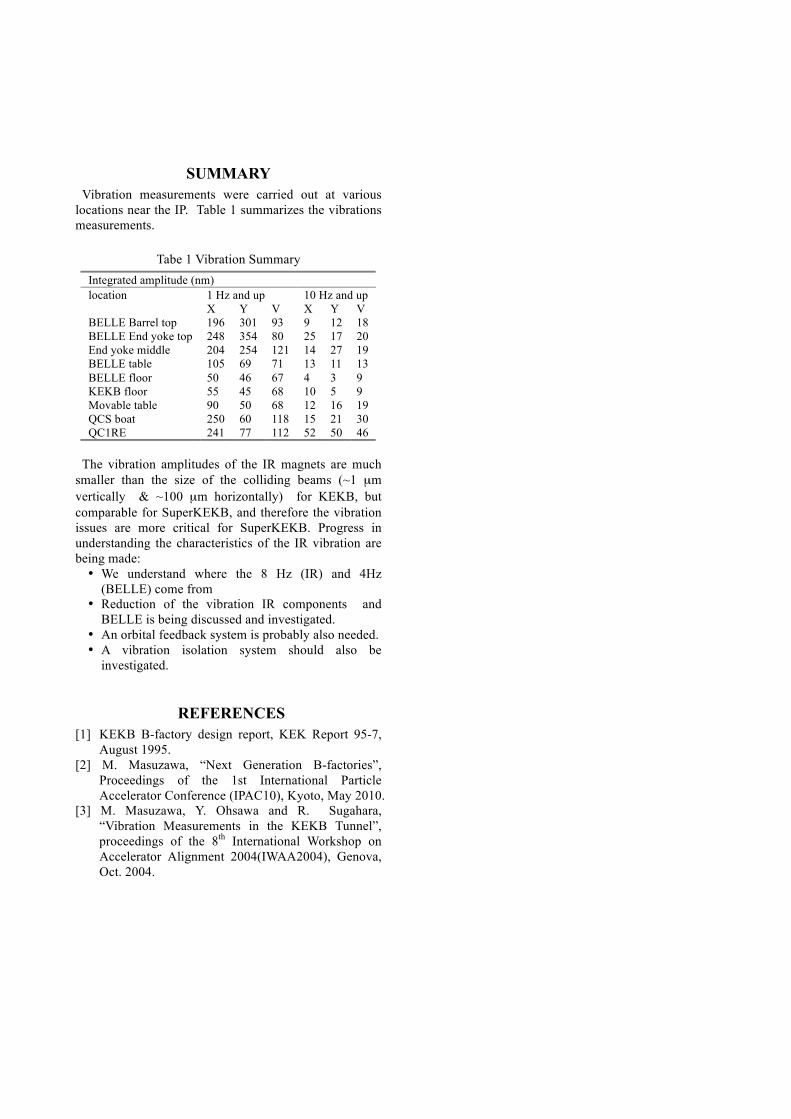
SUMMARY Vibration measurements were carried out at various
locations near the IP. Table 1 summarizes the vibrations measurements.
Tabe 1 Vibration Summary
Integrated amplitude (nm) 1 Hz and up 10 Hz and up location X Y V X Y V
BELLE Barrel top 196 301 93 9 12 18 BELLE End yoke top 248 354 80 25 17 20 End yoke middle 204 254 121 14 27 19 BELLE table 105 69 71 13 11 13 BELLE floor 50 46 67 4 3 9 KEKB floor 55 45 68 10 5 9 Movable table 90 50 68 12 16 19 QCS boat 250 60 118 15 21 30 QC1RE 241 77 112 52 50 46
The vibration amplitudes of the IR magnets are much
smaller than the size of the colliding beams (~1 µm vertically & ~100 µm horizontally) for KEKB, but comparable for SuperKEKB, and therefore the vibration issues are more critical for SuperKEKB. Progress in understanding the characteristics of the IR vibration are being made:
• We understand where the 8 Hz (IR) and 4Hz (BELLE) come from
• Reduction of the vibration IR components and BELLE is being discussed and investigated.
• An orbital feedback system is probably also needed. • A vibration isolation system should also be
investigated.
REFERENCES [1] KEKB B-factory design report, KEK Report 95-7,
August 1995. [2] M. Masuzawa, “Next Generation B-factories”,
Proceedings of the 1st International Particle Accelerator Conference (IPAC10), Kyoto, May 2010.
[3] M. Masuzawa, Y. Ohsawa and R. Sugahara, “Vibration Measurements in the KEKB Tunnel”, proceedings of the 8th International Workshop on Accelerator Alignment 2004(IWAA2004), Genova, Oct. 2004.