vibration analysis and diagnostic techniques, with
TRANSCRIPT

VIBRATION ANALYSIS AND DIAGNOSTIC TECHNIQUES, with reference to
the implementation of a vibration condition monitoring programme.
P. P, DUCCI
A dissertation submitted to the Faculty of EngineerIns, University of the
Witwatersrand, Johannesburg in fulfilment of the requirements for the
Degree of Master of Scionce in Engineering.
JOHANNESBURG 1907
Volume 1

(i)
DECLARATION
I hereby certify that this dissertation is my own work and has not been
submitted for a Masters degree to any other University.
P.P. DUCCI
9
(ii)
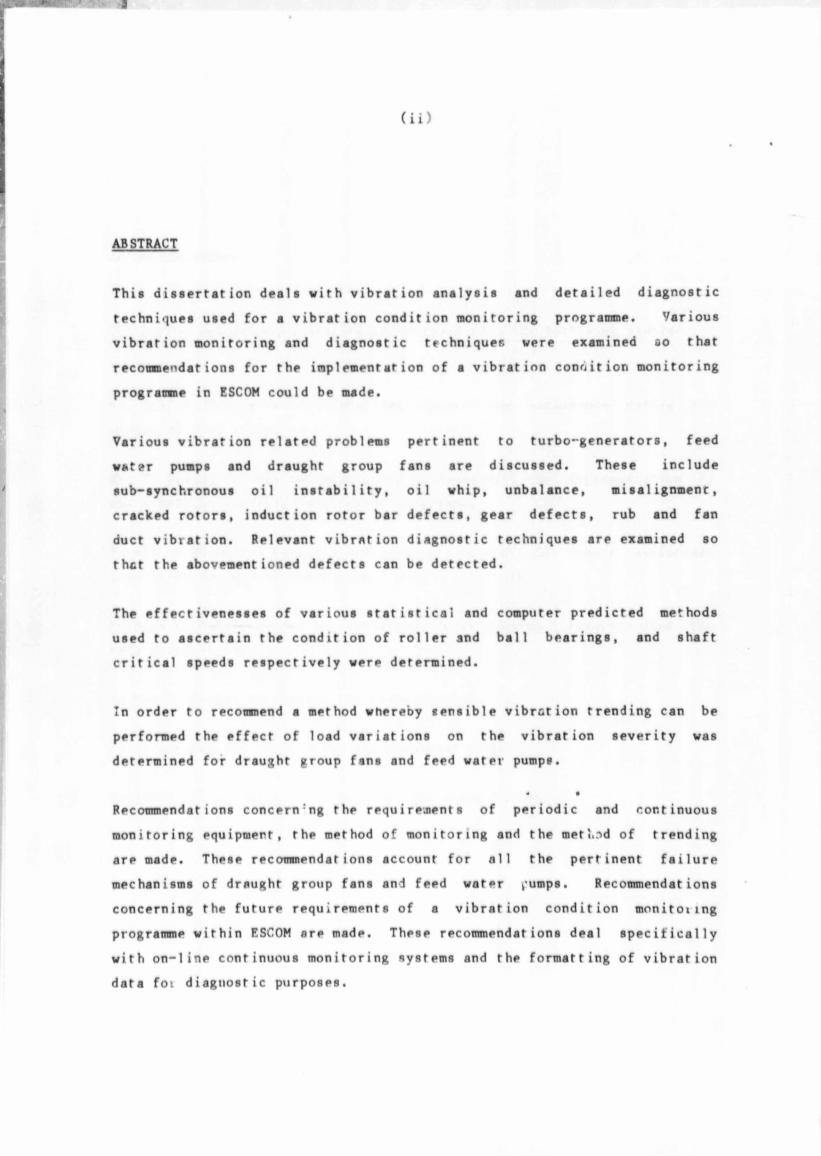
ABSTRACT
This dissertation deals with vibration analysis and detailed diagnostic
techniques used for a vibration condition monitoring programme. Various
vibration monitoring and diagnostic techniquee were examined 00 that
recommendations for the implementation of a vibration condition monitoring
programne in ESCOM could be made.
Various vibration related problems pertinent to turbo-generators, feed
voter pumps and draught group fans are discussed. These include
sub-synchronous oil instability, oil whip, unbalance, misalignment,
cracked rotors, induction rotor bar defects, gear defects, rub and fan
duct vibration. Relevant vibration diagnostic techniques are examined so
thct the abovementioned defects can be detected.
The effectivenesses of various statistical and computer predicted methods
used to ascertain the condition of roller and ball bearings, and shaft
critical speeds respectively were determined.
In order to recotranend a method whereby sensible vibration trending can be
performed the effect of load variations on the vibration severity was
determined for draught group fans and feed water pumps.
« •
Recommendations concern'ng the requ i reoient s of periodic and continuous
monitoring equipmert, the method of monitoring and the metiod of trending
are made. These recommendations account for all the pertinent failure
mechanisms of draught group fans and feed water i*umps. Recommendations
concerning the future requirements of a vibration condition mnnitoiing
programme within ESCOM are made. These recommendations deal specifically
with on-line continuous monitoring systems and the formatting of vibration
data fot diagnostic purposes.

(i i i >
ACKNOWLEDGEMENTS
The author acknowledges assistance received from the following people:
Mr. R.A. Backeberg for hi# unfailing support and assistance during the
course of this study.
✓
Mr. S. Franco for his assistance and guidance with the implementation of
thk vibration condition monitoring programme.
To all of Escom's Dynamics a Noise members of staff for their assistance
especially during the experimental data acquisition.
To Miss M. Candiotes for her assistance in retrieving literature used for
this dissertation.
To Mrs M. Kruger for typing the dissertation.
To my parents for their moral and financial support.
To ESCOM for allowing me to publish this dissertation.

(iv)
CONTENTS
Page
DECLARATION (i)
ABSTRACT (ii)
ACKNOWLEDGEMENTS (iii)
CONTENTS (iv)
LIST OF NOTATION
1. INTRODUCTION 1
1.1 BACKGROUND 1
1.2 LITERATURE REVIEV <
1.2.1 Vibration Condition Monitoring 6
1.2.2 Vibration Measurement Standards 70
1.2.3 Economic Aspects of a Vibration
Condition Monitoring Prograimne 20
1.3 PURPOSE 23
2. PRESENT STATUS OF VIBRATION CONDITION MONITORING IN ESCOM 2U
2.1 MAINTENANCE CONCEPTS
2.1.1 Breakdown Maintenance
2.1.2 Preventive Maintenance
2.1.3 Condition Based Maintenance
2.2 ESCOM's PRESENT MAINTENANCE STRATEGY
2.2.1 Vibration Condition Monitoring
2.3 BENEFITS OF A VIBRATION CONDITION MONITORING
PROGRAMME - SUMMARY
(
2 U
2 U
2U
25
27
27
30

31
31
32
32
33
34
3U
35
36
36
37
37
37
38
39
UO
UO
uo
44
47
4 8
51
51
53
54
57
59
(v)
TRANSDUCER SELECTION
3.1 A"C ELE ROMEVEtf S
3.1.1 Advantages of Accel urometers
3.1.2 Disadvantages of Accel prompters
3.2 VELOCITY TRANDDUCERS
3.2.1 Advantages of Velocity Transducers
3.2.2 Disadvantages of Velocity Transducers
3.3 DISPLACEMENT TRANSDUCERS OR PROXIMITY PROBES
3.3.1 Advantages of Proximity Probes
3.3.2 Disadvantages of Proximity Probes
3.4 SHAFT RIDERS
3.4.1 Advantages of Shaft Riders
3.4.2 Disadvantages of Shaft Riders
3.5 DUAL PROBES
3.5.1 Advantages of Dual Probes
, 3.5.2 Disadvantages of Dual Probes
MODULE 1
DETECTION OF ROLLING ELEMENT BEARING
DAMAGE BY STATISTICAL VIBRATION ANALYSIS
4.1 INTRODUCTION AND THEORY
4.1.1 Literature Review of Rolling Element
Bearing Vibration*Hea1th Monitoring
4.2 OBJECT
4.3 APPARATUS
4.4 EXPERIMENTAL PROCEDURE
4.4.1 Data Acquisition
4.4.2 Data Processing
4.5 OBSERVATIONS AND RESULTS
4.6 DISCUSSION
4.7 CONCLUSIONS
(vi)
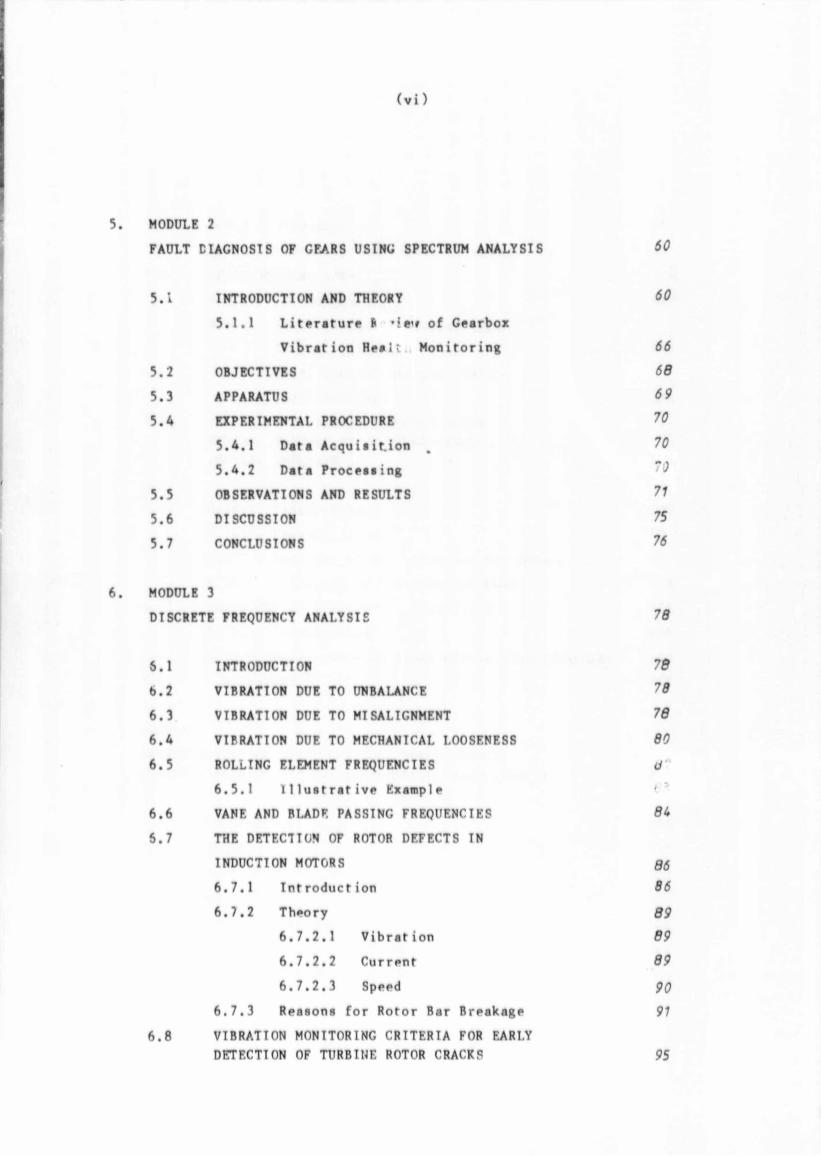
5. MODULE 2
FAULT DIAGNOSIS OF GEARS USING SPECTRUM ANALYSIS 60
5.1 INTRODUCTION AND THEORY 60
5.1.1 Literature B •!*'# of Gearbox
Vibration Healt Monitoring 66
5.2 OBJECTIVES 68
5.3 APPARATUS 6 9
5.4 EXPERIMENTAL PROCEDURE 70
5.4.1 Data Acquisition . 70
5.4.2 Data Processing '
5.5 OBSERVATIONS AND RESULTS 71
5.6 DISCUSSION 75
5.7 CONCLUSIONS 76
6 . MODULE 3
DISCRETE FREQUENCY ANALYSIS 78
6.1 INTRODUCTION 78
6.2 VIBRATION DUE TO UNBALANCE 78
6.3 VIBRATION DUE TO MISALIGNMENT 78
6.4 VIBRATION DUE TO MECHANICAL LOOSENESS 80
6.5 ROLLING ELEMENT FREQUENCIES d
6.5.1 Illustrative Example <?*
6.6 VANE AND BLADE PASSING FREQUENCIES 8U
6.7 THE DETECTION OF ROTOR DEFECTS IN
INDUCTION MOTORS B6
6.7.1 Introduction 86
6.7.2 Theory 89
6.7.2.1 Vibration 89
6 .7.2.2 Current 89
6 .7.2.3 Speed 90
6.7.3 Reasons for Rotor Bar Breakage 91
6.8 VIBRATION MONITORING CRITERIA FOR EARLY
DETECTION OF TURBINE ROTOR CRACKS 95

(vi i)
6.8.1 Introduction
6.8.2 Vibration Monitoring Criteria 95
6.9 SHAFT ORBITAL ANALYSIS 100
6.9.1 Introduction 100
6.9.2 Shaft Orbital Analysis Daing
Steady State Data 102
6.9.3 Shaft Orbital Analysis Using
Transient Data 107
6.10 DIAGNOSIS OF SUB-SYNCHRONOUS ROTOR
DYNAMIC INSTABILITIES USING SHAFT
ORBITAL ANALYSIS HI
6.10.1 Introduction 111
6.10.2 Theory 777
6.10.3 Symptoms of Oil Whirl and Oil Whip
6.10.4 Diagnosis of Oil Whil end Whip 123
6.11 SHAFT CENTRE LINE POSITION ANALYSIS 126
6.11.1 Introduction 126
6.11.2 Measurement of Shaft Centre Line Position 726
6.12 CONCLUSIONS 132
7. MODULE 4
DETERMINATION OF SHAFT CRITICAL SPFE"*: USING
COMPUTER PREDICTIONS AND EXPERIMENTAL MEASUREMENTS 13 L
7.1 INTRODUCTION 134
7.2 THEORY 136
7.3 OBJECTIVES 142
7.4 APPARATUS 1^3
7.4.1 Experimental Measurements 143
7.4.2 Computer Predictions 744
7.4.3 Details of Fan Impellers 144

(vi i i)
7.5 EXPERIMENTAL TECHNIQUES 746
7.5.1 Data Acquisition
7.5.2 Data Analysis 747
7.5.3 Technique used for Computer Prediction 757
7.5.4 Data for Idealised PA Rotor System 75^
T.5.5 Data for Idealised FD Rotor System 153
7.6 RESULTS 159
7.6.1 Experimental Results 1S9
7.6.2 Computer Predicted Results 770
7.6.3 Computer Predicted Mode Shapes for
the PA and FD Fan Rotors 776
7.7 DISCUSSION 179
7.7.1 Experimental Identification of 770
Critical Speeds
7.7.2 Computer Predicted Shaft Critical Speeds 181
7.8 CONCLUSIONS 704 *
8 . MODULE 5
THE EFFECT OF VARIATIONS IN LOAD OH THF ’’13RATION SEVERITY
FOR DRAUGHT GROUP FANS, ELECTRIC AND S' s WATER PUMPS 705
8.1 INTRODUCTION 185
8.2 OBJECTIVES 193
8.3 DESCRIPTION OF .".QU TPM ENT AND APPARATUS 193
8.3.1 Equipment used for the Draught Gi,up
Fan Tests 193
8.3.2 Equipment used for the Electric and
Steam Feedwater Pump Tents 1V)
8.3.3 Details of Fans and Feed Pumps 794
8.4 EXPERIMENTAL PROCEDURE 196
8.4.1 Data Acquisition for the
Draught Group Fans 196
8.4.2 Data Analysis for the Draught
Group Fans 196

(ix)
8 .A.3 D*f« Acquisition for the Electric
and Steam Feedvater Pumpa 198
8 .4.A Data Analysis for the Electric
and Steam Feedvater Pumpr 202
8.5 RESULTS 203
8.5.1 Draught Group Fans 203
8.5.' Electric and Steam Feedvater Pumps 203
8.6 DISCUSSION 223
8.6.1 Operating Conditions of the Draught
Group Fans and Feedvater Pumps
8.6.2 Trending of Vibration Data for the
Draught Group Fans 225
8.6.3 Trending of Vibration Data for
Boiler Feed Pumps 226
8 .6 .A Failure Mechanisms Pertinent to
Large Boiler Feedpumps 227
4.1 Unbalance 227
.4.2 Worn Mechanical Seals 227
8.0.4.3 Misalignment hetveen Mot>r
and Pump 229
8 .6 .4.4 Bearing Pedestal >»>>lonences 229
8.6.4.5 Worn Tmpell«*rs an- Jhafts 230
8 .6 .4.6 The Electric Motiv at. t
Booster Pu^p 230
8 .6 .4.7 Survey of Feed P\ • Hi'ages 231
8 .6 .4.8 The Voith Grarbo 232
8.6.5 Failure Mechanisms Pert inf'. l raught
Group Fans 232
8.6.5.1 Impeller and Blale Vuilures 233
8 .6 .5.2 Fan Induced Duct Vibration 23b
8 .0.6 Load Contours for PA Fans 236
8.6.7 Load Contours for the ID Fans 239
0.6.8 Load Contours for the FD Fans 239
8.6.9 Load Contours for the Steam Feed Pump 239
8.6.10 Load Contours for the Electric Feed Pumps 2'*0

(x)
8.7 GENLIIAL MSCUS S I O N 2U2
8.8 CONCLUSIONS 252
MODULE 6
OTHER IMPORTANT ASPECTS OF A VIBRATION CONDITION
MONITORING PROGRAMME 25U
9.1 TRAINING FOR VIBRATION CONDITIONS BASED MAINTENANCE 25U
9.1.1 Selection of Personnel 25U
9.1.2 Training 256
9.2 CONTINUOUS VERSUS PERIODIC MONITORING 257
9.2.1 Continuous Monitoring 258
9.2.2 Periodic Monitoring 2S9
9.2.3 Trending of Vibration Data 26U
9.2.4 Overall Level Monitoring 265
9.2.4.1 Advantages of Overall
Level Monitoring 266
?.2.4.2 Disadvantes of Overall
Level Monitoring 267
9.2.5 Bandwidth RMS Treading 267
9.2.6 Setting Alarm and Trip Leve'a for
Discrete Frequencies 270
9.2.7 Spectrum Cascade Trending 271
9.2.8 Phase Trending 27U
9.3 MANUAL AND COMPUTERISED LOGGING 27L
9.3.1 Manual Data Logging 27U
9.3.2 Computerised Data Logging 276
9.4 CONSIDERATIONS CONCERNING THE PURCHASING
OF PERIODIC VIBRATION MONITORING EQUIPMENT
FOR RECENTLY COMMISSIONED AND FUTURE ESCOM
POWER STATIONS 278
9.4.1 Introduction 278
9.4.2 Softva*e 279
9.4.3 Software Reouirements 280

(xi)
9.A.4 Requ i rement» Concerning the Supplier
of the Periodic Vibration Monitoring
Equipment
9.4.5 Syjff.n Feqi’iremef.ts for Periodic
Vibration Monitoring Equipment
9.5 CONSIDERATIONS CONCERNING THE PURCHASING
OF CONTINUOUS ON-LINE VIBRATION MONITORING
EQUIPMENT
9.5.1 Strip Chart Recorders
9.5.2 Dedicated Indicators
9.5.3 Computerised Real-Time Systems
9.5.4 Requirements of a Computerised
Real-Time System
9.5.5 Requirements for ,«•]! On-Line
Continuous Systems
9.6 STANDARDISED RULES FOR MEASUREMENT ON
ROTATING MACHINERY
10. DISCUSSION
10.1 WHY IMPLEMENT A VIBRATION CONDITION
MONITORING PROGRAMME?
10.2 WHO WILL BE RESPONSIBLE FOR THE VCM PROGRAMME?
10.2.1 Si ze of PI ant
10.2.2 Criticality of the Machine to the
Production or Assemble Line
10.2.3 Number of Machines to be Included
into the Programme
10.2.4 Sophistication of f he Vibration Monitoring Equipment Purchabed
10.2.5 Whether Continuous On-Line
Monitoring or Periodic Monitoring
has been chosen
10.2.6 Sophistication of the Actual Machinery
to he Monitored
281
281
285
286
287
288
289
290
301
301
302
303
304
305
305
306
307
280
(xii)
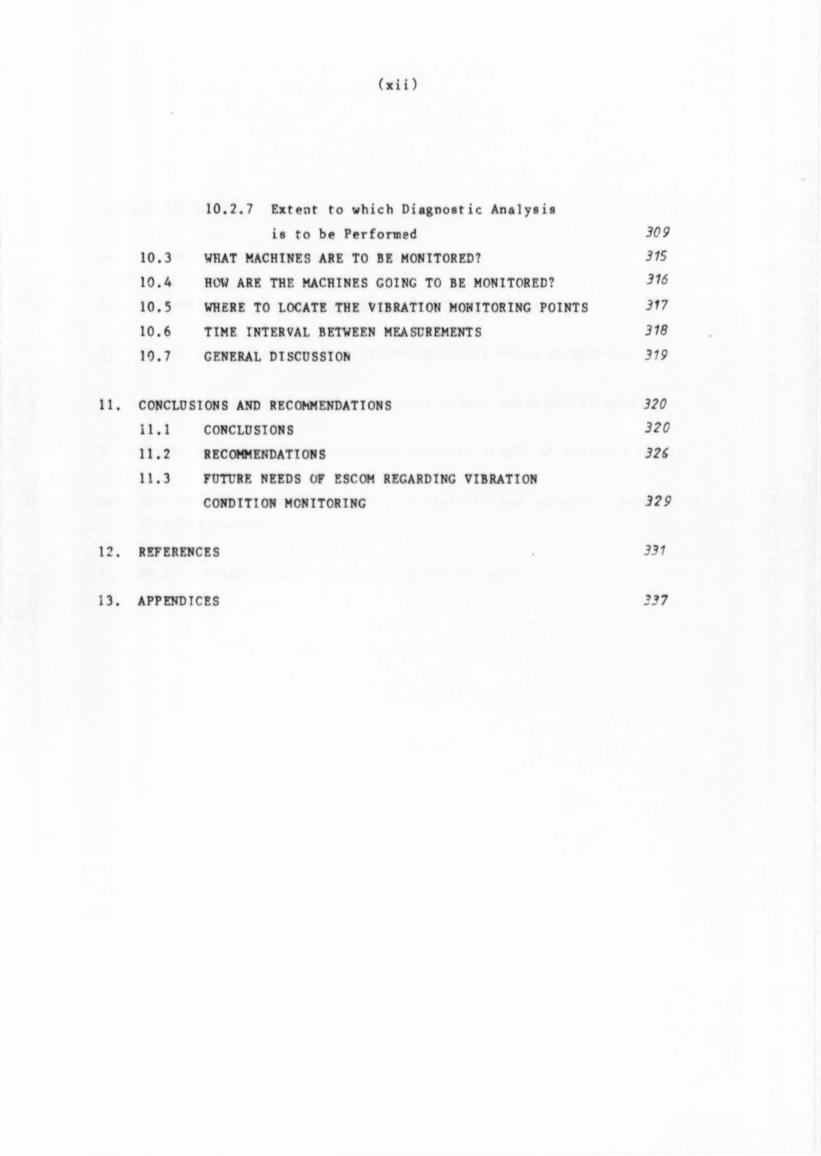
10.2.7 Exrent to which Diagnostic Analysis
is to be Performed 309
10.3 WRAT MACHINES ARE TO BE MONITORED? 315
10.4 HOW ARE THE MACHINES GOING TO BE MONITORED? 316
10.5 WHERE TO LOCATE THE VIBRATION MONITORING POINTS 317
10.6 TIME INTERVAL BETWEEN MEASUREMENTS 318
10.7 GENERAL DISCUSSION 319
11. CONCLUSIONS AND RECOMMENDATIONS 320
11.1 CONCLUSIONS 320
11.2 RECOMMENDATIONS 326
11.3 FUTURE NEEDS OP ESCOM REGARDING VIBRATION
CONDITION MONITORING 329
12. REFERENCES 331
13. APPENDICES 337

(xi i i)
LIST OF APPENDICES
1. Computor listing of Kurtosis Programme.
2. Derivation of the Computer Simulated Shaft Orbits.
3. Calculation of the Shaft Attitude and Shaft Movement Vector.
4. Interpretation of Bod? plots using a simple mathematical model.
5. The Prohl method for calculating critical speeds of flexible rotors.
6 . The transfer mirrix method for calculating critical speeds of
flexible rotors.
7. Shaft critical sample calculations for FD rotor.

(x i v )
LIST OF NOTATION
SYMBOL DEFINITION
RMS Velocity Root Mean Square Velocity
F Force
m maaa
X accelerat ion
c coefficient of damping
X velocity
k at iffneaa
X diaplacement
Hz Frequency
P(x) Probability denaity function
*1
Skevneaa
b2 Kurtoaia
R Gear I at io
TgNumbet of gear teeth
TpNumber of pinion teeth
FpPinion rotation frequency
FgGear rotation frequency
Fm
Meah frequency
FgHunting tooth frequency
F.
Assembly phase paaaage frequency
ViNumber of vanea on impeller
D Pitch diameter
d Ball diameter
n Number of balla in a bearing
0
angle of contact
r8
Supply current
p
Numbpr of poles
NDE Non Drive-End
DE Dr ive-End

(xv)
SYMBOL
g
H
0
L
E
I
DEFINITION
Acceleration of gravity
Angular Mom<*nt,,.m
Slope
Lengt h
voungs Modulus
Moment of inertia, moirent of area

1
1.1 BACKGROUND
Vibration analysis has been used to determine the mechanical
condition of machinery for at least forty to fifty v-' rs. In
the simplest case the plant engineer relied on his sen^e of
touch and sound to determine the mechanical condition of slow
and robust machinery.
World War I and II produced the need for increased
reliability of weapons. A profusion of gauges and
instruments was introduced during production to make it
possible to measure accurately. The art of e gonomic*
started at that timo. At the time of the Korean War the
array of instruments became so confusing that comparators
were introduced as a simplification. Operators no longer
needed to measure absolute dimensions. Instead the terms
"on-or-off", "high-or-low" were adequate.
Highly complex aero-space systems, guided missiles and eaily
warning systems introduced during the mid 1950's increased
the urgent need for high reliability and surveillance means
of checking this reliability, while the number of components,
assemblies, sub-systems and systems greatly increased.
Simplified data comparators were replaced by high-speed
electric multiple-point scanning systems capable of making
rapid measurements and comparisons automatically. Results
were processed and presented in a format which established
the "signature" of the healthy machine for purposes of
comparison at a later stage of deterioration.
1. INTRODUCTION

2
Modern sophisticated monitoring systems have developed from
these beginnings. They have their own self-integrity test
systems by which their own fault detection or interrogation
signals can be injected to verify the "health" of the monitor
itself. It is only during the last decade that the full
potential of these facilities for monitoring the "health" or
"condition" of a machine has been properly appreciated. With
the growing complexity of machinery, the increasing
operational stresses, the lowering of safety thresholds and
the decline in craft skills, these monitoring techniques have
become essential.
A distinction between condition monitoring and vibration
condition monitoring has to be made. Condition monitoring
embraced all forms of parametric monitoring such as pressure,
temperature, flovrate, vibration etc. Vibration condition
monitoring deals specifically with the monitoring of a
machine's vibration characteristics. This report deals
specifically with vibration condition monitoring and the
various techniques used to diagnose vibration related
problems. It is impossible to monitor the mechanical
integrity of a machine conclusively by using only vibration
condition monitoring. It is generally believed that
vibration monitoring is the most informative as far as the
mechanical condition of the machine is concerned.
Vibration condition monitoring has developed from a skill
into a science. The days of plant attendants with oily ra^s
and grease guns tending their machines are gone. The
intimate relationship between man and machine is no longer
economically feasible and not even required because machines
are expected to run automatically with only occasijnal
attention from maintenance personnel. Modern machines a^e

3
getting bigger and are running at higher speeds then ever
before. Vibrations from these machines occur at such high
frequencies that sophisticated instruments are needed to
detect and measure them.
ESCOM used to pursue a policy of constructing power stations
consisting of numeious units of small power capacity.
Examples are Vaal Power Station, 18 units of 15 MW each and
Vierfontein Power Station, 19 units of 17,6 MW each. Nowadays
large power stations like Koeberg and Duvha, consisting of 2
units of 965 MW each and 6 units of 600 MW each respectively
have emerged. The advantage of the former policy is that if
a unit is unexpectedly lost it would not significantly
influence the national supply grid. The disadvantage of such
a system is that it is uneconomical due to the construction
of a large number of small capacity units. On the other hand
the latter policy is economical in terms of construction, but
if a large 600 MW or 965 MW unit is unexpectedly lost, it
will have a significant influence on the national supply
grid. The replacement costs for such a unit are substantial
especially if gas-turbine plant and pump storage capacity is
used to meet the demand for electricity. It is obvious
therefore, that the availability of these large units must be
high to keep replacement costs to a minimum. One of the best
methods to improve availability is to implement a condition
monitoring programme.
Power stations like Tutuka will be used as peak load
stations. They will only contribute to the national grid
during peak demand for electricity. It is therefore vitally
important that when a power station like this is requested to
contr.uute to the national grid it can do so without any
delays. It's availability during peak demand has to be high,
and this can be achieved by a condition based mcintenance
progrf.mmp.

A
Sadler (1) uses the example of British Steel Corporation
(BSC) to illustrate the economics of increased availability.
The cost of maintenance in one of the B.S.C's large
integrated steel works in 1979/80 was £90 million and the
numbers employed in maintenance, including staff, was 7400.
Maintenance accounted for some 15Z to 30Z of the total
conversion cost in a particular process. It has been quoted
by Sadler that in general a 4Z increase in availability of
B.S.C. plants would be worth about £45 000 million per year.
ESCOM's new generation power stations have turfci-alternator
sets which are among the largest in the world. For example,
Matimba rated at 665 MW, Majuba rated «t 657 MW already
exist. Fendal rated at 665 MW will be the world's largest
indirect dry cooled coal-fired pcv«r station once completed.
It is of paramount importance that adequate vibration
monitoring equipment be installed on these large sets to
minimise the possibility of catastrophic failure.
In practice all generating units are constrained by
compulsory statutory inspections of the boiler and reactor.
Even with this constraint it is possible to minimise the
outage time. This can be achieved by correcting faults on
machines only as indicared by the vibration characteristics
and not by routinely dismantling and checking for faults.
This unnecessary "opening up to inspect" often does more harm
than good as when ladders are left in boilers, spanners are
left in sumps, or parts are incorrectly re-assembled. Often
this approach is referred to as disturbance maintenance. The
life cycle of a machine, follows the well known bath-tub
curve, where the x-axis represents time and the y-axis, the
probability of failure. This is illustrated in Figure 1.1.
When a machine comes off the production line (Time 0) there
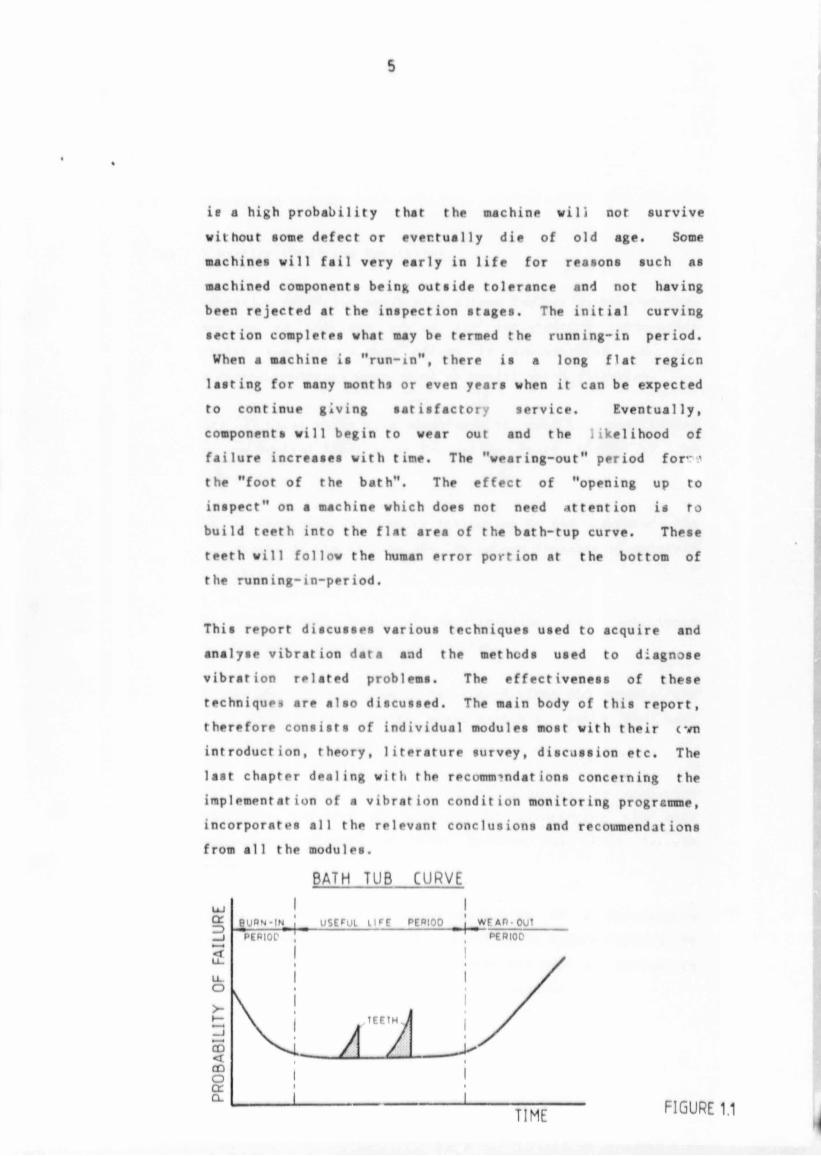
5
ie a high probability that the machine wili not survive
without some defect or eventually die of old age. Some
machines will fail very early in life for reasons such as
machined components being outside tolerance and not having
been rejected at the inspection stages. The initial curving
section completes what may be termed the running-in period.
When a machine is "run-in", there is a long flat region
lasting for many months or even years when it can be expected
to continue giving satisfactory service. Eventually,
components will begin to wear out and the likelihood of
failure increases with time. The "wearing-out" period for’*’
the "foot of the bath". The effect of "opening up to
inspect" on a machine which does not need attention is to
build teeth into the flat area of the bath-tup curve. These
teeth will follow the human error portion at the bottom of
the running-in-period.
This report discusses various techniques used to acquire and
analyse vibration data and the methods used to diagnose
vibration related problems. The effectiveness of these
techniques are also discussed. The main body of this report,
therefore consists of individual modules most with their cvn
introduction, theory, literature survey, discussion etc. The
last chapter dealing with the recommendations concerning the
implementation of a vibration condition monitoring programme,
incorporates all the relevant conclusions and recommendations
from all the modules.
BATH TUB CURVE
UJ
_ j pebTo t ,U S i m i I I T F PER IO D w f a p - o u t
PERIOD
<r
a -o txCl
FIGURE 1.1TIME

6
1.2 LITERATURE REVIEW
1.2.1 Vibration Condition Monitoring
Vibration condition monitoring allows the better-than-average
machine to continue giving its satisfactory performance
whilst the maintenance effort is concentrated on the
worse-than-average machine which merits extra attention.
Low (2) cites three main advantages of condition monitoring
in the Central Electricity Generating Board (CEGB) of the
U.K., vit:
1) To keep plant running by indicating to the operator the
health of the machine and the action r#quired ro maintain
*
this. ,
2) To indicate areas of deterioration and anticipate
necesoary maintenance activities.
3) To provide knowledge of fault conditions and enable the
machine to be operated, where possible, until the most
convenient outage.
Low also states that a rational approach to condition
monitoring can only he achieved by identifying the most
expensive categories of plant failure and their failure
modes.
Corben (3) describes vibration monitoring as a maintenance
technique which permits a deterioration in machine health to
be detected at an early stage without t». machine having to
be stripped down or even taken out of service.

7
Kerfoot, R.E. et al (A) augfeerts a three-tiered approach to a
vibration condition monitorJig programme
LEVEL 1
A complete listing of all possible frequencies at which
vibration could exist should be compiled and kej't with the
machine's characteristics. Such a listing should include
informaticn 1i k e : —
a) running speeds
b) types of bearings
c) number of elements and size
d) gear mesh frequencies
e) speeds of accessary components
f) information about structural resonances or critical
frequenc ies.
LEVEL 2
The spectrum of a signal from a vibration transducer produced
by a running machine can be used as the "signature" or
"fingerprint" of that particular machine's operational
condition. Gradual changes in the machine condition can be
seen as changes in the signature.
LEVEL 3 : The missing link
The major problem in interpreting data, which is taken at
different times on the same machine, is that each of the
frequency spectra must somehow be normalised to some typical
operating condition so that they may be directly compared.
Tn order to give the best insight into how to correct the

vibrations caused by rotating machinery, the transfer
functions relating structural tesponse to known inputs must
be determined.
Downhatn and Woods (5) rrmaik I oat it is important tu obtain
some knowledge of the response of a machine to part!cul«r
dynamir forces. This knowledge can be most conveniently
obtained, for bearing housing measurements, from a
measurement of bearing house impedances at the monitoring
points. This would enable the level of dynamic force to be
computed directly from a measurement of vibration level under
running conditions and, thus, help considerably in qualifying
the relative severity of machine vibrations.
..ccording to Battlebury (6 ) the first step in reducing the
length of maintenance outages is for the maintenance and
planning engineers to be fully familiar with the current
fctate of the plant. In practice the plant history system is
often inadequate. All too often plant is removed from the
systeu without its current state being known, because the
relevant maintenance documentation says that machines must be
removed from the system for routine maintenance. To build a
plant state data bank requires close dialogue between the
plant and planning engineer.
In a report published by Michael Neale and Associates (7),
the potential of condition base<! maintenance for certain
industries is discussed. Figure 1.2 is obtained by comparing
added value output per establishment with capital invested in
plant and machinery per employee. A high va.ue for both
these factors indicates a favourable application for
condition monitoring. Notice how favourable "Electricity" is
on the guide.

UJ
(_)
•<
z
cn
-c
m
§
x
»
z
*—•
cn
UJ
oc
m
►—<
s
&
z
o
►—1
I—
<_) U J —I
LU
to
UJXt—
o
U JQ
£
C/1<
X.
CD 05
J L
r-«0
0 ■P r~*
> 0 0
1 D
cn •• cn ~U
c L-r«
•f*0 > cn
"0 <4- or-t
0
c
0
•#*
c
•r-»
L
CL
® 09 09
0-
0
L
{.
E
0
"O
c
0 cnr-
CJ
• O
Q-
r)
CS3
N0 niIH3 lN3HHSnevlS3 ipdino C3G0V IVflNNV 3CVy3AV
AVERAGE
ANNUAL
CAPITAL
INVESTED
IN
PLANT
AND
MACHINERY
PER
EMPLOYEE SL THOUSAND
(JANUARY
1975
VALUE)

10
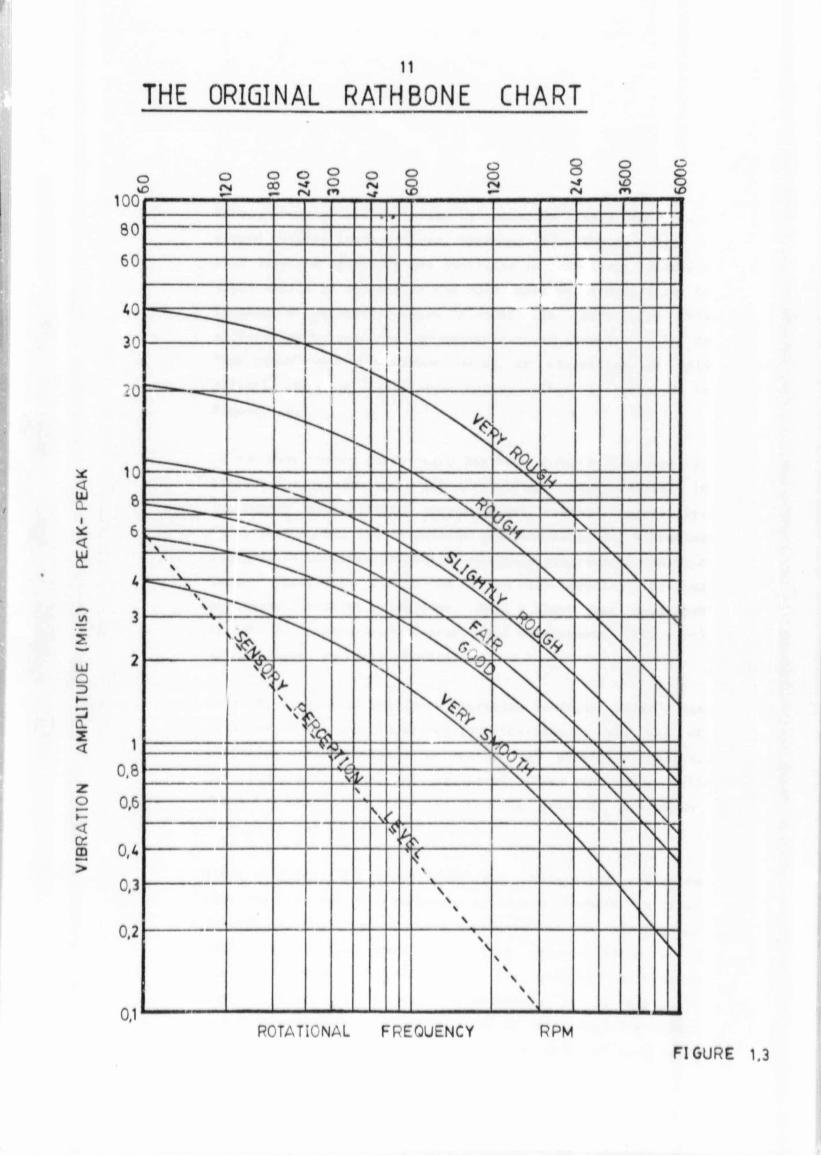
1.2.2 Vibration Measurement Standards
Operational criteria representing vibration boundary levels
for satisfactory or unsatisfactory running conditions are
many and varied. Of the more widely quoted criteria, those
of Rathbone, Yates, and V.D.l. 2056 are worthy of mention
with particular regard to the way in which these and other
criteria t».?re obtained.
Interestingly, it was the insurance industry whose business
depends upon correctly assessing the mechanical condition of
machinery it iosures that was among the first to point out
the value of vibration analysis. Mr. T.C. Rathbone, Chief
Engineer, Turbine and Machinery Division, Fidelity and
Casualty Company of New York, in 1939 published an article
(8 ) presenting vibration guidelines against which machinery
vibration could be compared to determine its condition. The
original Rathbone Chart, as it has become known, is shown in
Figure 1.3. The asseesment of acceptability was obtained by
subjective opinions of several practical engineers and
inspectors, followed by vibration level measurements with
relatively crude instruments. Rathbone limited his
assessments to machinery running at speeds less than 6 000
RPM and considered it reasonable to extrapolate his curves
for higher rotational speeds. He was also conscious of the
fact that the measurement of bearing levels only, would not
necessarily produce valid criteria for all machines.
^Variations of 25 percent or more either way can be exoected
in individual cases. With proper recognition of the various
influencing factors described the chart should furnish a
reasonable guide foi estimating the severity of vibration"
(8 ).
1008 0
60
40
30
20
1086
4
3
2
10.8
0,6
0,4
0,3
0,2
0,1
120
ORIGINAL RATHBONE CHART11
ROTATIONAL F R E Q U E N C Y R P M

12
Yates, produced his criterion by uumerous tests on war.'ne
geared turbine installations, Rathbone (8 ). The fact that in
this case the machinery was installed in relatively flexible
steel shells as opposed to the more massive foundations of
Rathbone's machines, would account in part for the
differences between the two criteria. For example, at 22 Hz
"too rough" on the Rathbone curve is classified as only
siightly rou gh on the Yates curve. This illustrated in
Figure 1.4.
In the past twenty years there has been a rapio increase in
electronics technology with resulting improvements in
instrument portability, accuracy and overall capability.
This, in turn has led to greatly expanded usage of vibration
analysis in industry preventive analysi* programmes, and much
larger experience factor on which to develop revised
machinery vibration guidelines. Such a chart was developed
in 1964 by International Research and Development (IRD) (9)
and vas based on users experience.
This chart "General Machinery Vibration Severity Guide" has
b >n one of the most important contributions to the use of
vibration measurements as a monitor of machinery health,
covering a wide range of equipment size and type. All
foregoing standards refer to bearing pedestal vibration.
This chart can be seen in Figure 1.5.
About this time, two troublesome and conflicting realities
were emerging and were beginning to cause concern to this
discipline. The first of these conflicts was the realisation
that velocity alone does not define dynamic force as a
function of time. The second was the growing realisation
that in many classes of rotating machinery, it is desirable
and even necessary to measure motion of the rotating shaft
itself. For example, machines with high ratios of case/rotor
mass and stiffness.

AMPL
ITUD
E (M
ils)
Pk-P
k AM
PUTU
DE
(Mils
) P
k-P
k
RATHBONE & YATES VIBRATION SEVERITY CHARTS
RATHBONEREGION CONDITION
A TOO ROUGH TO OPERATE
B ROUGH CORRECT IMMEDIATELY
C ROUGH CORRECT
D SLIGHTLY ROUGH
E FAIR
F GOOD
G VERY SMOOTH
YATESVELOCITY CONDITION
ih/s rms
2 IMMEDIATE INVESTIGATE REQUIRED
1 UNSATISFACTORY
0,5 SLIGHTLY ROUGH
0,2 NORMAL
0,1 VERY GOOD
0,05 SP IN S L IK E A TOP
FIGURE 1.4

DISP
LACE
MENT
(|jm
) Pe
ak -
Peak
GENERAL MACHINERY VIBRATION SEVERITY CHARTu
0,0254
o o o o
o c o o o o O o
ROTATIONAL FREQUENCY (R P M )
FIGURE 1.5
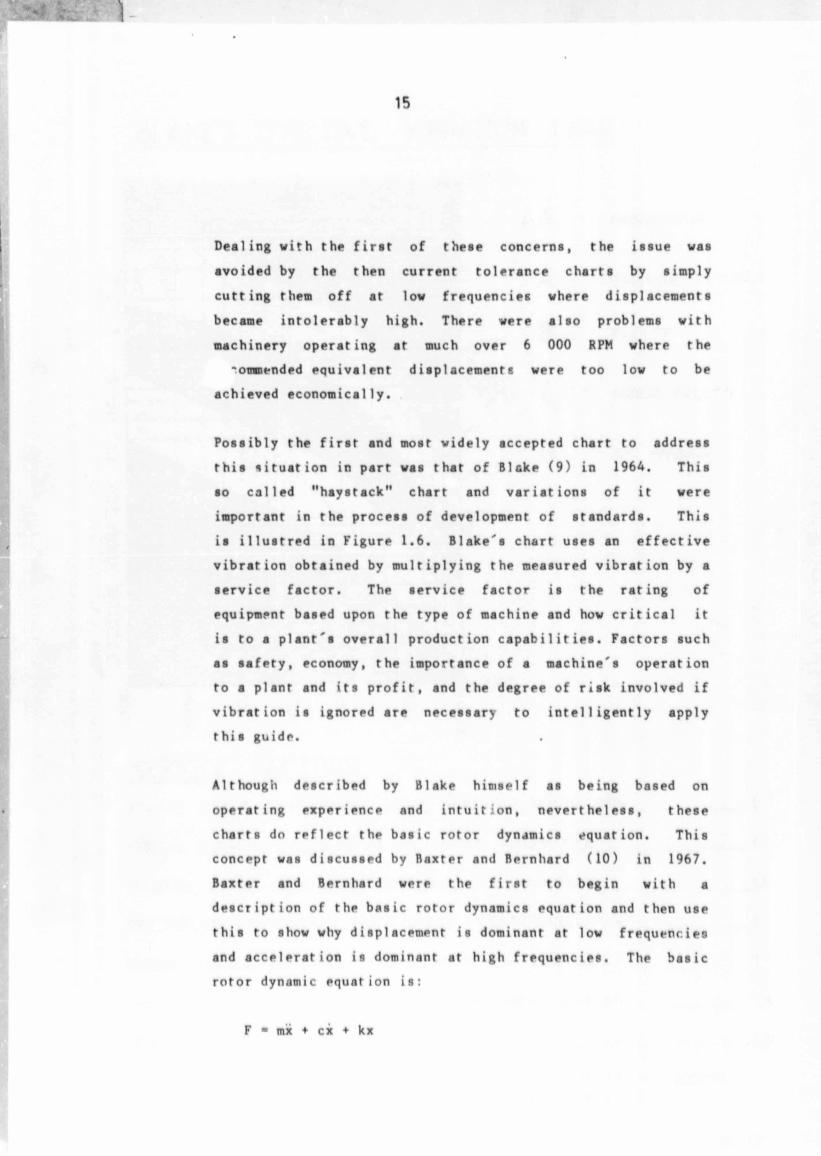
Dealing with the first of these concerns, the issue was
avoided by the then current tolerance charts by simply
cutting them off at low frequencies where displacements
became intolerably high. There were also problems with
machinery operating at much over 6 000 RPM where the
'ommended equivalent displacements were too low to be
achieved economically.
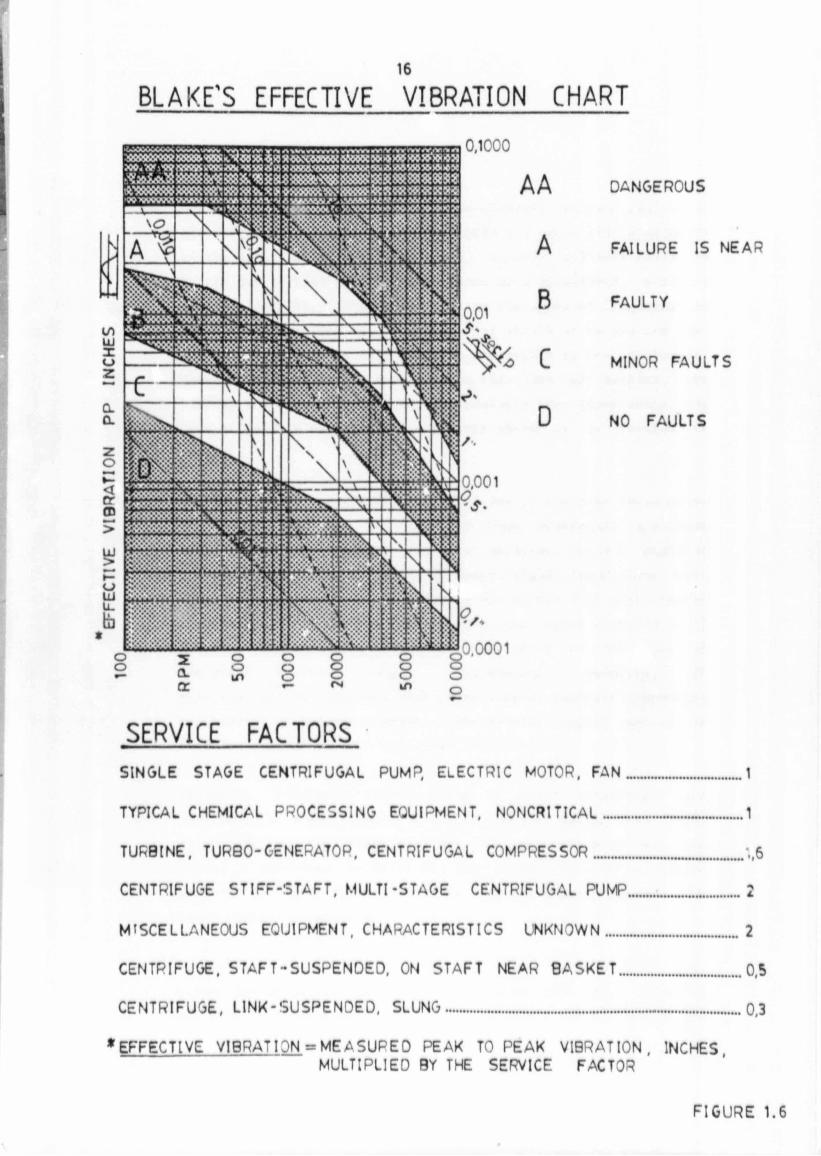
Possibly the first and most widely accepted chart to address
this situation in part was that of Blake (9) in 1964. This
so called "haystack" chart and variations of it were
important in the process of development of standards. This
is illustred in Figure 1.6. Blake's chart uses an effective
vibration obtained by multiplying the measured vibration by a
service factor. The service factor is the rating of
equipment based upon the type of machine and how critical it
is to a plant's overall production capabilities. Factors such
as safety, economy, the importance of a machine's operation
to a plant and its profit, and the degree of risk involved if
vibration is ignored are necessary to intelligently apply
this guide.
Although described by Blake himself as being based on
operating experience and intuition, nevertheless, these
charts do reflect the basic rotor dynamics equation. This
concept was discussed by Baxter and Bernhard (10) in 1967.
Baxter and Bernhard were the first to begin with a
description of the basic rotor dynamics equation and then use
this to show why displacement is dominant at low frequencies
and acceleration is dominant at high frequencies. The basic
rotor dynamic equation is:
EFFE
CTIV
E VI
BRAT
ION
PP
INCH
ESBLAKE'S EFFECTIVE VIBRATION CHART
16
VQi^\VN|WVWV%yyvWti■yMVrfW*w*Vl/V^i
■»<*&«£ « w » « w o<« ». * < x «>x««xx j w w » x» x-j » » *M W M s m v w s i v w w w A M v y s w ^ *
*»^^^&&*mS 888m&®888$£3$88$8&3
*#«*$«': s&ttfe sssftim^sfccto & s «? ■:* -x x yW W m w w V A W W W M V V A I U M g i / ^ k S H U M K M r W M M t t i
— — W M » ) W W » » K '• »JO«»)»»X'C o : ':
ikk-jxaxstt**:;*
Ski'>MXCK#)eMHMWTOOTti8i»«86;st»a >*<w B i
> . .JIM VVV %-W,W VyAV(Vrf
■ PL^ %»3¥SSSSSS
W:
AA DANGEROUS
A FAILURE IS NEAR
B FAULTY
C MINOR FAULTS
D NO FAULTS
SERVICE FACTORS •SINGLE STAGE CENTRIFUGAL PUMP, ELECTRIC MOTOR, F A N _______________ 1
TYPICAL CHEMICAL PROCESSING EQUIPMENT, N0NCR1TICAL_______ ___________1
TURBINE, TURBO-GENERATOR, CENTRIFUGAL COMPRESSOR____________________ 1,6
CENTRIFUGE S T IF F -S T A F T , MULTI-STAGE CENTRIFUGAL PUMP_______________ 2
MISCELLANEOUS EQUIPMENT, CHARACTERISTICS UNKNOWN.................................... 2
CENTRIFUGE, STA FT-S U SPE N D EO , ON STAFT NEAR B A S K E T ................................. 0,5
CENTRIFUGE, L IN K -SU SPE N D ED , SLUNG..................................................................................0,3
* EFFECTIVE V IB R A T ION = M E A S U P E 0 PEAK TO PEAK VIBRATION, INCHESMULTIPLIED BY THE SERVICE FACTOR
F I G U R E 1.6

17
The way in which each of these terms dominate its own region of
the frequency domain is shown in Figure 1.7 where the similarity
of the haystack chart will be noted. However, all this tells us
is the qualitative relative importance of displacement, velocity
r.nd acceleration. It does nor tell us the speed or frequency at
which to change from rne to another nor should it be implied tha*-
any one phenomenon is sufficient in the region of its dominance.
These things are highly dependent on the type of machine, its
bearing and support stiffness, and probably most importantly, the
type of failure or malfunction against which it is desired to
protect.
The V.D.I. 2056 specification (11) is one of the most exhaustive
in present use and was compiled from previously published
criteria for five separate classes of machines. Group G machines
for power generation machinery on heavy rigid foundations were
taken from Rathbone's work, although his curves were approximated
to straight lines and the maximum rotational epeed extended to 12
000 RPM. The directive places no restriction on the type of
vibration measured (e.g., displacement, velocity, or
acceleration) but suggests that where several harmonic components
are present an RMS measurement of the complex signal should be
used for comparison with the given criteria.
If typical tolerance curves based on shaft measurement are
examined, for example those of A.P.I. 670 (12) dating from 1968,
it will be seen that these are k. *• constant velocity but are
tilted to give lower velocity ar low speeds and allow higher
velocity higher speeds, which ia also the general pattern for
large turbine generators.
As machinery became larger, faster, and more complex with less
backup equipment, the need has continued to grow for vibration
analysis techniques which can detect incipient defects sooner and

Author Ducci PP
Name of thesis Vibration Analysis And Diagnostic Techniques, With Reference To The Implementation Of A Vibration
Condition Monitoring Programme. 1987
PUBLISHER: University of the Witwatersrand, Johannesburg
©2013
LEGAL NOTICES:
Copyright Notice: All materials on the Un i ve r s i t y o f the Wi twa te r s rand , Johannesbu rg L ib ra ry website are protected by South African copyright law and may not be distributed, transmitted, displayed, or otherwise published in any format, without the prior written permission of the copyright owner.
Disclaimer and Terms of Use: Provided that you maintain all copyright and other notices contained therein, you may download material (one machine readable copy and one print copy per page) for your personal and/or educational non-commercial use only.
The University of the Witwatersrand, Johannesburg, is not responsible for any errors or omissions and excludes any and all liability for any errors in or omissions from the information on the Library website.