vg311 development of sustainable intensive crop production
TRANSCRIPT

VG311 Development of sustainable intensive crop production systems
Jason Olsen QLD Department of Primary Industries

VG311
This report is published by the Horticultural Research and Development Corporation to pass on information concerning horticultural research and development undertaken for the vegetable industry.
The research contained in this report was funded by the Horticultural Research and Development Corporation with the support of the B&M Foods Pty Ltd, Land & Water Resources Research & Development Corporation and Queensland Fruit 6 Vegetable Growers,.
All expressions of opinion are not to be regarded as expressing the opinion of the Horticultural Research and Development Corporation or any authority of the Australian Government.
The Corporation and the Australian Government accept no responsibility for any of the opinions or the accuracy of the information contained in this report and readers should rely upon their own enquiries in making decisions concerning their own interests.
Cover price: $20.00 HRDC ISBN 1 86423 612 4
Published and distributed by: Horticultural Research & Development Corporation Level 6 7 Merriwa Street Gordon NSW 2072 Telephone: (02) 9418 2200 Fax: (02) 9418 1352 E-Mail: [email protected]
© Copyright 1997
V H R D V C
HORTICULTURAL RESEARCH & DEVELOPMENT CORPORATION
Partnership in horticulture

Table of contents
Industry Summary
Technical Summary
Section 1 - Communication activities
Section 2 - Vesicular-arbuscular mycorrhizal (VAM) component
Section 3 - Root-rot {Pythium) component
Section 4 - Nematology component
Appendix 1 - Scientific papers published from project
Industry Summary
Continued availability of many biocides currently used is now under threat for health and environmental reasons. Also, cadmium impurities in superphosphate and the potential demise of marine communities from phosphorus sounds a warning that uptake efficiency of this element will be important in the future. This project arose from the need to develop more sustainable management practices in vegetable crop production. The findings of research into the feasibility of vesicular-arbuscular mycorrhizae (VAM) to improve phosphorus uptake efficiency of (Section 2) and to control root-rot in (Section 3) intensively grown vegetable crops are presented. Section 3 also reports the findings of work into the effect of biological control measures other than VAM as well as 'softer' chemical options than those currently being used for root-rot control. The extent of the nematode problem on a diversity of vegetable crops in the Bundaberg district and the potential of some non-chemical options for managing root-knot nematode is reported in Section 4.
The mycorrhizal studies (Section 2) confirmed the importance of VAM (as both added inoculum or a network) to the enhanced phosphorus nutrition of capsicum, sweet corn and tomato at low soil phosphorus levels. The likelihood of a significant field response to VAM inoculation of seedling capsicum (the most responsive species) was considered small, however, given that most currently-cropped agricultural soils in the Bundaberg district have adequate levels of phosphorus. An economic analysis of the results of the field trial revealed that the saving in the cost of phosphorus fertiliser from mycorrhizal colonisation of the roots of host plants is relatively small for intensively grown vegetable crops because the cost of fertiliser is low compared with total costs. In the interest of achieving maximal yields (a major determinant of profitability), it is suggested that the risk-averse grower can apply phosphorus in one simple and inexpensive operation which gives a consistent result. Future conditions such as a dramatic rise in the price of phosphatic fertiliser or the introduction of legislation restricting phosphorus usage may change the economic incentive of using mycorrhizal networks in intensively-grown, VAM-dependent crops such as capsicum. Until then, however, there appears to be little economic incentive for the conventional vegetable grower to adopt mycorrhizae in their production system.
The root-rot component of this project (Section 3) showed that 50% of apparently healthy commercial capsicum fields sampled in NE Australia were infected with the root-rot organism known as Pythium; it is estimated that the yield loss from this fungus is 11-18%. Application of phosphorus acid and metalaxyl were shown to reduce root losses of capsicum plants to Pythium, whereas the biocontrol agents Pseudomonos cepacia, Trichoderma spp. and VAM did not. However, the biocontrol agents P. cepacia and VAM produced capsicum plants which were as vigorous as the phosphorus acid and metalaxyl-treated plants, indicating these biocontrol agents may play a role in enhancing or protecting the remaining root system. It is suggested that sustainable alternatives to the use of metalaxyl or metham for control of Pythium in capsicum may be VAM inoculation of seedlings at sowing in combination with injection off. cepacia and phosphorus acid (6 L/ ha) through the trickle tubing.
The nematology component of this project (Section 4) revealed that root-knot nematode did not cause problems in all fields or on all crops and data from field experiments demonstrated that crop losses from nematodes were minimal on crops grown in the autumn/winter period. These observations suggested that monitoring and advisory services should be developed which identify situations where there is a low risk of nematode damage, as such service would help minimise nematicide usage. Results of experiments on other control options showed that considerable nematode control could be obtained with bare fallow, while treatments containing sawdust, molasses or filter press all reduced nematode populations and galling. Organic treatments may therefore have a place in vegetable cropping systems, but optimum application rates must be defined and more work is required on performance in a variety of soils. Also, long term experiments are required to obtain data on the costs and benefits of such treatments.
Technical Summary This multi-disciplinary project investigated a range of alternative practices likely to be more sustainable than conventional methods for intensive vegetable production. Studies into the use of vesicular-arbuscular mycorrhizae (VAM) to improve P uptake efficiency of crops (Section 2) and to control root-rot (Section 3) were carried out. Assessments of the effect of biological control measures other than VAM as well as 'softer' chemical options than those currently being used for root-rot control were also made (Section 3). Research into the extent of the nematode problem on a diversity of vegetable crops in the Bundaberg district and the potential of some non-chemical options of managing root-knot nematode was conducted (Section 4).
In the VAM component of this project (Section 2), four greenhouse studies and a field trial were conducted to determine the mycorrhizal response of capsicum, sweet corn and tomato at various P rates. All studies confirmed the importance of VAM (as both added inoculum or a network) to the enhanced P nutrition of capsicum, sweet corn and tomato at low P levels. The likelihood of a significant field response to VAM inoculation of seedling capsicum (the most responsive species) was considered small, however, given that most currently-cropped agricultural soils in the Bundaberg district have adequate levels of NaHC03-extractable P. The starch analyses of roots indicated a greater carbon-drain on photosynthate production by the endophytes in the greenhouse than in the field which may be explained by the lower irradiance measured in the greenhouse than in the field trial. However, since the irradiance was approximately the same in both greenhouse Experiment 4 and the field trial, it is likely that other factors may have been important. The field trial showed that addition of P may not reduce VAM colonisation of roots if the inoculum potential of the soil is high. Economic analysis of the results of the field trial showed that the low cost of P fertiliser compared with total costs for intensively grown vegetable crops, the numerous cultural and environmental factors which may affect the efficacy of the VAM network to enhance P uptake by the host plant and the simplicity, consistency of response and inexpensiveness of P fertiliser addition suggest that, in the absence of a dramatic rise in the price of P fertiliser or the introduction of legislation restricting P usage, adoption of mycorrhizae in intensive vegetable production systems seems to have limited potential in current circumstances.
In the root-rot component of this project (Section 3), approximately half of the 20 capsicum fields which were sampled had a low level of Pythium spp. root infection despite the fact that plants did not exhibit wilt symptoms; Pythium aphanidermatum was the most prevalent of the Pythium spp. detected. Bioassay tests of the Pythium spp. cultured from the field survey showed that the root length density and height of capsicum plants infected with these fungi were lower than those of uninfected plants; most destruction of fine feeder roots resulted from P. aphanidermatum than for P. splendens or P. spinosum. A pot experiment with capsicum plants infected with Pythium aphanidermatum showed that drenching roots with 5 or 10 mL/ L of phosphorus acid reduced (P<0.05) the damage to roots caused by the fungus at 6 weeks after transplanting, as did incorporation of metalaxyl into the potting mix at 2.5 g/ 10L. Although VAM had no effect on reducing the damage to roots of capsicum plants infected with Pythium aphanidermatum, height of plants was greater (P<0.05) in the presence of VAM; plants treated with metalaxyl, phosphorus acid and Pseudomonos cepacia also produced taller plants than control plants. It is suggested that although Pseudomonos cepacia or VAM did not reduce the destruction of roots by Pythium aphanidermatum, they may have a role in enhancing or protecting the remaining root system.
In the nematology component of the project (Section 4), a survey of root-knot nematode on vegetable crops in Bundaberg showed that zucchini and tomato crops were invariably damaged by nematodes, whereas the nematode was uncommon on beans. Eggplant, squash, capsicum, sweet corn, pumpkin and rockmelons were sometimes heavily infested. Four nematode species were present: namely Meloidogyne arenaria haplo- types A and C, M incognita and M. javanica. Two field trials at Bundaberg Research Station showed that root-knot nematode increased more rapidly on some crops than on others, that some crops were relatively tolerant of the nematode and that yield reductions from the nematode were greater in crops maturing in summer than in winter. Capsicum and sweet corn were the most tolerant crops as their yields did not increase significantly following nematicide treatment. Yield responses to nematicides were generally not significant in autumn-planted crops, probably because such crops were not subjected to environmental stresses (e.g. temperature and moisture) during harvest. Observations in a fallowed, nematode infested field showed that the nematode population declined by more than 80% in the first two months. A further slow decline occurred during the next 9 months, so that the nematode was barely detectable by bioassay after 11 months bare fallow. The results of an experiment with organic amendments demonstrated that molasses, sawdust and filter press had a detrimental effect on root-knot nematode. All materials reduced gall ratings and nematode numbers at least to the same extent as the nematicide fenamiphos. These results indicate that crop rotation, organic amendments, fallowing and adjustment of planting times can be used to reduce populations of root-knot nematodes or limit their economic impact. When combined with options not explored in this study (e.g. biological control, cultivar resistance, strategic decision making) there is potential to introduce integrated pest management practices for root-knot nematode into the Bundaberg vegetable industry.

Section 1 Communication activities

Section 1 - Communication activities Page 1
Section 1 Communication activities
The communication activities employed in this project to disseminate information to clients and to accept their feedback are described below.
Project launch An official project launch and display was carried out in May 1994 at the Bundaberg Agrotrend. This significant media event raised the awareness of this project across the broader community.
Static displays Static displays of the project's work were mounted at Agrotrend (a large rural exhibition) in Bundaberg and also in the Bundaberg Fruit and Vegetable Growers' office. Both sites were very public and were viewed by large audiences.
Community advisory committee A Community Advisory Committee was formed consisting of local government, cane industry, horticultural industry, BSES, CSIRO and DPI representatives. This committee met at approximately 6-monthly intervals to discuss issues and outcomes arising from both the HRDC and LWRRDC components of this project. This committee proved to be an effective group through which to communicate the project's direction and results as well as providing feedback from these clients to project team members on client groups' priorities.
Project newsletter A quarterly project newsletter was distributed to all project team members and key clients. Copies of this newsletter can be found in previous progress reports.
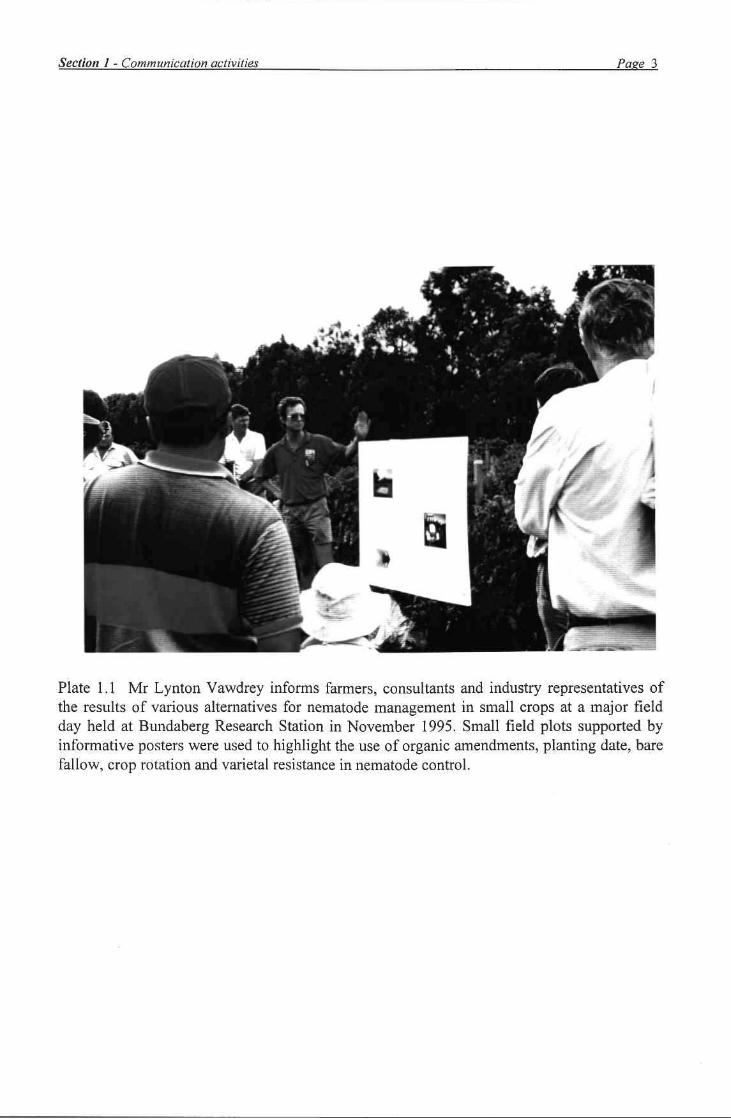
Field days In November 1995 a major field day at the Bundaberg Research Station was held to demonstrate the results of various alternatives for nematode management in small crops (Plate 1.1). Small field plots supported by informative posters were used to highlight the use of organic amendments, planting date, bare fallow, crop rotation and varietal resistance in nematode control. The posters produced were used at the Bundaberg Agrotrend field days in May 1996 as the major theme in that years project display.
On 25 May 1995, eight DPI technical staff from Bundaberg Research Station visited the VAM field trial site at a local farm to inspect the interaction effects of a soil VAM network and increasing phosphorus application rates on growth and yield of capsicum plants prior to harvest. The positive benefits of a VAM network on crop yield were evident from observation of the plots. The cooperating grower had a active interest in the trial and has gained an appreciation of the benefits of a VAM network, particularly in an impoverished soil.

Section 1 - Communication activities Pase 2
Seminar The project leader presented the latest findings of the project to an audience of growers (including Rod Eatough, Chairman of the Bowen District Growers Association and Eileen List, Secretary of the Burdekin Fruit and Vegetable Growers Association) and DPI staff. The seminar was held at the Bowen Horticultural Research Station on 17 July 1995.
Publications The following scientific papers (which are presented in Appendix 1) have been published from work conducted in this project. The financial contributions of HRDC and QFVG are acknowledged in the appropriate section of these papers. (1) Olsen, J. K., Schaefer, J. T., Hunter, M. N., Edwards, D. G., Galea, V. J., and Muller, L. M.
(1996). Response of capsicum (Capsicum annuum L.), sweet corn (Zea mays L.) and tomato (Lycopersicon esculentum Mill.) to inoculation with vesicular-arbuscular mycorrhizae. Australian Journal of Agricultural Research 47, 651-671.
(2) Vawdrey, L. L., and Stirling, G. R. (1996). The use of tolerance and modification of planting times to reduce damage caused by root-knot nematodes (Meloidogyne spp.) in vegetable cropping systems at Bundaberg, Queensland. Australasian Plant Pathology 25, 240-246.
It is anticipated that the following scientific papers will be published in the future as a result of the work completed in this project.
(1) Olsen et al. Effect of a soil mycorrhizal network on the growth response of capsicum (Capsicum annuum L.), sweet corn (Zea mays L.) and tomato (Lycopersicon esculentum Mill.). (To be submitted to Australian Journal of Agricultural Research).
(2) Vawdrey and Stirling. Nematicidal activity of molasses and other organic amendments against root-knot nematode (Meloidogyne javanica) on vegetable crops.
Section I - Communication activities Page 3
Plate 1.1 Mr Lynton Vawdrey informs farmers, consultants and industry representatives of the results of various alternatives for nematode management in small crops at a major field day held at Bundaberg Research Station in November 1995. Small field plots supported by informative posters were used to highlight the use of organic amendments, planting date, bare fallow, crop rotation and varietal resistance in nematode control.

Section 2 Vesicular-arbuscular mycorrhizal (VAM)
component

Section 2 - Vesicular-arbwcular mvcorrhizal (VAM) component Page 1
Section 2 Vesicular-arbuscular mycorrhizal (VAM) component
INTRODUCTION The use in intensive horticultural cropping systems of fumigants such as methyl bromide to control soil-borne pathogens and weeds, also eliminates vesicular-arbuscular mycorrhizae (VAM) (Menge 1982). Plant stunting following fumigation has been linked to eradication of VAM from P-deficient soils (Timmer and Leyden 1978) and from highly sorptive soils capable of irreversibly binding applied P, such as the alkaline calcareous soils of the northern Negev, Israel (Dodd et al. 1983, Haas et al 1987).
Plant growth responses to VAM colonisation are due primarily to improved uptake of P (Creighton Miller et al. 1986). As a result of better P nutrition, Mosse (1986) suggested that mycorrhizal plants recover more rapidly from water stress (Nelsen and Saflr 1982) and transplant better (Menge et al. 1978a) than those without mycorrhizae. Other benefits of VAM such as disease reduction (Dehne 1982) and increased uptake of minor elements such as Cu and Zn (Mosse 1973) have been reported. Because of these benefits, VAM have been suggested as one of the potentially more useful biological means of assuring plant production with minimum input of chemicals such as fertilisers and pesticides (Gianinazzi et al. 1990).
Phosphorus fertilisers contain relatively higher concentrations of the heavy metal Cd, largely derived from the rock phosphate used in their manufacture (Incitec 1995), than other fertilisers. In a soil survey conducted by the CSIRO Division of Soils of 89 commercial potato crops in southern Australia, all samples contained traces of Cd which was mainly derived from phosphatic fertilisers (Taylor 1995). The same reference reported that from a National Food Authority survey of potato tubers in the capital city markets of Australia, 15 to 20% of samples had Cd concentrations above the maximum permitted concentration of 0.05 mg/ kg fresh weight. The possibility that VAM inoculation of crops can partially or wholly replace P fertiliser represents a positive step towards allaying community concern over the effect of agricultural pollutants on both the environment and human health.
Positive growth responses to VAM have been reported for capsicum (Dodd et al. 1983, Haas et al. 1986, 1987, Waterer and Coltman 1989, Sreenivasa et al. 1993), tomato (Gaunt 1978, Plenchette et al. 1983) and corn (Vivekanandan and Fixen 1991, McGonigle and Miller 1993), although studies where VAM had no effect or caused negative responses are also documented (capsicum- Dodd et al. 1983; sweet corn- Hetrick et al. 1984, Johnson et al. 1992; tomato-Datnoff et al. 1991, McGovern et al. 1992). Such variation suggests that strategies for successful inoculation need to be defined before industry acceptance of VAM is forthcoming. An understanding of VAM dependency over a wide range of soil P sufficiency must be attained before a reliable prediction of a growth response to inoculation can be made. One of the objectives of Experiment 1 was to measure the greenhouse response of three economically important horticultural crops in the Bundaberg district (capsicum, sweet corn and tomato) to the addition of VAM inoculum over a range of P and N rates applied to a low P soil. The suitability of incorporating VAM inoculum into the normal production process of these crop species is assessed.

Section 2 - Vesicular-arbuscular mvcorrhizal (VAM) component Page 2
In low P soils, increased P absorption by plants grown in association with an extraradical mycorrhizal mycelium (VAM network) is a consistent finding in the majority of published studies, irrespective of whether or not mycorrhizal colonisation of roots is changed by disruption of the soil (McGonigle and Miller 1993 a). However, there is a dearth of studies which have investigated the effect of a VAM network on crop growth over a range of P applications, up to levels which are comparable with those used by commercial growers. For two such studies (a greenhouse experiment - Fairchild and Miller 1990 and a field trial -McGonigle et al. 1990), the response of maize plants grown in undisturbed soil with a VAM network was compared with the response of maize plants grown in disturbed soil without a network. Neither of these studies employed a control treatment in which the maize plants were grown in soil devoid of VAM propagules. Thus, the full effect of the VAM network on plant response could not be assessed.
Most scientists who have studied the interaction between a VAM network and an agricultural crop have usually selected field crops such as maize (e.g. Evans and Miller 1990, McGonigle and Miller 1993b) or pasture species such as subterranean clover (e.g. Jasper et al. 1989) as the production (or bioassay) crop. There appear to be no studies which investigate the role of an extraradical mycorrhizal mycelium on intensively managed vegetable crops such as capsicum, sweet com and tomato, especially over a range of P supply (deficiency to adequacy).
In Experiment 1, the growth response of capsicum, sweet com and tomato plants to addition of VAM inoculum was measured at five P application rates. In that experiment, the young host plant would have had to contribute considerable amounts of photosynthate to the developing VAM network which, in turn, would have improved the P nutrition of the host. Although there appear to be no published studies which have determined the C contribution by a host plant for development of a VAM network, Tinker et al. (1994) reported that several studies have estimated that 6-10% of the total net C fixed by the host plant is transferred to the VAM roots. A considerable saving in the amount of C contributed by the host for development of the endophyte is possible by planting into undisturbed soil in which a VAM network was developed by a previous crop. The objective of Experiments 2, 3 and 4 was to measure the growth response of capsicum, sweet com and tomato plants to five rates of applied P in the presence or absence of a network of extraradical mycorrhizal mycelium. It was expected that these data would assist in better understanding of the role of VAM in intensive agriculture.
Soil beds which are irrigated with trickle irrigation tubing and covered with plastic mulch are sometimes re-used for a second crop by growers in the Bowen (R. M. Wright, pers. comm.) and Bundaberg districts. Once harvested, plant tops of the first crop (such as capsicum and tomato) are slashed and the undisturbed beds are sown or transplanted with a second crop (such as sweet com or pumpkin). The primary motivation of growers for this practice is to extend the life of the plastic mulch and trickle tubing and to maximise the recovery of residual fertiliser from the first crop. However, the methodology also lends itself to the development of an extensive network of mycorrhizal hyphae which may greatly benefit the second crop. The effect of an existing network of mycorrhizae on the dry matter yield of capsicum, sweet com, and tomato plants sown into this system was investigated in Experiments 2, 3 and 4. A yield depression of +VAM relative to -VAM plants at higher P rates was attributed to the lower starch concentrations measured in the roots of the +VAM plants. It was suggested that this outcome may have been an artefact of the relatively low light levels within the greenhouse (light transparency of the roof was 66%) with the photosynthate production of +VAM plants

Section 2 - Vesicular-arbuscular mvcorrhizal (VAM) component Pase 3
insufficient to meet the C demand of both host and endophytes. Under field conditions, where light levels may be appreciably higher than in the greenhouse, the benefits of a VAM network may not be abated by the C-drain of the endophytes.
Miller et al. (1995) stated that they were not aware of any field trials comparing fertiliser response with and without mycorrhizas, and, according to Bagyaraj and Varma (1995), most experiments with mycorrhizae have been conducted in controlled greenhouse or growth chamber environments. The latter authors also state that there is relatively sparse information on the function of mycorrhizae in field environments. In order to determine the importance of VAM for vegetable production in the field environment, a field trial was conducted to measure the response of a capsicum crop grown in soil with a live or killed extraradical mycelium at five rates of applied P and at two rates of N for the lowest two P rates for +VAM plants.
MATERIALS AND METHODS
VAM inoculum for all the greenhouse Experiments 1, 2, 3 and 4 was sourced in November 1992 from commercial fields of capsicum and sweet corn within the Bundaberg district of south-east Queensland (24°51'S., 152°24'E.). This inoculum was subsequently increased and kept viable through the use of trap cultures of VAM-dependent species.
Experiment 1 At the time of seed sowing, the number of viable propagules in the +VAM inoculum was quantified by a most probable number (MPN) test (Porter 1979). Spores were extracted from the inoculum using flotation and wet sieving techniques described by Pacioni (1992). Ten similar spores within each group were placed immediately below five germinated capsicum cv. Target seeds in the same medium used as the diluent in the MPN study. VAM fungi identified from these trap cultures were Glomus mosseae (Nicol. & Gerd.) Gerdemann & Trappe and Glomus etunicatum Becker & Gerdemann. The combined VAM inoculum was sent to the International Collection of Arbuscular and Vesicular-arbuscular Mycorrhizal Fungi (INVAM) at West Virginia University, USA (refer to Morton et al. 1993) where it was incorporated into the collection and given the accession code "AU401".
The growth medium used in the pot experiment was a sandy loam soil (McDonald et al. 1984) with a particle size analysis of 41, 45, 6 and 8% coarse sand, fine sand, silt and clay, respectively. This soil (excavated to a depth of 1 m) originated from 25°02'S., 151°52'E. (Moolboolaman, south-east Queensland) and is variously classified as a Mollic Ustifluvent (USDA 1975), a Basic Fluvic Orthic Tenosol (Isbell 1993), an Earthy Sand (Stace et al. 1972), and as a Uc 5.21 (Northcote 1979). Chemical analysis of the soil revealed an inadequate supply of N03-N, P, R, Ca, Zn, S04-S and B (Table 2.1). Each pot (10 L bucket) was filled with 10.7 kg of the air-dry soil (moisture content 0.7%) which was mixed thoroughly with basal nutrients (rates selected according to a soil interpretation manual [Incitec 1989] and past experience [R. Aitken, pers. comm.]), 6.42 g Ca(OH)2 (which raised soil pH [1:5 soihwater] to 6.8 after 3 weeks), and one of five P rates; 0 (P^, 10.3 (P2), 30.9 (P3), 92.7 (P4) or 278 (P5) mg/ kg oven-dry soil as Ca(H2P04)2.H20 (Table 2.2).
Prepared pots (total 120) and one-half the required inoculum were placed within sealed plastic sheets and fumigated with a mixture of 98% methyl bromide and 2% chloropicrin at a rate of 680 g/ m3 of soil. After 48 h, the plastic cover was removed and pots and fumigated inoculum

Section 2 - Vesicular-arbuscular mvcorrhizal (VAM) component Page 4
vented for at least 72 hours prior to sowing and placement of VAM inoculum. For each fumigated pot, a centrally positioned core (2.5 cm diameter) of inoculum (50 g) which had either been fumigated (-VAM) or not fumigated (+VAM) was placed immediately below five germinated seeds (surface sterilised prior to germination by soaking in 0.03% calcium hypochlorite for 10 min) of one of three crop species (viz. capsicum - Capsicum annuum L. cv. Target; supersweet corn - Zea mays L. cv. Snosweet; tomato - Lycopersicon esculentum Mill. cv. Floradade). Each crop species was grown in 40 pots in a randomised factorial design, with the pots randomised separately within each crop species. The factorial design comprised five P rates x two (+/-) VAM x two N rates with two replicates/ blocks.
Following sowing (corn, capsicum and tomato were sown in sequence on 26, 27 and 31 August 1993), pot sides and tops were fitted with reflective insulation to minimise temperature fluctuations. Pots were then placed on benches within a greenhouse at Bundaberg. Sown seeds were surface watered daily with deionised water until emergence (after approximately 3 days for sweet corn and tomato and 5 days for capsicum), after which, an irrigation solution of dissolved N [Ca(N03)2.4H20] was applied at either 50 (NO or 200 (N2) mg N/ L (Table 2.2) using the constant water table method described by Hunter (1981). At about 2 weeks after emergence, all except the most vigorous single plant were removed from each pot by severing the stems at ground level.
Plants were not grown through to maturity in this pot experiment as it was deemed that soil volume would become limiting to the roots of mature plants. Each species was harvested when plants had attained a size whereby treatment effects could be easily observed; plant height data were used in this assessment. Consequently, harvest dates (tomato 22 October 1993; corn 29 October 1993; capsicum 22 November 1993) were dependent on growth rate of each crop species; durations from sowing to harvest were 52 days for tomato, 64 days for sweet corn and 87 days for capsicum. At harvest, index leaves, fruit (if present) and remaining tops above soil level were separated for each pot, washed in deionised water and placed in labelled paper bags which were placed in a forced draught oven at 65°C until the plant tissues were dry. For each species, index leaf selection was based on those plant parts recommended by Piggott (1986) for diagnostic analysis and on recovery of sufficient material for analysis from the single plants grown in each pot (capsicum - five youngest mature leaf blades plus petioles 5 YMB+P; sweet corn - ear leaf blade ELB; tomato - two youngest mature leaf blades plus petioles 2YMB+P).
Each root system was washed free of soil, blotted dry with paper towels, cut into approximately 1 cm lengths and weighed. Two weighed samples (approximately 2 g each) of randomly selected root pieces were taken from each root system for VAM and root length determination and placed in 70% ethanol (VAM) and deionised water (root length) at 4°C until processing (within 1 week). Remaining roots were placed in labelled paper bags in a forced draught oven at 65°C until dry. Dry weight of each entire root system was calculated from a fresh weight : dry weight ratio of the dried root tissue. Sample root lengths were determined using a root length scanner. Ten root pieces (each approximately 1 cm long) from each of the measured tomato root length samples were placed on potato dextrose agar containing 50 mg/ L streptomycin sulphate (S/ PDA) in Petri dishes. These dishes were placed in an incubator at 24°C for 7 days prior to assessing the presence of fungal pathogens; none were detected for both +VAM and -VAM pots. Inspection of washed root systems of all three crop species revealed no Meloidogyne spp. galls in any pot.

Section 2 - Vesicular-arbuscular mycorrhizal (VAM) component Page 5
Roots were cleared and stained (Koske and Gemma 1989) and the percentage of root colonisation by VAM (as a percentage of the total root length) was obtained by the gridline intersect method (Ambler and Young 1977), observing 100 root intersections under a dissecting microscope (x30) to obtain a standard error of ±4% (Giovannetti and Mosse 1980). Relative mycorrhizal dependency (RMD) was calculated as
100 x (dry weight of mycorrhizal plants - dry weight of non-mvcorrhizal plants) dry weight of mycorrhizal plants
as described by Plenchette et al. (1983).
Oven-dried index tissue samples were ground through a 1 mm mesh in a stainless steel mill. Samples were dried again at 85°C before chemical analysis. Nitrogen was determined using Kjeldahl digestion followed by automated colorimetry (O'Neill and Webb 1970), whereas P was measured using HN03 digestion and inductively coupled plasma atomic emission spectroscopy (Zarcinas et al. 1987). For each species, analysis of variance was used to test the effects of treatments. Means were compared using the protected l.s.d. procedure operating at the 5% level of significance.
Experiments 2,3 and 4 These three pot experiments were conducted to assess the effect of a soil mycorrhizal network on the growth response of capsicum, sweet corn and tomato plants over a range of P supply. Each experiment consisted of two phases. In the first (preconditioning) phase, sunflower {Helianthus annuus L. cv. Advance) was sown directly above either live (+VAM) or killed (-VAM) mycorrhizal inoculum to establish respective pots with and without a mycorrhizal network. For two of the experiments (Experiments 3 and 4), the two sunflower nurse plants were grown outside a centrally positioned nylon mesh (Nytal® Swiss screen with pore size 44 um, BCNY-325-44-102) root exclusion cage (Fig. 2.1a) which was impervious to roots but not to mycorrhizal hyphae. In Experiment 2, root exclusion cages were not used, and plants were grown in the same positions within pots as they would had cages been present. The preconditioning phase ended when stems of the sunflower plants were severed at soil level and the tops were removed. In the second (production) phase, a capsicum, sweet corn or tomato plant was grown inside the cage (Fig. 2.1b). A schedule of operations for all three pot experiments is shown in Table 2.3.
A root exclusion cage was used in each pot of Experiments 3 and 4 to investigate the effect of a VAM network on the production crop plants in the absence of roots from the sunflower nurse crop. However, it was possible that the cage may have confounded the response of the production crop plants to the VAM network. This hypothesis was tested in Experiment 2, which was identical in design to Experiment 3, without the use of root exclusion cages.
Most Probable Number Tests Most probable number (MPN) tests were conducted on the +VAM inoculum at the time of sowing the sunflower seeds in the preconditioning phase of each experiment in order to enumerate the number of viable propagules per gram of air dry inoculum. As Experiments 2 and 3 were conducted concurrently and the same inoculum was used in both these experiments, only one MPN test was conducted on this inoculum source. Inoculum was mixed with the fumigated growth medium used in Experiments 2 and 3 (chemical properties shown in Table 2.4) in sequential two-fold dilutions ranging from 1:125 to 1:64 000 for Experiments 2 and 3 and from 1:250 to 1:128 000 for Experiment 4.

Section 2 - Vesicular-arbuscular mvcorrhizal (VAM) component Page 6
Preparation of pots The growth medium placed in each pot (10 L bucket) in Experiments 2, 3 and 4 consisted of 6 kg each of air dry coarse sand and soil mixed together to give a loamy sand texture (McDonald et al. 1984). The soil component of the growth medium (excavated to a depth of 1 m) originated from 25°02'S., 151°52'E. (Moolboolaman, south-east Queensland) and is variously classified as a Mollic Ustifluvent (USDA 1975), a Basic Fluvic Orthic Tenosol (Isbell 1993), an Earthy Sand (Stace et al. 1972) and as a Uc 5.21 (Northcote 1979). The coarse sand component of the growth medium used in all three experiments was obtained from one uniformly mixed stockpile (4 mg NaHC03-extractable P/ kg). However, the soil component was sourced from two separate, uniformly mixed stockpiles (Experiments 2 and 3 from one [chemical analysis shown in Table 2.1] and Experiment 4 from the other). For Experiments 2 and 3, the growth medium consisted of 62% coarse sand, 29% fine sand, 5% silt and 4% clay, whereas particle size analysis of the growth medium used in Experiment 4 revealed 66% coarse sand, 26% fine sand, 3% silt and 5% clay. Chemical analysis of the growth media showed an inadequate supply of N03-N, P, K, Ca, Cu, Zn, S04-S and B (Table 2.4).
The 12 kg of air dry loamy sand growth medium placed in each pot was mixed thoroughly with basal nutrients (rates selected according to a Soil Interpretation Manual [Incitec 1989] and past experience [R. Aitken, pers. comm.]) and 3.0 g Ca(OH)2 (which raised soil pH [1:5 soihwater] to approximately 6.5 after 3 weeks) (Table 2.5).
The nylon mesh was formed into cages by gluing all seams with solvent cement (Vinidex ) between two strips of polyvinyl chloride of dimensions 230 x 25 x 1 mm. Cages were made to fit tightly over a steel frame of external dimensions 200 x 150 x 50 mm welded from 8 mm diameter solid steel rod to standardise the cage dimensions. For Experiments 3 and 4, root exclusion cages were positioned centrally within pots and filled with growth medium; following removal of the steel frame, each cage was set at a depth such that the top 10 mm of mesh extended above the surface of the growth medium. A 240 mm length of Polydrain (James Hardie Irrigation) corrugated drainage pipe (65 mm external diameter, class 400) was placed vertically along the pot wall. A 200 mm length of 25 mm diameter garden hose was heated and pushed firmly over the neck of a bottle of capacity 750 mL to ensure a water-tight seal. The bottle and hose extension (total capacity approximately 860 mL) was inverted and placed into the corrugated drainage pipe. The shoulder of the bottle was supported by the top of the pipe so that the tip of the hose was suspended approximately 10 mm above the bottom of the pot. Provided water was in the bottle, this set-up maintained a constant water table at the bottom of the pot (Hunter 1981). Each pot was surface watered with 600 mL of water in order to moisten soil prior to fumigation.
Prepared pots (120 for each of Experiments 2, 3 and 4) and one-half of the inoculum required for each experiment were placed within sealed plastic sheets and fumigated with a mixture of 98% CH3Br and 2% CC13N02 at a rate of 680 g/ m3 of soil. After 48 hours, the plastic covers were removed and pots and sterilised inoculum vented for at least 72 hours prior to sowing sunflower seed in the preconditioning phase.
Preconditioning phase For each fumigated pot in Experiments 3 and 4, 0.11 g C a ^ P O ^ . ^ O (equivalent to 2.3 mg P/ kg oven-dry soil) was spot placed at a depth of 50 mm on each side of, and, external to the centrally positioned root exclusion cage; on each side of the cage, the P was positioned

Section 2 - Vesicular-arbuscular mvcorrhizal (VAM) component Page 7
equidistant between the mesh wall and the edge of the bucket. Then, 50 g of either - or +VAM inoculum was placed immediately above the P; five sunflower seeds, which had been surface sterilised by soaking in 0.03% calcium hypochlorite for 10 minutes, were placed immediately above the inoculum and covered with 10 mm of fumigated growth medium. In Experiment 2, root exclusion cages were not used and the P, VAM inoculum and sunflower seeds were placed at the same positions within pots had cages been present.
Following sowing (dates for the three experiments are shown in Table 2.3), a layer (approximately 20 mm) of white polystyrene spheres (average diameter 9 mm) was placed on the surface of the growth medium and pot sides and tops were covered with reflective insulation to minimise temperature fluctuations and reduce evaporative loss. Pots were then placed on benches within a greenhouse. Approximately one week after seedling emergence, each bottle and hose extension was filled with an irrigation solution of 50 mg N/ L (Table 2.5), quickly inverted and placed in the pipe within each pot. At about two weeks after emergence, all except the most vigorous single sunflower plant on each side of the root cage (Experiments 3 and 4) or in the equivalent positions (Experiment 2) were removed from each pot by severing the stems at ground level. Within each experiment, pots designated for planting with capsicum, sweet corn or tomato in the production phase were randomised separately. The sunflower plants were harvested (dates shown in Table 2.3) by severing the stems at soil level; oven-dry weights were recorded.
Production phase In each experiment, each production crop species was grown in 40 pots in a randomised factorial design, with the pots randomised separately within each production crop species. For Experiments 2 and 3, the factorial design comprised five P rates x two (+/-) VAM treatments x two N rates with two replicates/ blocks. The factorial design of Experiment 4 comprised five P rates x two (+/-) VAM treatments with four replicates/ blocks. The degrees of freedom of the various factors and their interactions in the three experiments are presented in Table 2.6.
Five sweet corn seeds or six germinated capsicum or tomato seeds were sown within the centre of each root exclusion cage (dates shown in Table 2.3). Also within the cage, a tapered hole (approximately 100 mm deep, 20 mm diameter at the surface) was made on each side of the seeds, approximately equidistant between the seeds and the seamed edge of the cage. Into each of the two holes within the root exclusion cage, half the required amount of P was carefully placed at the bottom of the hole, minimising the amount adhering to the wall. Each hole was then back-filled using the soil located at the surface. One of five rates of P was applied to each pot using this technique: 0 (Pj), 9.2 (P2), 27.5 (P3), 82.5 (P4) or 248 (P5) mg/ kg oven-dry soil as 0,0.45,1.34,4.00 or 12.01 g Ca(H2P04)2.H20/ pot, respectively.
Prior to seedling emergence, a 20 mL aliquot from each of two separate stock solutions of basal nutrients (K, Mo and B in one and Mg, Zn, Cu and Mn in the other; rates shown in Table 2.5) were applied to the bottom of the water well in each pot on consecutive days. Sown seeds were surface watered daily with deionised water until emergence, after which, the constant water table method was instated. For Experiments 2 and 3, the irrigation solution contained dissolved N at either 50 (N,) mg/ L [422 mg Ca(N03)2.4H20/ L] or 200 (N2) mg/ L [1687 mg Ca(N03)2.4H20/ L], whereas only Nj was used in Experiment 4.
Section 2 - Vesicular-arbuscular mycorrhizal (VAM) component Pase 8
At about two weeks after emergence, all except the most vigorous single plant were removed from each pot by severing the stems at ground level. In order to ensure that sufficient plant material was available for diagnostic analysis of the index tissues, it was decided in Experiment 4 not to thin plants growing in the -VAM Pj pots to the most vigorous single plant until some growth response had occurred. It was assumed that such small plants would be neither light nor water limited. Only sweet corn plants growing in the -VAM Px treatment exhibited some growth beyond the seedling stage and were consequently thinned to one plant per pot. However, capsicum and tomato plants growing in this treatment showed little or no growth following emergence and were not thinned.
Three soil temperature probes were installed at a depth of 50 mm in randomly selected pots from 5 May to 23 August 1994 (Experiments 2 and 3) and from 31 January to 28 March 1995 (Experiment 4). Mean soil temperatures during these periods were 20.1°C (range from 9.0 to 32.4°C) and 28.2°C (range from 20.7 to 37.8°C), respectively. Air temperatures within the greenhouse for the period 6 June to 23 August 1994 ranged from 4.9 to 40.9°C; air temperatures within the greenhouse were not measured at any stage during the production phase of Experiment 4. Average daily solar irradiance for the period 5 May to 23 August 1994 (Experiments 2 and 3) was 12.7 MJ/ m2 day (daily irradiance values ranging from 4.8 to 15.9 MJ/ m day), with an estimated average daily value of 8.4 MJ/ m day within the greenhouse, given the transparency of the roof was measured at 66%. For Experiment 4, average daily solar irradiance within the greenhouse was 13.4 MJ/ m day (with daily irradiance values ranging from 2.6 to 17.4 MJ/ m2day) for the period from 31 January to 28 March 1995.
Production crop plants were not grown through to maturity, as it was considered that soil volume, both within the pots (Experiment 2) and root exclusion cages (Experiments 3 and 4), would become limiting to the roots of mature plants. Depending on available soil volume within each experiment, each production crop species was harvested when treatment effects on plant height and water loss could be easily separated. Consequently, harvest dates (Table 2.3) were dependent on growth rate of each crop species. At harvest, index leaves, fruit (if present) and remaining tops above soil level were separated for each pot. Index leaves were washed in deionised water and all plant parts were placed separately in labelled paper bags which were placed in a forced draught oven at 65°C until the plant tissues were dry. For each species, index leaf selection was based on those plant parts recommended by Piggott (1986) for diagnostic analysis and on recovery of sufficient material for analysis from the single plants grown in each pot (capsicum - 6 youngest mature leaf blades plus petioles 6YMB+P; sweet corn - ear leaf blade ELB in Experiment 2 and the youngest mature leaf blade YMB in Experiments 3 and 4; tomato - 3 youngest mature leaf blades plus petioles 3YMB+P).
In Experiments 3 and 4, root exclusion cages containing root systems of the production crops were lifted from pots and the root systems were removed, washed, blotted dry with paper towels, cut into approximately 10 mm lengths and weighed. Two weighed samples (approximately 1 g each) of randomly selected root pieces were taken from each root system for VAM and root length determination and placed in 70% ethanol until processing. The remaining roots were placed in labelled paper bags in a forced draught oven at 65°C until dry. Dry weight of each entire root system was estimated from the dried subsample.
For capsicum and tomato, dry roots from the Nj treatment in Experiment 3 and all roots in Experiment 4 were ground through a 1 mm mesh in a stainless steel mill and analysed for starch

Section 2 - Vesicular-arbuscular mycorrhizal (VAM) component Page 9
using an enzymic-colorimetic procedure (Rasmussen and Henry 1990). Sample root lengths were determined using a root length scanner. Roots were cleared and stained using the methodology of Koske and Gemma (1989), as previously described for Experiment 1. The percentage of root colonisation by VAM (as a percentage of the total root length) was determined by the gridline intersect method (Ambler and Young 1977), observing 100 root intersections under a dissecting microscope (x30) to obtain a standard error of ±4% (Giovannetti and Mosse 1980). Relative mycorrhizal dependency was calculated using the same formula used in Experiment 1. Oven-dried index tissue samples were ground through a 1 mm mesh in a stainless steel mill. Samples were dried again at 85°C before chemical analysis.
Statistical analysis With a view to simplifying the presentation of results, a non-orthogonal combined-over-experiments ANOVA was conducted on total dry weight data from plants grown in the Nj treatment in both Experiments 3 and 4; the ANOVA was non-orthogonal because of the unequal replication between Experiments 3 (two replicates/ blocks) and 4 (four replicates/ blocks). The analysis revealed that the pattern of differences was not the same in Experiments 3 and 4, and a separate ANOVA for each experiment was required to analyse these data. Therefore, for each species grown in Experiments 2, 3 and 4, a separate ANOVA was used to test the effects of treatments for each measured parameter. Means were compared using the protected l.s.d. procedure operating at the 5% level of significance. For the sake of comparison with Experiment 4, data from plants grown in the Ni treatment in Experiment 3 were analysed separately. Instead of the usual interaction effects VAM x P (on 4 degrees of freedom) and VAM x P x N (on 4 degrees of freedom) for Experiment 3 (Table 2.6), the information on the VAM x P interaction was estimated as the two components: VAM x P at N! (on 4 degrees of freedom) and VAM x P at N2 (on 4 degrees of freedom), so that the separate VAM x P interaction effects at Nj and at N2 could be F-tested in the ANOVA.
Field trial A field trial was conducted primarily to assess the effect of a soil mycorrhizal network on the growth response of capsicum cv. Target plants at 5 rates of P. The trial involved three distinct phases. In the first (preparation) phase, sorghum cv. Jumbo was grown in soil [previously cropped with sugar cane (Saccharum spp. hybrid QUO) from September 1988 to July 1993] to augment the number of naturally-occurring VAM propagules at the site. Following removal of the tops of the sorghum plants and cultivation of the soil, sweet corn cv. Snosweet was grown in the second (preconditioning) phase to establish a mycorrhizal network within distinct rows. In the third (production) phase, capsicum cv. Target seedlings were transplanted into either fumigated (-VAM) or not fumigated (+VAM) sections of the soil beds which were previously cropped with sweet corn. A schedule of operations for the trial is shown in Table 2.7.
Site Description The field trial site (24° 58' 11.6" S., 152° 24' 25.0" E.) was located approximately 13 km SSE of Bundaberg on the coastal plains land resource area described by Glanville et al. (1991). The open-woodland in an adjacent area on the northern side of the trial site is dominated by Eucalyptus intermedia R. T. Baker and E. umbra R. T. Baker. The climate of the Bundaberg area is subtropical with summer-dominant rainfall; 56% of the total average rainfall (1041 mm) is received from December to March, inclusive (Bureau of Meteorology data bank, 38 year average). Mean daily maximum temperatures do not vary greatly throughout the year (21.6°C in July to 29.6°C in January), and frosts rarely occur, as reflected by the range in mean daily

Section 2 - Vesicular-arbuscular mycorrhizal (VAM) component Pase 10
minimum temperatures from 9.7°C in July to 21.3°C in January (Bureau of Meteorology data bank, 17 year average).
Soil Description and Classification The soil is variously classified as a Typic Paleudalf (USDA 1975), a Bleached Sodic Mesotrophic Yellow Dermosol (Isbell 1996), a Dy 3.41 (Northcote 1979), and has an affinity with the yellow podzolic soil (Stace et al. 1972), although the sodic properties of the soil at depth are inconsistent with the great soil group classified in this latter system (P. R. Wilson, pers. comm.). Temporal changes in soil fertility were assessed from soil sampled on 2 August 1993,15 February and 24 June 1994 (Table 2.8); at each sampling date, approximately 20 cores (diameter 20 mm, depth 15 cm) were taken from random positions within the site, bulked together, and air-dried. Additionally, on 5 January 1995, soil cores (diameter 40 mm, depth 60 cm) were taken from four positions within the designated production crop area of the field trial (viz. 12, 24 36 and 48 m from the designated eastern boundary); the soil in each core was separated into 4 depths (0-10, 10-20, 20-40, and 40-60 cm), air-dried, and physical (Table 2.9) and chemical (Table 2.10) properties were then determined on each of the 16 subsamples.
Preparation Phase In the preparation phase, a sorghum cover crop was grown at the field site on 0.38 ha (32 x 120 m) of cultivated land in which sugar cane was previously grown; this phase was conducted to augment the number of naturally-occurring VAM propagules and to deplete the soil of P. Overhead irrigation water was applied throughout the crop cycle to supplement rainfall to ensure a satisfactory growth rate was attained.
At the end of the preparation phase, soil beds (1.36 m between centres) were formed (Table 2.7) into 18 rows of length 120 m, running in an E to W direction. Rows were arranged into three sets of six, with adjacent sets separated by a 1.64 m spray-track. Polyethylene trickle irrigation tubing (wall thickness 200 urn, internal diameter 16 mm, emitter spacing 300 mm) was laid along the centre of each bed and then covered with 25 urn white polyethylene plastic mulch (1.2 m wide).
Preconditioning Phase Two rows of sweet corn seeds were sown (Table 2.7) at a depth of 30 mm into each bed (one each side of the trickle irrigation tubing) with a precision air-seeder (38 cm inter-row spacing, 35 cm intra-row spacing); this planting arrangement was equivalent to 42000 plants/ ha. The irrigation water was pumped with a 4.1 kW centrifugal pump from an adjacent dam (3 ML capacity) through a headworks filter (screen size 115 urn) prior to reaching the trickle tubing. A solution of CaCl202 (0.75-1.00 g/ L) was injected into the suction line of the pump so that the concentration of residual CI at the end of the trickle tubing was maintained at approximately 1 mg/ L. This residual CI concentration was monitored during each irrigation cycle with a standard colorimetric swimming pool test kit (Palintest ). Irrigation water was applied to maintain tensiometer suction in the root zone (0-40 cm) between 10 and 50 kPa.
Soluble fertilisers were introduced into the irrigation water at the headworks filter using a pressure differential tank (capacity 50 L); this procedure is referred to as fertigation. Contact herbicides were applied on 2 occasions during the preconditioning phase to control primarily Amaranthus viridis L., Cynodon dactylon (L.) Pers., Digitaria ciliaris (Retz.) Koeler, Solanum nigrum L., and Verbena bonariensis L.

Section 2 - Vesicular-arbuscular mycorrhizal (VAM) component Paee 11
A photograph of the sweet corn crop at the late-silking stage is shown in Plate 2.1. Permanent pegs were placed at the perimeter of the field site, and, when required, string lines were run across the rows from these pegs to ascertain the position of whole plots and subplots intended for capsicum plants to be grown in the production phase. Only approximately one-half of the area used to grow sweet corn during the preconditioning phase was required for transplanting the capsicum crop in the production phase. The permanent pegs were placed so that the capsicum seedlings would be transplanted towards the eastern end of the available area, leaving a 20 m buffer zone at this end to avoid any confounding effect which may have arisen from planting too close to the edge of the site. Of the 34 sweet corn plants (2 rows of 17 plants) growing within each designated disturbed or undisturbed subplot (6 x 1.36 m), the tops of 10 (the 1st, 5th, 9th, 13th and 17th plant in each row) were cut at ground level (Table 2.7), placed in labelled hessian bags, dried in a tobacco barn at 65 °C for 11 days, and weighed. These data provided a measure of the uniformity of the site for later analyses. All the remaining sweet corn plants were severed at ground level with cane knives and removed. The plastic mulch and trickle tubing were removed and discarded (Table 2.7). No assessment of the VAM colonisation of sweet corn roots was made at any stage during the preconditioning phase.
Approximately 200 g of field soil and adhering sweet corn roots (0-15 cm) were sampled on 21 February 1995 from each of 20 randomly-selected positions within the trial site designated for the production crop, air-dried in a cool, dark position, thoroughly mixed, and approximately 500 g of the air-dried material was sent to the International Collection of Arbuscular and Vesicular-arbuscular Mycorrhizal Fungi (INVAM) at West Virginia University, USA (Morton et al. 1993) where it was incorporated into the collection and given the accession code "AU405". Spores were extracted from the inoculum using the flotation and wet sieving techniques described previously. A subsample of the extracted spores are shown in Plate 2.2, as viewed through a dissecting microscope at x30 magnification. The VAM fungi identified in the inoculum were Acaulospora mellea Spain & Schenck, Gigaspora margarita Becker & Hall, Glomus clarum Nicolson & Schenck, Glomus etunicatum Becker & Gerdemann, and Scutellospora pellucida (Nicol. & Schenck) Walker & Sanders. A most probable number (MPN) test was conducted on the soil sampled from the field on 21 February 1995 (Porter 1979) in order to enumerate the number of viable propagules per gram of air dry soil prior to the commencement of the production phase.
To all whole plots, a narrow band of potassium nitrate fertiliser (depth 75 mm) was applied approximately 75 mm from the centre of each bed to supply a basal application of 37.0 kg N/ ha and 109 kg K/ ha (Table 2.7). Soil in the centre of each bed was sliced (Table 2.7) with a plate of steel (2.5 x 175 x 450 mm) to which handles were fitted on one of the long sides; the edge of the remaining long side was sharpened to produce a cutting edge. A mark was placed 75 mm from the sharpened edge to standardise the depth of cut; the resultant cut was tapered with dimensions of approximately 75 mm depth and 25 mm width at the surface. The amount of P required for a 3 m section of the bed (representing 1-quarter the length of each whole plot) was mixed with 300 g of dry sand (the coarse sand component of the growth medium used in Experiments 2, 3, and 4 containing 4 mg NaHC03-extractable P/ kg). The mixture of P and sand was poured into a section of polyvinyl chloride pipe (3m long x 90 mm diameter) which had been cut longitudinally in half and capped at each end. The mixture was then spread evenly within the section of pipe, before being placed carefully at the bottom of the cut, minimising the amount of mixture adhering to the wall (Table 2.7). Each cut was then back-filled using soil
Section 2 - Vesicular-arbuscular mycorrhizal (VAM) component Pase 12
located at the surface. One of five rates of P was applied to each whole plot using this technique: 0 (P,), 5 (P2), 15 (P3), 45 (P4), or 135 (P5) kg P/ ha as 0, 55.6, 167, 500, or 1500 kg milled superphosphate (9.0% P)/ ha, respectively.
Following application of the treatment P, heavy rainfall on 11-15 February 1995 (286 mm recorded at Bundaberg airport [24° 54' S., 152° 19' E.] located 12 km N.W. of the field site) wet the soil profile to the extent that subsequent machinery operations were delayed by approximately 2 weeks. Following this rain, it was observed that soil in the disturbed subplots had slumped at least 50 mm relative to the undisturbed subplots. Trickle irrigation tubing was laid approximately 5 cm from the centre of each bed and then covered with white plastic mulch (Table 2.7). String lines were again run across the rows from the permanent pegs placed at the perimeter of the field site to ascertain the position of whole plots and subplots intended for capsicum plants grown in the production phase; brown acrylic paint was used to mark the positions of the string lines on the surface of the plastic mulch. For all whole plots, the end of each section of the trickle tubing which was not to be connected to the lay-flat hose (polyvinyl chloride reinforced with polyester yarn, internal diameter 76 mm) was double-folded and these folds were then held in position with a sheath (50 mm long) of the same type of trickle tubing. For the whole plots designated for fumigation, low density polyethylene tubing (wall thickness 1.5 mm, internal diameter 13 mm) was connected to the open end of the trickle tubing using the appropriate hose fittings; metal hose clamps were used to secure all joins. To prevent leakage of the fumigant through the mulch, any holes in the plastic mulch were sealed with heavy-duty ducting tape. Soil was placed on the surface of the plastic mulch at the ends of the whole plots to be fumigated (-VAM) to restrict lateral movement of the fumigant to adjacent unfumigated whole plots (+VAM) within the same row. A gaseous mixture of 98% CH3Br and 2% CC13N02 was delivered to the -VAM whole plots through the trickle tubing (Table 2.7). This procedure was achieved by the hot gas method, whereby liquid CH3Br and CC13N02 were discharged from a pressurised steel cylinder (capacity 100 kg) to a vaporising unit (a 5 m coil of 13 mm diameter copper pipe immersed in hot [>90°C] water), and the emerging gas was transported via the low density polyethylene tubing connected to the trickle tubing in the designated whole plots.
The trickle tubing in the fumigated whole plots was disconnected from the low density polyethylene tubing, and the open end of the trickle tubing of all whole plots was then connected to layflat hose submains which ran from the headworks filter. One week after fumigation, 20 lettuce {Lactuca sativa L. cv. Green Mignonette) seedlings were transplanted at random positions within the -VAM whole plots to test for the presence of fumigant residue; inspection of the seedlings 3 days later revealed that none was present. These plants were pulled out prior to planting the production crop.
Production Phase A randomised blocks layout with split-plots was used to test the effects of treatments on crop parameters. For the whole plots, two P rates were applied in combination with +VAM only at N t (112 kg N/ ha), whereas five P rates were applied in full factorial combination with two (+/-) VAM at N2 (187 kg N/ ha); all 12 combinations were replicated in four blocks. For each of the 48 whole plots, one-half (subplot) was randomly selected and the soil within the chosen subplot was disturbed with a rotary hoe.

Section 2 - Vesicular-arbuscular mycorrhizal (VAM) component Pase 13
On 4 January 1995, capsicum seeds (cv. Target) were sown into standard vegetable potting mix (5 L peat moss, 5 L vermiculite, 80 g dolomite, 80 g milled superphosphate (9% P), 80 g 5:6:5 N:P:K fertiliser) placed within 98 cell seedling trays made from 55 um polypropylene. Given that 10 L of potting mix is placed into 3 seedling trays, it was calculated that the addition of P from this potting mix to the field soil would be minuscule (a maximum of 1.36 kg P/ ha, assuming no uptake of this element by the plants), and, therefore, was unlikely to significantly alleviate the effects of P deficiency in the low P treatments. The seedling trays were placed on suspended wire benches within a greenhouse designed for vegetable seedling production. The seedlings were watered for 20 minutes twice each day (8 a.m. and 1 p.m.) with overhead minisprinklers. Approximately one week after emergence, seedlings were thinned to the most vigorous plant per cell. Soluble fertiliser containing a range of macro and micro-elements (13.7% N, 4.6% P, 22.5% K, 4.6% S, 0.22% Fe, 0.046% Zn, 0.013% Cu, 0.11% Mn, 0.046% B, 0.0016% Mo) was applied (2 g/ L) with a watering can at approximately weekly intervals, although applications were sometimes more or less than this frequency, so that the rate of seedling growth could be modified in accordance with the scheduled date for transplanting into the field. Approximately three weeks prior to planting into the field, the seedlings were transferred into a "harderiing-off' area with a retractable shade-cloth roof in which the duration of full sunlight was increased each day by winding back the roof until the plants were growing in full-sunlight. The seedlings were drenched separately with sodium molybdate (39% Mo, 0.67 g/ L) and Solubor (20.5% B, 1 g/ L) three days and one day prior to planting into the field, respectively. The roots from 10 randomly selected seedlings were cleared and stained (Koske and Gemma 1989) to determine the presence of VAM; none was detected.
Each whole plot (bed length 12 m) consisted of two subplots, each of length 6 m. Into the central 5.72 m of each subplot, 26 capsicum seedlings were transplanted 220 mm apart (Table 2.7); bed centres were spaced 1.36 m apart, resulting in a population of 33422 plants/ ha. Of the 26 plants per subplot, the three plants at each end were designated as buffer plants, resulting in 20 datum plants per subplot. In order to avoid transfer of VAM inoculum to the fumigated plots, seedlings designated for planting into these plots were completely planted prior to planting those designated for the unfumigated plots. As a precautionary measure against the seepage of CH3Br and CC13N02 under the plastic mulch from -VAM whole plots to adjacent +VAM whole plots during fumigation, replicates/ blocks were spaced 4 m apart. Due to the arrangement of beds used for the preconditioning phase, each replicate/ block was divided into three sets of six rows (separated by 1.64 m spray-tracks) to facilitate the application of pesticides; the outer two rows of each set of six rows were employed as guard rows. The procedures used to pump, filter, and chlorinate the desired amount of irrigation water to the root zone of the capsicum crop grown in the production phase are identical to those procedures used for the sweet corn crop grown in the preconditioning phase.
The following pesticides were applied: Bacillus thuringiensis, endosulfan, and methomyl for lepidopterous insects; copper hydroxide for bacterial spot (Xanthomonas campestris pv vesicatoria); pirimicarb for green peach aphid [Myzus persicae (Sulzer)]; propargite for two-spotted mite (Tetranychus urticae Koch); and diquat and paraquat for weed species. Sulfur was also applied for both bacterial spot and two-spotted mite control.
Nitrogen was supplied to all whole plots as one basal application of potassium nitrate prior to planting, and as nine fertigations of calcium nitrate during the life of the crop. However, depending on N treatment, whole plots selected for the Nj treatment (11-12) received nine

Section 2 - Vesicular-arbuscular mycorrhizal (VAM) component Pase 14
fertigations with urea, whereas whole plots selected for the N2 treatment (1-10) received 18 fertigations with urea. This differential application of N was achieved by closing in-line taps (inserted in the trickle tubing of Nj whole plots) during every second fertigation cycle with urea. Plants growing in the guard rows received the N2 treatment.
At regular intervals, sap was expressed from the petioles of the youngest mature leaves of approximately 40 randomly-chosen plants growing in the guard rows; a 20-fold dilution (deionised water) of this sap was measured by rapid colorimetric analysis (Merckoquant® test strips analysed with a Nitracheck nitrate meter) to monitor the N status of the crop. Because guard rows were supplied with the N2 rate, the sap nitrate concentrations measured in plants growing in these rows were considered similar to those of plants growing in the whole plots to which N2 was applied (viz. treatments 1-10). The rate and frequency of fertigation with calcium nitrate and urea were therefore varied during the life of the crop in an attempt to maintain petiole sap nitrate concentrations within, or above, the range in petiole sap nitrate concentrations reported by Olsen and Lyons (1994) associated with 95 and 100% of maximum marketable fruit yield for a capsicum crop grown in autumn (viz. 4980-5280 mg/ L at bud development, 5550-6000 mg/ L at first anthesis and 520-1220 mg/ L at fruit set). Following fruit set, the optimal petiole sap nitrate concentration was considered to be >500 mg/ L.
Temperature probes and an irradiance sensor were installed (from 2 April to 10 August 1995) outside the western perimeter of the trial area in which the production crop was growing so that they would not interfere with the standard machinery operations conducted during the life of the crop. Soil temperature (50 mm depth) was recorded in beds covered by the same plastic mulch used in the trial. However, no plants were grown in these beds, and, due to the cooling effects of shading by plants, the probes may have recorded soil temperatures which were slightly higher than those actually encountered in soil beds within the trial area. During the recording period, the following data were obtained: a mean soil temperature of 18.7°C (range from 8.4 to 28.3°C), a mean air temperature of 18.6°C (range from 3.9 to 30.6°C), and a mean irradiance of 12.1 MJ/ m2 day (range from 3.0 to 20.9 MJ/ m day).
Three plants were selected in each subplot for measurement of plant height (distance from the cotyledonary node to the terminal bud) and the width of the broadest part of the youngest mature leaf blade. The same three plants (identified by a small mark of brown acrylic paint on the plastic mulch adjacent to the plant) were measured 7, 14, 21, 35, and 49 days after transplanting.
The YMB+P was sampled from every second datum plant within each subplot at 32, 43, and 50 days after transplanting, corresponding with first anthesis, 80% flowering, and fruit set, respectively. To avoid taking YMB+Ps from the same datum plants at each sampling time, leaves were sampled from odd number plants (commencing at the first datum plant at the eastern end of each subplot) for the first and third samplings and from even number plants (commencing at the second datum plant at the eastern end of each subplot) for the second sampling. The sampled index leaves were immersed and gently agitated in a 1:40 solution of surfactanttap water; the surfactant (Extran 300 ) did not contain P. The samples were removed from this solution after one minute and then immersed and gently agitated in clean tap water for approximately 20 seconds, followed by several rinses with deionised water. Washed samples were placed separately in labelled paper bags which were placed in a forced draught oven at 65°C until the leaves were dry. The oven-dried leaves were ground through a 1 mm mesh in a stainless steel mill. Samples were dried again at 85°C before chemical analysis. Total N was
Section 2 - Vesicular-arbuscular mycorrhizal (VAM) component Page 15
determined using Kjeldahl digestion followed by automated colorimetry (O'Neill and Webb 1970), whereas P, K, S, Ca, Mg, Na, Cu, Zn, Mn, Fe, and B were measured using HN03
digestion and inductively coupled plasma emission spectrometry (Zarcinas et al. 1987).
On each occasion when index leaves were sampled from the field, one of the four outermost buffer plants from each subplot was carefully exhumed and transported back to the laboratory where the YMB+P and remaining tops were separated and placed separately in labelled paper bags which were placed in a forced draught oven at 65°C until the plant tissues were dry. The root system was kept for assessment of VAM colonisation. The dry weight of the YMB+P as a percentage of the total dry weight of tops was determined in order to check if removal of these index leaves was biasing future growth potential of plants from particular treatments.
The root system of each buffer plant exhumed at each of the three leaf samplings was washed, blotted dry with paper towels, cut into approximately 10 mm lengths, and a sample of approximately 1 g of randomly selected root pieces was taken from each root system for VAM determination and placed in 70% ethanol until processing. Sampled roots were cleared and stained using the methodology of Koske and Gemma (1989). The proportion of the length of roots colonised by VAM of the total root length (expressed as a percentage) was determined by the gridline intersect method (Ambler and Young 1977), observing 100 root intersections under a dissecting microscope (x30) to obtain a standard error of ±4% (Giovannetti and Mosse 1980).
On 31 May 1995 (72 days after transplanting), soil cores were taken from one disturbed subplot and from the nearest adjacent undisturbed guard row of replicates/ blocks 1, 2 and 4 to assess pore space and water retention characteristics. The intact core technique (Mclntyre 1974) was used, with cores of 72 mm diameter taken in 50 mm lengths from the surface as follows: 0-50, 50-100, 100-150, 150-200 mm. The extracted cores were transported to the laboratory in sealed containers where their moist field weight was measured; they were then placed in a forced draught oven at 105°C for 4 days to obtain the oven-dry weight. The following soil characteristics were calculated: Gravimetric moisture (%) = (mass ofwater/mass of oven-dry soil) x 100 Bulk density (g/cm3) = mass of oven-dry soil/ total volume of soil core Volumetric moisture (%) = (volume ofwater/total volume of soil core) x 100 Porosity (%) = (volume of pores/ total volume of soil core) x 100 Air-filled porosity (%) = (volume of air/ total volume of soil core) x 100
Capsicum fruit was harvested from the 20 datum plants grown in each of the 48 undisturbed subplots at 94, 108, 115, 129, and 143 days after transplanting (Table 2.7, Plate 2.3), then graded and weighed. Coloured fruit were harvested and considered marketable at >80 g in weight and if free from blemishes and deformation. Yield measurements from each harvest were added to give total yield values.
Following the final fruit harvest, tops of the 20 datum plants grown in all subplots (disturbed and undisturbed) were cut at ground level 147 days after transplanting (Table 2.7), placed in labelled hessian bags, dried in a tobacco barn at 85°C for nine days, and weighed. The tops of plants harvested from the undisturbed subplots were devoid of fruit, whereas plants harvested from the disturbed subplots had fruit attached, since fruit had not been previously harvested from these plants. These data were taken in order to compare the dry weights of tops of plants growing in the disturbed and undisturbed subplots.

Section 2 - Vesicular-arbuscular mvcorrhizal (VAM) component Page 16
Following the final fruit harvest, the root systems of three datum plants grown in each undisturbed subplot were randomly selected and carefully exhumed 149 days after transplanting (Table 2.7). Roots were washed, blotted dry with paper towels and separated into coarse roots (>2 mm diameter) or fine roots (<2 mm diameter); the coarse roots were then weighed and placed in labelled paper bags. Inspection of all washed roots revealed no Meloidogyne spp. galls in any subplot. The fine roots subsample was cut into approximately 10 mm lengths, weighed, and 2 weighed samples (approximately 1 g each) of randomly selected root pieces were taken for VAM and root length determination and placed in 70% ethanol until processing. The remaining roots were placed in labelled paper bags in a forced draught oven at 65°C until dry. Dry weight of the fine roots from each plot was estimated the dry weight sample. Dry coarse roots and fine root samples were ground separately through a 1 mm mesh in a stainless steel mill and analysed for starch using an enzymic-colorimetric procedure (Rasmussen and Henry 1990). Sample root lengths were determined using a root length scanner (Comair ), and the root length of the fine roots of plants grown in each undisturbed subplot was estimated.
Statistical Analysis Analysis of variance (ANOVA) was used to test the effects of treatments on the capsicum crop variables. A complete factorial analysis was not possible as only two of the five P rates (viz. P, and P2) were applied to the +VAM whole plots to which Nj was administered. Therefore, this embedded factorial structure (two VAM levels x five P rates) was ignored and treatments were regarded as 12 distinct strategies. ANOVA was used to test the effects of treatments on percentage VAM colonisation of roots and on length of roots colonised by VAM following inverse sine and square-root transformations, respectively. The transformations were conducted to protect against heterogeneous variance caused by the erratic (but generally low) colonisation of the -VAM whole plots. All treatment means were compared using the protected l.s.d. procedure operating at the 5% level of significance.
Economic Analysis A gross margin budget was performed on the fruit yield data obtained from the field trial. These data were corrected from that of a "scientist's" ha, in which there were no spray tracks, to a "grower's" ha, which includes spray tracks, using a multiplication factor of 0.8327. This multiplier was calculated on the presumption that a grower uses six row borders (1.36 m between bed centres) with 1.64 m spray tracks between each border.
RESULTS
Experiment 1 For the various plant parameters measured in this study, the VAM x P interaction was significant (PO.05) in most cases. However, where this interaction was not significant, it was deemed to be biologically important and was presented in the figures for consistency. The MPN study showed at least 9.45 viable propaguies/ g air-dry inoculum (not less than 12.3 propaguies/ mL), which was considered adequate to ensure high rates of colonisation for all species.
The high coefficient of variation for capsicum plant dry weight data (55%) resulted in a nonsignificant VAM x P interaction and necessitated the use of the loge transformation, which reduced the coefficient of variation to 18% and allowed a VAM x P interaction to be

Section 2 - Vesicular-arbuscular mvcorrhizal (VAM) component Pase 17
statistically demonstrated. At P b the transformed dry weight of +VAM capsicum plants was greater (PO.05) than that of-VAM plants, whereas at higher P rates, no significant differences between + and -VAM plants were obtained (Fig. 2.2a). At low rates of applied P, dry weight of + and -VAM sweet corn (Pb P2) and tomato (P^ plants did not differ. However, dry weights of +VAM plants were lower (PO.05) than those of -VAM plants at P3 for sweet corn (Fig. 2.3a) and at both P2 and P3 for tomato (Fig. 2.4a). Comparisons among the three species in the form of the response suggests that asymptotes were achieved by sweet corn and tomato at P rates between P3 and P4, but not by capsicum, even at P5. With the exception of P4 for sweet corn, application of comparatively high P rates (>P4) did not result in different total dry weights between +VAM and -VAM treatments for capsicum, sweet corn and tomato.
The capsicum RMD value at Pj was greater (P<0.05) than values at the higher P rates (Table 2.11). The high RMD at Pj reflected the 36 - fold weight advantage of +VAM over -VAM capsicum (Fig. 2.2a). The lower (PO.05) dry weights of +VAM sweet corn at P3 and +VAM tomato at P2 and P3 than -VAM plants were reflected in negative, but not significantly lower RMD values (Table 2.11).
Colonisation of capsicum roots by VAM at Pj (58.8%) and P2 (48.8%) was greater (PO.05) than at higher P rates (Fig. 2.2e). Colonisation was greatest at P! for both sweet corn (Fig. 2.3e) and tomato (Fig. 2.4e) roots. The addition of P5 reduced (PO.05) VAM colonisation of capsicum, sweet corn and tomato roots to 6.8,19.6 and 2.4%, respectively, of that obtained with P! (Figs 2.2e, 2.3e and 2.4e).
For both sweet corn (Fig. 2.3g) and tomato (Fig. 2.4g), P concentrations in the index tissues of +VAM plants at P! and P2 were higher (PO.05 for tomato at P2) than in -VAM plants. A similar result was obtained for capsicum (Fig. 2.2g), although the VAM x P interaction was not significant due to a high coefficient of variation. Loge transformation of capsicum data revealed that index tissue P concentrations in +VAM plants were greater (PO.05) than in -VAM plants (data not presented).
Experiments 2,3 and 4 For the various plant parameters measured in this study, the VAM x P interaction was significant (PO.05) in most cases. However, where this interaction was not significant, it was deemed to be biologically important and was presented in the figures for consistency.
Most Probable Number (MPN) Tests The MPN tests revealed 56.7 (Experiments 2 and 3) and 100.9 (Experiment 4) non-dormant infective propagules/ g air-dry inoculum at the commencement of the preconditioning phase. These concentrations were considered adequate to ensure high rates of colonisation for all species, including the nurse crop and the production crops.
Preconditioning Phase Sunflower nurse plants were grown to flowering in the preconditioning phase of all three experiments (Plate 2.4), when it was deemed (based on previous work and a higher incidence of P deficiency symptoms in -VAM plants than in +VAM plants [Plate 2.5]) that an intensive network of VAM hyphae had developed throughout each pot. In order to minimise the effects on the subsequent production crop of greater nutrient uptake and soil depletion by sunflower plants grown with live VAM inoculum than those sunflower plants grown with

Section 2 - Vesicular-arbuscular mycorrhizal (VAM) component Page 18
killed VAM inoculum, basal nutrients were re-applied at the end of the preconditioning phase.
Production Phase Concentrations of P which were considered critical for deficiency (Piggott 1986) or at the lower end of the 'normal' range (Weir and Cresswell 1993) for similar index tissues sampled at approximately the same phenological stage as in the present study may be summarised thus: 0.30% capsicum, 0.25% sweet com, 0.40% tomato.
Comparison of Experiments 2 and 3 atN] andN2
Dry Weight of Tops At P b top dry weight of +VAM plants was greater than top dry weight of -VAM plants for capsicum in Experiments 2 and 3, sweet com in Experiments 2 and 3 and tomato in Experiment 3, although this difference was only significant (PO.05) for sweet corn in Experiment 3. For the -VAM plants grown at P b plant tops displayed symptoms of P deficiency, such as stunted growth and necrosis of old leaves (capsicum and sweet corn) or stunted growth and purple colouration of stems and old leaves (tomato); these symptoms were most obvious in Experiment 3. At all higher P rates (^P2), dry weight of tops of -VAM plants was greater (P<0.05) than dry weight of tops of +VAM plants for capsicum in Experiment 3 and tomato in Experiment 2. A similar trend was observed for the remaining crop species/ experiment combinations, although differences were not significant at all P rates. For all three crops grown in Experiment 3, dry weight of tops of-VAM plants grown at P4 and P5 were lower (PO.05) than dry weight of tops of -VAM plants grown at P3. Except for tomato grown at P5, no similar yield decline was observed for -VAM plants grown in Experiment 2. Except for tomato plants grown in Experiment 3, N application increased (PO.05) dry weight of plant tops for all three crops grown in both experiments.
Relative Mycorrhizal Dependency (RMD) Values for RMD of plant tops tended to decline with each successive increase in P application (Table 2.12). At >P2 , all RMD values were negative, reflecting the higher dry weights of -VAM than of +VAM plants. The positive RMD values at the Pj rate in Experiment 3 reflected the greater (PO.05 for sweet com) dry weights of tops of +VAM plants than of-VAM plants; the mean dry weights of tops of+VAM plants were 28.5, 10.9 and 32.7 - fold greater than those of -VAM plants at P! for capsicum, sweet com and tomato, respectively. The addition of N increased (PO.05) RMD values of sweet com tops in both Experiments 2 and 3. However, RMD values were negative at both N rates for all three crops in both experiments.
VAM Colonisation of Roots No mycorrhizal colonisation of roots was detected for -VAM capsicum, sweet com or tomato plants grown in Experiments 2 and 3; only data pertaining to +VAM plants are presented hereafter in this section. Application of P reduced (PO.05) VAM colonisation percentage in roots of capsicum in Experiments 2 and 3 and in both sweet com and tomato roots in Experiment 2; colonisation in roots of sweet com and tomato plants grown in Experiment 3 tended to decline with applied P. Increased N concentration in the irrigation solution from 50 mg/ L to 200 mg/ L decreased (PO.05) colonisation of roots of capsicum in Experiment 3 and tomato in both Experiments 2 and 3, but had no effect on colonisation levels on capsicum
Section 2 - Vesicular-arbuscular mycorrhizal (VAM) component Page 19
in Experiment 2 or sweet corn in either experiment. The typical mycorrhizal structures found in association with the three crops are shown in Plate 2.6.
Index Tissue P Concentration For capsicum in Experiment 3 and tomato in Experiment 2, P concentrations in the index tissues of+VAM plants were higher (PO.05) than those in -VAM plants at Pj, P2 and P3. Concentrations of P were also higher (PO.05) in the 3YMB+P of +VAM than in -VAM tomato plants grown at Pj in Experiment 3. The P concentration in 3YMB+P of tomato grown at P5 in both Experiments 2 and 3 was higher (PO.05) for -VAM plants than for +VAM plants. For +VAM capsicum grown at >P2, P concentrations in the 6YMB+P were above the critical value (0.30%) in both Experiment 2 and 3. However, for -VAM capsicum plants, index tissue P concentrations were above the critical value at P5 only in Experiment 2 and >P4 in Experiment 3. For sweet corn, index tissue P concentrations exceeded the critical value (0.25%) at lower P rates in +VAM than in -VAM plants for both Experiment 2 (P5, +VAM; no P treatments, -VAM) and Experiment 3 (>P4, +VAM; P5, -VAM). In general, P concentrations in the 3YMB+P of tomato exceeded the critical value of 0.40% at similar P rates for +VAM and -VAM plants in both Experiments 2 and 3. Increased N concentration in the irrigation solution from 50 mg/ L to 200 mg/ L decreased (PO.05) the P concentration in index tissues of capsicum and sweet corn grown in Experiment 3, but increased (PO.05) index tissue P concentration of tomato grown in Experiment 2.
Comparison of Experiments 3 and 4 at N] Only
Total Dry Weight The combined-over-experiments ANOVA (non-orthogonal ANOVA because of unequal replication) revealed that the EXPT x VAM x P interactions were either significant (PO.05 for sweet corn) or nearly significant (P=0.052 for both capsicum and tomato). This result indicated that the pattern of differences was not the same in Experiments 3 and 4, and that the VAM x P interaction means should be presented separately for each experiment.
The total dry weight response curves for + and -VAM plants grown in both Experiments 3 and 4 tended to increase with applied P to approximately P3 for capsicum (Figs 2.5a and 2.6a), sweet corn (Figs 2.7a and 2.8a) and tomato (Figs 2.9a and 2.10a) plants. At higher P rates in Experiment 4, the yield plateaux were maintained for + and -VAM sweet corn and tomato and -VAM capsicum. However, for +VAM capsicum in Experiment 4 and + and -VAM plants of all 3 crops grown in Experiment 3, yields declined with increasing P supply above P3. At P,, dry weights of-VAM plants were less (PO.05) than those of+VAM plants for capsicum and tomato in Experiment 4 (Figs 2.6a and 2.10a, respectively) and for sweet corn in both experiments (Figs 2.7a and 2.8a). For both Experiments 3 and 4, -VAM plants grown at P! displayed P deficiency symptoms, including stunted growth and necrosis (and abscission) of old leaves (capsicum and sweet corn) or stunted growth and purple colouration of stems and old leaves (tomato). Phosphorus deficiency symptoms in -VAM capsicum plants grown at Pj in Experiment 4 are shown in Plate 2.7a. With the exception of capsicum plants grown in Experiment 4, dry weights of +VAM plants were less than -VAM plants with the application of ^P2, although the differences were not significant in all cases. In Experiment 4, application of P5 produced -VAM plants with greater (PO.05) dry weights than +VAM plants for all three crops, whereas no differences were measured for any crop at this P rate in Experiment 3.

Section 2 - Vesicular-arbuscular mycorrhizal (VAM) component Pase 20
The dry matter yield of +VAM plants as a percentage of -VAM plants was lower in Experiment 3 than in Experiment 4 at all P rates for capsicum (Figs 2.5a and 2.6a), and at P b
P2, P3, and P4 for both sweet corn (Figs 2.7a and 2.8a) and tomato (Figs 2.9a and 2.10a). At P3 (deemed to correspond with maximal yield in most cases), relative dry matter yield of +VAM plants as a percentage of-VAM plants in Experiments 3 and 4 were 68.4 and 88.0%, respectively for capsicum, 31.8 and 68.6%, respectively for sweet corn, and 7.95 and 62.1%, respectively for tomato. For capsicum grown at P3 in Experiment 4, a visual comparison of the relative sizes of+ and -VAM plants is shown in Plate 2.7b.
Root Weight Ratio For plants grown at Pj in Experiment 3, dry weight of roots expressed as a percentage of total dry weight (root weight ratio) was lower (P<0.05) for +VAM than for -VAM capsicum (Fig. 2.5b), sweet corn (Fig. 2.7b) and tomato (Fig. 2.9b). In Experiment 4, although root weight ratios of +VAM capsicum (Fig. 2.6b) and sweet corn (Fig. 2.8b) plants grown at P] were lower than root weight ratios of -VAM plants grown at the same P rate, these differences were not significant (P>0.05). In Experiment 3, root weight ratios of +VAM plants were higher (P<0.05) than those of -VAM plants for capsicum at P4 and P5 (Fig. 2.5b), sweet corn at P4 (Fig. 2.7b) and tomato at P2, P3, P4 and P5 (Fig. 2.9b). At P rates >P2 in Experiment 4, root weight ratios of +VAM plants were greater than those of -VAM plants for capsicum (Fig. 2.6b) and tomato (Fig. 2.10b), although the differences were not significant. For +VAM plants of all three production crops grown at >P2, root weight ratios were generally higher and total dry weights generally lower than -VAM plants, although differences (PO.05) were only coincident in Experiment 3 for sweet corn grown at P4 (Fig. 2.7) and tomato grown at P2, P3
and P4 (Fig. 2.9).
Relative Mycorrhizal Dependency The RMD values for whole plants were positive at Pi for all three crops grown in Experiments 3 and 4 (Table 2.12). These positive RMD values at P! reflected the greater (PO.05 for sweet corn in Experiment 3, and for all three crops in Experiment 4) total dry weights of +VAM plants than those of -VAM plants. For capsicum, sweet corn, and tomato plants grown at P b the mean total dry weights of+VAM plants were 19.3, 7.73 and 13.2-fold greater than those of-VAM plants, respectively, in Experiment 3, and 91.7, 10.9, and 17.9-fold greater than those of-VAM plants, respectively, in Experiment 4. With the exception of capsicum plants grown at P2 in Experiment 4, RMD values were negative at >P2 for all three crops, reflecting the generally lower total dry weights of +VAM plants than those of -VAM plants. The RMD values for Pj were higher (P<0.05) than those for P2, P3 and P4 for sweet corn in Experiment 3, >P3 for capsicum in Experiment 4 and >P2 for both sweet corn and tomato in Experiment 4.
VAM Colonisation of Roots Mycorrhizal colonisation was not detected in -VAM capsicum, sweet corn or tomato plants grown in either Experiments 3 or 4, and, therefore, only data pertaining to +VAM plants is presented in this section. Colonisation of capsicum roots by VAM at Pj was greater (P<0.05) than at P5 in Experiment 3 (Fig. 2.5e) and at all higher P rates in Experiment 4 (Fig. 2.6e). For sweet corn grown in Experiment 4, colonisation at Pi was higher (PO.05) than at P3 and P4, but not significantly different to colonisation at P2 and P5 (Fig. 2.8e).

Section 2 - Vesicular-arbuscular mycorrhizal (VAM) component Page 21
Root Starch Concentration The starch concentration in the roots of +VAM plants were lower (P<0.05) than those in the roots of -VAM plants at P b P2 and P3 for capsicum grown in Experiment 4 (Fig. 2.6h) and at P2, P3 and P4 for tomato grown in Experiment 3 (Fig. 2.9g). Although starch concentrations in the roots of +VAM plants were lower than those in the roots of -VAM plants at each rate of applied P for capsicum in Experiment 3 (Fig. 2.5h) and tomato in Experiment 4 (Fig. 2.10g), the VAM x P interaction effect was not significant (P>0.05), so pairwise comparisons could not be made. The ratio of the concentration of starch in the roots of +VAM plants relative to -VAM plants in Experiment 3 was less than half the value determined in Experiment 4 for both capsicum (Figs 2.5h and 2.6h) and tomato (Figs 2.9g and 2.10g) grown at each of P2, P3, and P4.
4.4.3.2.10 Total Starch in Roots The total starch content in the roots of -VAM plants was greater (PO.05) than that in the roots of +VAM plants at P2, P3 and P4 for tomato in Experiment 3 (Fig. 2.9h) and at >P2 in Experiment 4 for both capsicum (Fig. 2.6i) and tomato (Fig. 2.10h). At P b although the total starch content in roots of capsicum and tomato plants was higher for +VAM than for -VAM plants, the difference was only significant (PO.05) for capsicum grown in Experiment 4 (Fig. 2.6i).
4.4.3.2.11 Index Tissue P Concentration For all three production crop species grown in both experiments, P concentrations in index tissues of +VAM plants grown at P b P2 and P3 were higher than those in the -VAM plants grown at the same P rates, although differences were only significant (PO.05) for capsicum grown at P3 in Experiment 4 (Fig. 2.6j) and tomato grown at Pt and P3 in both Experiment 3 (Fig. 2.9i) and Experiment 4 (Fig. 2.10i).
At P5, P concentrations in index tissues of +VAM plants were greater than those in -VAM plants for capsicum in Experiment 4 (Fig. 2.6j) and sweet corn in Experiment 3 (Fig. 2.7g). Conversely for tomato grown at P5 in Experiment 3, P concentrations were higher in index tissues of -VAM than of+VAM plants (Fig. 2.9i). In Experiment 4, the mean P concentration in the 6YMB+P of+VAM capsicum plants grown at P5 (1.21%) was high, and possibly in the toxic range, and plants were stunted in the same way that symptoms of P excess were described for tomato by Bingham (1966).
Concentrations of P within the 6YMB+P of +VAM capsicum plants were in excess of the critical concentration for deficiency in comparable index tissue at all P rates in Experiment 3 (Fig. 2.5j) and >P3 in Experiment 4 (Fig. 2.6j). For -VAM capsicum plants, index tissue P concentrations were above the critical value only at >P4 in both experiments. Concentrations of P within the YMB of sweet corn and the 3YMB+P of tomato were in excess of the critical values at lower P rates for +VAM than -VAM plants in both Experiment 3 (>P3 +VAM, P5 only -VAM [sweet corn - Fig. 2.7g]; P3 and P5 +VAM, >P4 -VAM [tomato - Fig. 2.9i]) and 4 (>P4
+VAM, P5 only -VAM [sweet corn - Fig.2.8g]; >P3 +VAM, >P4 -VAM [tomato - Fig. 2.101]).
Field trial Preparation Phase Prior to the first harvest of tops of the sorghum crop, the estimated dry matter yield was 8.4 Xl ha. Although no estimation of yield was made prior to the second (final) harvest of tops, a

Section 2 - Vesicular-arbuscular mycorrhizal (VAM) component Pase 22
visual comparison of the tops suggested that the biomass prior to the second cut was slightly greater than that of the first. Cursory examination of the cleared and stained sorghum roots sampled on 23 January 1994 and 24 June 1994 showed VAM colonisation of approximately 25 and 40%, respectively.
Preconditioning Phase There was appreciable variation in the dry weight of tops of sweet corn plants harvested from both the 48 subplots in which the soil was to remain undisturbed (5.28-8.54 Xl ha) and the 48 subplots in which the soil was to be disturbed (4.84-8.89 Xl ha) prior to planting the capsicum seedlings in the production phase. No roots of the sweet corn plants were examined for VAM colonisation during the preconditioning phase. The MPN test conducted on soil sampled prior to the commencement of the production phase revealed 1061 non-dormant infective propagules/ g air-dry soil. This concentration was high and was certainly adequate to ensure high rates of colonisation of the capsicum transplants.
Production Phase The negative effect of soil disturbance on growth became apparent from 14 days after transplanting, when the mean width of the YMB of capsicum plants growing in disturbed subplots (2.53 cm) was lower (PO.05) than that of plants growing in the undisturbed subplots (2.68 cm); thereafter, the difference (PO.05) continued to increase. The height of capsicum plants growing in the disturbed subplots (16.8 cm) was lower (PO.05) than that of plants growing in the undisturbed subplots (18.5 cm) at 35 days after transplanting; the difference (PO.05) was larger when plants were measured at 49 days after transplanting (22.2 cm and 27.3 cm, respectively). Height x leaf width of plants growing in disturbed subplots was lower (PO.05) than the same calculation for plants growing in undisturbed subplots at 21 days after transplanting (44.9 and 53.5 cm , respectively); this difference progressively increased for the two later samplings at 35 and 49 days after transplanting.
The lower growth of the capsicum plants in the disturbed soil than that of those in the undisturbed soil was most likely related to poor aeration in the former soil as a result of heavy rainfall following the imposition of the soil disturbance treatment. Both air-filled porosity and porosity of the soil sampled from the undisturbed beds were higher (PO.05) than those of soil sampled from the disturbed beds; bulk density and volumetric moisture were lower (PO.05) in soil sampled from the former beds than those in soil from the latter beds. At 147 days after transplanting, the mean dry weight of tops (including fruit) of plants grown in the disturbed subplots (2.20 Xl ha) was lower (PO.05) than the estimated values for plants grown in the undisturbed subplots (3.79 Xl ha). Although top dry weights of plants grown in the disturbed subplots were lower than those of plants grown in the undisturbed subplots for every treatment combination, pairwise comparisons could not be made since the treatment x disturbance interaction was not significant (P>0.05). In view of (1) the detrimental effect of the disturbance treatment followed by heavy rainfall on the aeration properties of the soil and (2) the resultant poor growth of plants in these subplots, a decision was made to focus data collection on the plants growing in the undisturbed subplots.
Plant height, leaf width and plant height x leaf width of capsicum plants grown at N2 in the undisturbed subplots either with a live or a killed VAM network at P] (the lowest P rate) and P5
(corresponding with maximal fruit yields) are shown as a function of time (7-49 days after transplanting) in Figs 2.1 la, b and c, respectively. For each parameter, all treatments except -

Section 2 - Vesicular-arbuscular mycorrhizal (VAM) component Page 23
VAM plants grown at P! (which displayed a linear response over time), showed a sigmoidal growth response curve. The greater (PO.05) height, leaf width and height x leaf width of +VAM than of -VAM plants grown at Pj was first measured at 35 days after transplanting for all three parameters; thereafter the differences continued to increase. No differences were detected between + and -VAM plants grown at P5 at any measuring time. For +VAM plants grown at N ^ or at N2Pi, plant height and plant height x leaf width means did not differ at any measuring time (data not shown). With the exception of 21 days after transplanting, at which the mean leaf width of+VAM plants grown at NJPJ (3.58 cm2) was greater (P<0.05) than mat of+VAM plants grown at N ^ (2.98 cm2), leaf widths did not differ for +VAM plants grown at NjPj or at N2P! (data not shown). At 60 days after transplanting, a visual comparison of the relative sizes of + and -VAM plants growing at N2Pi is shown in Plate 2.8.
Irrespective of the N rate applied to +VAM plants or the time of sampling, the concentration of P in the YMB+P of+VAM plants grown at P b P2 and P3 was higher (P<0.05) than that of-VAM plants grown at the same P rates (Fig. 2.12a, b and c). In addition, at 43 and 50 days after transplanting, the P concentration in the YMB+P of +VAM plants grown at P4 was also higher (PO.05) than that of -VAM plants grown at the same P rate. With the exception of Pj at 43 days after transplanting, index tissue P concentrations of+VAM plants grown at N, and N2 did not differ (P>0.05) at common rates of P application (viz. Pt and P2). Concentrations of P within the YMB+P of +VAM plants were in excess of the critical concentration for deficiency, except for plants grown at N ^ at 32 days after transplanting and for those grown at N2Pj at all three sampling times. For -VAM plants, index tissue P concentrations were above the critical value only at ^P4 at all three sampling times.
At 43 and 50 days after transplanting, the concentration of N in the YMB+P of -VAM plants grown at Pj was greater (PO.05) than that of +VAM plants grown at the same rate of P in combination with either Nj or N2 (Fig 2.12e and/). However, at higher P rates, or at the earlier sampling time (Fig 2.12a*), N concentrations in the YMB+P of + and -VAM plants generally did not differ (P>0.05). For all 3 sampling times, the index tissue N concentrations of+VAM plants grown at Nj and N2 did not differ at common rates of P application (viz. Pj and P2). Concentrations of N in the YMB+P of both + and -VAM plants were well above the critical concentration for deficiency (viz. 3.0%) at all three sampling times.
The weight of all fruit response curve for +VAM plants grown at N2 tended to increase with applied P to approximately P3 (Fig. 2.13a); at higher P rates, a yield plateau was attained. However, for -VAM plants grown at N2, yields continued to increase with P application to approximately P4; yields did not differ between P4 and P5. Irrespective of the N rate applied to +VAM plants, weight of all fruit of +VAM plants grown at Pl5 P2, P3 and P4 was higher (PO.05) than that of -VAM plants grown at the same P rates. Weight of all fruit of +VAM plants grown at Nj and N2 did not differ (P>0.05) at common rates of P application (viz. P t
and P2).
The response curves of weight of marketable fruit for + and -VAM plants grown at N2 (Fig. 2.136) were similar to those for weight of all fruit at the same rate of N (Fig. 2.13a); viz., an increase with applied P to approximately P3, above which a yield plateau was attained (+VAM) and a continual increase with P application up to approximately P4 (-VAM). Irrespective of the N rate applied to the +VAM plants, weight of marketable fruit of +VAM plants grown at P b P2, P3 and P4 was higher (PO.05) than that of -VAM plants grown at the
Section 2 - Vesicular-arbuscular mycorrhizal (VAM) component Page 24
same P rates. The weight of marketable fruit of +VAM plants grown at Nj and N2 did not differ (P>0.05) at P2; however, at P1? the yield was higher (P<0.05) for +VAM plants grown at N, (30.3 t/ ha) than for those at N2 (22.6 t/ ha). The weight of unmarketable fruit did not differ among treatments (Fig. 2.13c).
Given that percent mycorrhizal colonisation of roots is based on a ratio of counts, and, also, that the majority of the data from the -VAM plants growing in the undisturbed subplots were low
(<14%), an inverse sine transformation (sin"1 yjp, where 100 x p is the percent VAM colonisation of roots) was performed on the data prior to ANOVA. At 32, 43, 50, and 149 days after transplanting, transformation of the data reduced the coefficients of variation in the ANOVA (48.3, 24.6, 28.4, and 15.1%, respectively) relative to the coefficients of variation in the ANOVA of the untransformed data (64.7, 33.7, 31.3, and 19.9%, respectively). The transformed and back-transformed means arising from this transformation are presented in Table 2.13. With the exception of +VAM plants grown at N2P5 at 32 days after transplanting, transformed means for mycorrhizal colonisation of +VAM plants were greater (PO.05) than those of-VAM plants at 32, 43, 50 and 149 days after transplanting (Table 2.13). For +VAM plants, the transformed means did not differ from one another at 32, 43 and 149 days after transplanting; however, at 50 days after transplanting, the transformed mean for +VAM plants grown at N ^ was greater than for those grown at the other treatments except for N ^ and N2P2 (Table 2.13). At 149 days after transplanting, the transformed means for mycorrhizal colonisation of the -VAM plants decreased (P<0.05) with P application.
For + and -VAM plants grown at N2, the starch concentration of fine roots tended to increase with P application to approximately P4 where a plateau was attained (Fig. 2.14e); however, pairwise comparisons could not be made since the ANOVA F-test for treatments (11 d.f.) was not significant (P>0.05). The starch concentration of the coarse roots of -VAM plants tended to increase with P application, with maximal values attained at approximately P4 and P5, whereas concentrations for +VAM plants remained relatively stable irrespective of P rate (Fig. 2.14/). However, pairwise comparisons could not be made since the ANOVA F-test for treatments (11 d.f.) was not significant (P>0.05).
At the N2 rate, which was in combination with all five P rates, the RMD values for both dry weight of whole plants and fresh weight of all fruit were comparable in magnitude and positive at all rates of P application (Table 2.14). For both measures of RMD (viz. dry weight of whole plants and fresh weight of all fruit), values tended to decline with increasing P application, although pairwise comparisons among P rates within each measure could not be made since the ANOVA F-test for the main effect of P application (4 d.f.) was not significant (P>0.05) in each case.
The response curves of gross margin for + and -VAM plants grown at N2 (Fig. 2.15) resembled those of weight of marketable fruit at the same rate of N (Fig. 2.136); viz. an increase with applied P to approximately P3, above which a yield plateau was attained (+VAM) and a continual increase with P application with a possible yield plateau at P5 (-VAM). An ANOVA was not conducted for the single values presented in Fig. 2.15; therefore, an l.s.d. value is not available for testing differences between points. However, marketable yield was a major determinant of gross margin, and the marketable yield for -VAM plants grown at N2P5 (at which the yield was maximal for -VAM plants) did not differ (P>0.05) from those of +VAM plants grown at all treatments except N2Pj (Fig. 2.136).

Section 2 - Vesicular-arbuscular mycorrhizal (VAM) component Pase 25
Therefore, it is plausible that the gross margin values corresponding with these treatments also did not differ. Using the same rationale, it is likely that gross margins for +VAM plants grown at P(, P2, P3 and P4 were higher than those of -VAM plants grown at the same P rates given the greater (P<0.05) weight of marketable fruit of + than of -VAM plants at these P rates (Fig. 2.136). Gross margins were negative for -VAM plants grown at N2Pi, N2P2 and N2P3 and for +VAM at N2Pj.
DISCUSSION
Although 10.7 kg of air-dry soil was placed into each pot in Experiment 1 versus 12.0 kg of air-dry growth medium in Experiments 2, 3 and 4, the volume of the soil and the growth medium within each pot in the different experiments was the same (viz. 8200 cm ); the amount of Ca(H2P04)2.H20 applied to each pot (10 L bucket) at each rate of P was also the same for all four greenhouse experiments. Therefore, if one assumes a depth of fertiliser incorporation into a field soil of 15 cm, 5.47 mg P/ pot was equivalent (on a soil volume basis) to 1 kg P/ ha; using this conversion factor, the rates of P applied in the greenhouse experiments (Pb P2, P3, P4 and P5) corresponded with 0, 20, 60,180 and 540 kg P/ ha, respectively.
Effect of Applied P on VAM Colonisation Mycorrhizal colonisation of roots tended to decline with applied P for all three crops grown in the greenhouse experiments and for capsicum plants grown in the field trial, although the magnitude of the decline was greatest in Experiment 1. The rate of decline was most prevalent between 0 and 180 kg P/ ha in all experiments. Whereas the highest rate of P application in the greenhouse (540 kg/ ha) reduced colonisation to trace levels for all three crops grown in Experiment 1 (1.0-12.0%), much higher colonisation occurred at this P rate in the other greenhouse experiments (29.1-66.8%). A possible explanation for this response may relate to the total number of viable VAM propagules and their distribution within the soil prior to sowing or planting the production crop. In Experiments 2, 3 and 4 and the field trial, an extensive fungal mycelium had been formed, whereas in Experiment 1, 50 g of air-dried inoculum was spot-placed in the centre of pots just below the soil surface. The frequency of contact between roots growing into the soil and VAM propagules would have been far greater in those experiments in which a mycorrhizal network had been formed previously, than in Experiment 1, in which initial root contact with viable propagules would have been high, followed by reduced exposure, as roots grew into the surrounding fumigated soil. It is proposed, therefore, that the widely-held view that addition of P fertiliser reduces VAM colonisation of roots may not be correct in soil with an existing mycelial network, since the high inoculum potential of the soil prior to P application may over-ride the effect to some degree. The importance of a mycelial network as a component of the inoculum potential of an undisturbed soil has been reported previously (e.g. Jasper et al. 1989a, Evans and Miller 1990).
Another explanation for the relatively larger decline in VAM colonisation of roots of plants with P application in Experiment 1 than in the other experiments may relate to the method by which P was applied to the soil. For Experiment 1, P was mixed throughout the soil, whereas for the remaining work, P was either spot-placed (Experiments 2, 3 and 4) or placed in a narrow band (field trial) in the soil adjacent to the germinated seeds or transplants. In all experiments, VAM colonisation percentage was determined for roots which had grown within the entire volume of available soil/ growth medium within each pot (Experiments 1 and 2), root exclusion cage (Experiments 3 and 4) or field bed (field trial). For Experiments 2, 3 or 4 or the field trial,

Section 2 - Vesicular-arbuscular mycorrhizal (VAM) component Page 26
therefore, colonisation percentage was determined for roots growing both within and outside the localised P-source. Due to the relatively low volume of these localised P-sources, even at the highest rate of application, the majority of roots probably grew outside these fertiliser zones. Therefore, the colonisation data for these experiments was probably more a reflection of roots growing outside than within the P-zones. Consequently, VAM colonisation of roots growing within the P fertiliser zones of the high P treatments may have been significantly depressed, even though overall values were high. This hypothesis supports the finding of Lu et al. (1994) that arbuscular colonisation of maize roots growing outside the zone of P placement was greater than that of roots growing inside; the fertiliser bands used in their trial varied from 3-25% of bed volume and P rates ranged from 0-100 kg/ ha. The agronomic implication of this scenario is that although a fertiliser band may reduce VAM colonisation of roots in the band volume, the VAM symbiosis may be well developed outside this volume and be an important contributor to the P nutrition of the plant.
For plants grown at 540 kg P/ ha (278 mg P/ kg oven-dry soil) in Experiment 1, colonisation data was determined for roots which were entirely in contact with fertilised soil, albeit at a lower P level than within the bands of the other experiments. The low colonisation of roots of plants at this P rate in Experiment 1 may have resulted as a direct effect of soil P on the early production of infective hyphae. Supporting evidence for this hypothesis was presented by Miranda and Harris (1994) who thoroughly mixed a Brazilian Oxisol with C a ^ P O ^ . F ^ O at 3 rates (0, 25 and 250 mg P/ kg soil) and then transplanted 7-day-old sorghum seedlings (roots wrapped in tissue paper containing 100 Glomus etunicatum spores) into the fertilised soil. At 7 days after transplanting, they found that the length of hyphae were 30.9, 24.2 and 4.7 m/ g soil for 0, 25 and 250 mg P/ kg soil, respectively. Miranda and Harris (1994) deemed that this reduction in hyphal length was caused by the direct effects of soil P during the lag phase of growth of the fungus from the germinating spores, and stated that the direct effect of soil P could subsequently reduce the development of entry points and interfere with the normal spread of the fungus.
Effect of VAM Colonisation on Growth Response In Experiment 1, the greater (PO.05) RMD value for capsicum plants grown at 0 kg P/ ha than at higher P rates (Table 2.15) was associated with a 37.5-fold increase in dry weight of whole tops of +VAM than of -VAM plants; RMD values for capsicum plants successively decreased with P application. For sweet corn and tomato plants grown in Experiment 1, RMD values were negative at <60 kg P/ ha; the dry weight of whole tops of +VAM plants were lower (PO.05) than those of -VAM at 60 kg P/ ha for sweet corn and at both 20 and 60 kg P/ ha for tomato. At higher P rates, the RMD values for the three crops were close to 0; with the exception of sweet corn at 180 kg P/ ha for which there was a positive (PO.05) dry weight response to VAM, these RMD values were associated with similar (P>0.05) dry weights of whole tops of+VAM and -VAM capsicum, sweet corn and tomato plants grown at either 180 or 540 kg VI ha.
In Experiments 3 and 4, the positive RMD values for all three crops grown at 0 kg P/ ha reflected the greater (PO.05 for capsicum in Experiment 4 and for sweet corn in Experiments 3 and 4) dry weight of whole tops of +VAM than those of -VAM plants. For capsicum, sweet corn and tomato plants grown at 0 kg P/ ha, the mean dry weights of whole tops of +VAM plants were 28.5, 10.9 and 32.7-fold greater than those of -VAM plants, respectively, in Experiment 3, and 98.3, 12.1 and 17.3-fold greater than those of-VAM plants, respectively, in

Section 2 - Vesicular-arbuscular mycorrhizal (VAM) component Page 27
Experiment 4. With the exception of capsicum plants grown at 20 kg P/ ha in Experiment 4, RMD values were negative at >20 kg P/ ha for all three crops grown in Experiments 3 and 4, indicating the generally lower dry weights of whole tops of+VAM relative to -VAM plants.
Except for sweet corn plants grown at 0 kg P/ ha, the RMD values were negative at the five rates of applied P for all three crops grown in Experiment 2; this result reflected the lower dry weight of whole tops of+VAM than those of-VAM plants (PO.05 for tomato plants grown at 20 kg P/ ha and for all three crops grown at >60 kg P/ ha). Conversely, capsicum plants grown in the undisturbed subplots of the field trial displayed only positive RMD values at all five rates of applied P, with the dry weight of whole tops of+VAM plants greater (PO.05) than that of-VAMat<15kgP/ha.
Factors Influencing the Effect of VAM Colonisation on Growth Response
Increased Uptake ofP The enhancement of plant growth by VAM colonisation of roots is generally attributed to increased uptake of P (Abbott and Robson 1984, Creighton Miller et al. 1986, Jeffries 1987). The results of the greenhouse experiments and field trial are consistent with this hypothesis, since the growth response due to VAM colonisation at low P rates corresponded with generally higher P concentrations in index tissues of +VAM plants relative to -VAM (PO.05 at 0 kg P/ ha for capsicum in Experiment 3 and the field trial and for tomato in Experiments 2, 3 and 4. Except for capsicum plants grown in Experiment 4, index tissue P concentrations of +VAM plants were not greater (P>0.05) than those of-VAM for any of the three crops grown at >60 kg P/ ha in any experiment; this trend indicates that the improved P nutrition resulting from mycorrhizal colonisation was abated at high P rates. The P nutrition of +VAM and -VAM plants grown in the various components of this study was probably modified by the experimental features described in the following sections.
Efficacy of a VAM Network Versus Added Inoculum The concentrations of P in the index tissues of +VAM plants were equal to or in excess of the critical value for deficiency at lower rates of P application in those experiments in which a mycorrhizal network was developed prior to sowing or planting (Experiments 2, 3 and 4 and the field trial), than in Experiment 1, in which inoculum was added to the soil at the time of sowing; all soil/ growth media used in Experiments 1, 2, 3 and 4 and the field trial were low in available P (6, 6, 6, 5 and <14 mg NaHC03-extractable P/ kg, respectively). This result may reflect (l) the greater efficiency of an established hyphal network in enhancing the P uptake by the crop than a mycorrhizal system which was formed de novo by the plant as a result of the addition of inoculum to the soil and/ or (2) the rapid decline with P addition of VAM colonisation of roots of plants grown in Experiment 1, leading to a reduced capacity to absorb P from the soil.
Role of the Root Exclusion Cage Experiments 2 and 3 were run concurrently, and, with the exception that a root exclusion cage was not used in Experiment 2, all other treatments were identical. The much lower RMD values for the three crops grown at 0 kg P/ ha in Experiment 2 than in Experiment 3 (Table 2.15) may be attributed to the use of the root exclusion cage in Experiment 3, which prevented the roots of -VAM plants from reaching any residual fertiliser P remaining from the preconditioning phase; no such obstruction to root growth occurred in Experiment 2. The P concentrations measured in index tissues of -VAM plants grown at 0 kg P/ ha in Experiments 2

Section 2 - Vesicular-arbuscular mycorrhizal (VAM) component Page 28
and 3 were approximately equal, however, suggesting that the better growth of -VAM plants at 0 kg P/ ha in the former than in the latter experiment may have led to a dilution of P in index tissues (Jarrell and Beverly 1981).
The C-Drain In the greenhouse experiments, there was a tendency towards a growth depression of +VAM relative to -VAM plants at >20 kg P/ ha (Table 2.15), and lower starch concentrations in roots of mycorrhizal than those of nonmycorrhizal plants at all P rates. Conversely, in the field trial, the dry weight of whole tops and the starch concentrations in roots of +VAM capsicum were generally greater than and greater than or equal to, respectively, those of -VAM plants. Although the actual C-drain by the fungal endophytes was not quantified in the present study, these comparisons support the hypothesis that the growth depression measured in the greenhouse experiments may be attributed to insufficient production of photosynthate by +VAM plants to meet the C demand of both host and endophyte. In the field trial, however, it can be concluded that production of photosynthate was in surplus to the requirements of the plant and fungus, and hence, no growth depression occurred.
The variable size of the depression in growth of+VAM relative to -VAM capsicum, sweet corn and tomato crops grown in the different experiments of this study suggests that the magnitude of the C-drain by the endophytes as a percentage of the rate of C assimilation from photosynthesis was not constant. It is possible that a number of factors inherent within the different experiments were responsible for modifying the size of this C-drain. Some of these possible factors are listed as follows.
Type of Host Plant Within each greenhouse experiment, the growth depression of +VAM relative to -VAM plants was generally greater for capsicum or tomato than for sweet corn, since RMD values for the two former crops were usually more negative than those for the latter crop (Table 2.15). This trend may reflect the greater propensity of capsicum and tomato than that of sweet corn to release C to the fungus for "mycorrhizal-related activities". This characteristic may be equated to the "leakiness" or permeability of root membranes to soluble carbohydrates, a propensity which is believed to be the mechanism by which mycorrhizal formation is stimulated in roots with a low P concentration (Cooper 1984).
Effect of VAM on the Root Weight Ratio of the Plant When P was applied (>20 kg P/ ha) in the greenhouse experiments, the root weight ratios tended to be higher for +VAM than for -VAM plants (PO.05 in Experiment 3 for capsicum at 180 and 540 kg P/ ha, for sweet corn at 180 kg P/ ha and for tomato at 20, 60, 180 and 540 kg P/ ha), whereas the dry weight of whole tops were generally lower for mycorrhizal than for nonmycorrhizal plants, as indicated by negative RMD values in Table 2.15. Therefore, the comparatively higher root weight ratios of +VAM than of -VAM plants grown at >20 kg P/ ha in the greenhouse reflected a lowered C-source capacity to supply the additional photosynthate required by the fungus and the colonised host-root tissue. The root weight ratio of +VAM and -VAM capsicum plants did not differ in the field trial.
Irradiance and Temperature

Section 2 - Vesicular-arbuscular mycorrhizal (VAM) component Page 29
Compared with the other experiments, the low irradiance estimated in the greenhouse during the production phases of Experiments 2 and 3 (8.4 MJ/ m2 day, Table 2.16) was likely to be the dominant reason for the trend towards much lower yields of+VAM than of -VAM plants when >20 kg P/ ha was applied. The explanation may be attributed to the C use efficiency model developed by Tinker et al. (1994), who defined efficiency in terms of the C gained by the plant via the growth response to VAM colonisation and the C loss by the plant to support the fungus. In low light conditions, they stated that the plant would be expected to be in a C-source-limited condition, and any C-drain would result in a growth reduction.
The lower values of RMD (Table 2.15) and the tendency towards the lower ratio of starch concentration in roots of+VAM relative to -VAM plants in Experiment 3 than in Experiment 4 or the field trial suggested that a reduced availability of photosynthetically-derived C in association with the C-drain imposed by the endophytes was a major limitation to growth of the +VAM plants in Experiment 3. The same assumption may be made for Experiment 2, although starch concentrations of roots were not determined in this experiment to support this hypothesis.
Despite similar irradiance in the production phases of Experiment 4 (13.4 MJ/ m2 day) and the field trial (12.1 MJ/ m day), a growth depression due to colonisation by a VAM network (as determined by negative RMD values in Table 2.15) was measured in Experiment 4 when >20 (capsicum) or >20 (sweet corn and tomato) kg P/ ha was applied; no such growth depression of +VAM relative to -VAM capsicum plants was measured in the field trial. A possible explanation for this result may be attributed to the higher temperatures encountered by plants during Experiment 4 than during the field trial (Table 2.16).
For temperatures ranging from approximately 14-26°C, Glover (1973) found that dark respiration (R, mg C02/ minute kg dry weight) of whole tops of sugar cane was logarithmically (R=2.0691ogT-2.1607, r2=0.72) related to night temperature (T, °C). Assuming a similar relationship exists for capsicum, sweet corn and tomato, and, that the rate of photosynthesis increases to a lesser degree with higher temperatures, it is plausible that the percentage loss of gross photosynthate due to respiration was greater at the warmer temperatures encountered during Experiment 4 than at the cooler temperatures recorded during the field trial (Table 2.16). Accordingly, the availability of photosynthate to plants grown in Experiment 4 may have been reduced to a level which was insufficient to meet the C demand of both host and endophytes. Such a hypothesis may explain the lower starch concentrations of roots of +VAM relative to -VAM capsicum and tomato plants in Experiment 4 compared with the similar values for +VAM and -VAM capsicum plants in the field trial.
Nature of the VAM Inoculum The mycorrhizal colonisation percentage of roots of each crop species was similar in the work in which a VAM network was developed prior to sowing or planting (viz. Experiments 2, 3 and 4 and the field trial). When P was applied in these experiments, the large growth depression of +VAM relative to -VAM plants in the greenhouse, but not in the field, suggests that the mix of VAM species present in the greenhouse work may have been more aggressive in extracting C from the roots of host plants than for those species of mycorrhizae present in the field trial. Although growth depression of +VAM relative to -VAM plants grown at >20 kg P/ ha was extremely common in Experiments 2, 3 and 4, the effect was less frequent in Experiment 1. The lower colonisation of roots by VAM in Experiment 1 than in the other experiments at >60

Section 2 - Vesicular-arbuscular mycorrhizal (VAM) component Pase 30
kg P/ ha may have been one of the most important factors in minimising the C-drain by the endophytes in the former experiment.
P Sufficiency of the Plant The size of the enhancement/ depression in growth of+VAM relative to -VAM capsicum, sweet corn and tomato crops at different rates of P application was variable in Experiments 2, 3 and 4. Based on the RMD values presented in Table 2.15, it may be interpreted that the magnitude of the C-drain tended to increase from low to medium P rates and then remain constant or decrease with further application. However, VAM colonisation of roots declined with increasing P for the three crops grown in most of Experiments 2, 3 and 4 and the starch concentration in roots of +VAM (relative to -VAM) plants did not vary (P>0.05) with P rate for capsicum in Experiment 3 and tomato in Experiment 4. Therefore, the tendency towards lower dry weight of whole tops of +VAM relative to -VAM plants grown at >20 kg P/ ha in Experiments 2, 3 and 4 was probably not a direct result of P application on the magnitude of the C-drain by the endophytes.
Liebig's Law of the Minimum The law of the minimum, formulated by Justus von Liebig in 1840, states that the element least plentiful in proportion to the requirements of a plant becomes the factor most limiting to growth. This law has direct relevance to the present study, since the growth response of vegetable crops colonised by an established mycorrhizal mycelium appeared to be dependent upon a critical balance of P and C supply. For example, concentrations of starch in roots tended to be lower for +VAM than for -VAM capsicum and tomato at all rates of P application in Experiments 3 and 4. Therefore, C may have been the element most limiting to the growth of +VAM plants due to the additional demand for photosynthate imposed by the endophytes on the host. Despite generally higher concentrations of P in index leaves of +VAM than of -VAM capsicum and tomato grown in Experiments 3 and 4 (PO.05 for capsicum at 0, 20 and 60 kg P/ ha in Experiment 3 and at 60, 180 and 540 kg P/ ha in Experiment 4 and for tomato at 0 kg VI ha in Experiment 3 and at 0 and 60 kg P/ ha in Experiment 4, the concentrations for nonmycorrhizal plants were in excess of the critical value for deficiency when >180 kg P/ ha was applied. Therefore, the tendency towards the greater dry weight of whole tops of +VAM than that of -VAM capsicum and tomato plants at only 0 kg P/ ha in Experiments 3 and 4 (PO.05 for capsicum in Experiment 4) suggests that P was the most limiting element to the growth of nonmycorrhizal plants at just this rate of P application. With the addition of P, C then became the element most limiting to the growth of +VAM relative to that of -VAM plants. A diagrammatic representation of this effect is shown in Fig. 2.16a.
In the field trial, however, the concentration of starch in roots of +VAM capsicum were generally greater than or equal to those of -VAM plants, suggesting that C supply was probably not a limitation to growth of the mycorrhizal plants. The greater (PO.05) dry weight of tops (data not presented) and concentration of P in index leaves of +VAM than those of -VAM capsicum at 0, 5 and 15 kg P/ ha in the field trial indicates that growth of the nonmycorrhizal relative to that of mycorrhizal plants was limited by P supply (Fig. 2.166).
Other Issues Some other issues which may have contributed to the growth responses of plants to VAM colonisation of roots in the greenhouse experiments and the field trial are described as follows:
5*o// Moisture Content

Section 2 - Vesicular-arbuscular mycorrhizal (VAM) component Pase 31
It is possible that at intermediate to high rates of P application in the greenhouse, the growth depression of the whole tops of capsicum, sweet corn and tomato plants grown in association with VAM inoculum (Experiment 1) or a mycorrhizal network (Experiments 2, 3 and 4) may be partially attributed to the comparatively higher soil moisture content in pots due to the constant watertable method (particularly at the bottom of pots near the watertable) than in the field trial, in which tensiometer suction in the root zone (0-40 cm) was maintained between 10 and 50 kPa.
Restricted Root Volume The growth depression of whole tops of +VAM relative to -VAM capsicum, sweet corn and tomato plants grown at intermediate to high rates of P application in the pot experiments, but not in the field trial, may be linked to the restricted root volume available to plants grown in pot culture. Even though plants grown in these pot experiments were harvested prior to becoming visibly root-bound, it is possible that the restricted root volume invoked a physiological response which greatly impaired the growth of the +VAM relative to the -VAM plants. In the unrestricted root volume of the field soil, such a physiological response may not have been operative.
WHAT ARE THE RECOMMENDATIONS?
To Industry For growers wishing to incorporate VAM into their production system, it is recommended that a number of commercial inocula be tested on a farm by farm basis in order to ascertain the most beneficial in each situation, since the efficacy of different mycorrhizal species to enhance plant growth varies, depending on the environment. This work suggests that improved P nutrition of plants can result from an undisturbed network than from inoculum which is added to the soil. Rotation of crops which are planted into the undisturbed soil beds of previous crops is an ideal way to develop and maintain mycorrhizal networks in the soil. Phosphorus application to these beds, if deemed necessary, should be made as a narrow band in order to avoid disturbance of the network and to minimise the overall decline of subsequent colonisation of roots; incorporation of P throughout the bed will destroy the network and will most likely reduce future colonisation due to the direct effects of soil P on the spread of the fungus. Growers of greenhouse vegetables should ensure that daily irradiance exceeds 13.4 Mil m for maximal yields of vegetable crops colonised with VAM, since irradiance within the greenhouse appears to be of great importance in determining the growth response to mycorrhizae.
Based on the findings of greenhouse Experiment 1, the likelihood of a significant field response to VAM inoculation of seedling capsicum (the most responsive crop species) is small, given that most currently-cropped agricultural soils in the Bundaberg district have adequate levels of NaHC03-extractable P (>30 rng/ kg). In the case of tomato, seedling inoculation with VAM prior to transplantation into a soil with moderate P fertility not high enough to limit mycotrophic growth may actually reduce plant growth compared with an uninoculated control. Use of an efficient VAM strain for tomato may reverse this scenario. These recommendations, however, are based on the results of a pot study conducted in a greenhouse; a field trial is required to test the validity of these extrapolations. Based on the results of the field trial, an economic analysis was conducted with the view to making recommendations to conventional growers of capsicum regarding the costs/ benefits of

Section 2 - Vesicular-arbuscular mvcorrhizal (VAM) component Pase 32
incorporating a VAM network into their farming system. The analysis revealed that the saving in the cost of P fertiliser from mycorrhizal colonisation of the roots of host plants is relatively small for intensively grown vegetable crops because the cost of P is low compared with total costs. Apart from enhanced P nutrition, other benefits of VAM (such as increased tolerance to water stress, decreased susceptibility to disease and improved soil structure), however, are difficult to quantify. In the interest of achieving maximal yields (a major determinant of profitability), it is suggested that the risk-averse grower can apply P in one simple and inexpensive operation which gives a consistent result. Conversely, it has been shown by others there are numerous cultural and environmental factors which may affect the efficacy of the VAM network to enhance P uptake by the host plant. It is plausible, however, that future conditions such as a dramatic rise in the price of P fertiliser or the introduction of legislation restricting P usage may change the economic incentive of using a mycorrhizal networks in intensively-grown, VAM-dependent crops such as capsicum. Until then, however, there appears to be little economic incentive for the conventional vegetable grower to adopt mycorrhizae in their production system.
To Researchers In the greenhouse component of this study, the growth of +VAM in relation to -VAM plants was generally enhanced at low P but depressed at high P rates. Therefore, this work indicates that assessment of the effect of VAM colonisation of roots on plant growth should be made at a range of P rates encompassing the complete response curve. The reason for the different responses of +VAM relative to -VAM plants most likely depended upon a critical balance between P and C supply. An improved understanding of the effects of VAM colonisation of roots on growth response would result if basic mycorrhizal research includes temporal assessment of colonisation, plant yield, index tissue P concentration and starch concentration of roots. The P-level of the unfertilised soil/ growth medium should be measured, the colonising fungal species identified and the number of non-dormant infective propagules in the inoculum enumerated in an MPN test to assist in comparing responses with those of other studies.
This work suggests that environmental factors (such as irradiance and/ or temperature and/ or soil moisture content) can greatly modify the plant response to VAM; researchers should be cognizant of this possibility and at least measure and report these variables in their experiments. Plant responses to mycorrhizal colonisation in greenhouse experiments may not accurately reflect the field response; care should be taken when extrapolating the results of greenhouse experiments to the field. The reluctance of scientists to pursue mycorrhizal studies in the field (Powell and Bagyaraj 1984, Bagyaraj and Varma 1995) suggests that the variability of results may be difficult to interpret. Although relevant to both greenhouse and field trials, it is suggested that the following measures are taken to minimise the variability of response in field trials: (1) select a site with a low-P soil, (2) use a mycorrhizal source (in situ or imported) with a high inoculum potential, (3) employ control treatments which are identical to the +VAM treatments in all respects without the VAM fungus, (4) select a mycorrhizal-dependent plant species as the host crop and (5) maintain strict hygiene procedures to minimise transfer of VAM inoculum to control plots.
WHAT FURTHER RESEARCH IS REQUIRED? The present study showed that roots of plants growing into an extraradical mycelial network became heavily colonised, even at high rates of P application to the soil and in association with high P concentration in index tissues. It was suspected that the high inoculum potential of the

Section 2 - Vesicular-arbuscular mycorrhizal (VAM) component Pase 33
undisturbed mycelial web over-rode the normal depressant effect of P on VAM colonisation. However, application of P to the soil as a band may have also limited the depressant effect of P application on colonisation, since the effect may have been localised to only those roots growing within or near the P-band. Further research is required to investigate the effect of P application as a narrow band to soil with a mycelial web on the distribution and intensity of colonisation of roots of a crop planted into this system.
It was shown in the current study that the growth responses due to VAM colonisation of roots were dominated by a critical balance between P and C supply to the host plant. Further study is required to better define the relationship between P-enhancement versus C-cost by the endophytes on plant hosts and to establish a set of conditions for which growth enhancement of the host occurs. It would be helpful if predictive tools can be developed to facilitate decisionmaking re the likelihood of enhanced plant growth from VAM colonisation prior to the introduction of inoculum into a system.
The same VAM fungi in the greenhouse experiments depressed the growth of+VAM relative to -VAM plants when P was applied to a greater extent for capsicum and tomato than for sweet corn. It was suggested that this trend may reflect the greater propensity of capsicum and tomato than sweet corn to release C to the fungus for "mycorrhizal-related activities". Further research is required to explore the validity of this argument, and, if found to be true, to understand the mechanisms involved.
Contributing to the C deficiency and growth depression of +VAM relative to -VAM capsicum supplied with P in the greenhouse experiments was a tendency towards a greater root weight ratio in mycorrhizal than in nonmycorrhizal plants. In the field trial, however, in which mycorrhizae enhanced growth and did not impose a debilitating demand for photosynthetically fixed C, there was no difference in root weight ratio values between +VAM and -VAM capsicum. The reason for an increased root weight ratio of +VAM relative to -VAM capsicum in the greenhouse, but not in the field is unclear. An understanding of this phenomenon may better explain different responses to VAM colonisation in greenhouse and field experiments.
It was suggested that differences exist in the ability of VAM species to enhance or depress plant growth at a given level of soil P. More research is needed to define the characteristics which make fungi efficient at enhancing growth. Specifically, fungi with low C use per unit P transported should be identified and studied to understand how the fungus regulates this ratio of exchange.
In theory, there should be a greater ability to enhance plant growth of an existing VAM network than one which must be formed de novo from inoculum which is added to the soil, since the investment of C by the growing plant should be considerably less in the former than in the latter case. Whereas index tissue P concentrations of +VAM plants grown in the greenhouse tended to be enhanced in those experiments which employed a VAM network than in one in which inoculum was added at seed sowing, large growth depressions of plants grown in the former experiments occurred. Starch concentrations in roots of these +VAM plants were lower than in the -VAM controls, indicating that a C-deficiency was responsible for the growth depression. The C relations with a host plant of an existing hyphal mycelium versus a disturbed soil, both with a high inoculum potential, should be investigated in order to better understand the C dynamics of the two systems.

Section 2 - Vesicular-arbuscular mycorrhizal (VAM) component Page 34
Finally, no discussion of recommendations for further research into VAM would be complete without stating that a major impediment of current research is our inability to grow these organisms in pure culture. If such a technique could be developed, the risk of introducing pathogens into experiments would be minimised and it would be much more convenient to conduct basic mycorrhizal research in general.
REFERENCES Abbott, L. K., and Robson, A. D. (1984). The effect of VA mycorrhizae on plant growth. In
'VA Mycorrhiza'. (Eds C. L. Powell and D. J. Bagyaraj.) pp. 113-30. (CRC Press, Inc.: Boca Raton, Florida.)
Ambler, J. R., and Young, J. L. (1977). Techniques for determining root length infected by vesicular-arbuscular mycorrhizae. Soil Science Society of America Journal 41, 551-6.
Bagyaraj, D. J., and Varma, A. (1995). Interaction between arbuscular mycorrhizal fungi and plants - Their importance in sustainable agriculture in arid and semiarid tropics. Advances in Microbial Ecology 14,119-42..
Barrow, N. J. (1967). Studies on extraction and availability to plants of adsorbed plus soluble sulphate. Soil Science 104,242-9.
Beaton, J. D., Burns, G. R., and Platou, J. (1968). Determination of sulfur in soils and plant material. Sulfur Institute, Technical Bulletin No. 14, USA.
Bingham, F. T. (1966). Phosphorus. In 'Diagnostic Criteria for Plants and Soils'. (Ed. H. D. Chapman.) pp. 324-61. (University of California, Division of Agricultural Sciences: California.)
Bower, C. A., and Wilcox, L. V. (1965). Soluble salts. In 'Methods of Soil Analysis, Part 2 -Agronomy Monograph vol. 9'. (Ed. C. A. Black.) pp. 933-51. (American Society of Agronomy: Madison, Wisconsin.)
Bremner, J. M. (1965). Inorganic forms of nitrogen. In 'Methods of Soil Analysis, Part 2 -Agronomy Monograph vol. 9'. (Ed. C. A. Black.) pp. 1179-237. (American Society of Agronomy: Madison, WL, U.S.A.)
Cartwright, B., Tiller, K. G., Zarcinas, B. A., and Spouncer, L. R. (1983). The chemical assessment of the boron status of soils. Australian Journal of Soil Research 21, 321-32.
Colwell, J. D. (1963). The estimation of the phosphorus fertiliser requirements of wheat in southern New South Wales by soil analysis. Australian Journal of Experimental Agriculture and Animal Husbandry 3,190-7.
Cooper, K. M. (1984). Physiology of VA mycorrhizal associations. In 'VA Mycorrhiza'. (Eds C. L. Powell and D. J. Bagyaraj.) pp. 155-86. (CRC Press, Inc.: Boca Raton, Florida.)
Creighton Miller, J. Jr, Rajapakse, S., and Garber, R.K. (1986). Vesicular-arbuscular mycorrhizae in vegetable crops. HortScience 21, 974-84.
Datnoff, L. E., Nemec, S., and Raid, R. N. (1991). Influence of various vegetable potting mixes on colonization of tomato by Glomus intraradix. Proceedings of the Florida State Horticultural Society 104,253-7.
Day, P. R. (1965). Particle fractionation and particle-size analysis. In 'Methods of Soil Analysis Part 1 - Physical and Mineralogical Properties, Including Statistics of Measurement and Sampling'. (Ed. C. A. Black) pp. 545-67 (American Society of Agronomy: Madison, WL)
Dehne, H. W. (1982). Interactions between vesicular-arbuscular mycorrhizal fungi and plant pathogens. Phytopathology 72,1115-9.

Section 2 - Vesicular-arbuscular mycorrhizal (VAM) component Page 35
Dodd, J., Krikun, J., and Haas, J. (1983). Relative effectiveness of indigenous populations of vesicular-arbuscular mycorrhizal fungi from four sites in the Negev. Israel Journal of Botany 32, 10-21.
Evans, D. G., and Miller, M. H. (1990). The role of the external mycelial network in the effect of soil disturbance upon vesicular-arbuscular mycorrhizal colonization of maize. New Phytologist 114, 65-71.
Fairchild, G. L., and Miller, M. H. (1990). Vesicular-arbuscular mycorrhizas and the soil-disturbance-induced reduction of nutrient absorption in maize. III. Influence of P amendments to soil. New Phytologist 114, 641-50.
Fox, R. L., Olson, R. A., and Rhoades, H. F. (1964). Evaluating the sulfur status of soils by plant and soil tests. Soil Science Society of America Proceedings 28, 243-6.
Gaunt, R. E. (1978). Inoculation of vesicular-arbuscular mycorrhizal fungi on onion and tomato seeds. New Zealand Journal of Botany 16, 69-71.
Gianinazzi, S., Gianinazzi-Pearson, V., and Trouvelot, A. (1990). Potentialities and procedures for the use of endomycorrhizas with special emphasis on high value crops. In 'Biotechnology of Fungi for Improving Plant Growth'. (Eds J. M. Whips and B. Lumsden.) pp. 41-54. (Cambridge University Press: Cambridge.)
Giovannetti, M., and Mosse, B. (1980). An evaluation of techniques for measuring vesicular arbuscular mycorrhizal infection in roots. New Phytologist 84,489-500.
Glanville, T. J., Macnish, S. E. and Scarborough, R. C. (1991). Field manual. In 'Land Management Manual Coastal Burnett Districts'. (Ed. R. N. Thwaites.) Queensland Department of Primary Industries Training Series QE91004, Brisbane.
Glover, J. (1973). The dark respiration of sugar-cane and the loss of photosynthate during the growth of a crop. Annals of Botany 37, 845-52.
Haas, J. H., Bar-Tal, A., Bar-Yosef, B., and Krikun, J. (1986). Nutrient availability effects on vesicular-arbuscular mycorrhizal bell pepper (Capsicum annuum) seedlings and transplants. Annals of Applied Biology 108,171-9.
Haas, J. H., Bar-Yosef, B., Krikun, J., Barak, R., Markovitz, T., and Kramer, S. (1987). Vesicular-arbuscular mycorrhizal fungus infestation and phosphorus fertigation to overcome pepper stunting after methyl bromide fumigation. Agronomy Journal 79, 905-10.
Hetrick, B. A. D., Hetrick, J.A., and Bloom, J. (1984). Interaction of mycorrhizal infection, phosphorus level, and moisture stress in growth of field corn. Canadian Journal of Botany 62,2267-71.
Hunter, M. N. (1981). Semi-automatic control of soil water in pot culture. Plant and Soil 62, 455-9.
Incitec (1989). Soil Interpretation Manual. Volume II. Tomatoes and capsicums - sands and sandy loam soils for south east Queensland and northern New South Wales. Interpretation Chart No. 91.
Incitec (1995). Heavy metals in fertilizers and agriculture. Incitec Ltd Agri-topic No. 142, Brisbane.
Isbell, R. F. (1993). 'A classification system for Australian soils. Third approximation.' (CSIRO Division of Soils: Townsville.)
Jarrell, W. M., and Beverly, R. B. (1981). The dilution effect in plant nutrition studies. Advances in Agronomy 34,197-224.
Jasper, D. A., Abbott, L. K., and Robson, A. D. (1989). Soil disturbance reduces the infectivity of external hyphae of vesicular-arbuscular mycorrhizal fungi. New Phytologist 112, 93-9.

Section 2 - Vesicular-arbuscular mycorrhizal (VAM) component Page 36
Jeffries, P. (1987). Use of mycorrhizae in agriculture. Critical Reviews in Biotechnology 5, 319-57.
Johnson, N. C, Copeland, P. J., Crookston, R. K., and Pfleger, F. L. (1992). Mycorrhizae: possible explanation for yield decline with continuous corn and soybean. Agronomy Journal 84, 387-90.
Koske, R. E., and Gemma, J. N. (1989). A modified procedure for staining roots to detect VA mycorrhizas. Mycology Research 92,486-505.
Lindsay, W. L., and Norvell, W. A. (1978). Development of a DTPA soil test for zinc, iron, manganese and copper. Soil Science Society of America Journal 42,421-8.
Loveday, J. (1974). Methods for analysis of irrigated soils. Commonwealth Bureau of Soils, Technical Communication No. 54, Farnham Royal, England.
Loveday, J., Beatty, H. J., and Norris, J. M. (1972). Comparison of current methods for evaluating irrigation soils. CSIRO Division of Soils, Technical Paper No. 14, Australia.
Lu, S., Braunberger, P. G., and Miller, M. H. (1994). Response of vesicular-arbuscular mycorrhizas of maize to various rates of P addition to different rooting zones. Plant and Soil 158,119-28.
McDonald, R. C , Isbell, R. F., Speight, J. G., Walker, J., and Hopkins, M. S. (1984). 'Australian Soil and Land Survey Handbook.' pp. 97-8. (Inkata Press: Melbourne.)
McGonigle, T. P., and Miller, M. H. (1993a). Responses of mycorrhizae and shoot phosphorus of maize to the frequency and timing of soil disturbance. Mycorrhiza 4, 63-8.
McGonigle, T. P., and Miller, M. H. (1993b). Mycorrhizal development and phosphorus absorption in maize under conventional and reduced tillage. Soil Science Society of America Journal 57, 1002-6.
McGonigle, T. P., Evans, D. G., and Miller, M. H. (1990). Effect of degree of soil disturbance on mycorrhizal colonization and phosphorus absorption by maize in growth chamber and field experiments. New Phytologist 116, 629-36.
McGovern, R. J., Datnoff, L. E., and Tripp, L. (1992). Effect of mixed infection and irrigation method on colonization of tomato roots by Trichoderma harzianum and Glomus intraradix. Proceedings of the Florida State Horticultural Society 105, 361-3.
Mclntyre, D. S. (1974). Sample preparation/ water retention and the moisture characteristic. In 'Methods for Analysis of Irrigated Soils'. (Ed. J. Loveday.) Commonwealth Bureau of Soils, Technical Communication No. 54, Farnham Royal, England.
Menge, J. A. (1982). Effect of soil fumigants and fungicides on vesicular-arbuscular fungi. Phytopathology 72,1125-32.
Menge, J. A., Davis, R. M., Johnson, E. L. V., and Zentmeyer, G. A. (1978). Mycorrhizal fungi increase growth and reduce transplant injury in avocado. California Agriculture 32, 6-9.
Miller, M. H., McGonigle, T. P., and Addy, H. D. (1995). Functional ecology of vesicular arbuscular mycorrhizas as influenced by phosphate fertilization and tillage in an agricultural ecosystem. Critical Reviews in Biotechnology 15, 241-55.
Miranda, J. C. C, and Harris, P. J. (1994). The effect of soil phosphorus on the external mycelium growth of arbuscular mycorrhizal fungi during the early stages of mycorrhiza formation. Plant and Soil 166,271-80.
Morton, J. B., Bentivenga, S. P., and Wheeler, W. W. (1993). Germ Plasm in the International Collection of Arbuscular and Vesicular-arbuscular Mycorrhizal Fungi (INVAM) and Procedures for Culture Development, Documentation, and Storage. Mycotaxon 48, 491-528.
Mosse, B. (1973). Advances in the study of vesicular-arbuscular mycorrhiza. Annual Review of Phytopathology 11,171-96.
Section 2 - Vesicular-arbuscular mycorrhizal (VAM) component Pase 37
Mosse, B. (1986). Mycorrhiza in a sustainable agriculture. Biological Agriculture and Horticultures, 191-209.
Nelsen, C. E., and Safir, G. R. (1982). Increased drought tolerance of mycorrhizal onion plants caused by improved phosphorus nutrition. Planta 154,407-13.
Northcote, K. H. (1979). 'A Factual Key for the Recognition of Australian Soils. Fourth edition.' (Rellim Technical Publications: Adelaide.)
Olsen, J. K., and Lyons, D. J. (1994). Petiole sap nitrate is better than total nitrogen in dried leaf for indicating nitrogen status and yield responsiveness of capsicum in subtropical Australia. Australian Journal of Experimental Agriculture 34, 835-43.
O'Neill, J. V., and Webb, R. A. (1970). Simultaneous determination of nitrogen, phosphorus and potassium in plant material by automated methods. Journal of the Science of Food and Agriculture 21,217-9.
Pacioni, G. (1992). Wet-sieving and decanting techniques for the extraction of spores of vesicular-arbuscular fungi. In 'Methods in Microbiology, Volume 24. Techniques for the Study of Mycorrhiza.' (Eds J. R. Norris, D. J. Read and A. K. Varma.) pp 317-22. (Academic Press: London.)
Piggott, T. J. (1986). Vegetable crops. In 'Plant Analysis - an Interpretation Manual'. (Eds D. J. Reuter and J. B. Robinson.) pp. 148-87. (Inkata Press: Melbourne.)
Plenchette, C, Fortin, J. A., and Furlan, V. (1983). Growth responses of several plant species to mycorrhizae in a soil of moderate P-fertility. I. Mycorrhizal dependency under field conditions. Plant and Soil 70,199-209.
Porter, W. M. (1979). The 'most probable number' method for enumerating infective propagules of vesicular-arbuscular mycorrhizal fungi in soil. Australian Journal of Soil Research. 17, 515-9.
Powell, C. LI., and Bagyaraj, D. J. (1984). VA mycorrhizae: why all the interest? In 'VA Mycorrhiza'. (Eds C. LI. Powell and D. J. Bagyaraj.) pp. 1-3. (CRC Press, Inc.: Boca Raton, Florida.)
Rasmussen, T. S., and Henry, R. J. (1990). Starch determination in horticultural plant material by an enzymic-colorimetric procedure. Journal of the Science of Food and Agriculture 52,159-70.
Sims, J. R., and Haby, V. A. (1971). Simplified colorimetric determination of soil organic matter. Soil Science 112,137-41.
Sreenivasa, M. N., Krishnaraj, P. U., Gangadhara, G. A, and Manjunathaiah, H. M. (1993). Response of chilli {Capsicum annuum L.) to the inoculation of an efficient vesicular-arbuscular mycorrhizal fungus. Scientia Horticulturae 53,45-52.
Stace, H. C. T., Hubble, G. D., Brewer, R., Northcote, K. H., Sleeman, J. R., Mulcahy, M. J. and Hallsworth, E. G. (1972). 'A Handbook of Australian Soils'. (Rellim Technical Publications: Glenside, South Australia.)
Taylor, R. (1995). Keeping cadmium under control. CSIRO Rural Research Quarterly No. 166 pp.11-4.
Technicon (1970). Technicon Auto Analyser II. Industrial method No. 9970W. Timmer, L.W., and Leyden, R. F. (1978). Stunting of citrus seedlings in fumigated soils in
Texas and its correction by phosphorus fertilization and inoculation with mycorrhizal fungi. Journal of the American Society for Horticultural Science 103, 533-7.
Tinker, P. B., Durall, D. M., and Jones, M. D. (1994). Carbon use efficiency in mycorrhizas: theory and sample calculations. New Phytologist 128,115-22.
Tucker, B. M. (1971). Basic exchangeable cations in soils. CSIRO Division of Soils, Technical Paper No. 8, Australia.

Section 2 - Vesicular-arbuscular mycorrhizal (VAM) component Pase 38
United States Department of Agriculture. (1975). 'Soil Taxonomy. A Basic System of Soil Classification for Making and Interpreting Soil Surveys. Agricultural Handbook No. 436.' (U.S. Government Printing Office: Washington DC.)
Vivekanandan, M, and Fixen, P. E. (1991). Cropping systems effects on mycorrhizal colonization, early growth, and phosphorus uptake of corn. Soil Science Society of America Journal 55,136-40.
Walkley, A., and Black, T. A. (1934). An examination of the Degtjareff method for determining soil organic matter, and a proposed modification of the chromic acid titration method. Soil Science 37,29-38.
Waterer, D. R., and Coltman, R. R. (1989). Response of mycorrhizal bell peppers to inoculation timing, phosphorus, and water stress. HortScience 24, 688-90.
Weir, R. G., and Cresswell, G. C. (1993). 'Plant Nutrient Disorders 3. Vegetable Crops.' (Inkata Press: Melbourne.)
Zarcinas, B. A., Cartwright, B., and Spouncer, L. R. (1987). Nitric acid digestion and multielement analysis of plant material by inductively coupled plasma spectrometry. Communications in Soil Science and Plant Analysis. 18,131-46.

Section 2 - Vesicular-arbuscular mycorrhizal (VAM) component Paee 39
Table 2.1. Chemical analysis of the Mollic Ustifluvent used as the growth medium in pot Exper
Property Unit of Value Desirable Method measurement range
PH 6.20 6.0 - 7.0 1:5 soil:water
Electrical conductivity dS/m 0.029 <0.30 l:5soil:water
Organic carbon % 1.10 >2.0 K2Cr207 + H2S04
N03-N mg/kg 5 25-60 l:5soil:water
P mg/kg 6 60-100 l:100soiI:0.5MNaHCO3
K cmol(+)/ kg 0.07 0.37-1.5 1:20 soil: l M N H A p H 7.0
Ca cmol(+)/ kg 2.40 >3.0 1:20 soil:lMNH4Cl,pH 7.0
Mg cmol(+)/ kg 1.10 >0.4 1:20 s o i U M N H A p H 7.0
Na cmol(+)/ kg 0.17 <2.0 1:20 s o i k l M N H A p H 7.0
CECB cmol(+)/ kg 3.74 >4.0 1:20 s o i h l M N H A p H 7.0
Fe mg/kg 40 >2.0 l:2soil:0.005MDTPA
Cu mg/kg 0.4 0.3 -10 l:2soil:0.005MDTPA
Mn mg/kg 13 4-45 l:2soil:0.005MDTPA
Zn mg/kg 0.5 1-10 l:2soil:0.005MDTPA
CI mg/kg 19 <300 1:5 soil:water
SO4-S mg/kg 3 20-100 l:5soil:0.01MCa(H2PO4)2
B mg/kg 0.1 2 - 5 l:2soil:hot0.01MCaCl2
A Incitec (1989). Soil Interpretation Manual. Volume II. Tomatoes and capsicums - sands and sandy loam soils for south-east Queensland and northern B Cation exchange capacity estimated as the sum of basic cations.

Section 2 - Vesicular-arbuscular mycorrhizal (VAM) component Pase 40
Table 2.2. Details of rates of applied nutrients for the pot Experiment 1.
Element1 Rate of element application5
Nutrient salt Rate of salt application
Application method
N 50 mg/ L 200 mg/ L
Ca (N03)2.4H20 422 mg/ L 1687mg/L
Irrigation solution
P 0 mg/ kg O.D. soil 10.3 mg/kg O.D. soil 30.9 mg/ kg O.D. soil
92.7 mg/ kg O.D. soil 278 mg/kg O.D. soil
Ca(H2P04)2.H20 0 g/ pot 0.45 g/ pot 1.34 g/pot 4.00 g/ pot
12.01 g/pot
Dry mix
K 61.8 mg/kg O.D. soil K2S04 1.46 g/ pot Basal application of stock solution
Ca 327 mg/ kg O.D. soil Ca(OH)2 6.42 g/ pot Dry mix
Mg 10.3 mg/kg O.D. soil Mg S04 .7H20 1.11 g/pot Basal application of stock solution
Zn 2.1 mg/kg O.D. soil Zn S04 .7H20 96 mg/ pot Basal application of stock solution
Cu 1.0 mg/kg O.D. soil Cu S04 .5H20 43 mg/ pot Basal application of stock solution
Mn 2.1 mg/kg O.D. soil Mn S04 .4H20 89 mg/ pot Basal application of stock solution
Mo 0.1 mg/kg O.D. soil Na 2Mo0 4 .2H 20 2.8 mg/ pot Basal application of stock solution
B 0.3 mg/ kg O.D. soil H3BO3 16mg/pot Basal application of stock solution
Fe applied as foliar (0.5 g/ L) Fe-EDTA (12.7% Fe w/w) at fortnightly intervals commencing 3 wk after emergence. Total S application of 41.7 mg/ kg oven-dry soil from addition of other nutrient salts.
Two stock solutions were used and applied separately to minimise the possibility of precipitation within solution. Nutrient combinations were K, Mo and B in one solution and Mg, Zn, Cu and Mn in the other.
§ Each pot was filled with 10.7 kg air-dry soil (10.63 kg oven-dry).

Section 2 - Vesicular-arbuscular mycorrhizal (VAM) component Page 41
Table 2.3. A summary of the sequence of operations in Experiments 2,3 and 4.
Task description Experiment 2 Experiment 3 Experiment 4
(no cage) (with cage) (with cage)
PRECONDITIONING PHASE
Sunflower nurse crop sown 2 Feb 1994 2 Feb 1994 14 Nov 1994 Sunflower tops removed 28 Apr 1994 28 Apr 1994 30 Jan 1995 Duration from sowing to harvest (days) 85 85 77
PRODUCTION PHASE
Capsicum Germinated seeds sown 5 May 1994 5 May 1994 31 Jan 1995 Plants harvested 23Augl994 16 Aug 1994 28 Mar 1995 Duration from sowing to harvest (days) 110 103 56
Sweet Corn Seeds sown 6 May 1994 6 May 1994 1 Feb 1995 Plants harvested 21 Jul 1994 1 Jul 1994 6 Mar 1995 Duration from sowing to harvest (days) 76 56 33
Tomato Germinated seeds sown 9 May 1994 9 May 1994 2 Feb 1995 Plants harvested 28 Jul 1994 11 Jul 1994 13 Mar 1995 Duration from sowing to harvest (days) 80 63 39
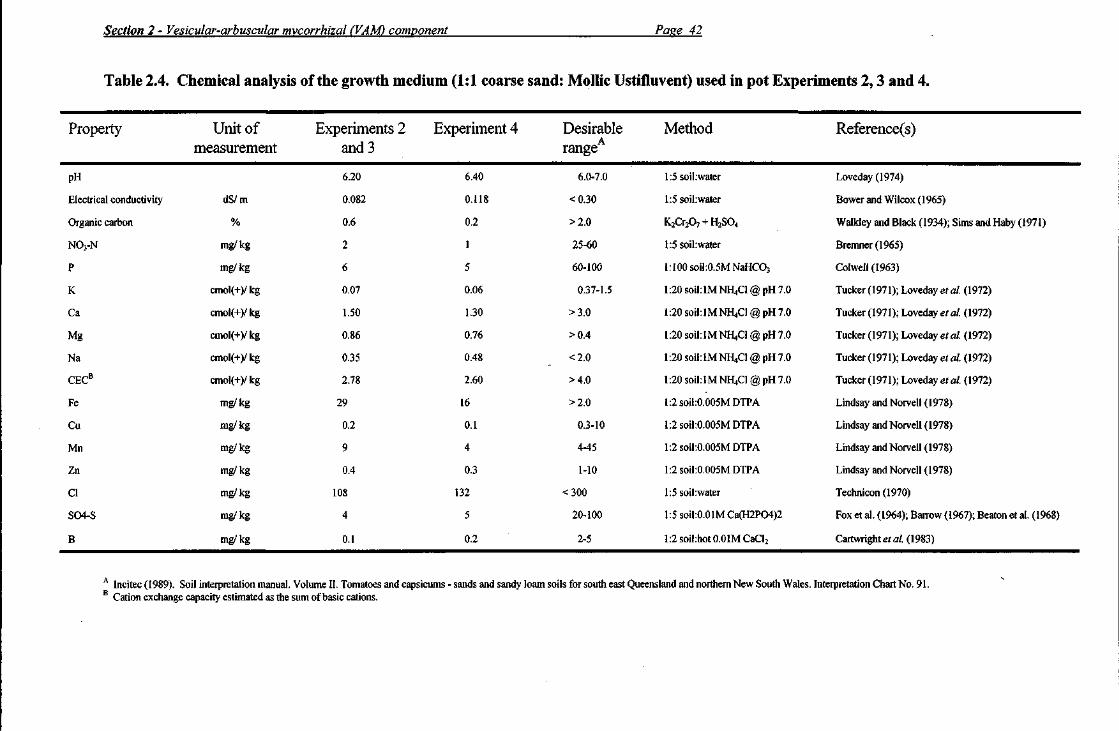
Section 2 - Vesicular-arbuscular mvcorrhizal (VAM) component Page 42
Table 2.4. Chemical analysis of the growth medium (1:1 coarse sand: Mollic Ustifluvent) used i
Property Unit of measurement
Experiments 2 and 3
Experiment 4 Desirable range
Method
pH 6.20 6.40 6.0-7.0 1:5 soil:water
Electrical conductivity dS/m 0.082 0.118 <0.30 1:5 soikwater
Organic carbon % 0.6 0.2 >2.0 K2Cr207 + H2S0
N03-N mg/kg 2 1 25-60 l:5soil:water
P mg/kg 6 5 60-100 1:100 soiI:0.5M
K cmol(+)/ kg 0.07 0.06 0.37-1.5 1:20 soiklMNH
Ca cmol(+)/ kg 1.50 1.30 >3.0 1:20 soil:lMNH
Mg cmol(+)/ kg 0.86 0.76 >0.4 1:20 soil: lMNH
Na cmol(+)/ kg 0.35 0.48 <2.0 1:20 soil: 1M NH
CECB cmol(+)/ kg 2.78 2.60 >4.0 l:20soil:lMNH
Fe mg/kg 29 16 >2.0 l:2soil:0.005M
Cu mg/kg 0.2 0.1 0.3-10 l:2soil:0.005M
Mn mg/kg 9 4 4-45 l:2soil:0.005M
Zn mg/kg 0.4 0.3 1-10 l:2soil:0.005M
CI mg/kg 108 132 <300 1:5 soikwater
S04-S mg/kg 4 5 20-100 l:5soil:0.01MC
B mg/kg 0.1 0.2 2-5 l:2soil:hot0.01M
A Incitec (1989). Soil interpretation manual. Volume II. Tomatoes and capsicums - sands and sandy loam soils for south east Queensland and northern B Cation exchange capacity estimated as the sum of basic cations.

Section 2 - Vesicular-arbuscular mycorrhizal (VAM) component Page 43
Table 2.5. Details of rates of nutrients applied to the preconditioning phase of the pot Experiments 2,3 and 4.
Fe was not applied as levels measured in the growth medium were in excess of the desirable range. Total S application of 37.1 mg/ kg oven-dry soil from addition of other nutrient salts.
Element Rate of element application
Nutrient salt Rate of salt application
Application method
N 50 mg/ L Ca (N03)2.4H20 422 mg/ L Irrigation solution
4.6 mg/ kg O.D. soil Ca(H2P04)2.H20 0.22 g/pot Dry mix
K
Ca
Mg
Zn
Cu
Mn
Mo
B
55.0 mg/ kg O.D. soil K2S04
136 mg/ kg O.D. soil Ca(OH)2
1.46 g/ pot Basal application of stock solution
3.0 g/pot Dry mix
9.2 mg/ kg O.D. soil Mg S04 .7H20 1.11 g/ pot Basal application of stock solution
1.8 mg/ kg O.D. soil Zn S04 .7H20 96 mg/ pot Basal application of stock solution
0.9 mg/kg O.D. soil Cu S04 .5H20 43mg/pot Basal application of stock solution
1.8 mg/kg O.D. soil MnS04 .4H20 89mg/pot Basal application of stock solution
0.1 mg/ kg O.D. soil Na2 Mo 0 4 .2H20 2.8 mg/ pot Basal application of stock solution
0.2 mg/ kg O.D. soil H3 B03 16 mg/ pot Basal application of stock solution
A Two stock solutions were made and applied separately to minimise the possibility of precipitation within solution. Nutrient combinations were K, Mo and B in one solution and Mg, Zn, Cu and Mn in the other. B Each pot was filled with 12.0 kg air-dry growth medium (1:1 coarse sand:Mollic Ustifluvent) which weighed 11.93 kg when oven-dry. C Half of the applied P (viz. 2.3 mg/ kg oven-dry soil) was spot placed at a depth of 50 mm on each side of, and, external to, the root exclusion cage. The + or -VAM inoculum was placed immediately above this P, while 5 sunflower seeds were placed on top of the inoculum and covered with 10 mm of growth medium.
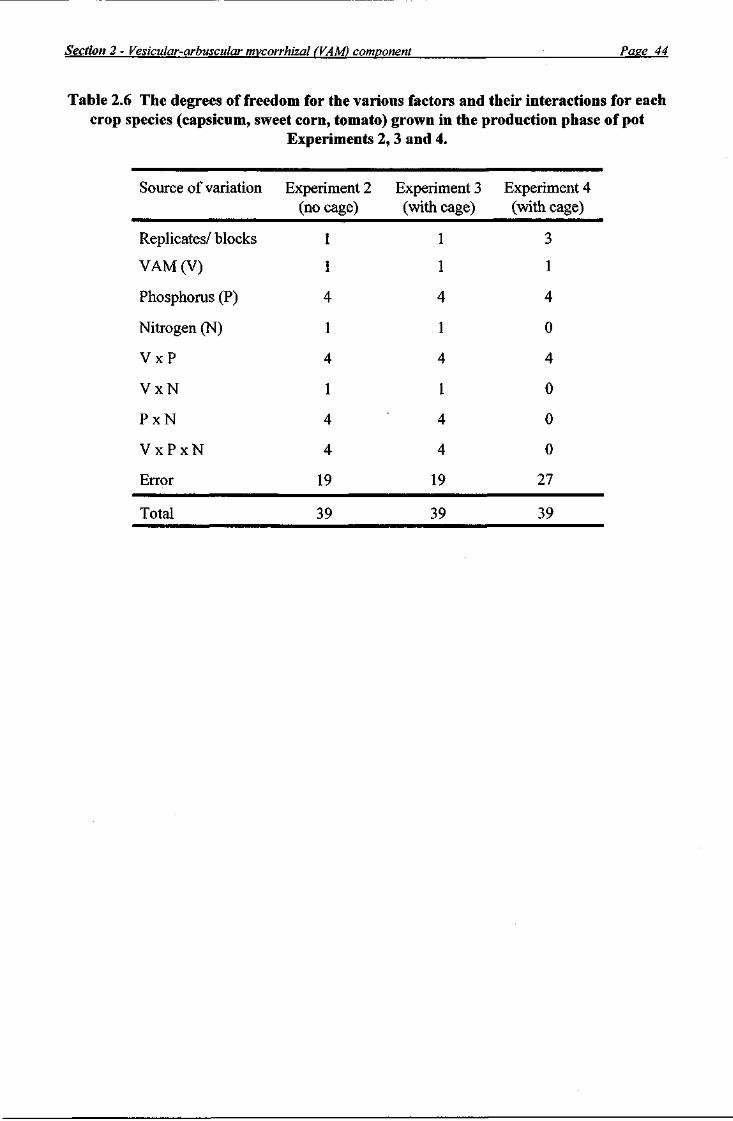
Section 2 - Vesicular-arbuscular mycorrhizal CVAM) component Page 44
Table 2.6 The degrees of freedom for the various factors and their interactions for each crop species (capsicum, sweet corn, tomato) grown in the production phase of pot
Experiments 2,3 and 4.
Source of variation Experiment 2 Experiment 3 Experiment 4 (no cage) (with cage) (with cage)
Replicates/ blocks 1 1 3
VAM (V) 1 1 1
Phosphorus (P) 4 4 4
Nitrogen (N) 1 1 0
V x P 4 4 4
V x N 1 1 0
P x N 4 4 0
V x P x N 4 4 0
Error 19 19 27
Total 39 39 39

Section 2 - Vesicular-arbuscular mvcorrhizal CVAM) component Page 45
Table 2.7. A summary of the sequence of operations in the field trial.
Task description Date performed
Preparation phase (sorghum) Soil deep ripped and rotary hoed Sorghum cv. Jumbo broadcast at 18 kg/ ha Sorghum tops cut and raked off (new shoots allowed to regrow) Sorghum tops cut and raked off Soil deep-ripped Soil rotary hoed Soil beds formed, trickle tubing and white plastic mulch laid
15 Oct 1993 12 Nov 1993 25 Feb 1994 16 Sep 1994 27 Sep 1994
3 Oct 1994 10 Oct 1994
Preconditioning phase (sweet corn)
Sweet corn cv. Snosweet seeds sown with an air seeder (2 rows per bed) Tops of 10 of the 34 sweet corn plants per subplot (6 m x 1.36 m) harvested for a uniformity assay Remaining sweet corn tops cut off at ground level and removed White plastic mulch and trickle tubing removed and discarded Soil of disturbed subplots rotary hoed Potassium nitrate fertiliser applied as a narrow band to all whole plots Soil in bed centres sliced with a plate of steel to make a narrow furrow. A mixture of superphosphate and sand poured into the furrow to give 1 of 5 P rates per whole plot (0, 5,15,45 or 135 kg P/ ha) New trickle tubing and white plastic mulch laid over the original soil beds in which the sweet corn was grown Soil of-VAM whole plots fumigated
9 Nov 1994 19-20 Jan 1995
24 Jan 1995 30 Jan 1995 2 Feb 1995 9 Feb 1995
10 Feb 1995
28 Feb 1995
8 Mar 1995
Production phase (capsicum)
Capsicum cv. Target seedlings transplanted (originally sown into seedling 20 Mar 1995 trays on 4 Jan 1995) First fruit harvest 22 Jun 1995 Second fruit harvest 6 Jul 1995 Third fruit harvest 13 Jul 1995 Fourth fruit harvest 27 Jul 1995 Fifth (and final) fruit harvest 10 Aug 1995 Tops of capsicum plants cut off at ground level for dry weight determination 14 Aug 1995 Roots and adhering soil from 3 randomly selected root systems per 16 Aug 1995 undisturbed subplot exhumed for VAM, root length and dry weight assessment

Section 2 - Vesicular-arbuscular mycorrhizal CVAM) component Pase 46
Table 2.8. Chemical analysis of the Typic Paleudalf at three sample dates during the The values at each date were from a composite sample of approximately 20 cores (20 m
Property Unit of measurement
Sample date Desirable rangeA
Method Unit of measurement
2 Aug 1993 15 Feb 1994 24Junl994
Desirable rangeA
Method
pH 6.3 5.3 6.0 6.0-7.0 1:5 soil:wate
Electrical conductivity dS/m 0.04 0.28 0.08 <0.30 l:5soil:wate
Organic carbon % Not determined Not determined 0.9 >2.0 K2C12O7 +
NO3-N mg/kg 1 1 1 25-60 l:5soil:wate
P mg/ kg IS 30 22 60-100 1:100 soil:0.
K cmol(+ykg 0.16 0.10 0.08 0.37-1.5 1:20 soil: lM
Ca cmol(+y kg 1.10 2.60 2.10 >3.0 l:20soil:lM
Mg cmol(+)/ kg 0.55 0.24 0.29 >0.4 l:20soil:lM
Na cmol(+)/ kg 0.08 0.06 0.04 <2.0 l:20soil:lM
CECB cmol(+)/ kg 1.89 3.00 2.51 >4.0 l:20soil:lM
Fe mg/kg Not determined 81 103 >2.0 l:2soil:0.005
Cu mg/kg 0.4 0.5 0.7 0.3 -10 l:2soiI:0.005
Mn mg/kg 1 1 2 4-45 l:2soil:0.005
Zn mg/kg 0.3 0.6 0.5 1-10 l:2soil:0.005
CI mg/kg 33 14 13 <300 1:5 soil:wate
SO4-S mg/kg 3 209 42 20 -100 l:5soil:0.01M
B mg/kg Not determined 0.6 0.4 2 - 5 l:2soil:hot0
A Incitec (1989). Soil Interpretation Manual. Volume II. Tomatoes and capsicums - sands and sandy northern New South Wales. Interpretation Chart No. 91. B Cation exchange capacity estimated as the sum of basic cations.

Section 2 - Vesicular-arbuscular mycorrhizal (VAM) component Page 47
Table 2.9. Some physical properties of the Typic Paleudalf (13 km S.S.E. of Bundaberg) at various depths.
The value at each depth is the mean of 4 cores (diameter 40 mm) sampled from the field trial site on 5 January 1995. The range of values from these cores at each sample depth is
presented in brackets below the mean. The properties were determined by the methods of Day (1965).
Soil depth
Air-dry moisture
content (%)
Particle size ; analysis (%)
(cm)
Air-dry moisture
content (%) Coarse sand Fine sand Silt Clay
0-10 0.6 12 52 35 7 (0.5-0.7) (9-14) (51-52) (32-39) (6-8)
10-20 0.5 12 52 37 7 (0.3-0.6) (10-14) (51-55) (32-40) (5-9)
20-40 0.4 11 53 36 9 (0.3-0.4) (8-13) (50-57) (32-40) (8-9)
40-60 0.9 12 44 29 21 (0.6-1.4) (8-17) (37-47) (14-36) (12-42)

Section 2 - Vesicular-arbuscular mycorrhizal CVAM) component Page 48
Table 2.10. Chemical analysis of the Typic Paleudalf (13 km S.S.E. of Bundaberg) at various field trial.
The value at each depth is the mean of 4 cores (diameter 40 mm) sampled from the field trial site these cores at each sample depth is presented in brackets followi
Property Unit of Soil depth (cm) Desirable measurement ranged
0-10 10-20 20-40 40-60
PH 6.8 (6.7-7.0) 6.3(6.1-6.5) 5.9(5.7-6.0) 6.0 (5.4-6.2) 6.0 - 7.0
Electrical conductivity dS/m 0.12(0.04-0.22) 0.18(0.06-0.30) 0.09(0.04-0.14) 0.07(0.04-0.12) <0.30
Organic carbon % 1.1 (0.9-1.3) 1.0(0.9-1.2) 0.6 (0.5-0.6) 0.4 (0.4-0.4) >2.0
NO3-N mg/kg 2(2-2) 2(2-2) 2(2-2) 2 (2-2) 25-60
P mg/kg 14(12-16) 11(9-15) 3(2-4) 2(2-2) 60-100
K cmoI(+)/ kg 0.12(0.08-0.16) 0.07 (0.07-0.08) 0.05(0.04-0.05)' 0.05 (0.04-0.06) 0.37-1.5
Ca cmol(+y kg 2.95 (2.00-3.80) 2.60(1.60-3.20) 1.01(0.83-1.30) 0.73 (0.61-0.77) >3.0
Mg cmol(+)/ kg 1.08(0.94-1.30) 0.77 (0.58-0.98) 0.54 (0.38-0.82) 1.35(1.10-2.00) >0.4
Na cmol(+y kg 0.18(0.08-0.25) 0.19(0.11-0.26) 0.11(0.08-0.15) 0.21 (0.14-0.24) <2.0
CECB cmol(+y kg 4.33(3.12-5.47) 3.62(2.37-4.51) 1.70(1.37-2.02) 2.33(1.91-3.02) >4.0
Fe mg/kg 42 (29-58) 49 (36-72) 21 (15-25) 9(6-12) >2.0
Cu mg/kg 0.5 (0.4-0.7) 0.5 (0.3-0.7) 0.1 (0.1-0.1) 0.1 (0.1-0.1) 0.3 -10
Mn mg/kg 2(1-3) 1(1-1) 0 (0-0) 0(0-0) 4-45
Zn mg/kg 2.4(1.9-3.4) 3.4(1.1-10.0) 0.6(0.1-1.8) 0.4(0.1-0.7) 1-10
CI mg/kg 30(7-52) 67(6-119) 14(6-25) 19(10-34) <300
SO4-S mg/kg 49(6-112) 90(23-155) 61 (24-97) 76 (54-90) 20-100
B mg/kg 1.1(0.9-1.4) 0.7 (0.5-0.8) 0.4(0.3-0.5) 0.4 (0.3-0.6) 2-5
A Incitec (1989). Soil Interpretation Manual. Volume II. Tomatoes and capsicums - sands and sandy loam soils for south-east Queensland and northern New So B Cation exchange capacity estimated as the sum of basic cations.

Section 2 - Vesicular-arbuscular mycorrhizal (VAM) component Pase 49
Table 2.11. Experiment 1 - relative mycorrhizal dependency (RMD*) of three crop species grown at five rates of applied phosphorus.
Data were averaged over two N rates (50 or 200 mg N/ L in irrigation solution). The unfertilised soil had 6 mg NaHC03-extractable P/ kg. Where superscripting is used within a column, the F-test in the ANOVA for the main effect of P addition was significant at the 5% level; means followed by common superscripted letters are not significantly different at the
5% level.
Rate of appl iedP
. soil)
Crop species
(mg/ kg O.D
iedP
. soil) Capsicum Sweet corn Tomato
0 93.8° -8.5 -96.7
10.3 25.6b -21.8 -298.0
30.9 10.9ab -30.1 -35.1
92.7 -10.7ab 17.1 33.1
278 -31.5a -10.1 2.4
l.s.d. (P=0. 05) 48.1 47.1 290.9
For a given rate of applied P, RMD was calculated as 100 x (dry mass mycorrhizal plant - dry mass non-mycorrhizal plant)/ dry mass mycorrhizal plant (Plenchette et al. 1983).

Section 2 - Vesicular-arbuscular mycorrhizal (VAM) component Pase 50
Table 2.12. Relative mycorrhizal dependency (RMD ) of three crop species grown in pot Experiments 2,3 and 4 at five rates of applied P.
Data for tops were averaged over Nj and N2, whereas whole plants values were at the Nj treatment only. Where superscripting is used for a crop species within a column, the F-test in the ANOVA for the main effect of P addition was significant at the 5% level; means followed
by common superscripted letters are not significantly different at the 5% level.
Rate of i applied P
O.D. soil)
Experiment 2
(tops)
Experiment 3 Experiment 4
(mg/ kg
applied P
O.D. soil)
Experiment 2
(tops) (tops) (whole plants) (whole plants)
Capsicum 0 -57a 96 94 98.9a 9.2 -902ab -563 -510 12.4ab
27.5 -1344abc -563 -43 -44.2bc 82.5 -3529bc -1284 -332 -75.7bc
248 -4508c -472 -207 -115.9c l.s.d. (P= =0.05) 3166 893
Sweet corn
1166 101.1
0 12.0a 90.1a 86.4a 90.7a 9.2 -122.8ab -65.1ab -91.9bc -22.9b
27.5 -219.8b -162.6b -218.4c -46.6bc 82.5 -261.7b -372.4c -564.0d -58.8bc
248 -158.9b -61.2ab -17.5ab -72.9c l.s.d. (P= =0.05) 156.2 207.9
Tomato
175.6 44.3
0 -77 96 92 94.3a 9.2 -226 -773 -183 -19.8b
27.5 -476 -3113 -1292 -80.8b 82.5 -1182 -1250 -1106 -41.3b
248 -2176 -505 -266 -72.3b l.s.d. (P= =0.05) 2778 3147 3013 79.4
For a j given rate of applied P, RMD was calculated as 100x(drv weight of mycorrhizal plants - dry we ight ofnon-mvcorrhizal plants)
dry weight of mycorrhizal plants as described by Plenchette et al. (1983).

Section 2 - Vesicular-arbuscular mycorrhizal (VAM) component Pase 51
Table 2.13. VAM colonisation of roots of capsicum plants grown in the undisturbed subplots at var
Values at 32, 43, and 50 day after transplanting are from the entire root systems of single buffer plants, whe
means of the VAM colonisation of the fine roots of 3 datum plants selected randomly from each subplot.
100 xp is the percent VAM colonisation of roots) was performed on the data prior to ANOVA. Transforme letters are significantly different at P=0.05 (F-test for treatments, 1
Rate of Rate of
applied P
(kg/ha)
Time after transplanting (days)
applied N
Rate of
applied P
(kg/ha)
32 43
(kg/ha)
Rate of
applied P
(kg/ha) Transformed (Back-transformed)
Transformed (Back-transformed)
Transformed
+VAM
112 0 0.25c (6.2) 0.63b (34.9) 0.87cd
5 0.27c (7.4) 0.71b (42.5) 0.96d
187 0 0.20c (3-9) 0.65b (36.9) 0.73bc
5 0.25c (6.3) 0.64b (36.0) 0.82bcd
15 0.23c (5.4) 0.67b (38.5) 0.72bc
45 0.20c (4.1) 0.61b (32.9) 0.72bc
135 0.17bc (2.9) 0.59b (30.9)
-VAM
0.62b
0 0.03a (0.1) 0.04a (0.1) 0.11a
5 0.07ab (0.5) 0.12a (1.5) 0.16a
15 0.03a (0.1) 0a (0) 0.04a
45 0.06a (0.4) 0.06a (0.4) 0.04a
135 0.08ab (0.6) 0.11a (1.1) 0.04a
l.s.d.(P=0.05) 0.11 0.14 0.20

Section 2 - Vesicular-arbuscular mycorrhizal (VAM) component Pase 52
Table 2.14. Relative mycorrhizal dependency (RMD) of capsicum plants grown in the undisturbed subplots of the field trial at five rates of applied phosphorus.
RMD of the whole plants was calculated as 100 x (DW mycorrhizal plants - DW non-mycorrhizal plants)/ DW mycorrhizal plants as described by Plenchette et al. (1983). By
substitution, a similar formula was used to calculate RMD values for the total weight of all fresh fruit harvested from the capsicum plants.
Plants were supplied with a total of 187 kg N/ ha. The unfertilised soil was low in available P (13-16 mg NaHC03-extractable P/ kg at 0-10 cm depth; levels of extractable P reduced with
depth). The F-test in the ANOVA for the main effect of P addition (4 d.f.) was not significant at P=0.05 for both parameters.
Rate of applied P Dry weight of whole plants Fresh weight of all fruit
(kg/ha)
0 44.7 57.9
5 30.4 34.5
15 29.7 36.3
45 17.7 21.9
135 7.1 11.8
l.s.d. (P=0.05) 26.6 30.1
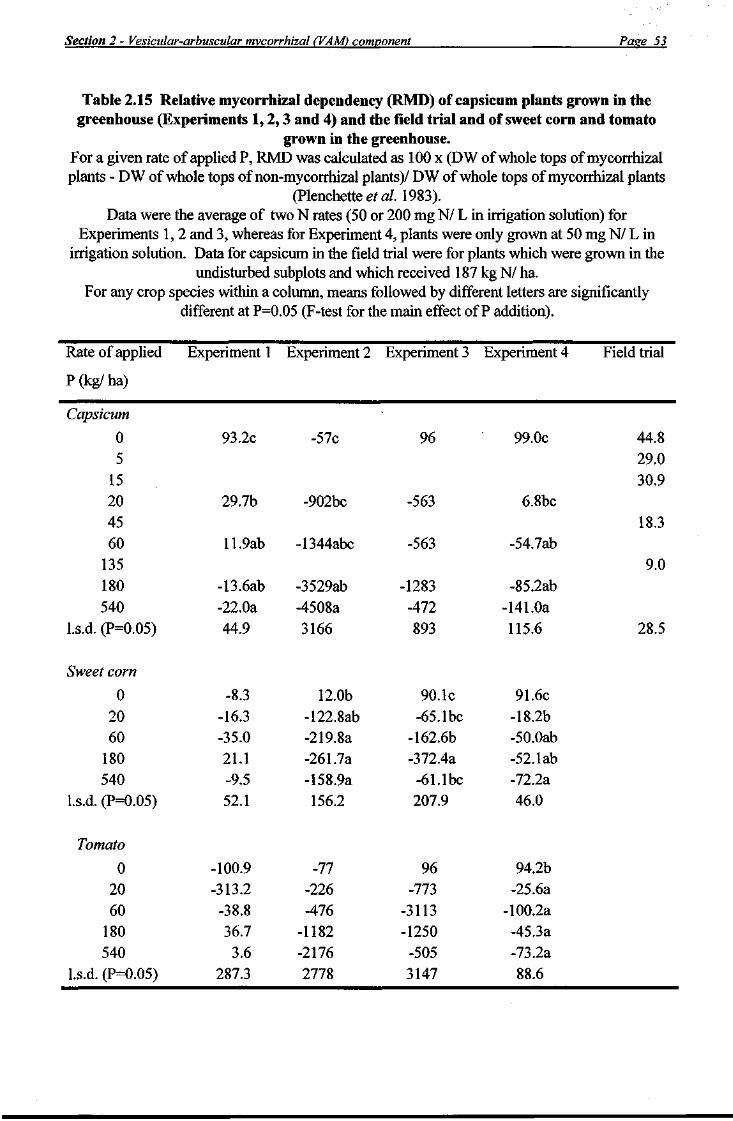
Section 2 - Vesicular-arbuscular mycorrhizal (VAM) component Page 53
Table 2.15 Relative mycorrhizal dependency (RMD) of capsicum plants grown in the greenhouse (Experiments 1,2,3 and 4) and the field trial and of sweet corn and tomato
grown in the greenhouse. For a given rate of applied P, RMD was calculated as 100 x (DW of whole tops of mycorrhizal plants - DW of whole tops of non-mycorrhizal plants)/ DW of whole tops of mycorrhizal plants
(Plenchetteefa/. 1983). Data were the average of two N rates (50 or 200 mg N/ L in irrigation solution) for
Experiments 1, 2 and 3, whereas for Experiment 4, plants were only grown at 50 mg N/ L in irrigation solution. Data for capsicum in the field trial were for plants which were grown in the
undisturbed subplots and which received 187 kg N/ ha. For any crop species within a column, means followed by different letters are significantly
different at P=0.05 (F-test for the main effect of P addition).
Rate of applied Experiment 1 Experiment 2 Experiment 3 Experiment 4 Field trial
P(kg/ha)
Capsicum
0 5
15 20 45 60
135 180 540
l.s.d. (P=0.05)
Sweet corn
0 20 60
180 540
l.s.d. (P=0.05)
Tomato
0 20 60
180 540
l.s.d. (P=0.05)
93.2c
29.7b
11.9ab
-13.6ab -22.0a 44.9
-8.3 -16.3 -35.0 21.1 -9.5 52.1
-100.9 -313.2 -38.8 36.7
3.6 287.3
-57c
-902bc
-1344abc
-3529ab -4508a 3166
12.0b -122.8ab -219.8a -261.7a -158.9a 156.2
-77 -226 -476
-1182 -2176 2778
96
-563
-563
-1283
-472 893
90.1c -65.1bc
-162.6b -372.4a -61.1bc 207.9
96 -773
-3113 -1250
-505 3147
99.0c
6.8bc
-54.7ab
-85.2ab -141.0a 115.6
91.6c -18.2b -50.0ab -52.lab -72.2a 46.0
94.2b -25.6a
-100.2a -45.3a -73.2a 88.6
44.8 29.0 30.9
18.3
9.0
28.5
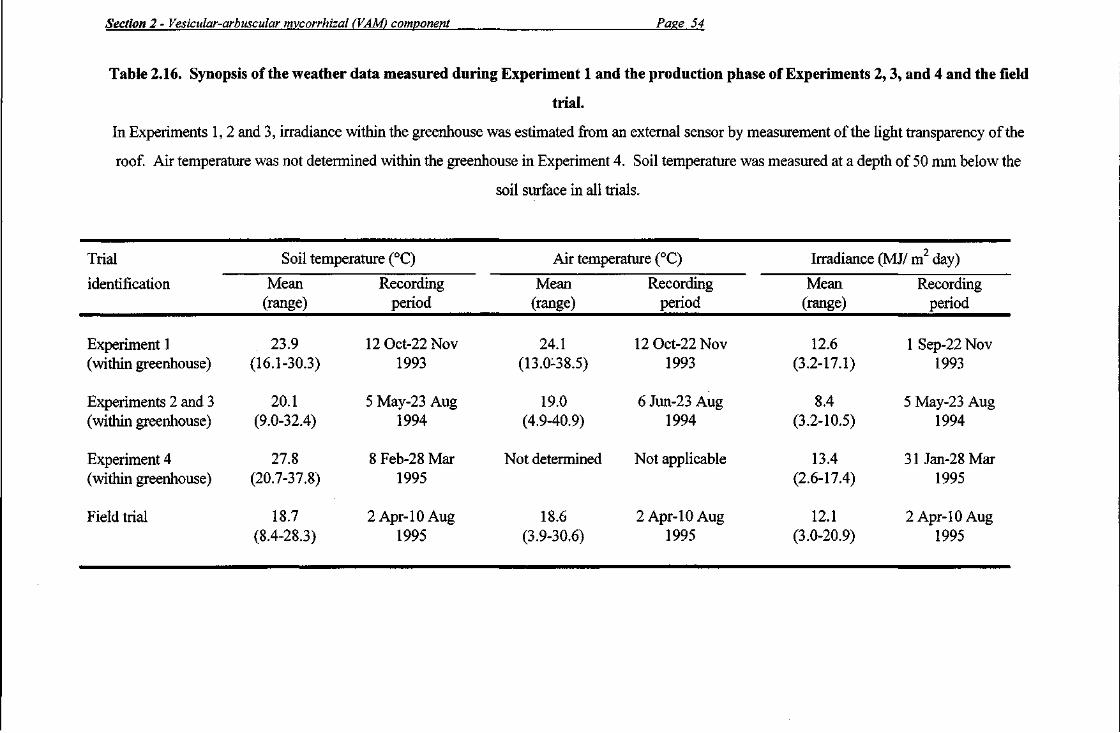
Section 2 - Vesicular-arbuscular mycorrhizal (VAM) component Page 54
Table 2.16. Synopsis of the weather data measured during Experiment 1 and the production p
trial.
In Experiments 1,2 and 3, irradiance within the greenhouse was estimated from an external sensor b
roof. Air temperature was not determined within the greenhouse in Experiment 4. Soil temperature
soil surface in all trials.
Trial Soil temperature (°C) Air temperature (°C)
identification Mean Recording Mean Recording (range) period (range) period
Experiment 1 23.9 12 0ct-22Nov 24.1 12 Oct-22 Nov (within greenhouse) (16.1-30.3) 1993 (13.0-38.5) 1993
Experiments 2 and 3 20.1 5 May-23 Aug 19.0 6 Jun-23 Aug (within greenhouse) (9.0-32.4) 1994 (4.9-40.9) 1994
Experiment 4 27.8 8 Feb-28 Mar Not determined Not applicable (within greenhouse) (20.7-37.8) 1995
Field trial 18.7 2 Apr-10 Aug 18.6 2 Apr-10 Aug (8.4-28.3) 1995 (3.9-30.6) 1995

Section 2 - Vesicular-arbuscular mycorrhizal (VAM) component Page 55
(a) Preconditioning phase (establishment of a mycorrhizal network) (gro
Two sunflower nurse plants grown external to the root
exclusion cage
Sweet corn (capsicum or tomato) plant grown within the
root exclusion cage
Inverted bottle reservoir Inserted Into the water well to maintain
a constant water table
Water well
Nylon mesh root exclusion cage
Severed stem of sunflower nurse plant
Growth medium external to the root exclusion cage
Growth medium within the root exclusion cage
Hose extension from the Inverted bottle reservoir
Level of the water table
Fig. 2.1. Diagrammatic cross-section of the arrangement of the nylon mesh root exclusion cage, wa the preconditioning phase and the sweet corn (capsicum or tomato) plant grown in the production ph

Section 2 - Vesicular-arbuscular mvcorrhizal (VAM) component Paze 56
0 30.9 92.7 278
Rate of applied P (mg/ kg)
0 30.9 92.7 278
Rate of applied P (mg/ kg)
CAPSICUM - EXPERIMENT 1 Fig. 2.2 Experiment 1 - The effect of applied P (mg/ kg oven-dry soil) on total dry weight (a), root weight ratio (b), root length (c), specific root length (d), vesicular-arbuscular mycorrhizae (VAM) colonisation (e), root length colonised by VAM (f) and index tissue concentrations of P (g) and N (h) for 87 day old capsicum plants which were either inoculated with live VAM inoculum +VAM (•) or killed inoculum -VAM (0). Vertical bars, representing the l.s.d. at P=0.05, are for the comparison of means (P x +VAM means or the P means at +VAM only, as appropriate). In (a), (b), (c), (d) and (g), the ANOVA F-test for the VAM x P interaction effect was not significant (P>0.05). Data were averaged over the two N rates used in the experiment (50 or 200 mg N/ L in the irrigation solution).
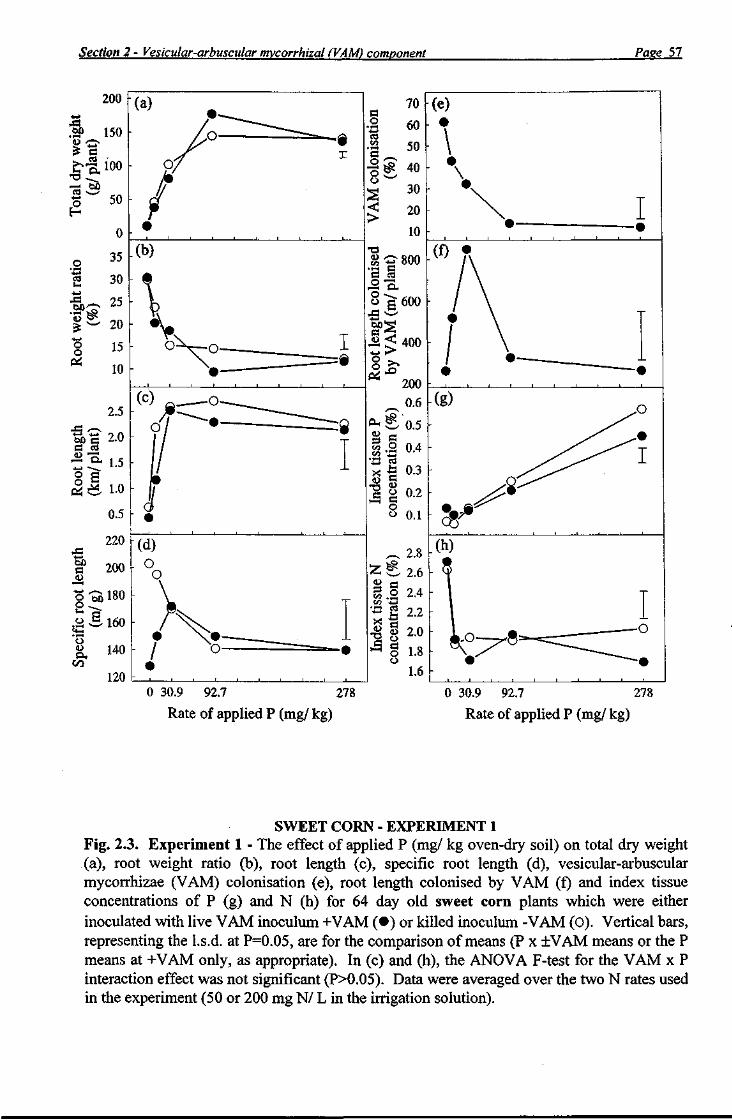
Section 2 - Vesicular-arbuscular mycorrhizal (VAM) component Pase 57
0 30.9 92.7 278
Rate of applied P (mg/ kg) 0 30.9 92.7
Rate of applied P (mg/ kg) 278
SWEET CORN - EXPERIMENT 1 Fig. 2.3. Experiment 1 - The effect of applied P (mg/ kg oven-dry soil) on total dry weight (a), root weight ratio (b), root length (c), specific root length (d), vesicular-arbuscular mycorrhizae (VAM) colonisation (e), root length colonised by VAM (f) and index tissue concentrations of P (g) and N (h) for 64 day old sweet corn plants which were either inoculated with live VAM inoculum +VAM (•) or killed inoculum -VAM (O). Vertical bars, representing the l.s.d. at P=0.05, are for the comparison of means (P x ±VAM means or the P means at +VAM only, as appropriate). In (c) and (h), the ANOVA F-test for the VAM x P interaction effect was not significant (P>0.05). Data were averaged over the two N rates used in the experiment (50 or 200 mg N/ L in the irrigation solution).

Section 2 - Vesicular-arbuscular mycorrhizal (VAM) component Paze 58
0 30.9 92.7
Rate of applied P (mg/ kg) 0 30.9 92.7 278
Rate of applied P (mg/ kg)
TOMATO - EXPERIMENT 1 Fig. 2.4. Experiment 1 - The effect of applied P (mg/ kg oven-dry soil) on total dry weight (a), root weight ratio (b), root length (c), specific root length (d), vesicular-arbuscular mycorrhizae (VAM) colonisation (e), root length colonised by VAM (f) and index tissue concentrations of P (g) and N (h) for 52 day old tomato plants which were either inoculated with live VAM inoculum +VAM (•) or killed inoculum -VAM (0). Vertical bars, representing the l.s.d. at P=0.05, are for the comparison of means (P x ±VAM means or the P means at +VAM only, as appropriate). In (b), (d) and (h), the ANOVA F-test for the VAM x P interaction effect was not significant (P>0.05). Data were averaged over the two N rates used in the experiment (50 or 200 mg N/ L in the irrigation solution).

Section 2 - Vesicular-arbuscular mycorrhizal (VAM) component Page 59
0 27.5 82.5 248 0 27.5 82.5 248
Rate of applied P (mg/ kg) Rate of applied P (mg/ kg)
CAPSICUM - EXPERIMENT 3 - Nj ONLY Fig. 2.5. The effect of applied P (mg/ kg oven-dry soil) on (a) total dry weight, (b) root weight ratio, (c) root length, (d) specific root length, (e) vesicular-arbuscular mycorrhizal (VAM) colonisation, (/) root length colonised by VAM, (g) length of external hyphae, (h) root starch concentration, (i) root starch content, and (/) index tissue P concentration of 103-day-old capsicum plants grown in Experiment 3 in the presence (+VAM, • ) or absence (-VAM, O) of an extraradical mycorrhizal mycelium. Vertical bars, representing the l.s.d. at P=0.05, are for the comparison of means (P x ±VAM means or the P means at +VAM only, as appropriate). In (a), (c), (h), (/) and (/'), the ANOVA F-test for the VAM x P interaction effect was not significant (P>0.05). In (J) and (g), the ANOVA F-test for P addition was not significant (P>0.05). Data from only the lower N rate used in the experiment (50 mg N/ L in the irrigation solution) are presented. The index tissue P concentration which is considered critical for deficiency appears as a horizontal dashed line in (/').

Section 2 - Vesicular-arbuscular mvcorrhizal (VAM) component Page 60
•o (0 •a a 175 • a si / \ S > 150 • \ *-=• • • ^
tlen
g V
AM
to
L
SI
^ \ ^
1*100 *"*»
- a 1.2 (g) « o 1!:: r —•
*i0-9 - • \ . 3>8 o.8 > v
<0 J =
- f 0 , •
6 (h)
* O J * w . /\ P a 4 /\
star
at
io
\ 4-t U.
Roo
co
ncen
t
^ — — — 1 •
0 -120 [(i)
sa o O
rch
in r
pl
ant)
o N T ^ 4 0 - L ^ o o •3 s JT^m o I ~~ — • H 1 0 - O
1.25 (j) • ,—s.
O-g,1.00 -I|.,5 1 •a a u e0.50 . ^m n •o •? 1 a »^~ o - r : ; .... §0.25 • • o -
0 . cP 0 27.5 82.5
Rate of applied P (mg/ kg) 248 0 27.5 82.5 248
Rate of applied P (mg/ kg)
CAPSICUM - EXPERIMENT 4 - Ni ONLY Fig. 2.6. The effect of applied P (mg/ kg oven-dry soil) on (a) total dry weight, (b) root weight ratio, (c) root length, (d) specific root length, (e) vesicular-arbuscular mycorrhizal (VAM) colonisation, (/) root length colonised by VAM, (g) length of external hyphae, (//) root starch concentration, (/) root starch content, and (/) index tissue P concentration of 56-day-old capsicum plants grown in Experiment 4 in the presence (+VAM, • ) or absence (-VAM, 0) of an extraradical mycorrhizal mycelium. Vertical bars, representing the l.s.d. at P=0.05, are for the comparison of means (P x ±VAM means or the P means at +VAM only, as appropriate). In (b), the ANOVA F-test for the VAM x P interaction effect was not significant (P>0.05). In (/) and (g), the ANOVA F-test for P addition was not significant (P>0.05). Only one N rate was used in this experiment (50 mg N/ L in the irrigation solution). The index tissue P concentration which is considered critical for deficiency appears as a horizontal dashed line in (/').

Section 2 - Vesicular-arbuscular mycorrhizal (VAM) component Pase 61
16 oo
O 12 S o
50
£ 40 .a • 8 * o o
II
I
a,
30
20
0.6
0.4
0.2
0
250
200
J150
100
50
.(C)
o-q
(d)
0 27.5 82.5
Rate of applied P (mg/ kg) 248
0 27.5 82.5 248
Rate of applied P (mg/ kg)
SWEET CORN - EXPERIMENT 3 - Ni ONLY Fig. 2.7. The effect of applied P (mg/ kg oven-dry soil) on (a) total dry weight, (b) root weight ratio, (c) root length, (d) specific root length, (e) vesicular-arbuscular mycorrhizal (VAM) colonisation, (J) root length colonised by VAM, and (g) index tissue P concentration of 56-day-old sweet corn plants grown in Experiment 3 in the presence (+VAM, • ) or absence (-VAM, O) of an extraradical mycorrhizal mycelium. Vertical bars, representing the l.s.d. at P=0.05, are for the comparison of means (P x ±VAM means or the P means at +VAM only, as appropriate). In (d), the ANOVA F-test for the VAM x P interaction effect was not significant (P>0.05). In (e) and (/), the ANOVA F-test for P addition was not significant (P>0.05). Data from only the lower N rate used in the experiment (50 mg N/ L in the irrigation solution) are presented. The index tissue P concentration which is considered critical for deficiency appears as a horizontal dashed line in (g).

Section 2 - Vesicular-arbuscular mycorrhizal (VAM) component Paee 62
80
J n ! ~ 70
8 ^ S < >
65
60
55
S O 400 •a a S.2 •§ O.350
.21 ^ 3 0 0 <u<; ~ > 250
(X-^oo
0 27.5 82.5
Rate of applied P (rag/ kg)
0 27.5 82.5
Rate of applied P (mg/ kg)
SWEET CORN - EXPERIMENT 4 - Ni ONLY Fig. 2.8. The effect of applied P (mg/ kg oven-dry soil) on (a) total dry weight, (b) root weight ratio, (c) root length, {d) specific root length, (e) vesicular-arbuscular mycorrhizal (VAM) colonisation, (J) root length colonised by VAM, and (g) index tissue P concentration of 33-day-old sweet corn plants grown in Experiment 4 in the presence (+VAM, • ) or absence (-VAM, O) of an extraradical mycorrhizal mycelium. Vertical bars, representing the l.s.d. at P=0.05, are for the comparison of means (P x ±VAM means or the P means at +VAM only, as appropriate). In (b) and (g), the ANOVA F-test for the VAM x P interaction effect was not significant (P>0.05). In (/), the ANOVA F-test for P addition was not significant (P>0.05). Only one N rate was used in this experiment (50 mg N/ L in the irrigation solution). The index tissue P concentration which is considered critical for deficiency appears as a horizontal dashed line in (g).
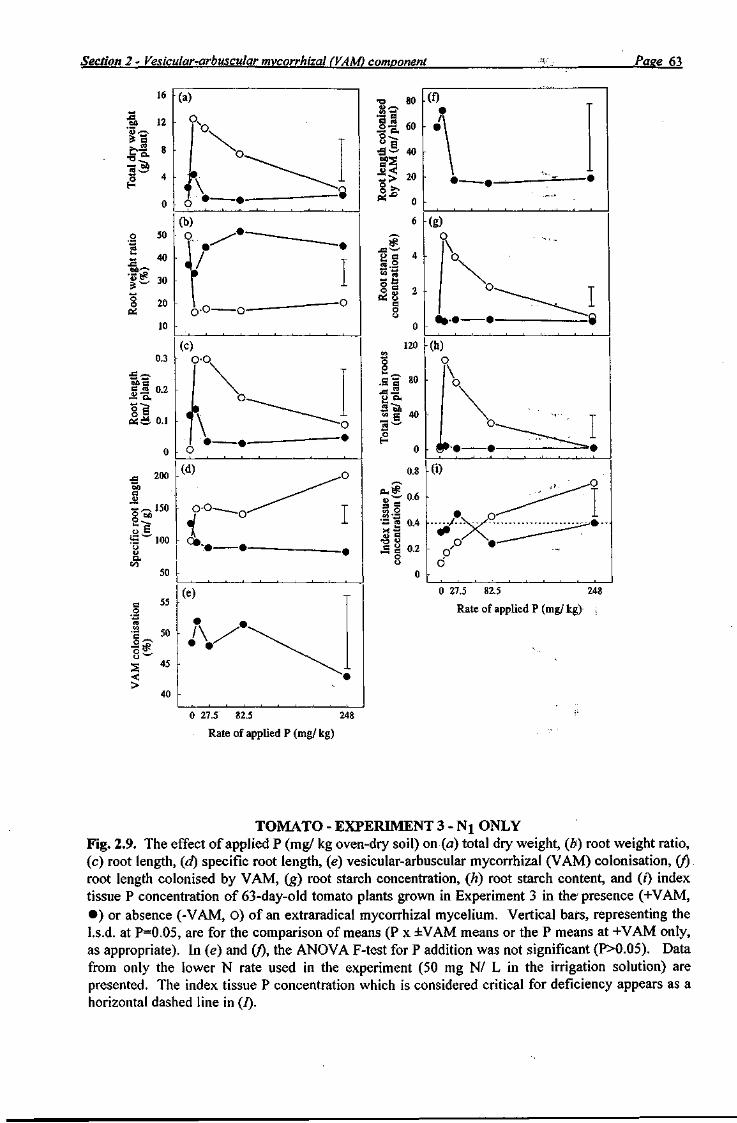
Section 2 - Vesicular-arbuscular mvcorrhizal (VAM) component f . Pase 63
0 27.5 82.5 248
Rate of applied P (mg/ kg)
0 27.5 82.5
Rate of applied P (mg/ kg) 248
TOMATO - EXPERIMENT 3 - Ni ONLY Fig. 2.9. The effect of applied P (mg/ kg oven-dry soil) on (a) total dry weight, (6) root weight ratio, (c) root length, (d) specific root length, (e) vesicular-arbuscular mycorrhizal (VAM) colonisation, (/) root length colonised by VAM, (g) root starch concentration, (h) root starch content, and (/) index tissue P concentration of 63-day-old tomato plants grown in Experiment 3 in the presence (+VAM, • ) or absence (-VAM, 0) of an extraradical mycorrhizal mycelium. Vertical bars, representing the l.s.d. at P=0.05, are for the comparison of means (P x ±VAM means or the P means at +VAM only, as appropriate). In (e) and (/), the ANOVA F-test for P addition was not significant (P>0.05). Data from only the lower N rate used in the experiment (50 mg N/ L in the irrigation solution) are presented. The index tissue P concentration which is considered critical for deficiency appears as a horizontal dashed line in (I).
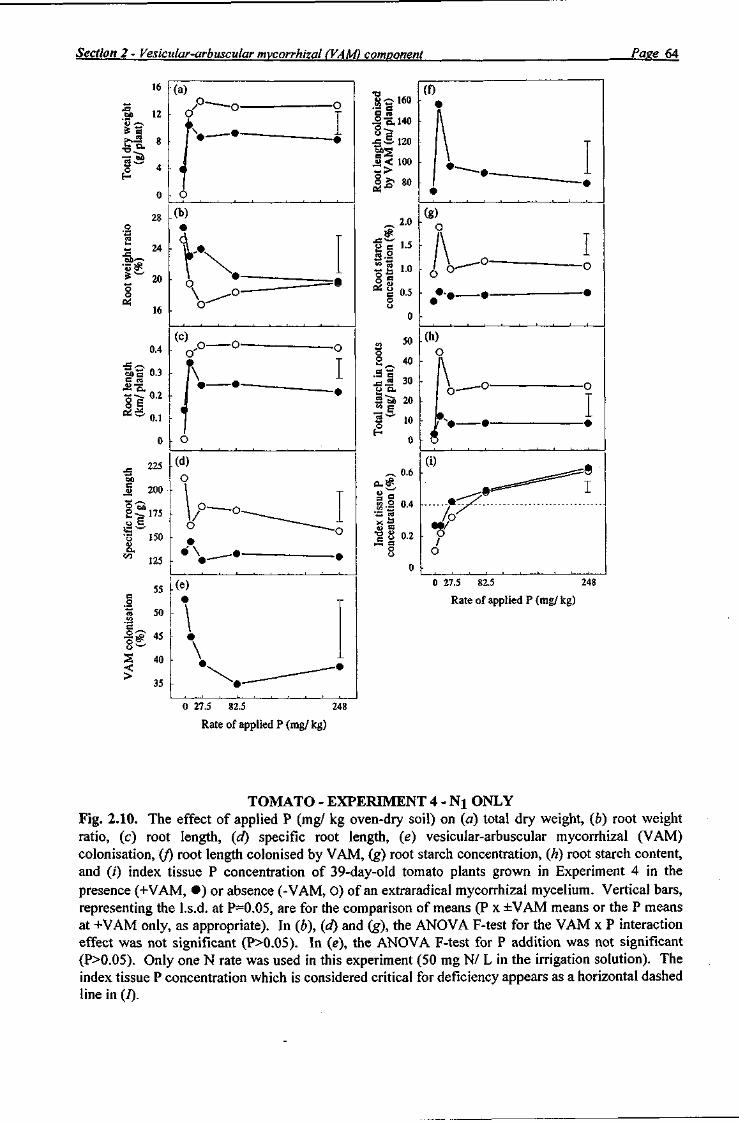
Section 2 - Vesicular-arbuscular mycorrhizal (VAM) component Pase 64
ft 16
12
28
Z 24
Z 20
o o Pi
16
II"
%
0.1
225
200
150 Q.
on 125
55
a 50 Vi
SS 45
s 40
35
- O - -O
(d) o
• \ -o
- •
(e)
\
0 27.5 82.5 248
Rate of applied P (mg/ kg)
"O (0 8-.160 • a a |\ .2-5.140 " \ o - ^ l\ £•£•120 - T 605 B ^5
\ JJ< 100
( ^ - • " • .
o ^ 8 0 - 1 •
" • _ #
(g) 2.0
o •g^l.5 a o •A I
-A- n
Roo
ts
icen
tra
-A
O -A-
o u
-A-— 0
0 •
» 50 .(h) o o e 40 • l \
.sa ,„ \ .a .2 30
2"Sb 20 I 2 10 • J % -— • • H i 0 - o
|(i) ^_ 0.6 _^ :=:==s=8
cu# ^9*===s===!^ I
jg.8 0.4 .•rf, 5? jg.8 0.4
K jg.8 0.4
•g 8 0.2 m B
. o / o o o
0 -0 27.5 82.5 248
Rate of applied P (mg/ kg)
TOMATO - EXPERIMENT 4 - Ni ONLY Fig. 2.10. The effect of applied P (mg/ kg oven-dry soil) on (a) total dry weight, (b) root weight ratio, (c) root length, (d) specific root length, (e) vesicular-arbuscular mycorrhizal (VAM) colonisation, (J) root length colonised by VAM, (g) root starch concentration, (/z) root starch content, and (0 index tissue P concentration of 39-day-old tomato plants grown in Experiment 4 in the presence (+VAM, • ) or absence (-VAM, 0) of an extraradical mycorrhizal mycelium. Vertical bars, representing the l.s.d. at P=0.05, are for the comparison of means (P x ±VAM means or the P means at +VAM only, as appropriate). In (b), {d) and (g), the ANOVA F-test for the VAM x P interaction effect was not significant (P>0.05). In (e), the ANOVA F-test for P addition was not significant (P>0.05). Only one N rate was used in this experiment (50 mg N/ L in the irrigation solution). The index tissue P concentration which is considered critical for deficiency appears as a horizontal dashed line in (J).
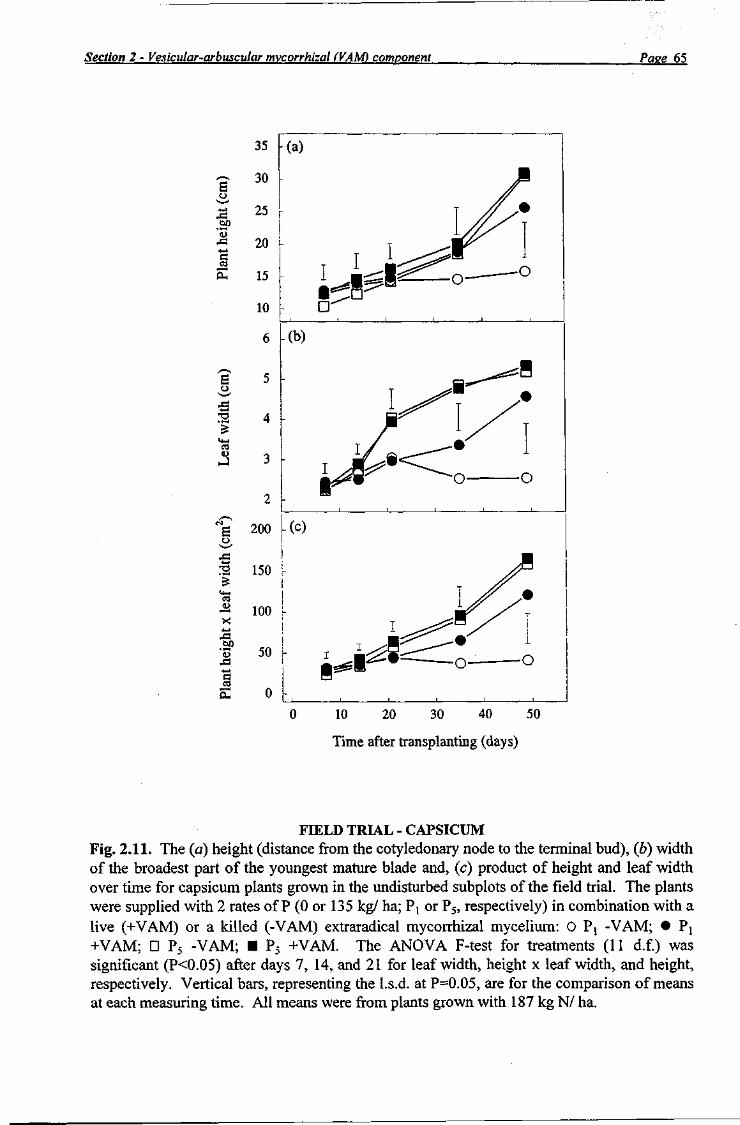
Section 2 - Vesicular-arbuscular mvcorrhizal (VAM) component Page 65
S o
-4—»
a o
•3
as
E o
•a
C3
X +-»
.£P '5 43 -4-J a
10 20 30 40 50
Time after transplanting (days)
FIELD TRIAL - CAPSICUM Fig. 2.11. The (a) height (distance from the cotyledonary node to the terminal bud), (b) width of the broadest part of the youngest mature blade and, (c) product of height and leaf width over time for capsicum plants grown in the undisturbed subplots of the field trial. The plants were supplied with 2 rates of P (0 or 135 kg/ ha; P! or P5, respectively) in combination with a live (+VAM) or a killed (-VAM) extraradical mycorrhizal mycelium: 0 P, -VAM; • P[ +VAM; • P5 -VAM; • P5 +VAM. The ANOVA F-test for treatments (11 d.f.) was significant (PO.05) after days 7, 14, and 21 for leaf width, height x leaf width, and height, respectively. Vertical bars, representing the l.s.d. at P=0.05, are for the comparison of means at each measuring time. All means were from plants grown with 187 kg N/ ha.

Section 2 - Vesicular-arbuscular mycorrhizal (VAM) component Page 66
B _o ea Ja B 4) O B O o
3
X
B
0.5
0.4
0.3
0.2
0.1
0.5
0.4
0.3
0.2
0.1
0.5
0.4
0.3
0.2
0.1
(b)
(C)
B O
B <o o 8 o o
3
X U
T3
,3
0 15 45 135
Rate of applied P (kg/ ha) 0 15 45 135
Rate of applied P (kg/ ha)
FIELD TRIAL - CAPSICUM Fig. 2.12. The effect of applied P on the P (a, b, and c) and N (d, e, and J) concentrations in the YMB+P of capsicum plants grown in the undisturbed subplots of the field trial at 32 (first anthesis), 43 (80% flowering), and 50 (fruit set) days after transplanting, respectively. The plants were grown in the presence of a live extraradical mycorrhizal mycelium at 112 (A) or 187 (•) kg N/ ha or a killed mycelium at 187 (0) kg N/ ha. Vertical bars, representing the l.s.d. at P=0.05, are for the comparison of means. In (d), the ANOVA F-test for treatments (11 d.f.) was not significant (P>0.05). The index tissue P concentration which is considered critical for deficiency appears as a horizontal dashed line in (a), (b), and (c). The N concentration in the YMB+P considered critical for deficiency (3.0%) was well below the range of means, and, therefore, does not appear in (d), (e), and (J).
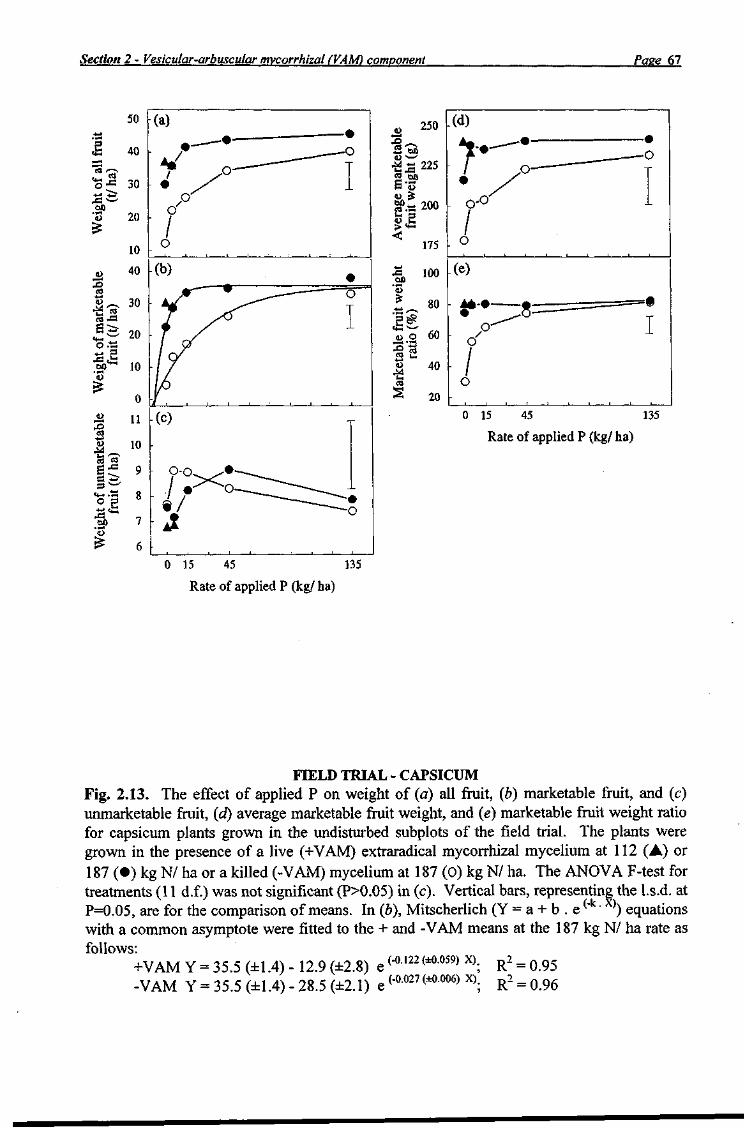
Section 2 - Vesicular-arbuscular mycorrhizal (VAM) component Pase 67
250 -
3 e>0 u~—'
225 2 w> ts-S « £ eg.T5 200 <L> 2 > « w <
175
£ 100 bO <u £ 80
P ^ «J3 > - ' 1) O 60
a) 40 u. 03
s 20
0 15 45 135
Rate of applied P (kg/ ha)
0 15 45
Rate of applied P (kg/ ha)
FIELD TRIAL - CAPSICUM Fig. 2.13. The effect of applied P on weight of (a) all fruit, (b) marketable fruit, and (c) unmarketable fruit, (d) average marketable fruit weight, and (e) marketable fruit weight ratio for capsicum plants grown in the undisturbed subplots of the field trial. The plants were grown in the presence of a live (+VAM) extraradical mycorrhizal mycelium at 112 (A) or 187 (•) kg N/ ha or a killed (-VAM) mycelium at 187 (O) kg N/ ha. The ANOVA F-test for treatments (11 d.f.) was not significant (P>0.05) in (c). Vertical bars, representing the l.s.d. at P=0.05, are for the comparison of means. In (b), Mitscherlich (Y = a + b . e ("k'X)) equations with a common asymptote were fitted to the + and -VAM means at the 187 kg N/ ha rate as follows:
+VAM Y = 35.5 (±1.4) -12.9 (±2.8) e("0122(±0059) X); R2 = 0.95 -VAM Y = 35.5 (±1.4)-28.5 (±2.1) e(-°027(±0006) X); R2 = 0.96
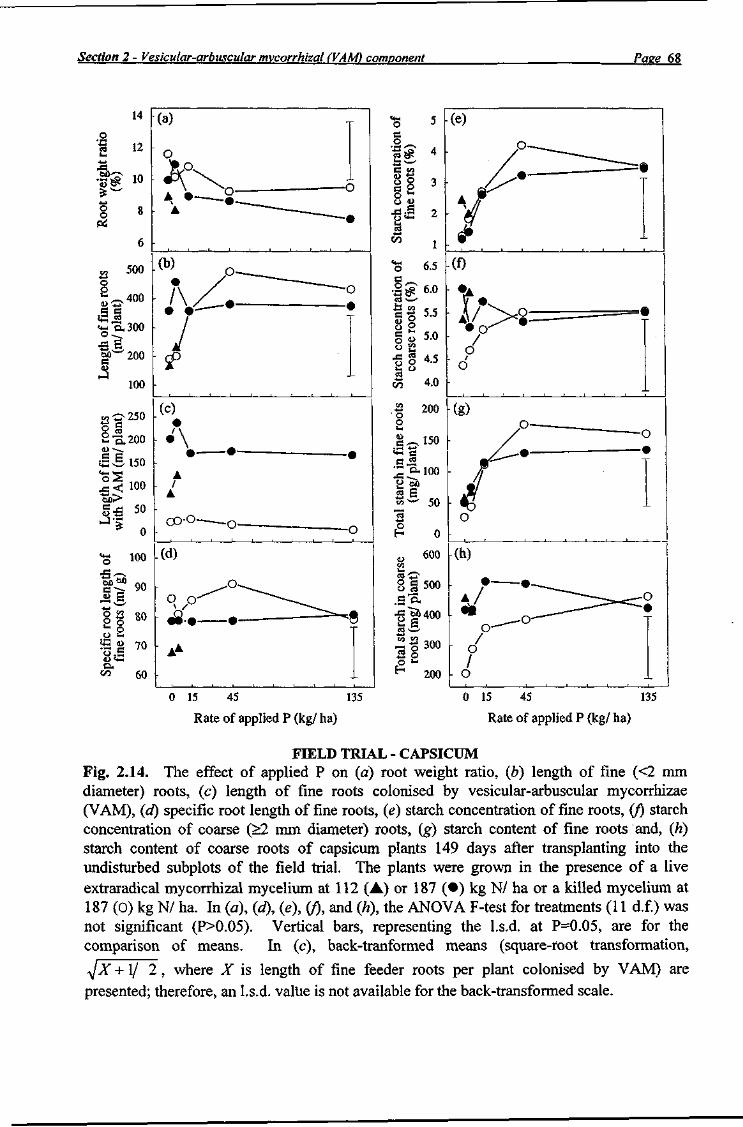
Section 2 - Vesicular-arbuscular mycorrhizal (VAM) component Page 68
0 15 45 135
Rate of applied P (kg/ ha)
0 15 45 135
Rate of applied P (kg/ ha)
FIELD TRIAL - CAPSICUM Fig. 2.14. The effect of applied P on (a) root weight ratio, (b) length of fine (<2 mm diameter) roots, (c) length of fine roots colonised by vesicular-arbuscular mycorrhizae (VAM), (d) specific root length of fine roots, (e) starch concentration of fine roots, (/) starch concentration of coarse (>2 mm diameter) roots, (g) starch content of fine roots and, (h) starch content of coarse roots of capsicum plants 149 days after transplanting into the undisturbed subplots of the field trial. The plants were grown in the presence of a live extraradical mycorrhizal mycelium at 112 (A) or 187 ( • ) kg N/ ha or a killed mycelium at 187 (0) kg N/ ha. In (a), (d), (e), (f), and (h), the ANOVA F-test for treatments (11 d.f.) was not significant (P>0.05). Vertical bars, representing the l.s.d. at P=0.05, are for the comparison of means. In (c), back-tranformed means (square-root transformation,
^X +1/ 2 , where X is length of fine feeder roots per plant colonised by VAM) are presented; therefore, an l.s.d. valtie is not available for the back-transformed scale.
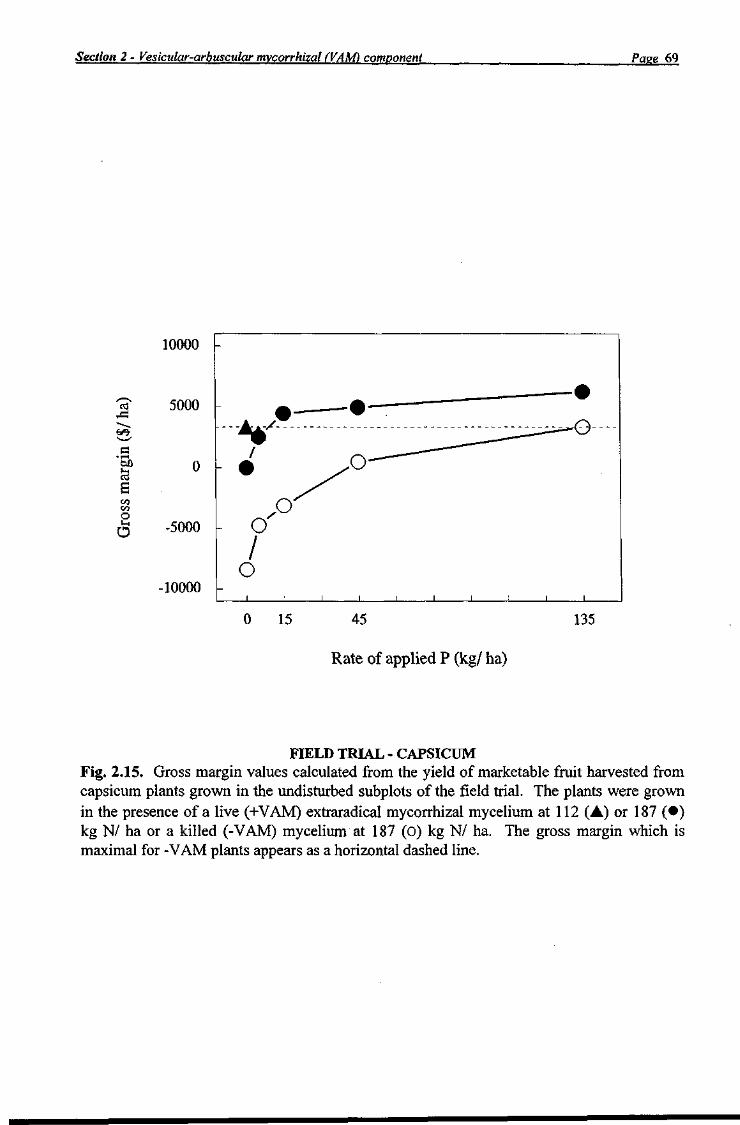
Section 2 - Vesicular-arbuscular mycorrhizal (VAM) component Page 69
J : l l i l l ! l L
0 15 45 135
Rate of applied P (kg/ ha)
FIELD TRIAL - CAPSICUM Fig. 2.15. Gross margin values calculated from the yield of marketable fruit harvested from capsicum plants grown in the undisturbed subplots of the field trial. The plants were grown in the presence of a live (+VAM) extraradical mycorrhizal mycelium at 112 (A) or 187 ( • ) kg N/ ha or a killed (-VAM) mycelium at 187 (O) kg N/ ha. The gross margin which is maximal for -VAM plants appears as a horizontal dashed line.
too I-I
10000
rt 5000
00 VI O
o -5000
-10000
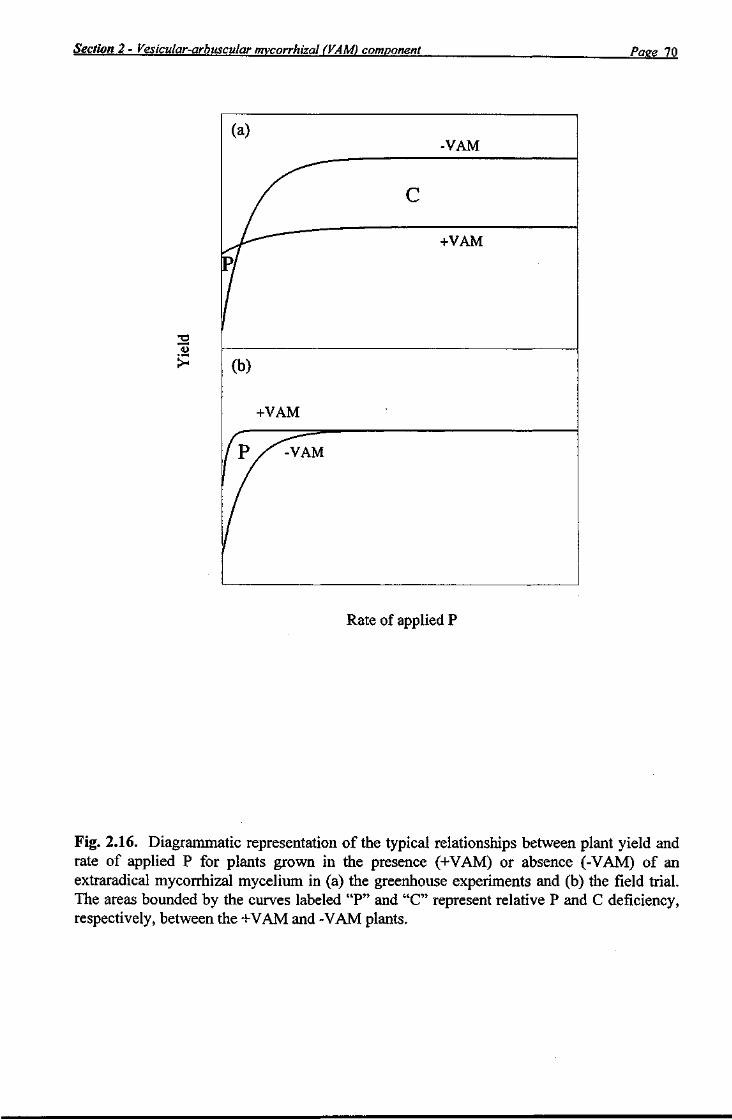
Section 2 - Vesicular-arbuscular mvcorrhizal (VAM) component Pase 70
22 •!-H
(a) -VAM
+VAM
(b)
+VAM
P X -VAM
Rate of applied P
Fig. 2.16. Diagrammatic representation of the typical relationships between plant yield and rate of applied P for plants grown in the presence (+VAM) or absence (-VAM) of an extraradical mycorrhizal mycelium in (a) the greenhouse experiments and (b) the field trial. The areas bounded by the curves labeled "P" and "C" represent relative P and C deficiency, respectively, between the +VAM and -VAM plants.

Section 2 - Vesicular-arbuscular mvcorrhizal (VAM) component Page 71
Plate 2.1. Sweet corn plants were grown to 65% kernel moisture during the preconditioning phase of the field trial. This photo was taken at the late-silking stage on 3 January 1995.
Plate 2.2. (x 11000) A representative sample of spores extracted from the "AU405" inoculum from the field trial using flotation and wet sieving techniques. The two largest white spores (diameters 269 and 210 urn) are Gigaspora margarita, whereas the smaller (diameter 120 um) orange spores are Glomus eiunicatum.

Section 2 - Vesicular-arbuscular mycorrhizal fVAM) component Page 72
Plate 2.3. Fresh capsicum fruit was harvested on five occasions during the production phase of the field trial. This photo was taken from the eastern end of the trial during the fifth harvest on 10 August 1995 (143 days after transplanting).
.
>•*? tttejKX » » # » •
i^^i^^^H
T&.m f l *jSp-;
v * ' *
1 ~
mxi i i
Plate 2.4. Sunflower plants growing in the preconditioning phase of Experiments 2 and 3. The photo was taken on 31 March 1994.
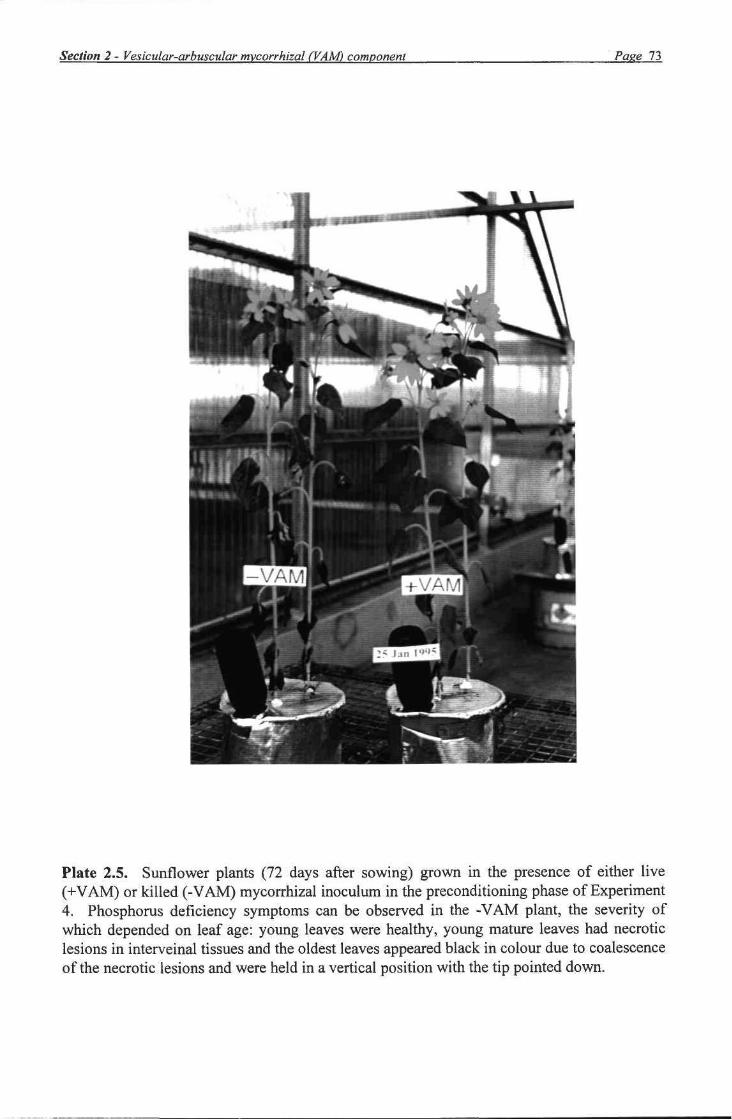
Section 2 - Vesicular-arbuscular mycorrhizal (VAM) component Page 73
Plate 2.5. Sunflower plants (72 days after sowing) grown in the presence of either live (+VAM) or killed (-VAM) mycorrhizal inoculum in the preconditioning phase of Experiment 4. Phosphorus deficiency symptoms can be observed in the -VAM plant, the severity of which depended on leaf age: young leaves were healthy, young mature leaves had necrotic lesions in interveinal tissues and the oldest leaves appeared black in colour due to coalescence of the necrotic lesions and were held in a vertical position with the tip pointed down.

Section 2 - Vesicidar-arbuscular mvcorrhizal (VAM) component Page 74
<b)
Plate 2.6. Mycorrhizal structures (stained with trypan blue) in symbiosis with the roots (cleared with KOH) of 76 day old sweet corn plants grown in the production phase of Experiment 2. In (a), arbuscules are present within cortical cells and hyphae and developing spores appear external to the root, whereas vesicles are seen in abundance within the root cortex in (b). Plants were grown at 0 mg P/ kg oven-dry soil (P[) and 50 mg N/ L supplied in the irrigation solution (Nt).

Section 2 - Vesicular-arbuscular mycorrhizal (VAM) component Page 75
(a)
(b)
Plate 2.7. Capsicum plants growing in the presence (+VAM) or absence (-VAM) of a mycorrhizal network in the production phase of Experiment 4 at either (a) 0 or (b) 27.5 mg P/ kg oven-dry soil. The photographs were taken 53 days after sowing germinated seeds within the root exclusion cages. For the stunted P-deficient -VAM plants shown in (a), abscised necrotic old leaves can be observed on the reflective insulation cover near the stem bases. The terms "P0" and "P60" which are used in the plates were subsequently replaced with "P," and "P3", respectively. All plants were supplied with 50 mg N/ L in the irrigation solution.

Section 2 - Vesiciilar-arbuscular mycorrhizal (VAM) component Page 76
(a)
1
i -
I.-—
|99S 1
fnP . ^ra ir?* " ' , '•' • ?•. /i-ift, J^"> i *V\^ .
4*r* Y^J"^^ ^•S^^- s ^ " " * * ^ i
Plate 2.8. Capsicum plants growing in the undisturbed suplots of the field trial which had been fumigated (-VAM) or not fumigated (+VAM) and fertilised with 0 kg P/ ha (P0). The term "P0" which is displayed was subsequently replaced in the text with the term "P^'. The individual photos are (a) P, -VAM and (b) P, +VAM. The exposures were taken 60 days after transplanting the seedlings into the field; by this stage of the trial, these plants had received 167 kgN/ha.

Section 3 Root-rot {Pythium) component

Section 3 - Root rot (Pythium) component Page 1
Section 3 Root-rot (Pythium) component
INTRODUCTION
Pythium spp. infections can cause a chronic destruction of root systems which can cause a loss in vigour and yield loss without the usual damping-off symptoms associated with this fungus (Hancock 1985, Liddell et al. 1988, Mircetich 1971, Stanghellini and Moorland 1986). Chronic Pythium spp. infection of roots of rockmelon plants has led to plant collapse at the fruiting stage (Cole 1994, Munnecke et al. 1984).
Pythium spp. which have been previously isolated at horticultural sites in the dry tropics of NE Australia are P. splendens, P. spinosum and P. aphanidermatum (Cole 1994). These Pythium spp. are common to tropical areas and have a wide host range (Van Der Plaats-Niterink 1981). Root loss due to Pythium species can vary between crops and cultivars (Chagnon and Belanger 1991).
Pythium spp. infections can be effectively controlled through the use of fungicides like metalaxyl or soil sterilants like metham; however, the prolonged use of these chemicals is not sustainable, due to resistance (metalaxyl) and the effects on non-target species which may be beneficial (metham). Phosphorus acid is an alternative treatment which is shown to have potential as a control agent against Oomycetes, of which Pythium spp. belongs, and may provide a "softer" and more sustainable chemical option to conventional practices.
Biological control is another option which would be desirable for chronic Pythium spp. infections. Pseudomonas cepacia is a bacteria which colonises root tips and produces antibiotics which can inhibit fungal infections and has been shown to have potential in effectively managing Pythium spp. infections (Parke 1990). The fungus Trichoderma spp. is another biocontrol agent which has shown potential in managing a variety of plant pathogens (Lewis and Papavizas 1991). Vesicular-arbuscular mycorrhizae (VAM) has been shown to increase root efficiency through increased nutrient uptake and may have a role in protecting roots from plant pathogen infections (Dehne 1982).
The purpose of this component of the project was to identify and define the role of Pythium spp. in capsicum growing in the dry tropics of NE Australia, and to investigate the potential of new management options for the sustainable control of this fungus in the region.
MATERIALS AND METHODS
Field Surveys of Pythium spp. root infections in symptomless capsicum fields
Root systems from 20 commercial capsicum fields were surveyed in the Burdekin-Bowen area of north Queensland. The fields exhibited no symptoms of wilting. Twenty plants were sampled randomly throughout the selected fields and the root systems were removed. From
Section 3 - Root rot (Pythium) component Paee 2
each root system, 20 sections of rootlets (each 1 cm long) were washed, blotted dry and placed in a Pythium spp. selective medium and incubated in Petri dishes at 26°C for 2 days. The number of rootlets showing signs of infection were counted. A sub-sample was taken for further identification and grown on potato dextrose agar (PDA) plus streptomycin for 7 days at 26°C. Identification was based on oogonium and hyphal swellings (Van Der Plaats-Niterink 1981). The frequency of isolation of Pythium spp. was based on the percentage of all rootlets tested for Pythium spp. The frequency of fields was the percentage of fields in which a Pythium spp. was detected.
Effect of Pythium spp. on capsicum in pot culture
Pythium spp. isolates from capsicum field surveys were grown on PDA for 7 days at 26°C. An inoculum suspension was made by blending the contents of 5 plates/ 500 mL of sterile deionised water; 100 mL of the inoculum was poured into 10 cm x 10 cm pots filled with pasteurised UC potting mix. Four week old capsicum seedlings (cv. Domino) were transplanted into pots. Seedlings were grown in a glasshouse for 6 weeks at temperatures between 25-35°C and watered daily. The design was a randomised block with four replicates.
After 6 weeks of growth, plant height was measured from the first node to the last. A vertical core (20 mm diameter) was taken at a distance of 1 cm from the stem of each plant (4 cores/ pot). Core samples were washed and filtered onto a 15 cm filter paper using a gentle vacuum. The filter paper was placed under clear plastic etched with a 1 cm grid. Twenty squares were selected and all roots which crossed a line of the squares were counted. Root length density was calculated and multiplied by the bulk density of the potting mix to calculate the cm of root/ cm of soil. The procedure is outlined in Hancock (1985).
Yield loss of capsicum due to asymptomatic root infections in the field
Six week old capsicum seedlings (cv. Domino) were planted in a field on the Bowen Research Station and grown with plastic mulch and trickle irrigation. The irrigation was designed to inject chemicals in a randomised block design. Metham was applied at a rate of 500 L/ ha two weeks prior to planting. Metalaxyl in the form of 250 g ai/ L in an EC formulation, phosphorus acid (200 g ai/ L) at two rates (6 and 12 L/ ha) and benlate (1kg/ ha) were applied through the trickle irrigation at planting. Phosphorus acid treatments were applied every two weeks until harvest. At harvest, all fruit were picked along the same 6 m of row over 3 weeks and total weight at each harvest was recorded.
Interaction of Pythium spp. in mixed horticulture
Isolates of P. splendens, P. spinosum and P. aphanidermatum isolated from root systems of rockmelon plants exhibiting wilt were grown and inoculum suspensions were prepared and applied as previously described. Four week old capsicum (cv. Domino) were transplanted into inoculated pots and grown and sampled as previously described.
The effect of VAM and Pythium management of capsicum in pot culture
VAM (Glomus mosseae) was incorporated into pasteurised UC potting mix; 500 g of VAM inoculum was mixed into 5 L of potting mix. Capsicum (cv. Domino) was seeded into

Section 3 - Root rot (Pythium) component Page 3
seedling trays with and without VAM. Seedlings were grown for four weeks and transplanted into 10 cm x 10 cm pots of pasteurised UC potting mix which had been inoculated with P. aphanidermatum (process previously described).
In factorial combination with or without the VAM treatment, the following treatments were applied to the selected pots: Pseudomonas cepacia, Trichoderma spp., phosphorus acid at either 5 or 10 mL/ L, or metalaxyl. Applications of these treatments is described as follows. One week prior to planting, a 100 mL suspension of the bacteria Pseudomonas cepacia was applied to pots containing the pasteurised UC mix. The inoculum suspension was made by growing bacteria on nutrient aged plates and washing bacteria off to form a suspension of bacteria at a rate of 20 plates/ L water. Pseudomonas cepacia was supplied by the University of Queensland, after showing positive effects on Pythium spp. in laboratory tests. Trichoderma spp. was isolated previously from rockmelon roots from plants in Ayr, north Queensland, and the inoculum was produced by growing Trichoderma spp. on PDA plates for seven days and preparing a suspension by blending in water at a rate of five plates/ 500 mL of sterile water. One hundred millilitres of this suspension were incorporated into the pots one week prior to planting. Metalaxyl was incorporated into the potting mix of the selected pots at a rate of 2.5 g/ 10 L potting mix (50 g ai/ kg) prior to planting. Two hundred millilitres of phosphorus acid (200 g ai/ L) at rates of 5 or 10 mL/ L were applied to seedlings at planting and again two weeks later. The capsicum plants were grown for six weeks. Core samples were taken and root length density determined in a method previously described. Plant height was measured from the first node to the last. Root colonisation by VAM on inoculated and uninoculated plants was evaluated using the staining methodology of Koske and Gemma (1989) and the survey techniques outlined in Giovannetti and Mosse (1980).
RESULTS
Field surveys of Pythium spp. root infections in symptomless capsicum fields
The fields sampled showed no visible symptoms; however, half of these fields had low levels of Pythium spp. root infection (Table 3.1). Pythium aphanidermatum was the species of Pythium most commonly isolated. Pythium aphanidermatum, P. splendens and P. spinosum have also been found in rockmelon plants exhibiting sudden wilt in north Queensland (Cole 1994), are frequently found in the soils of tropical areas, and have wide host ranges (Van Der Plaats-Niterink 1981).
Effect of Pythium spp. on capsicum in pot culture
All Pythium species isolated from root systems in capsicum fields reduced (PO.05) the root length density and plant height compared with nil (Table 3.2). Pythium aphanidermatum, P. splendens, P. spinosum and others not identified can cause a chronic pruning of roots and in particular feeder roots which can cause a loss in vigour or be asymptomatic, as opposed to damping off which can also result from these Pythium spp. infections when populations are high and conditions are conducive.
Yield loss of capsicum due to asymptomatic root infections in the field
Section 3 - Root rot ('Pythium) component Page 4
The broad spectrum soil sterilant metham produced an 11% gain in the weight of fruit harvested (6.94 kg/ m) compared with the nil treatment plants (6.23 kg/ m) (Table 3.3). The Oomycete (Pythium spp.) targeted fungicide metalaxyl produced an 18% increase over nil with a yield of 7.35 kg fruit/ m (Table 3.3). Benlate is a broad spectrum fungicide and can be effective on many species including Fusarium spp.; however, benlate had no effect on yield of fruit. This lack of effect indicates that Pythium spp. may be implicated in asymptomatic yield loss. Phosphorus acid, which also has been seen to be effective on Oomycetes as well as other genera, was not effective when injected into the trickle irrigation system at the rates used in this experiment.
Interaction of Pythium spp. in mixed horticulture
The Pythium spp. tested were all originally isolated from the root systems of rockmelon plants exhibiting wilt. In rockmelon, P. splendens and P. spinosum reduced (PO.05) root length density compared to nil (Table 3.4). In capsicum, all of the rockmelon Pythium spp. reduced (PO.05) root length density compared to nil with P. aphanidermatum causing lower root numbers than P. spinosum. None of the rockmelon Pythium spp. isolates caused any reductions in root density in tomato plants, even though these Pythium spp. can infect tomatoes.
The effect of VAM and Pythium management on capsicum in pot culture
VAM inoculation did not have any effect (P>0.05) on root length density of capsicum plants infected with P. aphanidermatum and grown in pot culture; however, the chemicals (phosphorus acid and metalaxyl) applied for, Pythium spp. management increased (PO.05) the amount of roots (as measured by root length density) compared to nil (Plate 3.1) and the potential biocontrol agent Trichoderma spp. (Fig. 3.1). In the same pot experiment, VAM inoculation was a significant factor in increasing plant height (Plate 3.2) regardless of Pythium spp. management. Plants to which metalaxyl, phosphorus acid (both rates) and the potential control agent Pseudomonas cepacia were applied had greater (PO.05) height than those grown in the Trichoderma spp. or nil treated plots (Fig. 3.2).
A test to determine the potential effect of Pythium management agents on VAM colonisation was conducted. Phosphorus acid (200 g ai) at 10 mL/ L lowered (PO.05) VAM colonisation compared to nil applications and P. cepacia and Trichoderma spp. (Table 3.5). VAM colonisation was higher for plants inoculated with P. cepacia than for plants to which metalaxyl and phosphorus acid (at both rates) were applied (Table 3.5).
The maintenance of roots in the presence of Pythium spp. infection requires management, as seen through the effects of metalaxyl and phosphorus acid (Fig. 3.1). VAM appeared to have no effect on Pythium spp. infections (Fig. 3.1); however, the function of roots remaining after Pythium spp. infections appeared to be enhanced by VAM colonisation as seen through increased plant height (Fig. 3.2). Phosphorus acid, metalaxyl and Pseudomonas cepacia also led to an increase in plant height (Fig. 3.2). The chemicals tested reduced the amount of root damage, and this effect could account for greater vigour as measured by plant height. Pseudomonas cepacia did not reduce root damage significantly but could have a role in enhancing or protecting the remaining root system. If VAM is used in conjunction with

Section 3 - Root rot (Pythium) component Pase 5
Pythium spp. management, the efficacy of inoculations may be reduced as seen through the reductions of VAM colonisation using phosphorus acid at 10 mL/ L (Table 3.5).
DISCUSSION/ RECOMMENDATIONS
Pythium spp. and in particular P. aphanidermatum can cause chronic root loss which can result in decreased vigour in capsicum. Pythium spp. infections were found in at least half of the commercial capsicum fields sampled (Table 3.1). Pythium spp. infected plants can appear symptomless and not exhibit any wilt symptoms but can produce yield loss by chronic root pruning through infection.
The Pythium spp. found on capsicum roots are common to tropical areas and have a wide host range (Van Der Plaats-Niterink 1981) and can potentially cross-infect and produce yield loss in many horticultural crops. More notice should be given to the symptomless effects of Pythium spp. and other root pathogens. Chronic root pruning by Pythium spp. has been found to be implicated in the syndrome called "sudden wilt", which affects mature rockmelon plants (Cole 1994).
The use of VAM to enhance root efficiency may be a useful factor in crop management. In the studies in this project, VAM was seen to increase plant vigour/ height of capsicum plants, but did not reduce root loss due to Pythium spp. infections; this vigour may be due to increased root efficiency. Application of treatments to reduce Pythium spp. infection has the potential to adversely reduce VAM colonisation, thereby neutralising the beneficial effect of VAM. This effect was evident for the higher rate of phosphorus acid in glasshouse studies (Table 3.5), although VAM still led to an increase (PO.05) in plant height with lower VAM colonisation (Fig. 3.2).
Management agents and rates must be considered in combined crop management programs. Further research is needed to analyse usage of VAM in field situations under Pythium spp. and root pathogen pressure.
As mentioned previously, Pythium spp. management can contribute to increased yields. Metalaxyl and metham effectively controlled Pythium spp. and resulted in an increase in fruit yield of capsicum plants grown in the field (Table 3.3); however, such a management strategy is costly and may not be sustainable. Phosphorus acid injections through the trickle showed potential but did not result in a yield increase in the field (Table 3.3). Twelve litres per hectare (200 g ai/ L) phosphorus acid has resulted in yield gains in rockmelons (Cole 1994). Further research is needed to refine phosphorus acid use in the trickle irrigation for capsicum. The potential bacterial biocontrol agent Pseudomonas cepacia has resulted in yield increase in rockmelon and has been shown to be effective against Pythium aphanidermatum in capsicum in this study. Further research is needed into this organism's ecology to begin to make it a more consistent Pythium management agent.
REFERENCES
Chagnon, M.C. and Belanger, R.R. (1991). Tolerance in greenhouse geraniums to Pythium ultimum. Plant Disease 75, 820-823.
Section 3 - Root rot (Pythium) component Pase 6
Cole, M.J. (1994). Factors causing poor root development contribute to sudden wilt and yield decline. Australian Good Fruit and Vegetables, November 1994 pp. 36-38.
Dehne, H.W. (1982). Interaction between vesicular arbuscular mycorrhizal fungi and plant pathogens. Phytopathology 72,1115-1119.
Giovannetti, M. And Mosse, B. (1980). An evaluation of techniques for measuring vesicular arbuscular mycorrhizal infection in roots. New Phytologist 84,489-500.
Hancock, J.G. (1985). Fungal infections of feeder rootlets of alfalfa. Phytopathology 75, 1112-1120.
Koske, R. E., and Gemma, J. N. (1989). A modified procedure for staining roots to detect VA mycorrhizas. Mycology Research 92,486-505.
Lewis, J.A. and Papavizas, G.C. (1991). Biocontrol of cotton damping-off caused by Rhizoctonia solani in the field with formulations of Trichoderma spp. and Gliocladium virens. Crop Protection 10,396-402.
Liddell, CM., Davis, R.M., and Nunez, J.J. (1989). Association of Pythium spp. with carrot root dieback in the San Joaquin Valley of California. Plant Disease 73,246-249.
Mircetich, S.M. (1971). The role of Pythium in feeder roots of diseased and symptomless peach trees and in orchard soils in peach tree decline. Phytopathology 61, 357-359.
Munnecke, D.E., Laemmlen, F.F. and Bricker, J. (1984). Soil fumigation controls sudden wilt of melon. California Agriculture, May-June pp. 8-9.
Parke, J.L. (1990). Population dynamics of Psuedomonas cepacia in the pea spermosphere in relation to biocontrol of Pythium. Phytopathology 80,1307-1311.
Stanghellini, M.E. and Moorland, W.L. (1986). Yield loss in hydroponically grown lettuce attributed to subclinical infection of feeder rootlets by Pythium dissotocum. Plant Disease 70,1053-1056.
Van Der Plaats-Niterink, A.J. (1981). Monograph of the genus Pythium. Studies in Mycology 21, 1-242.

Section 3 - Root rot (Pythium) component Page 1
Table 3.1. Survey of Pythium spp. conducted on symptomless capsicum fields in the Burdekin-Bowen area of northern Australia.
A R
Pythium spp. Isolation from samples Fields with Pythium spp. (%)
Pythium aphanidermatum 6 55 P. splendens 1 15 P. spinosum 2 25 P. spp 1 15
Percent of 1 cm root sections having Pythium spp. infection. Twenty 1 cm sections were taken from 20 root systems in the field.
Percent of fields which had a particular Pythium spp. found in the root survey.
Table 3.2. Effect of Pythium spp. isolated from capsicum roots in commercial fields in the dry tropics of Australia on root and shoot development of capsicum plants
subsequently grown in a greenhouse. Means within columns followed by the same letter are not significantly different (P=0.05).
Pythium spp. Root length density Plant height (cm/ cm ) (cm)
Pythium aphanidermatum 1 5.32a 20.5ab P. aphanidermatum 2 4.78a 17.6a P. aphanidermatum 3 5.86ab 19.1ab P. aphanidermatum 4 7.55abc 19.7ab P. splendens 1 5.49a 17.8ab P. splendens 2 4.83a 19.1ab P. spinosum 1 9.1bc 21.4ab P. spinosum 2 10.13c 20.6ab P. spp. 10.68c 21.9b Nil 16.29d 26.7c LSD (P = 0.05) 3.24 4.19
Estimate of root length per cm of potting mix.

Section 3 - Root rot (Pythium) component Page 8
Table 3.3. The effect of selective fungicides on the weight of fruit produced by capsicum plants grown in the field.
Means followed by the same letter are not significantly different (P=0.05).
Treatment
A
Metham Metalaxyl Benlate Phosphorus acidA 6 L/ ha Phosphorus acid 12 L/ ha Nil LSD (P = 0.05) 0.53
200 g phosphorus acid a.i./ L
Yield (kg fruit/ m)
6.94bc 7.35c 6.11a 6.27a 6.44ab 6.23a
Table 3.4. The effect of Pythium spp. on the root length density (estimate of root length per cm of soil) for mixed horticultural root systems.
Means followed by the same letter are not significantly different (P=0.05).
Plant + Pythium spp. Root length density
Rockmelon + P. splendens Rockmelon + P. spinosum Rockmelon + P. aphanidermatum Rockmelon + Nil
Capsicum + P. splendens Capsicum + P. spinosum Capsicum + P. aphanidermatum Capsicum + Nil
Tomato + P. splendens Tomato + P. spinosum Tomato + P. aphanidermatum Tomato + Nil
(cm/ cm3)
2.91a 3.45ab 4.51abc 6.05ce
3.77a 5.29bd 2.82a 8.17e
6.41ce 8.04e 6.98de 6.84de
LSD (P = 0.05) 2.25
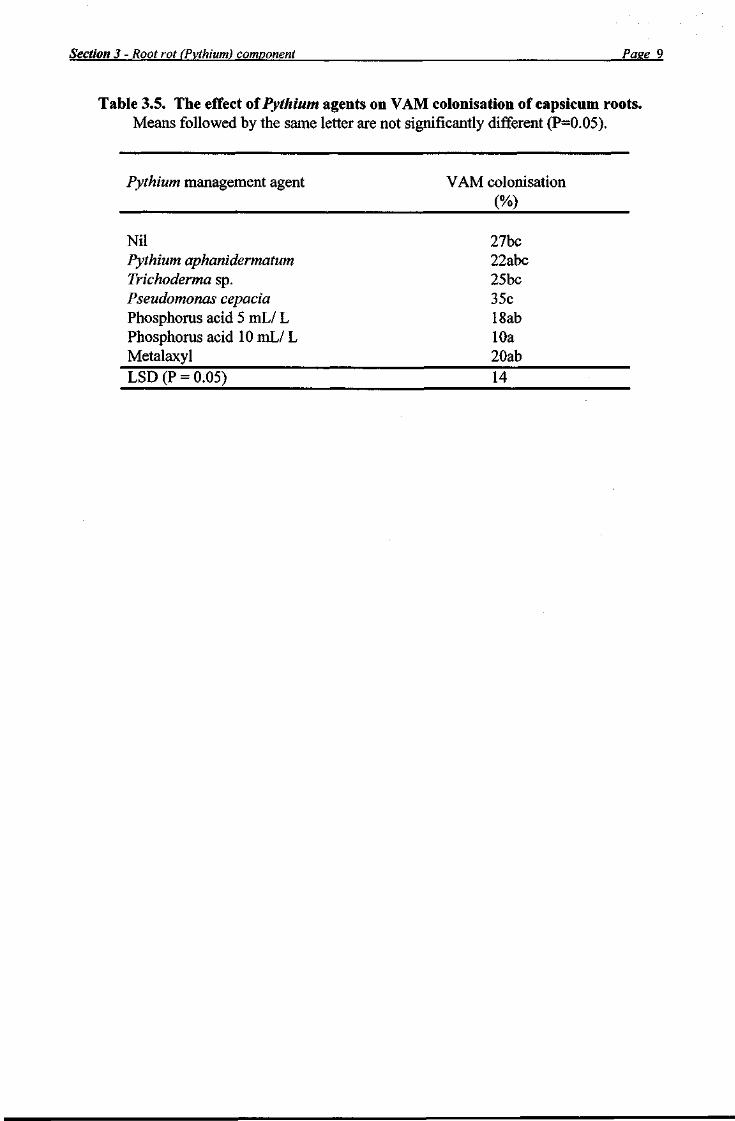
Section 3 - Root rot (Pythium) component Pase 9
Table 3.5. The effect of Pythium agents on VAM colonisation of capsicum roots. Means followed by the same letter are not significantly different (P=0.05).
Pythium management agent VAM colonisation (0/,
Nil 27bc Pythium aphanidermatum 22abc Trichoderma sp. 25bc Pseudomonas cepacia 35c Phosphorus acid 5 vaLI L 18ab Phosphorus acid 10 mL/ L 10a Metalaxyl 20ab LSD (P = 0.05) 14

Section 3 - Root rot (Pythium) component Pase 10
10"f ? 9-jr
§ 8-|
£• 74 § 6-! & 5-£ ? 4-3 3-
ool
2-EC
1 0
VAM
Pythium Treatments
Fig. 3.1 The effect of VAM and Pythium management on capsicum root length density. Columns with the same letter are not significantly different at the 5% level. There were no interactions between Pythium management and VAM.
Fig. 3.2. Main effects of VAM and Pythium management on capsicum plant height. Columns with the same letter are not significantly different at the 5% level. There were no interactions between Pythium management and VAM. The asterisk indicates that there was a significant (P<0.05) main effect of VAM on plant height.
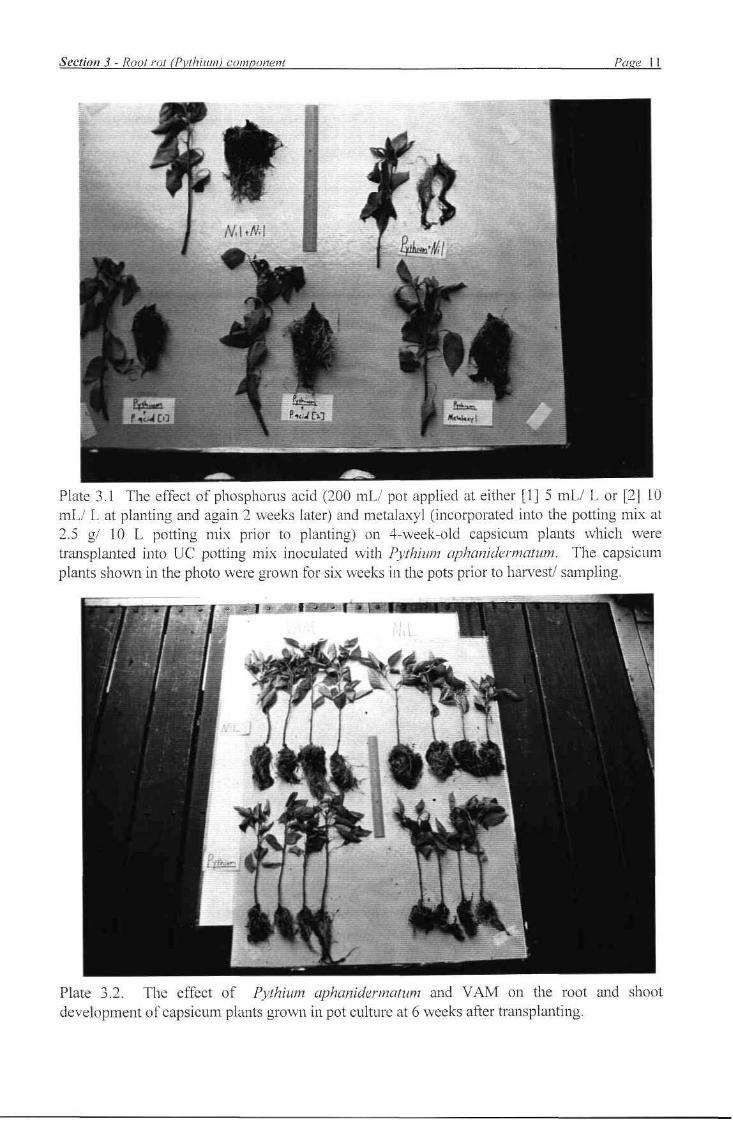
Section 3 - Root rot (Pythium) component Page 11
Plate 3.1 The effect of phosphorus acid (200 mL/ pot applied at either [1] 5 mL/ L or [2] 10 mL/ L at planting and again 2 weeks later) and metalaxyl (incorporated into the potting mix at 2.5 g/ 10 L potting mix prior to planting) on 4-week-old capsicum plants which were transplanted into UC potting mix inoculated with Pythium aphanidermatiim. The capsicum plants shown in the photo were grown for six weeks in the pots prior to harvest/ sampling.
Plate 3.2. The effect of Pythium aphanidermatiim and VAM on the root and shoot development of capsicum plants grown in pot culture at 6 weeks after transplanting.

Section 4 Nematology component
Section 4 - Nematolosv component Page 1
Section 4 Nematology component
INTRODUCTION
The soils, climate and intensive vegetable production systems of the Bundaberg region are ideal for the development of nematode pest problems. Year round production of susceptible host crops provides a year-round supply of food for nematodes while the warm climate, sandy soils and widespread use of irrigation mean that environmental conditions are ideal for nematode multiplication. Root-knot nematode is recognised as one of the most important pests of vegetable crops grown in Bundaberg and growers regularly use nematicides as an insurance against crop losses.
Control of nematodes on vegetables in Bundaberg is currently based mainly on two chemicals: fenamiphos, a non-volatile organophosphate nematicide and methyl bromide, a soil fumigant with a broad spectrum of activity against nematodes, soil-borne fungal pathogens and weeds. However the continued availability of these chemicals is now under threat for health and environmental reasons. Fenamiphos and other organosphosphate and carbamate nematicides rank amongst the most toxic chemicals used in agriculture today and, being relatively mobile, they have the potential to contaminate groundwater (Thomason, 1987). Methyl bromide has been classified as an ozone-depleting substance and is likely to be phased from use over the next 10-15 years. In addition, there are an increasing number of reports of fenamiphos losing its effectiveness because of enhanced microbial degradation (Stirling et al. 1992).
Because of the need to develop more sustainable management practices for nematodes on vegetable crops and the lack of sound information on which such pest management programs could be built, this project aimed to define the nematode problem on the diversity of crops grown in Bundaberg and to investigate the potential of some non-chemical options of managing root-knot nematode.
MATERIALS AND METHODS
Distribution of root-knot nematode on vegetables in Bundaberg
Vegetable crops in Bundaberg were surveyed during 1993 to determine the extent of root-knot nematode infestation in the district. Thirty-five typical fields were sampled by taking a composite sample of 10 soil samples from the root zone of the crop. All samples were taken within a few weeks of harvest. Information on previous cropping history and use of nematicides in the sampled crop was recorded.
Nematode population densities in each sample were assessed by extracting nematodes from a 200ml aliquot using a Baermann tray. The soil was also bioassayed for root-knot nematode by mixing 750ml field soil with 750ml sterile washed sand, adding it to three replicate 15cm pots and planting a tomato seedling cv. Tiny Tim. After 4 weeks, roots were assessed for
Section 4 - Nematoloev component Page 2
galling on a scale of 0-3, where 0 = no galls, 1 = <10 galls; 2 = 11-200 galls and 3 = >200 galls. An additional tomato plant grown in the same soil was kept for 10 weeks and a sample of 10 Meloidogyne females from some fields was dissected from the roots and used to identify the nematode using molecular techniques (Stanton et al. 1995).
Decline of root-knot nematode under bare fallow
Observations were made in a nematode-infested field at Bundaberg Research Station that contained a strongly structured, reddish brown light clay soil known as euchrozen. Heavily galled tomato plants were ploughed out in February 1994, the field was rotary-hoed, deep ripped and ploughed and nine sampling sites were then marked with a steel peg. Approximately 1L soil was then collected at depths of 0-20cm from within a 2m radius of the peg and nematode populations were determined from a 200ml subsample by extraction in a Baermann tray as described previously. Low nematode populations were also quantified using a tomato bioassay in which the number of galls were counted on plants harvested 3-4 weeks after being transplanted into the test soil. The sampling process was repeated every 4 weeks for the first three months and every 6-8 weeks thereafter. During this period, the field was maintained weed free by five cultivations with a tyned implement to a depth of about 20cm.
Resistance and tolerance of vegetable crops to root-knot nematodes
Two experiments were carried out on a euchrozen soil at Bundaberg Research Station from October 1993 to August 1994. In both experiments, nematode multiplication and the yield of various vegetable crops in plots inoculated with a high or low density of root-knot nematode was compared to that in nematicide-treated plots that were free of nematodes.
Inoculum of root-knot nematode was prepared from single egg mass populations cultured in the glasshouse on tomato. Heavily galled roots were chopped into pieces, two 25g sub-samples were immersed in 1% NaOCl for 3 minutes and eggs were retrieved on a 38ja sieve and counted. Sufficient roots were then mixed with 2L sterilised sand to give the required inoculum densities. This root/sand mix was broadcast on appropriate plots and incorporated with a rotary hoe to a depth of 7.5cm. Plots which did not receive nematodes were treated with fenamiphos by sprinkling granules of Nemacur 100G on the soil surface at a rate equivalent to 1 lOkg/ha and incorporating with a rotary hoe.
Initial nematode populations (Pi) were assessed by collecting a representative sample of soil from each plot, mixing 750ml soil with 750ml sterile washed sand and planting a tomato seedling. Galls on bioassay plants were counted after 4 weeks. After the crop had been harvested, five randomly chosen plants/plots were dug and rated for root-knot severity using the following scale: 0 = no galls; 1 = minor galling, <25% of root length galled; 2 = 25-50% of root length galled, some multiple galls; 3 = substantial multiple galling, but at least 25% of the roots not galled; 4 = severe multiple galling over most of the root system; 5 = severe multiple galling and root rot. At the same time, soil from under each plant was collected with a trowel and final nematode populations P(f) were assessed by soil counts and tomato plant bioassay.

Section 4 - Nematology component Page 3
Experiment 1 was planted in October 1993 and contained six crops (tomato cv. Floradade, rockmelon cv. Argyle, watermelon cv. Eclipse, pumpkin cv. Jarrahdale, sweet corn cv. Florida Staysweet and capsicum cv. Domino). Crops were grown in plastic mulch and irrigated by trickle irrigation. The experiment was set out in a randomised complete block design with split plots and 3 replicates. Plots were 15m wide and 5m long and were split into three 5m x 5m sub-plots to accommodate three levels of nematode infestation. Sub-plots contained 3 rows of plants with the middle row being used as the datum row. Spacings of plants within the row were tomato (40cm), rockmelon (75cm, with two plants per site), watermelon (50cm), pumpkin (100cm), sweet corn (30cm) and capsicum (30cm). Capsicum was planted in a double row. Plots were inoculated with a mixture of Meloidogyne incognita and M. javanica at densities of 0, 50 and 500 eggs/L soil to a depth of 7.5cm. Crops were harvested when fruit was mature and fruit weight and number was assessed. The harvest was completed for rockmelon and sweet corn at 70 days and tomato, capsicum, pumpkin and watermelon at 90 days from planting.
Experiment 2 was planted in April 1994 and contained tomato cv. Floradade, zucchini cv. Night Rider II, eggplant cv. Blackmail, french bean cv. Bn0071, button squash cv. Yellow Ruffles, broccoli cv. Generation, capsicum cv. Target, sweet corn cv. Florida Staysweet and Chinese cabbage cv. Wongbok. Sweet corn and french bean were direct sown and other crops were transplanted. Crops were watered by trickle irrigation and all except french bean were grown under plastic mulch. This experiment was set up in a randomised complete block design with split plots and 6 replicates; plots were 5 m wide and contained three rows 5 m long (Plate 4.1). One of the three nematode infestation levels was allocated to each row. Plantings were spaced 50cm apart in a single row except for capsicum (50cm apart, double row), sweet corn (30cm, single row) and french bean (10cm, double row). Plots were inoculated with M. javanica at densities of 0, 100 and 1000 eggs/L soil to a depth of 7.5cm. Crops were harvested when fruit were at maturity and fruit weight and number was assessed. The number of days to final harvest for each crop was as follows: Chinese cabbage, 58 days; zucchini, 62 days; button squash, 65 days; broccoli, 65 days; french bean, 72 days, sweet corn, 107 days; capsicum, 120 days; tomato, 145 days and eggplant, 167 days. Harvesting of the Chinese cabbage is shown in Plate 4.2.
Effect of planting date on damage caused by root-knot nematode
Three similar experiments were planted on a red euchrozen soil at Bundaberg Research Station on 13th March, 5th July and 12th September 1995. Each experiment was a randomised complete block design of 3 treatments and 10 replications.
Floradade seedlings were grown in the planthouse for 2 weeks and then transplanted to 15 cm diameter plastic pots containing a sandy loam soil. Two weeks later, ten seedlings were inoculated with either 1000 or 10000 eggs of root-knot nematodes or left untreated. When 6 weeks old, the potted plants were transplanted to the field at a plant spacing of 1.5m and grown using plastic mulch and trickle irrigation. Prior to laying the plastic mulch, uninoculated nematode plots were treated with fenamiphos at lOkg/ha.
Yield data (fruit weight and number) and disease ratings for root-knot severity were assessed at the conclusion of each experiment. Soil from under each plant was sampled and assessed
Section 4 - Nematolosv component Page 4
for nematode populations by the Whitehead tray method. Ambient temperatures and soil temperatures at depths of 7.5cm and 22.5cm were recorded during each experiment.
Nematode control with organic amendments
This experiment was established in October 1993 in a field of euchrozen soil at Bundaberg Research Station. Previously, sampling had indicated that it was infested with Meloidogyne javanica. Twenty-eight plots each 9m x 4.5m were established so that each plot could accommodate 3 beds of tomatoes each 9m long. During the period October 1993 to April 1994, seven treatments, each replicated four times were established in a randomised block design (Table 4.4). Sawdust + urea and filter press treatments were broadcast over the surface of the appropriate plots (Plate 4.3) and incorporated with a rotary hoe while the green manure crop was sown to provide a thick even plant cover over all the plot.
In April 1994 the experimental area was prepared for planting by forming 3 beds each lm wide in each plot. Beds were mulched with black plastic, tomato seedlings were transplanted into the bed and the crop was watered by trickle, irrigation. Molasses was injected into the trickle line of appropriate plots (Plate 4.4) using a system of in-line taps which isolated each plot from others in the trial. All treatments received a basal fertilizer dressing at a rate of 1950kg/ha (N : P : K 4.2 : 5.7 : 6.7) plus a superphosphate at 750kg/ha, and side dressings of MAP and CaN03.
Examination of roots at the end of the crop showed that root-knot nematode was not uniformly distributed in the experimental area and that the variability was not related to treatment. Consequently, the plastic mulch was removed, soil known to be infested with M. javanica was spread on each bed and incorporated with a rotary hoe and a second tomato crop was grown for 3 months. Roots of this crop were heavily galled and soil samples showed that the mean nematode population was 106 Meloidogyne per 200ml soil and that nematodes were evenly distributed across the trial site.
In January 1995, the original experiment was repeated except for a minor change in the green manure treatment. The same experimental design was retained so that plots received the same treatments as had been applied in 1993-94 (Table 4.4). Nematode populations were assessed in July 1995, prior to plough out of the velvet bean treatment and prior to the July application of sawdust, urea and filter press. Soil samples consisting of 10 cores/plot were collected and nematodes were extracted with a Baermann tray.
This experiment was set up and managed in the same way as the first experiment. Weekly applications of molasses commenced 1 week prior to transplanting tomatoes and continued for 12 weeks. Because of concern about nitrogen drawdown problems in the sawdust treatment, nitrate levels in petioles of treatments 1 and 7 were monitored weekly, commencing 4 weeks after planting. At the time nitrate sap testing commenced, soil samples were also collected from each treatment for nutrient analysis.
Plants were grown for three months, but at about the time the crop was due to be harvested an outbreak of Fusarium oxysporum f.sp. lycopensici race 3 began to appear in the crop. The number of wilt-affected plants was recorded for each treatment and healthy plants were then
Section 4 - Nematoloev component Page 5
cut at ground level and weighed. A sample of 5 plants were dug and assessed for galling and a soil sample was collected and processed for nematodes.
RESULTS
Distribution of root-knot nematodes on vegetables in Bundaberg
Results from a limited number of samples from the nine most important vegetable crops in Bundaberg showed that tomato and zucchini were generally infested with root-knot nematode at harvest whereas the nematode was uncommon on beans (Table 4.1). Eggplant, squash, capsicum, sweet corn, pumpkin and rockmelon were hosts of Meloidogyne but were not always heavily infested. Four types of root-knot nematode were identified from Bundaberg, namely M. arenaria haplotypes A and C, M. incognita and M. javanica.
Decline of root-knot nematode under bare fallow
Rainfall during the first three months of the study period was 40% less than the average for Bundaberg, but monthly rainfall was never less than 50mm (Fig. 4.1). Mean soil temperatures at 7.5cm declined from about 28°C in February to 19°C in May. The initial population density was 583 nematodes/200ml soil, but within 1-2 months, this population had declined by more than 80% (Fig. 4.1). A further slow decline in nematodes occurred during the next 9 months until the population was barely detectable by bioassay (ie. 7 galls/ 750ml field soil).
Resistance and tolerance of vegetable crops to root-knot nematode
Results of experiment 1 (Table 4.2) showed that root-knot nematodes multiplied readily on tomato, pumpkin and rockmelon and plants were heavily galled at harvest. The heavy nematode infestation in plots inoculated with high numbers of nematodes resulted in a substantial decrease in yield, but because of the limited replication, this decrease was not always significant. In contrast, fewer nematodes multiplied on capsicum and sweet corn and plots inoculated with nematodes produced similar yields to the controls. Watermelon produced an anomalous result, probably because many vines collapsed prior to harvest. High ambient temperatures (daily maxima greater than 30°C) and inadequate irrigation at the time of high moisture demand by the crop were the most likely causes of the collapse. Root rots associated with vine collapse made root gall evaluations difficult, but galling appeared to be less severe than on the more susceptible crops. Nevertheless, significant crop losses were observed in plots inoculated with nematodes.
In experiment 2, M. javanica multiplied on tomato and eggplant and poorly on french bean, capsicum and sweetcorn (Table 4.2). Other crops were intermediate in susceptibility. Zucchini and eggplant were the only crops to show a significant reduction in yield in response to the high nematode treatment. However, a severe outbreak of mosaic virus in the zucchini reduced overall yields and caused picking to cease prematurely.
Effect of planting date on damage caused by root-knot nematode

Section 4 - Nematolosv component Pase 6
Data on soil and air temperatures for the main vegetable cropping season in Bundaberg is presented in Fig. 4.2. In each of the three planting date experiments, plants inoculated with 10 000 root-knot nematodes were severely galled and nematode populations of more than 3000 juveniles/200ml soil were found at harvest (Table 4.2). Plants inoculated with 1000 nematodes were not as heavily galled and generally had fewer nematodes in the soil at harvest. Nematicide-treated, uninoculated plants remained free of nematodes but despite differences in the degree of nematode infestation and root damage, yield differences between infested and non-infested plants were never more than 20%. Yields in the autumn planted crop were much higher than other crops, perhaps because this crop matured during winter and weekly harvests were possible over a nine week period. Only 5 harvests were taken from the other two trials.
Nematode control with organic amendments
The experimental tomato crop (crop 3) grew normally and there were no obvious differences in plant growth between treatments. Nitrate sap testing showed that there was little difference in nitrate levels between sawdust and untreated plots (Table 4.5). However, nitrate levels in soil were lower in treatments containing sawdust than in other treatments (Table 4.6). Fusarium wilt was more severe in plots treated with filter press. There were 60 and 38% wilt affected plants in treatments 2 and 4 respectively, but in all other treatments, less than 14% of plants were wilted. When the experiment was terminated, there were no significant differences in plant biomass between treatments (Table 4.7). Plants in untreated plots were heavily galled but all organic amendments reduced galling and root-knot nematode populations in soil. The affect was most pronounced with sawdust, which produced roots which were almost free of galls. Sawdust-amended soil also contained high numbers of free living nematodes (Table 4.7).
DISCUSSION
All major vegetable crops grown in the Bundaberg region are known hosts of root-knot nematodes. The two experiments on nematode multiplication confirmed the susceptibility of these crops, while our limited survey confirmed the widespread distribution of the pest on vegetables. French bean was the only crop where relatively high infestations of the nematode were never observed, perhaps because it is grown as an opportunistic crop following sugarcane or on new land, where root-knot nematode populations tend to be low. Also, it is a relatively short-term crop (8 weeks) and nematodes may have insufficient time to increase to high population densities. The variability in the reaction of capsicum in the two multiplication experiments (Table 4.2) was due to its differential reaction to Meloidogyne spp.; it is generally resistant to M. javanica and susceptible to other species (Sasser and Kirby 1979).
Absence of nematode infestation in some of the surveyed crops sometimes may have been due to nematicide use. However, nematodes were generally present at the end of the season in fields where fenamiphos, metham sodium or methyl bromide had been used. The presence of nematodes at this time does not indicate that control was insufficient to prevent yield losses from nematodes but maybe of concern because it suggests that populations in nematicide-treated crops have reached levels which could affect the following crop.

Section 4 - Nematology component Pase 1
Observations on nematode species identity showed that several Meloidogyne species were present in Bundaberg. The species complex contains M. javanica, M. arenaria and M. incognita, the three most common Meloidogyne spp. in warm temperate and tropical regions of the world (Taylor and Sasser 1978). Insufficient samples were taken to determine whether particular crops tended to host only some species.
Data collected on the decline of root-knot nematodes under fallow confirmed observations made in other cropping systems elsewhere in Queensland (Stirling and Nikulin 1993). Nematode eggs hatch in warm, moist soils and then die within a few weeks if a host is not present, so that reductions in populations of the magnitude observed in our experiment are to be expected in a clean fallow.
In the first crop tolerance experiment (Table 4.2), nematode infested tomatoes, pumpkins, rockmelons and watermelons yielded 20-36% less than nematode-free plants. However, because of the limited replication in the experiment, this yield reduction was not always statistically significant. Sweetcorn and capsicum were relatively tolerant of nematode attack. In experiment 2, where the crop grew during the autumn/winter period, yield reductions due to nematodes were less than 20% and were significant only for eggplant and zucchini. Nematodes reached a high population density on tomato and caused extensive galling without reducing yield, while all other crops showed good tolerance to root-knot nematode.
The difference in the reaction of tomatoes to root-knot nematode between spring and autumn -planted crops suggested that environmental stresses were an important component of this root disease syndrome. Further work in which the yield of nematode infested and nematode-free tomatoes were compared at different planting times (Table 4.3) confirmed that it was difficult to show that root-knot nematode caused serious economic losses. Severe galling did not reduce yields by more than 20% at any of the planting times and in the winter/spring planting, significant yield reductions were not observed. It appears that in a fertile soil, under conditions which provide adequate moisture and nutrients and where the crop is growing and fruit is ripening under relatively benign environmental conditions (ie. late autumn to early spring in Bundaberg), tomatoes are relatively tolerant to root-knot nematodes. Such effects are commonly observed with other nematode problems.
The results of the experiment with organic amendments were confounded by the fact that organic treatments were applied over a two year period. Nevertheless, they clearly showed the detrimental effect of organic amendments on root-knot nematodes. All amendments reduced gall ratings and nematode numbers, with sawdust providing the best result. This effect has been observed previously with many organic materials (Stirling 1991) and sawdust in particular has provided good nematode control on other crops in Queensland (Stirling 1989, Stirling et al. 1995). The suppressiveness induced by sawdust is almost certainly a biological phenomonon, and the number of free-living nematodes providing a good indication that biological activity was increased by this treatment. Concern about possible nitrogen drawdown problems in the sawdust treatment proved unwarranted as low nitrate concentrations in soil were not manifested as low concentrations in the plant or as reduced biomass production.
Our decision to apply molasses for nematode control was based on evidence that both sucrose and molasses were detrimental to nematodes (Feder, 1960; Rodriguez-Kabana and King 1980)

Section 4 - Nematology component Page 8
and on claims in gardening magazines that nematodes can be controlled with molasses at application rates equivalent to 4t/ha. The amounts applied to one crop in our experiment (approx 14 t/treated ha or 7 t/ha of tomatoes) were sufficient to provide nematode control equivalent to that obtained with fenamiphos. Filter press also gave a similar level of nematode control but appeared to have the disadvantage of increasing losses from race 3 of Fusarium wilt. This disease was not apparent in the previous two tomato crops and selection pressure caused by excessive use of tomato cultivars with resistance to races 1 and 2 possibly caused it to appear. Because the distribution of race 3 within the experimental area was not known before the experiment commenced, the apparent increase in disease in plots treated with filter press must be interpreted with caution. Nevertheless, there are many reports of nitrogen nutrition influencing the severity of vascular wilts (Huber and Watson 1974; Schneider 1990) and such an effect is most likely to have occurred with the amendment with the highest nitrogen content.
Although our results clearly showed the benefits of using organic amendments for nematode control on tomatoes, more work will be required before these materials can be recommended for commercial use. Optimum application rates, performance on soils other than fertile clay loams, mechanisms of action and the rate of development and decline of suppressiveness are just some of the areas requiring attention.
More detailed analysis of the costs and benefits of organic amendments is also required because the treatments used in this study are relatively expensive. Sawdust costs $3.30/m3 if a 100km delivery distance is assumed, molasses is priced at 17 cents/L while finter press is available from Bundaberg sugar mills at $7.50/m . Thus the cost of the sawdust, molasses and filter press treatments was $1000, $910 and $6000 respectively, compared with a chemical cost of $950/ha for the standard fenamiphos treatment.
The aim of this study was to explore non-chemical options for managing root-knot nematode in intensive vegetable cropping systems. Our results indicate that crop rotation, organic amendments, fallowing and adjustment of planting times can all be used to reduce nematode populations or limit their economic impact. When combined with options not explored in this study (eg. biological control, cultivar resistance, strategic decision making) there is potential for an integrated pest management approach to nematode problems. Initial attempts to reduce chemical use by introducing such strategies should concentrate on crops grown during the autumn-winter period, when crops are most able to tolerate the effects of nematodes.
RECOMMENDATIONS
This project has demonstrated that there are options for more sustainable management of nematodes on vegetable crops at Bundaberg. However, growers find it difficult to implement such practices because they are unable to identify situations where there is a low risk of nematode damage. A commercial nematode monitoring and advisory service should be developed for the Bundaberg vegetable industry so that growers can be provided with the information they need to make informed decisions about nematode management.
DIRECTIONS FOR FUTURE RESEARCH

Section 4 - Nematology component Pase 9
Two areas stand out as requiring further research:
1. Development of monitoring and advisory services for nematode pests of vegetables. Research on sampling protocols and economic thresholds is needed so that reliable estimates of nematode population density can be obtained and these estimates can be used to indicate the likelihood of nematode damage.
2. Microbiological basis of the suppressiveness to nematodes that is induced by sawdust. In a field trial at Bundaberg Research Station, a sawdust treatment was so effective that it was difficult to find galled roots on treated plants. Preliminary indications suggest that this was a microbiological effect. The basis of this suppressiveness should be investigated. Further work is also required on the practicality of using sawdust for nematode control. Better information is needed on application rates and the degree of decomposition required to give adequate control. Guidelines for overcoming nitrogen drawdown problems also need to be developed.
ACKNOWLEDGMENTS
The assistance of Dr J Stanton in identifying the root-knot nematode encountered in this study is gratefully acknowledged.
LITERATURE CITED
Feder, W.A. 1960. Osmotic destruction of plant parasitic and saprophytic nematodes by the addition of sugars to soil. Plant Disease 44:883-885.
Huber, D.M. and Watson, R.D. 1974. Nitrogen form and plant disease. Annual Review of Phytopathology 12: 139-165.
Rodriguez-Kabana, R. and King, P.S. 1980. Use of mixtures of urea and blackstrap molasses for control of root-knot nematodes in soil. Nematropica 10:38-45.
Sasser, J.N. and Kirby, M.F. 1979. Crop cultivars resistant to root-knot nematodes. Meloidogyne spp. North Carolina State University, IM Project. 24 pp.
Schneider, R.W. 1990. Influence of mineral nutrition on Fusarium wilt: a proposed mechanism involving cell water relations. In: Fusarium wilt of banana (R.C. Ploetz, ed.). pp. 83-91. APS Press, St Paul, Minnesota.
Stanton, J., Hugall, A. and Moritz, C. 1996. PCR-based diagnosis of mitochondrial DNA haplotypes of pathenogenetic root-knot nematode (Meloidogyne spp.) Fundamental and Applied Nematology (in press).
Stirling, G.R. 1989. Organic amendments for control of root-knot nematode (Meloidogyne incognita) on ginger. Australasian Plant Pathology. 18:39-44.
Stirling, G.R. 1991. Biological control of plant parasitic nematode. CAB International, Wallingford. 282 pp.
Section 4 - Nematolozv component Page 10
Stirling, G.R., Dullahide, S.R. and Nikulin, A. 1995. Management of lesion nematode on replanted apple trees. Australian Journal of Experimental Agriculture. 35: 247-258.
Stirling, G.R. and Nikulin, A. 1993. Population dynamics of plant parasitic nematodes in Queensland pineapple fields and the effects of these nematodes on pineapple production. Australian Journal of Experimental Agriculture 33: 197-206.
Stirling, A.M., Stirling, G.R. and MacRae, I.C. 1992. Microbial degradation of fenamiphos after repeated application to a tomato growing soil. Nematologica 38: 245-254.
Taylor, A.L. and Sasser, J.N. 1978. Biology, identification and control of root-knot nematodes (Meloidogyne spp.). North Carolina State University IM Project. 111pp.
Thomason, I.J. 1987. Challenges facing nematology: environmental risks with nematicides and the need for new approaches. In Vistes on Nematology (ed. J.A. Vecch and D.W. Dickson), pp. 469-476. Society of Nematologists, Hyattsville.

Section 4 - Nematology component Pase 11
Table 4.1. Levels of infestation by root-knot nematode (Meloidogyne spp.) in a survey of Bundaberg vegetable fields
Crop Root-knot status of fields Nematodes/200ml soil Proportion Proportion heavily (heavily infested infestedf infested* fields)
Tomato 6/6 5/6 540-1350 Zucchini 5/5 5/5 60-540 Capsicum 3/5 1/5 480 Rockmelon 3/4 1/4 60 Pumpkin 2/2 1/2 1440 Squash 1/1 1/1 660 Eggplant 3/3 1/3 340 Sweet corn 1/4 1/4 520 Bean 0/5 0/5 —
f *
Root-knot nematode detected by extraction or bioassay. More than 60 nematodes/200ml soil or bioassay rating = 3.
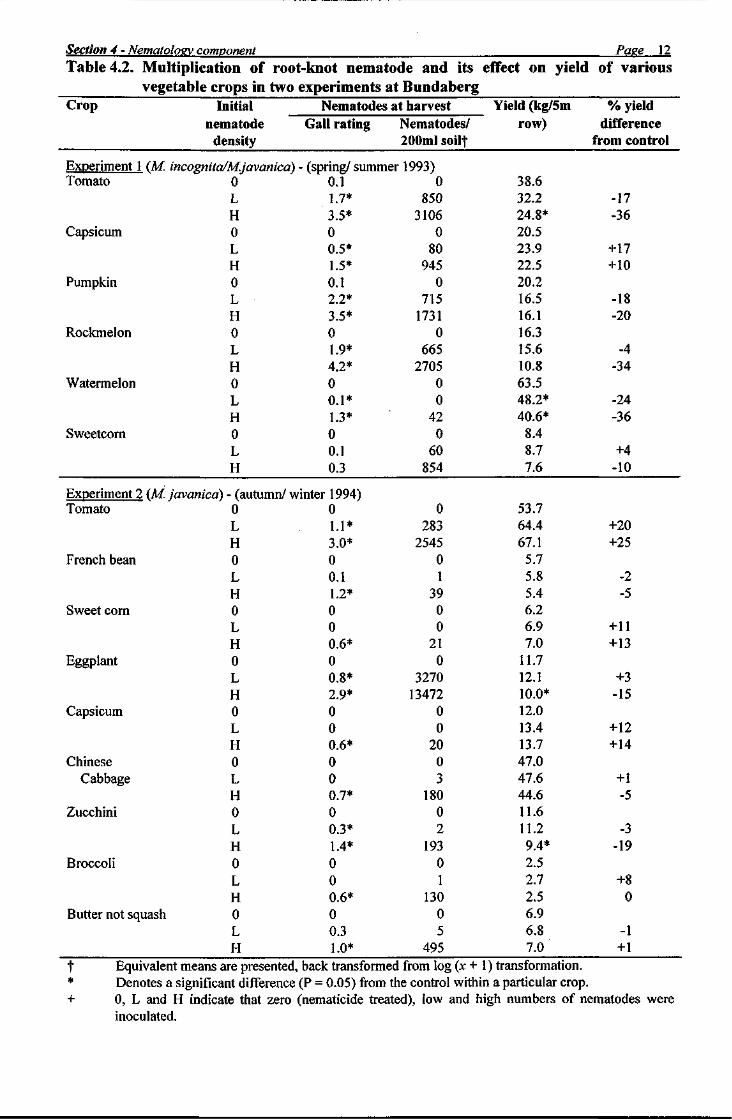
Section 4 - Nematolosv component Pase 12 Table 4.2. Multiplication of root-knot nematode and its effect on yield of various
vegetable crops in two experiments at Bundaberg Crop Initial
nematode Nematodes at harvest Yield (kg/5m
row) % yield Initial
nematode Gall rating Nematodes/ Yield (kg/5m
row) difference density 200ml soilf from control
Experiment: I (M incognita/M.javanica) - (spring/ summer 1993) Tomato 0 0.1 0 38.6
L 1.7* 850 32.2 -17 H 3.5* 3106 24.8* -36
Capsicum 0 0 0 20.5 L 0.5* 80 23.9 +17 H 1.5* 945 22.5 +10
Pumpkin 0 0.1 0 20.2 L 2.2* 715 16.5 -18 H 3.5* 1731 16.1 -20
Rockmelon 0 0 0 16.3 L 1.9* 665 15.6 -4 H 4.2* 2705 10.8 -34
Watermelon 0 0 0 63.5 L 0.1* 0 48.2* -24 H 1.3* 42 40.6* -36
Sweetcorn 0 0 0 8.4 L 0.1 60 8.7 +4 H 0.3 854 7.6 -10
Experiment 2 (M. iavanica) - (autumn/ winter 1994) Tomato 0 0 0 53.7
L 1.1* 283 64.4 +20 H 3.0* 2545 67.1 +25
French bean 0 0 0 5.7 L 0.1 1 5.8 -2 H 1.2* 39 5.4 -5
Sweet corn 0 0 0 6.2 L 0 0 6.9 +11 H 0.6* 21 7.0 +13
Eggplant 0 0 0 11.7 L 0.8* 3270 12.1 +3 H 2.9* 13472 10.0* -15
Capsicum 0 0 0 12.0 L 0 0 13.4 +12 H 0.6* 20 13.7 +14
Chinese 0 0 0 47.0 Cabbage L 0 3 47.6 +1
H 0.7* 180 44.6 -5 Zucchini 0 0 0 11.6
L 0.3* 2 11.2 -3 H 1.4* 193 9.4* -19
Broccoli 0 0 0 2.5 L 0 1 2.7 +8 H 0.6* 130 2.5 0
Butter not squash 0 0 0 6.9 L 0.3 5 6.8 -1 H 1.0* 495 7.0 +1
f *
Equivalent means are presented, back transformed from log (x + 1) transformation. Denotes a significant difference (P = 0.05) from the control within a particular crop. 0, L and H indicate that zero (nematicide treated), low and high numbers of nematodes were inoculated.
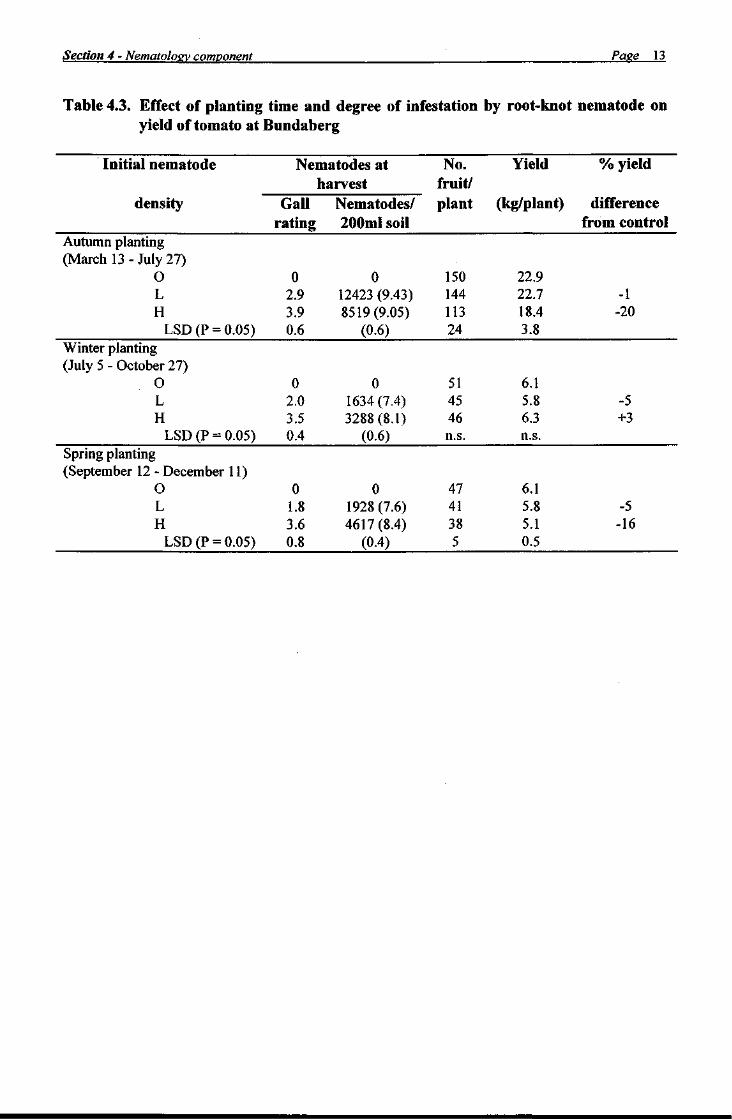
Section 4 - Nematology component Paee 13
Table 4.3. Effect of planting time and degree of infestation by root-knot nematode on yield of tomato at Bundaberg
Initial nematode Nematodes at No. Yield % yield harvest fruit/
density Gall Nematodes/ plant (kg/plant) difference rating 200ml soil from control
Autumn planting (March 13-July 27)
O 0 0 150 22.9 L 2.9 12423(9.43) 144 22.7 -1 H 3.9 8519(9.05) 113 18.4 -20
LSD (P = 0.05) 0.6 (0^6) 24 3J5 Winter planting (July 5 - October 27)
O L H
LSD (P = 0.05) Spring planting (September 12 - December 11)
O L H
LSD (P = 0.05)
0 0 51 6.1 2.0 1634(7.4) 45 5.8 -5 3.5 3288(8.1) 46 6.3 +3 0.4 (0.6) n.s. n.s.
0 0 47 6.1 1.8 1928(7.6) 41 5.8 -5 3.6 4617(8.4) 38 5.1 -16 0.8 (0.4) 5 0.5

Section 4 - Nematology component Page 14 Table 4.4. Sequence of events for treatments applied in an organic amendment experimen
Treatment October 1993 - April 1994 -March 1994 September 1994
1. Sawdust Sawdust (150m3/ha)+ Tomato crop 1 urea (600kg/ha) in October and March
2. Filter press Filter press/400m Tomato crop 1 (ha) applied in March
3. Molasses — Tomato crop 1 Molasses (375L/ha/ week) for 14 weeks
4. Sawdust + Sawdust (150m/ha) + Tomato crop 1 filter press + urea (600kg/ha) in Molasses (187L/ha/ molasses October. Filter press week) for 14 weeks
(200m3/ha) in March 5. Green manure Forage sorghum + Tomato crop 1
Dolichos lab lab green manure crop (Nov -March)
6. Nemacur — Tomato crop 1 Nemacur 10G (lOOkg/ha) in April
7. Untreated — Tomato crop 1
October 1994 -December 1994
Nematode infested S tomato crop to establish F a uniform nematode distribution Nematode infested F tomato crop to establish ( a uniform nematode distribution Nematode infested — tomato crop to establish a uniform nematode distribution Nematode infested S tomato crop to establish + a uniform nematode F distribution ( Nematode infested V tomato crop to establish m a uniform nematode ( distribution Nematode infested — tomato crop to establish a uniform nematode distribution Nematode infested — tomato crop to establish a uniform nematode distribution

Section 4 - Nematology component Pase 15
Table 4.5. Nitrate concentration (mg/L) at various sampling dates in tomato petioles grown in soil amended with sawdust + urea and in unamended soil
Sampling date
Treatment Sept. 21 Oct. 3 Oct. 10 Oct. 17 Oct. 25 Oct. 31
Sawdust (Trt 1) Unamended (Trt 7)
7040 7680
5840 5660
7040 6600
7400 5630
4560 3200
3320 1260

Section 4 - Nematolosv component Pase 16 Table 4.6. Nutrient analyses of soil from an experiment with organic amendments at Bund
pH EC CI N03-N P SOTS Ca Mg Treatment mS/cm mg/kg mg/kg mg/kg mg/kg meq/lOOg meq/lOOg
1. Sawdust 5.8 0.39 146 51 210 163 10 3.1
2. Filterpress 6.8 0.80 146 130 936 309 16 5.3
3. Molasses 6.5 0.65 154 90 320 347 12 2.9
4. Sawdust + filter press + 6.8 0.34 149 18 382 131 13 3.6 molasses
5. Green manure 6.5 0.64 133 117 269 340 13 2.9
6. Nemacur 6.3 0.66 122 102 361 385 12 2.9
7. Untreated 6.5 0.56 123 87 304 285 12 2.8

Section 4 - Nematolosv component Pase 17
Table 4.7. Effect of organic amendments on damage caused by root-knot nematode on tomato
Biomass Gall Treatment (kg/plant) rating
1. Sawdust 8.4 0.2
2. Filter press 9.2 1.2
3. Molasses 8.2 1.5
4. Sawdust + filter 9.0 0.8 press + molasses
5. Green manure 9.1 2.5
6. Nemacur 8.5 1.5
7. Untreated 8.3 3.2
LSD (P = 0.05) n.s. 1.1
Nematodes/200ml soil Meloidogyne Free-living
16(2.83) 10107(9.22)
56 (4.04) 601 (6.40)
387 (5.96) 872 (6.77)
117(4.77) 2038(7.62)
3203 (8.07) 537 (6.29)
1201 (7.09) 476 (6.17)
2889(7.96) 468(6.15)
(2.51) (0.94)
* Equivalent means, with transformed means (loge x + 1) in parentheses.

Section 4 - Nematolosv component Pase 18
Nematode decline under bare fallow
500 1 m
l soi
l
400 1 20
0 l
per
300 1
Nem
atod
es
200 1
Nem
atod
es
1 100 III 0 1,1:1, • 1—^—1 1 1 1 1
J A
Months
Rainfall figures
120
100 ..
Fig. 4.1. Nematode decline vinder bare fallow and mean monthly rainfall during the study period.
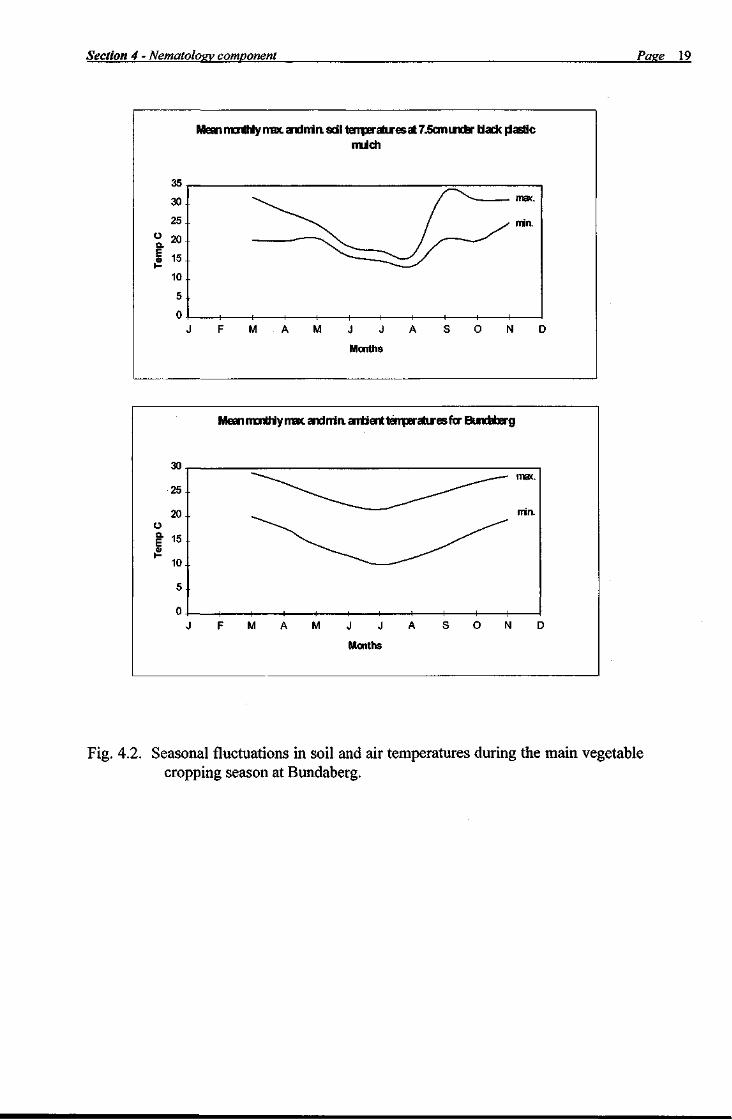
Section 4 - Nematolosv component Pase 19
Mean monthly max. andrrinsdl temperatures at 7.5cm uncfer back plastic mUch
35
30
25
" 20
i 15
10
5
0 M J J
Months
Meanrrmthly max andnin. antienttemperatiresfa Bundaberg
30. —•— ^ _ ^ - - — mat.
25 ^ ^ ~ ^ ^ ^ ^
20 min. o ^^~~~^^ ^ ^ | 1 5 o H
10 ^ ^ ^ ^ ^ ^
5
0 0 J F M A M J J A S O N t D
Months
Fig. 4.2. Seasonal fluctuations in soil and air temperatures during the main vegetable cropping season at Bundaberg.