very low frequency sferic bursts, sprites, and their...
TRANSCRIPT

Very low frequency sferic bursts, sprites, and their
association with lightning activity
R. A. Marshall,1 U. S. Inan,1 and W. A. Lyons2
Received 19 April 2007; revised 2 August 2007; accepted 27 August 2007; published 27 November 2007.
[1] Recent observations have revealed the occurrence of burst-like VLF activity, lastingfrom tens of milliseconds up to a few seconds, associated with the onset of many sprites.These ‘‘sferic bursts’’ are thought to be due to the horizontal in-cloud component oflightning activity, since they have been observed to propagate only short distances (a fewhundred kilometers) in the Earth-ionosphere waveguide and are generally not reported bylightning detection networks. The possible involvement of in-cloud lightning in spriteproduction has been previously suggested on the basis of the observed long delays andspatial displacement between causative cloud-to-ground (CG) discharges and spriteevents. In this work, we investigate the association between sprites and sferic bursts usingVLF data and a large set of sprite observations between 1995 and 2000. We compare theoccurrence of sferic bursts in association with sprites for thousands of observationsthrough many different dates and thunderstorms. Results indicate that sprite-causativeCGs are more commonly found in association with bursts of sferic activity than those CGdischarges without sprites and that, furthermore, the distribution of sferic burst VLFenergy is significantly higher for sprite-associated events. We further investigate thesource of these bursts by comparing VLF data to Lightning Mapping Array (LMA) data ofVHF pulses due to lightning. Such comparisons show that most sferic burst events can beexplained as radiation from the horizonal in-cloud components of +CG lightning, asdetected by the LMA.
Citation: Marshall, R. A., U. S. Inan, and W. A. Lyons (2007), Very low frequency sferic bursts, sprites, and their association with
lightning activity, J. Geophys. Res., 112, D22105, doi:10.1029/2007JD008857.
1. Introduction
[2] Sprites are the most-studied member of a category ofphenomena known as Transient Luminous Events (TLEs)that occur above the stratiform region of energetic thunder-storms [e.g., Lyons, 1996]. They occur in the altitude range of40 – 90 km above large positive cloud-to-ground (+CG)discharges [e.g., Sentman et al., 1995], although it must benoted that (1) a few sprites have been associated withnegative cloud-to-ground (�CG) discharges [Barrington-Leigh et al., 1999;Williams et al., 2007] and (2) sprites havebeen seen to be displaced from the CG by up to 50 km[Wescott et al., 1998]. Furthermore, while most sprites occurwithin a few to tens of milliseconds after the causative +CG[Sao Sabbas et al., 2003], some have been seen to havedelays up to 200 ms or more [Bell et al., 1998; Mika et al.,2005].[3] Sprites are caused by a quasi-electrostatic (QE) field
generated above thunderclouds by the removal of positivecharge by a +CG discharge, leaving a downward-pointingQE field between the conducting ionosphere and the cloudtop [e.g., Pasko et al., 1997]. It has been suggested [Valdivia
et al., 1997; van der Velde et al., 2006] that the contributionof the in-cloud component of a CG discharge to theproduction of sprites may explain these long-delayedsprites (in this paper, we will refer to this activity forbrevity as in-cloud activity, not to be confused with well-documented intracloud lightning, which is generally takenas ‘‘cloud only’’ lightning, never reaching the ground). vander Velde et al. [2006] showed that long-delayed sprites areoften accompanied by bursts of very low frequency (VLF)sferic activity, referred to as ‘‘sferic clusters’’ [Johnson andInan, 2000] or ‘‘sferic bursts’’ herein (we have chosen thelatter nomenclature due to the fact that such bursts do notexhibit properties of a set of individual sferics; rather, theyappear as a burst of continuous VLF activity). Johnson andInan [2000] associated these sferic bursts with in-cloudlightning on the basis of the observations that (1) they donot propagate to great distances in the Earth-Ionosphere(EI) waveguide, typical of horizontal sources, and (2) theyare not reported by the National Lightning DetectionNetwork (NLDN), which, until April 2006, reported onlyCG discharges.[4] Johnson and Inan [2000] also showed a one-to-one
correspondence between sferic bursts and early/fast VLFperturbations. These ‘‘early/fast events’’ are perturbations toVLF transmitter signals propagating in the Earth-Ionosphere(E-I) waveguide, caused by conductivity changes in thelower ionosphere due to lightning. These perturbations
JOURNAL OF GEOPHYSICAL RESEARCH, VOL. 112, D22105, doi:10.1029/2007JD008857, 2007ClickHere
for
FullArticle
1STAR Laboratory, Stanford University, Stanford, California, USA.2FMA Research, Inc., Fort Collins, Colorado, USA.
Copyright 2007 by the American Geophysical Union.0148-0227/07/2007JD008857$09.00
D22105 1 of 9

occur within 20 ms of the causative CG lightning (‘‘early’’)and rise to their full perturbation within 20 ms (‘‘fast’’),noting that the 20 ms threshold is due to the 50 Hz dataresolution used to classify them [Inan et al., 1995]. Morerecently, a new class of events has been discovered, whichare still ‘‘early’’ but rise to their full perturbation over a fewhundred milliseconds, and these have been labeled ‘‘early/slow’’ [Haldoupis et al., 2006]. Noting that the occurrenceof sprites and both types of ‘‘early’’ events have been shownto be strongly correlated [Haldoupis et al., 2004; Marshallet al., 2006], in this paper we investigate the relationshipbetween sprites and sferic bursts using a large data set inorder to establish the connection between these phenomenaon a statistical basis.[5] It is important to realize that in prior publications on
sferic bursts [Johnson and Inan, 2000; Ohkubo et al., 2005;van der Velde et al., 2006], the identification of sferic burstsas signatures of in-cloud lightning was based on the twoobservations stated above from Johnson and Inan [2000].van der Velde et al. [2006] attempted to show a correlationbetween sferic bursts and VHF sources reported by a SAFIR2-D interferometric lightning mapping system, but did notfind agreement in time. VHF sources are important in thiscontext since Stanley [2000] showed that they were corre-lated in time with spider lightning lasting up to a fewseconds. In this paper, we present data from hundreds ofsprites that were observed near the New Mexico TechLightning Mapping Array (LMA) during its deploymentin the summer of 2000; this deployment was part of the veryproductive STEPS program [Lang et al., 2004]. Our studythus provides the most complete correlation of sprite, VLF,and LMA activity to date.
2. Description of the VLF Data
[6] VLF data were recorded at Yucca Ridge Field Station(YRFS) near Fort Collins, CO, during most summers from
1995–2000; in this paper we focus on data during 1995,1996, 1998, and 2000, as these provided the best overlap inthe optical sprite data and VLF data. Data were collected bytwo orthogonal 1-meter square magnetic loop antennas,oriented in the north-south and east-west directions. TheVLF receiver had a flat frequency response from �10 Hz upto 30 kHz. The data from the two antennas were originallyrecorded on Betamax tapes with PCM coding on two datavideo channels, and with IRIG-B timing on the audiochannel. The data have been recently converted to DVDs,the process of which involves filtering the analog readoutfrom the Betamax channels with a 4-pole hardware low-pass filter with cutoff at 15 kHz, and redigitizing the datawith a sampling rate of 33.3 kHz and 16-bit resolution.[7] In total, about 6000 sferics were analyzed for burst
activity. About 2000 of these had associated sprites, opti-cally confirmed from YRFS in 1995, 1996, 1998, and 2000.Sprite-associated sferics were located by searching throughVLF broadband data for known, archived optical observa-tion times of sprites. Non-sprite associated sferics werelocated by searching for all non-sprite associated +CGsgreater than 50 kA, as reported by NLDN, within theperiods of sprite observations and within 1000 km of YR.They are also confirmed to be within the field-of-view ofthe cameras while operating. While the choice of positiveCGs only and the large 50 kA threshold unfortunatelyrestricts the data set, it is necessary to reduce the numberof cases, and limits us to the comparison of sprite-producingand non-sprite-producing large +CGs. In Figure 1, the peakcurrents of sprite-associated and non-sprite associatedNLDN strokes are shown in histograms to show that thereis no peak current bias in favor of sprite-associated sferics.Also in Figure 1, the distances of each NLDN stroke to YRis shown, again showing no bias. A few errors (shown inopen boxes) are due to the search algorithm occasionallyfinding the wrong NLDN stroke (often when no +CG was
Figure 1. Distributions of peak currents and distances to the receiver for sprite and non-sprite NLDNCGs, showing no preference for sprite-related events.
D22105 MARSHALL ET AL.: SFERIC BURSTS AND SPRITES
2 of 9
D22105

reported by NLDN, or where a larger +CG was foundwithin 1 s of the sprite-causative CG).
3. Results: Sprite Correlations
[8] Figure 2 shows four examples of VLF sferic bursts.Each of these examples occurred in association with asprite, where the causative CG is located with the arrows.These examples show the wide variability in the VLF sfericbursts, and the fact that sprites can sometimes occur withoutany VLF burst activity at all. However, we shall see belowthat most sprites are found in association with burst activity.[9] In order to make a quantitative comparison of events,
we measure the energy in each sferic event. Four time pointsare located on each event: (1) the start of the burst activity,(2) the start of the CG-induced sferic, (3) the end of thesferic, and (4) the end of the burst. Note here that we definethe ‘‘sferic’’ as being only the return stroke component ofthe VLF signature, whereas the ‘‘sferic burst’’ refers to thelong-duration activity seen in Figure 2. Within each of thethree resulting sections, energy is calculated by evaluatingthe average power of a hamming-windowed periodogram.The total energy is then calculated by simple addition aftermultiplying with the respective time intervals. To normalizethe energy values and to allow comparison of events fromdifferent days and times, background noise is subtractedby taking average noise power samples every five minutes.We then add the pre-CG (1 ! 2) and post-CG (3 ! 4)energy and combine the north/south and east/west compo-nent vectors, a procedure equivalent to removing the CG-induced sferic itself from the calculation. The results are
given below in Figure 3 by year, and show a markeddifference in energies, about a factor of 5, between sprite-related and non-sprite-related events (note the shift in thedistributions, as marked by the green arrows). In compar-ison, the sferic energy (2 ! 3) in each case shows littledifference between sprite-related and non-sprite relatedevents (vertical green arrows), indicating that the data arenot biased by sferic intensity.[10] While van der Velde et al. [2006] reported no cases
of sprite-associated sferic bursts that lasted longer than250 ms, in our data set there are many such events, lastingup to 3 s in some cases, consistent with observations ofin-cloud lightning using VHF time-of-arrival (TOA) tech-niques, as discussed later. Figure 4 shows distributions ofburst times leading up to and following the CG, for bothsprite and non-sprite cases. It is evident that sprites aregenerally associated with much longer duration bursts, andthat the burst activity following the CG is generally muchmore prominent in events with associated sprites. Whilethe total energy of the burst, as in Figure 3, is higher forsprite cases, we see that this is in part due to the fact thatthe duration is longer.
4. In-Cloud Sources of VLF Bursts
[11] It has been speculated [Johnson and Inan, 2000; vander Velde et al., 2006] that these VLF sferic bursts arecaused by in-cloud lightning activity. However, previouslyno convincing comparisons have been made between suchVLF sferic bursts and measurements of in-cloud activity.Here we show correlations between sferic bursts and in-
Figure 2. Examples of sferic bursts. The arrows show the time of the CG discharge. Each of these casesis associated with a sprite.
D22105 MARSHALL ET AL.: SFERIC BURSTS AND SPRITES
3 of 9
D22105

cloud activity, as measured by the New Mexico Tech LMA,deployed near the Colorado/Kansas border in the summer of2000 [e.g., Thomas et al., 2000]. LMA data were notavailable for the other summers of sprite and VLF datadiscussed above.[12] We wish to emphasize again that the ‘‘in-cloud’’
lightning activity we are referring to is actually most oftenthe in-cloud horizontal component of CG discharges, ratherthan typical intracloud lightning which never touchesground. Indeed, all of the cases analyzed in the previoussection and in this section were associated with +CGs. Assuch, if the correlations outlined below hold, the results inFigure 3 can be interpreted as a measure of the horizontalin-cloud activity associated with the parent CG for eachcase. We use the term ‘‘in-cloud’’ for brevity, but realize thatthe CG is still integral to the discussion.[13] Data from the LMA are established by the reception of
a pulse at a minimum of six locations (four for 3-D locationand time, and two for redundancy), and source locations arecalculated using time-of-arrival (TOA) differences. Uncer-tainties for the three direction components at 200 km are�60 m (azimuth), �1500 m (range), and�1500 m (altitude)[Thomas et al., 2004, Figure 12]. Given that a 1.5 kmuncertainty is far more significant for altitude (which
usually ranges from 0–20 km), latitude/longitude positionsare generally considered accurate to about 200 km, andaltitudes to about 100 km (P. Krehbiel, private communi-cation, 2006).
Figure 3. Distributions of sferic energy for each year. Histograms are of the energy of either the sfericonly or the burst activity outside the sferic. The clear shift in each histogram from sprite to non-spritecases demonstrates the interrelationship. m refers to the mean of each distribution.
Figure 4. Distributions of durations of sferic bursts, forsprite- and non-sprite-related bursts, pre- and post-CG.
D22105 MARSHALL ET AL.: SFERIC BURSTS AND SPRITES
4 of 9
D22105

[14] Figure 5 shows an example of LMA data togetherwith VLF and NLDN data for a sprite case. The LMA datashown here are the decimated data available through theNew Mexico Tech Web site, which have a time resolution of0.4 ms. This example clearly shows a strong correlationbetween LMA and VLF burst data, as both show a distinct,continuous burst of activity lasting about 3.5 s.[15] We observe LMA activity during sprite times, al-
though this part of the study does not account for spriteoccurrence; these times are simply used for convenience,since we have already compiled the VLF data above. Ofover 1000 sprites observed in the summer of 2000, when theLMA was operational, 373 sprite times had correspondingLMA data available. Of these, 154 correspond to stormswithin �200 km of the LMA, where 2-D latitude/longitudedata are reliable. Figure 5 shows a good example of theassociation between the LMA and the VLF burst activity.The color scale of the LMA data progresses from blue to red
in time, so that pulses can be tracked in time on thecorresponding map. Figure 6 shows another example withexceptional association.[16] In Figure 6, it is evident that the VLF burst activity is
almost perfectly correlated with the LMA data, even attimes when no NLDN strokes were reported. Note specif-ically the burst from 5–6 s on this plot; no NLDN strokewas reported, but one must take into account the 85–90%efficiency of NLDN for +CGs. However, VLF data wereanalyzed for this time period from Palmer Station, Antarc-tica, and no sferics were found in this time period comingfrom the United States sector. This comparison shows thatin-cloud activity, as measured by the LMA, can explainmany cases of VLF burst activity; and that in turn, the VLFbursts can provide a measurement of in-cloud activity.[17] Note that since amplitudes of the individual LMA
pulses are not available, quantitative rules for these corre-lations cannot be established. However, a metric has been
Figure 5. Example of VLF, NLDN, and LMA data together for a sprite case. The large +CG (shown inblack) caused a sprite halo at 04:08:00.908 UT, followed by a sprite at 04:08:01.108 UT; VLF data showthe causative sferic as well as burst activity lasting about 3.5 s. LMA data during the same time andlocation corroborate the 3.5 s period of in-cloud activity. This example has a correlation peak (describedin the text) of 0.863. In this case, the NLDN -CG activity was off the map shown.
D22105 MARSHALL ET AL.: SFERIC BURSTS AND SPRITES
5 of 9
D22105
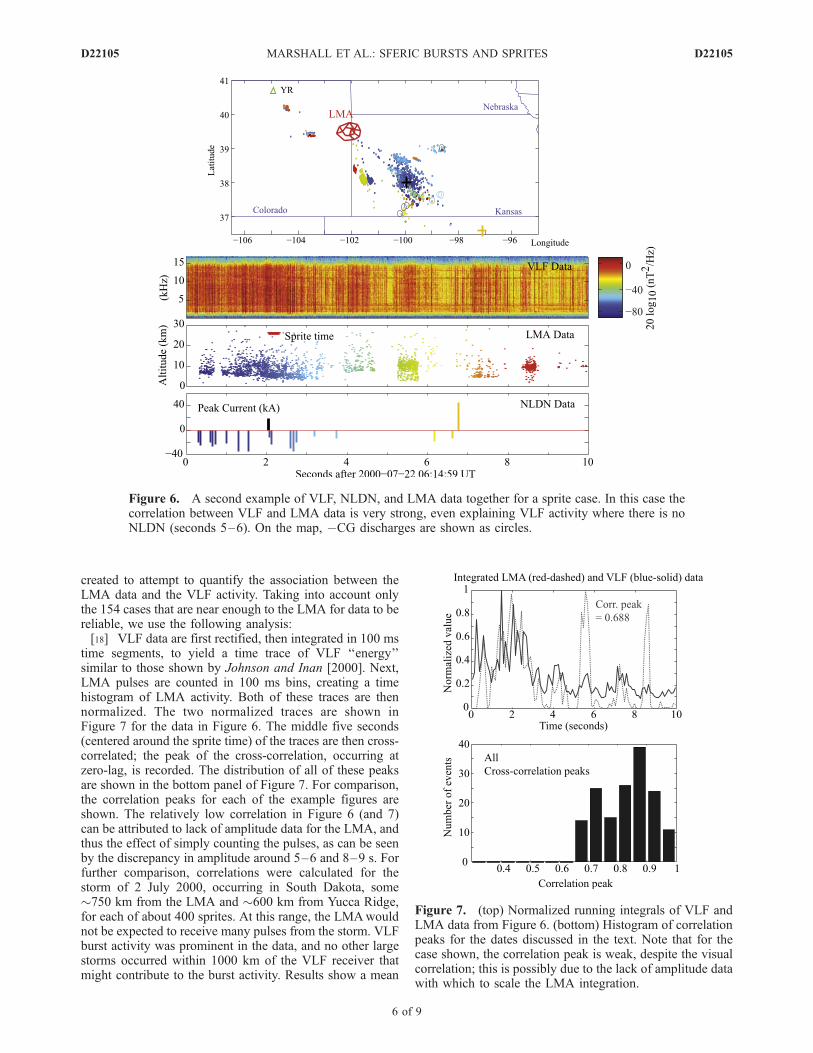
created to attempt to quantify the association between theLMA data and the VLF activity. Taking into account onlythe 154 cases that are near enough to the LMA for data to bereliable, we use the following analysis:[18] VLF data are first rectified, then integrated in 100 ms
time segments, to yield a time trace of VLF ‘‘energy’’similar to those shown by Johnson and Inan [2000]. Next,LMA pulses are counted in 100 ms bins, creating a timehistogram of LMA activity. Both of these traces are thennormalized. The two normalized traces are shown inFigure 7 for the data in Figure 6. The middle five seconds(centered around the sprite time) of the traces are then cross-correlated; the peak of the cross-correlation, occurring atzero-lag, is recorded. The distribution of all of these peaksare shown in the bottom panel of Figure 7. For comparison,the correlation peaks for each of the example figures areshown. The relatively low correlation in Figure 6 (and 7)can be attributed to lack of amplitude data for the LMA, andthus the effect of simply counting the pulses, as can be seenby the discrepancy in amplitude around 5–6 and 8–9 s. Forfurther comparison, correlations were calculated for thestorm of 2 July 2000, occurring in South Dakota, some�750 km from the LMA and �600 km from Yucca Ridge,for each of about 400 sprites. At this range, the LMAwouldnot be expected to receive many pulses from the storm. VLFburst activity was prominent in the data, and no other largestorms occurred within 1000 km of the VLF receiver thatmight contribute to the burst activity. Results show a mean
Figure 6. A second example of VLF, NLDN, and LMA data together for a sprite case. In this case thecorrelation between VLF and LMA data is very strong, even explaining VLF activity where there is noNLDN (seconds 5–6). On the map, �CG discharges are shown as circles.
Figure 7. (top) Normalized running integrals of VLF andLMA data from Figure 6. (bottom) Histogram of correlationpeaks for the dates discussed in the text. Note that for thecase shown, the correlation peak is weak, despite the visualcorrelation; this is possibly due to the lack of amplitude datawith which to scale the LMA integration.
D22105 MARSHALL ET AL.: SFERIC BURSTS AND SPRITES
6 of 9
D22105

correlation peak of 0.53 with a standard deviation of 0.1.When compared with the distribution in Figure 7, thisdemonstrates that when the LMA data is reliable, it isundeniably associated with VLF burst activity.[19] Further examination of the LMA activity leads to
some insight into the nature of the VLF sferic bursts.Figure 8 shows an example including a zoomed-in viewof the 2-D latitude/longitude positions of the LMA pulses,using the undecimated data (80 ms resolution). With thecolor scale progressing from blue to red in time, we can seethat from the time of the CG, LMA pulses were observedoriginating from progressively farther from the CG, fanningout where the red pulses are seen; this activity stronglyresembles the ‘‘spider’’ lightning reported by Mazur et al.[1998]. The black dashed line shows where the spriteoccurred as observed from Yucca Ridge, taking into accountthe ±50 km uncertainty.[20] This example shows evidence that the LMA and VLF
data are both recording signatures of the CG-associatedin-cloud horizontal lightning activity. This in-cloud activitylikely serves to tap the large positive charge reservoir of the
convective system [Williams, 1998; Lyons et al., 2003]. Inthis way, the burst activity is actually a signature of theprocesses by which large amounts of charge are removedfrom the thundercloud in a +CG, leading to a large chargemoment change; and in turn, since sprites require largecharge moment changes [e.g., Cummer and Inan, 2000], theVLF burst can be interpreted as the signature of cloudprocesses that often lead to sprite occurrence. Furthermore,the statistics in Figure 1 show that sprite events have muchlonger burst durations; this long-duration in-cloud lightningactivity could also be related to the large charge momentchange through the long continuing current that has beenassociated with sprites [Reising et al., 1996]. In a similarvein, these longer-duration bursts most likely reach a greaterdistance into the cloud, and these longer channels will likelyto radiate stronger in the VLF, appearing as stronger bursts.In this way the duration and the average power of thesebursts should be intertwined. Figure 9 shows a scatter plotof the burst durations versus the average power in the sfericburst for all sprite-related cases in 2000. While the result is
Figure 8. An example of LMA and VLF sferic burst data demonstrating the tendril-like structure of thein-cloud lightning. This example has a correlation peak (described in the text) of 0.824.
D22105 MARSHALL ET AL.: SFERIC BURSTS AND SPRITES
7 of 9
D22105

obviously quite noisy, one can discern a general trend thathigher burst power correlates with longer duration.
5. In-Cloud Processes Leading to Sferic Bursts
[21] The sferic burst data presented here give someinsight into the types of in-cloud activity detected by VLFmethods. Proctor et al. [1988] showed the differencesbetween ‘‘pulses’’ and ‘‘Q-noise’’ in lightning, havingdurations of 1 ms and 40–400 ms, respectively. Mazur etal. [1997] showed that Time-of-Arrival (TOA) detectionsystems for VHF activity are more sensitive to the individ-ual fast pulses, while Interferometric (ITF) detection sys-tems are more sensitive to the long-duration Q-trains.Furthermore, Mazur et al. [1997] showed that the Q-trains,as detected by ITF, occur at altitudes significantly lowerthan pulses, with means of 5 km and 9 km, respectively.Note that spider lightning, often thought to be active insprite initiation [e.g., Stanley, 2000], occurs at altitudes of4–6 km [Lyons et al., 2003]. The LMA, used in this study,is a TOA system.[22] Recently it has been shown that the LMA can often
observe impulsive components following CG discharges[Shao and Krehbiel, 1996; Thomas et al., 2004]. Theexample in Figures 1 and 2 of Thomas et al. [2004] showshow the LMA can detect in-cloud components of CGdischarges, of precisely the type of dendritic structurethought to be responsible for continuing currents [Reisinget al., 1996]. van der Velde et al. [2006] used an interfer-ometric SAFIR system, which has a 100 ms resolution [vander Velde et al., 2006, and references therein], and it wasnoted that the activity reported by the SAFIR system did notcorrelate well with the VLF burst activity.
[23] Mazur et al. [1998] noted that spider lightning isoften luminous for hundreds of milliseconds, due to con-tinuing current; it is likely that the radiation from thiscontinuing current is what is measured by the VLF receiver.The coincident observations from the LMA are evidence offast leader processes also occurring over hundreds of milli-seconds. It is possible, then, that sprite-producing ‘‘spider’’lightning does not exhibit the Q-train type of pulses that arewell mapped by interferometric systems such as SAFIR.
6. Summary
[24] Bursts of radio activity observed in VLF data almostalways accompany the parent CG lightning of sprites.However, many non-sprite-producing +CGs are also ac-companied by burst activity, so that burst activity does notprovide a unique identifier for sprites. The correlationbetween sprites and burst activity shows that the in-cloudcomponent of the cloud-to-ground lightning discharge has asignificant role in sprite production. Note that the CGcomponent of the discharge is still a requirement for spriteproduction; no sprites have been confirmed without CGcausation. It may thus be that in-cloud activity is responsi-ble for enhancing the QE field above the thundercloud,raising it above the breakdown threshold and causing asprite to occur that would not have otherwise. This is mostlikely if the in-cloud activity acts to tap the positive chargereservoir of the cloud and enhance the charge momentthrough continuing current.
Figure 9. Sferic burst average power versus burstduration. We see that a weak trend exists where bursts oflonger duration have higher average power, possibleevidence that longer-duration bursts have longer channelsand thus radiate stronger at VLF frequencies.
Figure 10. Peak currents versus sferic and burst energy.For the sferic, a trend appears that disallows large peakcurrents with small energy; however, in the burst cases,large peak currents may be accompanied by small burstenergy, showing that for larger discharges, burst energy isnot required to initiate a sprite (though charge moment isstill very important).
D22105 MARSHALL ET AL.: SFERIC BURSTS AND SPRITES
8 of 9
D22105

[25] Figure 10 shows a scatter plot of burst energy versusthe peak current of the sprite-causative CG. The trend isevident: in the sferic energy (bottom plot), a clear slopeshows that there are no cases of large peak currents withsmall burst energy. But in the energy content of the burst(top plot), such cases do occur. It thus appears that the largerpeak current strokes (which presumably, and statistically,have larger charge moments) do not always require largesferic bursts (i.e., in-cloud activity) for sprites to occur.Or, viewed conversely, small peak current strokes, whenaccompanied by burst activity, can produce sprites. Thenon-sprite-producing cases (not shown) show the sametrend in both the sferic and burst parts of the energydistributions.[26] The comparison of VLF burst examples with LMA
data shows a strong correlation and thus evidence that theseVLF sferic bursts are signatures of horizontal in-cloudlightning activity. Given the arguments above (that this in-cloud lightning activity, when associated with a +CG,constitutes the in-cloud component of continuing currentthat taps the positive charge reservoir, leading to largercharge moments), these sferic bursts provide an identifierfor large charge moment cloud-to-ground lightning strokes,and thus a good measure of sprite occurrence withoutoptical observations.
[27] Acknowledgments. This work was supported by a Texas Instru-ments Stanford Graduate Fellowship and by the Office of Naval Research(N00014-03-1-0333) and the National Science Foundation (ATM-0551174). Partial support to FMA Research was provided by the NationalScience Foundation (ATM-0221512). The authors wish to thank KenCummins and John Cramer of Vaisala, Inc., for access to NLDN lightningdata and Bill Rison and Paul Krehbiel for access to the New Mexico TechLMA data and helpful discussions thereof.
ReferencesBarrington-Leigh, C. P., U. S. Inan, M. Stanley, and S. A. Cummer (1999),Sprites triggered by negative lightning discharges, Geophys. Res. Lett.,26(24), 3605–3608.
Bell, T. F., S. C. Reising, and U. S. Inan (1998), Intense continuing currentsfollowing positive cloud-to-ground lightning associated with red sprites,Geophys. Res. Lett., 25(8), 1285–1288.
Cummer, S. A., and U. S. Inan (2000), Modeling ELF radio atmosphericpropagation and extracting lightning currents from ELF observations,Radio Sci., 35(2), 385–394.
Haldoupis, C., T. Neubert, U. S. Inan, A. Mika, T. H. Allin, and R. A.Marshall (2004), Subionospheric early VLF signal perturbations ob-served in one-to-one association with sprites, J. Geophys. Res., 109,A10303, doi:10.1029/2004JA010651.
Haldoupis, C., R. J. Steiner, A. Mika, S. Shalimov, R. A. Marshall, U. S.Inan, T. Bosinger, and T. Neubert (2006), ‘‘Early/slow’’ events: A newcategory of VLF perturbations observed in relation with sprites, J. Geo-phys. Res., 111, A11321, doi:10.1029/2006JA011960.
Inan, U. S., T. F. Bell, V. P. Pasko, D. D. Sentman, E. M. Wescott, andW. A. Lyons (1995), VLF signatures of ionospheric disturbances asso-ciated with sprites, Geophys. Res. Lett., 22(24), 3461–3464.
Johnson, M. P., and U. S. Inan (2000), Sferic clusters associated with early/fast VLF events, Geophys. Res. Lett., 27(9), 1391–1394.
Lang, T., et al. (2004), The severe thunderstorm electrification and preci-pitation study (steps), Bull. Am. Meteorol. Soc., 85, 1107–1112.
Lyons, W. A. (1996), Sprite observations above the U. S. high plains inrelation to their parent thunderstorm systems, J. Geophys. Res., 101,29,641–29,652.
Lyons, W. A., T. E. Nelson, E. R. Williams, S. A. Cummer, and M. A.Stanley (2003), Characteristics of sprite-producing positive cloud-to-ground lightning during the 19 July steps mesoscale convective systems,Mon. Weather Rev., 131, 2417–2427.
Marshall, R. A., U. S. Inan, and W. A. Lyons (2006), On the association ofearly/fast very low frequency perturbations with sprites and rare exam-ples of VLF backscatter, J. Geophys. Res., 111, D19108, doi:10.1029/2006JD007219.
Mazur, V., E. Williams, R. Boldi, L. Maier, and D. E. Proctor (1997), Initialcomparison of lightning mapping with operational time-of-arrival andinterferometic systems, J. Geophys. Res., 102(D10), 11,071–11,085.
Mazur, V., X. M. Shao, and P. R. Krehbiel (1998), ‘‘Spider’’ lightning inintracloud and positive cloud-to-ground flashes, J. Geophys. Res.,103(D16), 19,811–19,822.
Mika, A., C. Haldoupis, R. A. Marshall, T. Neubert, and U. S. Inan (2005),Subionospheric VLF signatures and their association with sprite observedduring Eurosprite-2003, J. Atmos. Sol. Terr. Phys., 67, 1580–1597.
Ohkubo, A., H. Fukunishi, Y. Takahashi, and T. Adachi (2005), VLF/ELFsferic evidence for in-cloud discharge activity producing sprites, Geo-phys. Res. Lett., 32, L04812, doi:10.1029/2004GL021943.
Pasko, V. P., U. S. Inan, T. F. Bell, and Y. N. Taranenko (1997), Spritesproduced by quasi-electrostatic heating and ionization in the lower iono-sphere, J. Geophys. Res., 102(A3), 4529–4561.
Proctor, D. E., R. Uytenbogaardt, and B. M. Meredith (1988), VHF radiopictures of lightning flashes to ground, J. Geophys. Res., 93(D10),12,683–12,727.
Reising, S. C., U. S. Inan, and T. F. Bell (1996), Evidence for continuingcurrent in sprite-producing cloud-to-ground lightning, Geophys. Res.Lett., 23(24), 3639–3642.
Sao Sabbas, F. T., D. D. Sentman, E. M. Wescott, O. Pinto Jr., O. MendesJr., and M. J. Taylor (2003), Statistical analysis of space-time relation-ships between sprites and lightning, J. Atmos. Sol. Terr. Phys., 65, 525–535, doi:10.1016/S1364-6826 (02)00326-7.
Sentman, D. D., E. M. Wescott, D. L. Osborne, D. L. Hampton, and M. J.Heavner (1995), Preliminary results from the Sprites94 aircraft campaign:1. Red sprites, Geophys. Res. Lett., 22(10), 1205–1208.
Shao, X. M., and P. R. Krehbiel (1996), The spatial and temporal develop-ment of intracloud lightning, J. Geophys. Res., 101(D21), 26,641–26,668.
Stanley, M. A. (2000), Sprites and their parent discharges, Ph.D. thesis,N. M. Inst. of Min. and Technol., Socorro.
Thomas, R. J., P. R. Krehbiel, W. Rison, T. Hamlin, D. J. Boccippio, S. J.Goodman, and H. J. Christian (2000), Comparison of ground-based3-dimensional lightning mapping observations with satellite-based LISobservations in Oklahoma, Geophys. Res. Lett., 27(12), 1703–1706.
Thomas, R. J., P. R. Krehbiel, W. Rison, S. J. Hunyady, W. P. Winn,T. Hamlin, and J. Harlin (2004), Accuracy of the Lightning MappingArray, J. Geophys. Res., 109, D14207, doi:10.1029/2004JD004549.
Valdivia, J. A., G. Milikh, and K. Papadopoulos (1997), Red sprites: Light-ning as a fractal antenna, Geophys. Res. Lett., 24(24), 3169–3172.
van der Velde, O., A. Mika, S. Soula, C. Haldoupis, T. Neubert, and U. S.Inan (2006), Observations of the relationship between sprite morphologyand in-cloud lightning processes, J. Geophys. Res., 111, D15203,doi:10.1029/2005JD006879.
Wescott, E. M., D. D. Sentman, M. J. Heavner, D. L. Hampton, W. A.Lyons, and T. E. Nelson (1998), Observations of ‘columniform’ sprites,J. Atmos. Sol. Terr. Phys., 60, 733–740.
Williams, E., E. Downes, R. Boldi, W. Lyons, and S. Heckman (2007),Polarity asymmetry of sprite-producing lightning: A paradox?, RadioSci., 42, RS2S17, doi:10.1029/2006RS003488.
Williams, E. R. (1998), The positive charge reservoir for sprite-producinglightning, J. Atmos. Sol. Terr. Phys., 60, 689–692.
�����������������������U. S. Inan and R. A. Marshall, Space, Telecommunications and
Radioscience Laboratory, Stanford University, 350 Serra Mall, Room306, Stanford, CA 94305, USA. ([email protected])W. A. Lyons, FMA Research, Inc., 46050 Weld County Road 13, Fort
Collins, CO 80524, USA.
D22105 MARSHALL ET AL.: SFERIC BURSTS AND SPRITES
9 of 9
D22105