vertical distribution of polycyclic aromatic hydrocarbons in atmospheric boundary layer of beijing...
TRANSCRIPT

ARTICLE IN PRESS
1352-2310/$ - se
doi:10.1016/j.at
�CorrespondE-mail addr
Atmospheric Environment 41 (2007) 9594–9602
www.elsevier.com/locate/atmosenv
Vertical distribution of polycyclic aromatic hydrocarbons inatmospheric boundary layer of Beijing in winter
Shu Taoa,�, Yi Wanga, Shiming Wua, Shuzheng Liua, Han Doua, Yanan Liua,Chang Langa, Fei Hub, Baoshan Xingc
aLaboratory for Earth Surface Processes, College of Environmental Sciences, Peking University, Beijing 100871, P.R. ChinabInstitute of Atmospheric Physics, Chinese Academy of Sciences, Beijing 100029, P.R. China
cDepartment of Plant, Soil and Insect Sciences, University of Massachusetts, Stockbridge Hall, Amherst, MA 01003-7245, USA
Received 6 May 2007; received in revised form 17 August 2007; accepted 17 August 2007
Abstract
Air samples were collected using active samplers at various heights of 8, 15, 32, 47, 65, 80, 102, 120, 140, 160, 180, 200,
240, 280 and 320m on a meteorological tower in an urban area of Beijing in two campaigns in winter 2006. Altitudinal
distributions of polycyclic aromatic hydrocarbons (PAHs) in atmospheric boundary layer of Beijing in winter season were
investigated. Meteorological conditions during the studied period were characterized by online measurements of four
meteorological parameters as well as trajectory calculation. The mean total concentrations of 15 PAHs except naphthalene
of gaseous and particulate phase were 6677450 and 3317144ngm�3 in January and 61719 and 2976 ngm�3 in March,
respectively. Domestic coal combustion and vehicle emission were the dominant PAH sources in winter. Although the
composition profiles derived from the two campaigns were similar, the concentrations were different by one order of
magnitude. The higher concentrations in January were partly caused by higher emission due to colder weather than March.
Moreover, weak wind, passing through the city center before the sampling site, picked up more contaminants on the way
and provided unfavorable dispersion condition in January. For both campaigns, PAH concentrations decreased with
heights because of ground-level emission and unfavorable dispersion conditions in winter. The concentration ratio of PAHs
in gas versus solid phases was temperature dependent and negatively correlated to their octanol–air partition coefficients.
r 2007 Elsevier Ltd. All rights reserved.
Keywords: Atmosphere; PAHs; Vertical distribution; Trajectory; Beijing
1. Introduction
Air pollution in urban environment has become amajor concern to policy makers and general public.This is particularly true for Beijing, which togetherwith several other large cities in China, ranked top
e front matter r 2007 Elsevier Ltd. All rights reserved
mosenv.2007.08.026
ing author. Tel./fax: +86 10 62751938.
ess: [email protected] (S. Tao).
in the most polluted cities in the world (Watts,2005). Of various atmospheric contaminants, anumber of polycyclic aromatic hydrocarbons(PAHs) were demonstrated to have carcinogeniceffect (Xue and Warshawsky, 2005). The concentra-tions of PAHs in air samples collected in Beijingwere much higher than those in many other cities(Liu et al., 2003; Zhou et al., 2005). Therefore,exposures to high level of various atmospheric
.
ARTICLE IN PRESSS. Tao et al. / Atmospheric Environment 41 (2007) 9594–9602 9595
contaminants, including PAHs, are blameful forhealth risk in Beijing and other cities in northernChina (Tao et al., 2006).
Information on altitudinal distributions of PAHsin atmosphere is scarce in spite of its importance forunderstanding and modeling environmental fateand behavior of the chemicals. In fact, uniformdistribution of PAHs in atmospheric compartmentwas often assumed practically in compartmentalmodeling. Such a simplifying assumption oftenleads to high uncertainties in the estimated advec-tive air fluxes and the predicted air concentrationsbecause convection airflow and air-to-surface ex-change are among the most influential processes inthe model (Wang et al., 2002, 2004). For mostatmospheric dispersion models, on the other hand,the predicted results could only be validated twodimensionally without the information on verticaldistribution (Tao et al., 2006).
Efforts have been made to fill this informationgap recently. Qi et al. (2000) measured theconcentrations of PM2.5 and PAHs at three heightsin Nanhai, southern China, and found that therewas a clear decline trend with height for both PM2.5and PAHs and vehicle emission at ground level wasthe primary pollutant source. A similar conclusionwas reached from an investigation conducted inGuangzhou (Li et al., 2005). In a study carried outin Tianjin, a northern Chinese city, air samples werecollected at three heights of 20, 40 and 60m on ameteorological tower and the highest concentrationswere observed at 40m (Wu et al., 2006). Recently,Farrar et al. (2005) deployed thin film passive airsamplers at six heights up to 360m on the CNTower in Toronto, Canada, to investigate thevertical distribution of several persistent organicpollutants including PAHs in the urban atmo-spheric boundary layer. They observed a declinetrend with height for dominant PAHs in most times.Although information on PAH vertical distributionin atmosphere is limited, many studies wereconducted on altitudinal distributions of aerosolwhich are certainly relevant to PAHs because alarge fraction of PAHs occur in particulate phase.More often than not, sharp vertical variation ofaerosol concentration was observed while thepattern of the distribution largely depended onemission source categories and meteorological con-ditions (McKendry et al., 2004; Kalberer et al.,2004; Farrar et al., 2005; Wu et al., 2006).
The vertical distribution of PAHs partly dependson the position and strength of their sources. The
major emission sources of PAHs in Chinese urbanenvironments including domestic coal combustionand motor vehicle exhaust which are all at or closeto ground level (Qi et al., 2000; Xu et al., 2006). Inaddition, the vertical profile is also strongly affectedby the extent of the atmospheric boundary layer andmeteorological conditions. Pollutants emitted atground level may transfer vertically through advec-tion flow and/or mixing, resulting in different profilepatterns (Chan et al., 2000; Farrar et al., 2005).
The purpose of this study was to determine thevertical distribution of PAHs in the atmosphericboundary layer of urban area of Beijing in early andlate winter by using an active sampling technique.The vertical distribution pattern was interpretedbased on both emission and the meteorologicalconditions with the assistance of trajectory calcula-tion. The results of such observations would beuseful not only for a better understanding of sourceand fate of, as well as human exposure risk to,PAHs in the region, but also for improvement ofalgorithm and parameterization of multimedia fatemodeling and dispersion modeling.
2. Methodology
2.1. Sampling
Samples were collected on a meteorological tower inurban area of Beijing (3915802700N, 11612201900E). Thetower was constructed in northern suburb of Beijingdecades ago but totally surrounded by buildings nowbecause of the sprawling of the city. Still, mostbuildings in the neighborhood of several kilometersare no more than several floors tall and there are onlya few buildings within the distance of 500m from thetower. In winter season, in addition to vehicle exhaustfrom heavy traffic in the area, coal combustion forindoor heating is also a major emission source ofPAHs in Beijing (Zhang et al., 2007). Under theinfluence of continental monsoon climate and localtopography, shallow and stable boundary layer withweak vertical mixing and strong ground-based inver-sion often occur in winter (Xia, 2006).
Integrated 24-h air samples were collected in twocampaigns in 15–16 January 2006 and 7–8 March2006 using TMP-1500 active air samplers (JiangsuEltong Electric, Jingtan, China) at a flow rate of0.8–0.9m3min�1. The flow rates were doublecalibrated immediately before and after the sam-pling. Gaseous and particulate phase PAHs werecollected using polyurethane foam plugs (PUF,
ARTICLE IN PRESSS. Tao et al. / Atmospheric Environment 41 (2007) 9594–96029596
22mm O.D., 7.6 cm) in glass holders and glass fiberfilters (GFF, 22mm O.D.) in metalline screens(Supelco, PA, USA), respectively. No breakthroughwas found for all PAHs studied in a preliminaryexperiment using three holders connected in series.The PUF plugs were previously Soxhlet-extractedusing a mixture of n-hexane and cyclohexane (1:1)for 4 h and the GFFs were heated in a furnace at500 1C for 24 h. Fifteen samplers were deployedsimultaneously at 15 platforms of various heights (8,15, 32, 47, 65, 80, 102, 120, 140, 160, 180, 200, 240,280 and 320m) on the tower. Not all data for the 15heights were available due to the failure of a fewsamplers over the course of the sampling. Afterharvesting, all PUF plugs were stored at �18 1C. AllGFFs were equilibrated in a desiccator (25 1C) for24 h and weighed both before and after thesampling. All samples were analyzed within 48 h.
2.2. Extraction and analysis
PUF plugs and GFFs were extracted by Soxhletwith a mixture of n-hexane and cyclohexane (1:1)for 4 and 10 h, respectively. The extracts wereconcentrated by rotary evaporation to about 0.5mland 2-floruobiphenyl and p-terphenyl-d14 were thenadded as internal standard. For both PUF andGFF, the amount of co-extracts was relatively smalland sample cleanup was not necessary. The sampleswere stored in dark at �18 1C prior to analysis on agas chromatograph (Agilent 6890) coupled with amass selective detector (MSD, Agilent 5973) and anautomatic sampler (HP-7673A, Agilent). A30m� 0.25mm I.D.� 0.25 mm film thickness HP-5MS capillary column was used. Helium wasemployed as the carrier gas at a flow rate of1mlmin�1. The column was programmed from 60to 300 1C at 5 1Cmin�1, and then held isothermalfor 15min. The injection (1.0 ml) was operated at asplitless mode with the head pressure of 0.003MPaand injector temperature of 250 1C. The MSD wasoperated in selected ion monitoring mode at 70 eVand the ion source temperature was set at 200 1C.Sixteen PAHs were quantified and they werenaphthalene (NAP), acenaphthylene (ACY), ace-naphthene (ACE), fluorene (FLO), phenanthrene(PHE), anthracene (ANT), fluoranthene (FLA),pyrene (PYR), benz(a)anthracene (BaA), chrysene(CHR), benzo(b)fluoranthene (BbF), benzo(k)fluor-anthene (BkF), benzo(a)pyrene (BaP), dibenz(a,h)anthracene (DahA), indeno(l,2,3-cd)pyrene (IcdP)and benzo(g,h,i)perylene (BghiP).
2.3. Analytical quality control
Routine quality assessment procedures werefollowed. Due to limited availability of samplingequipment, only a single sampler was deployed ateach of the 15 heights each time. The reproducibilityof the procedure was checked in a previous studyusing the same equipment and procedure and it wasdemonstrated that average coefficients of variationof the duplicate sampling and analysis were between22% and 34% for various PAH compounds ingaseous and particulate phases (Tao et al., 2007).Detection limits ranged between 0.85 (NAP) and 6.8(BghiP) ngml�1 for the extracts. Two procedureblanks were included for every batch of 16 samplesand mean of the two were used for procedure blankcorrection.
All the results were laboratory procedure blankcorrected using mean blank values (two for every 16samples) obtained from the extraction to theanalysis. The results were also corrected usingmethod recoveries which were determined by spik-ing the sampling media with a working standardand extracting the media in the same way as thesamples. The standard mixture of PAHs (PPH-10JM, Chem Service Inc., FL, USA) was dilutedwith n-hexane. For the 16 spiked PAHs, therecoveries were from 66% to 114% for the PUFplug and from 60% to 115% for the GFF. Severalsamples were also spiked with a range of deuteratedPAHs (NAP-d8, ACE-d10, ANT-d10, CHR-d12 andperelyne-d12, 4mg l�1; J&K Chemical (Beijing),Beijing, China) to monitor the extraction andcleanup procedures. The recoveries of the surro-gates ranged from 59% to 78%. Quantificationwas performed by the internal standard methodusing 2-fluoro-1,10-biphenyl and p-terphenyl-d14(2.0 mgml�1; J&K Chemical (Beijing), Beijing,China). All solvents used were analytical grade(Beijing Chemical Reagent, Beijing, China) andpurified by distillation prior to use. All glasswarewas cleaned using an ultrasonic cleaner (KunshanKQ-500B) and heated to 400 1C for 6 h.
2.4. Meteorological conditions
Meteorological parameters including tempera-ture, humidity, wind direction and wind speed wereretrieved every 15min online at all heights duringthe sampling period. Air parcel trajectories werecalculated using the hybrid single-particle Lagran-gian integrated trajectory (HYSPLIT) model and

ARTICLE IN PRESSS. Tao et al. / Atmospheric Environment 41 (2007) 9594–9602 9597
global NOAA-NCEP/NCAR pressure level reana-lysis data archive. Both forward (12 h) and back-ward (72 h) trajectories were calculated at allsampling heights with location of the samplingtower as the starting point every 6 h during thesampling period (Draxler and Rolph, 2003).
3. Results and discussion
3.1. PAH concentrations in ambient air
The measured concentrations of several represen-tative PAHs and the total concentrations of 15PAHs (PAH15) are summarized in Fig. 1 in logscale. NAP was not included in PAH15 because ofits relatively low recovery. The statistics wereheight-averaged for the two campaigns and twophases, respectively. The detailed data for all PAHsare provided in the Supplementary material. With afew exceptions, most data are log-normally dis-tributed, suggested by the symmetric Box–Whiskerplots. The mean PAH15 were 3547439 and1547178 ngm�3 for gaseous and particulate phases,respectively. Zhou et al. (2005) measured PAHs infive-stage size segregated aerosol in Beijing in 2003and reported an annual mean concentration of116 ngm�3 with significant higher winter concentra-tion than the other seasons. During a period 10–26January 2005, a survey on police exposure wasconducted and the PAH15 measured on two sites onPeking University campus ranged from 130 to1100 ngm�3 and from 21 to 1050 ngm�3 for gaseousand particulate phase PAHs, respectively (Liu et al.,2007). It appears that the concentrations derived inthis study were broadly in line with other measure-ments in urban areas of northern China except for afew extremely high concentrations reported at
4
-2
0
2
Conc., log(n
g/m
3)
part gas
PHE
ppart gas
PYR
Jan
Mar
Fig. 1. Means and percentiles (pi) of NAP, PHE, PYR, CHR and P
campaigns in January 2006 and March 2006. The concentrations were l
specific locations close to strong sources, e.g. cokingfactory (Liu et al., 2003).
The measured PAH concentrations in air insouthern Chinese cities were usually lower thanthose in north where space heating is a commonpractice in winter. For example, it was reported thatthe annual average concentration of PAH15 inPM10 sample collected in urban area of Nanjingwas 86.0 ngm�3 (Wang et al., 2006). In Guangzhou,the observed average total concentrations of 16PAHs (PAH16) were 313 and 23.7 ngm�3 forgaseous and particulate phases, respectively (Li etal., 2006). Still, all these measurements are generallyhigher than those reported in other countries in theworld (Goldstone et al., 1992; Fraser et al., 1998;Park et al., 2002).
3.2. Profile composition and sources of PAHs
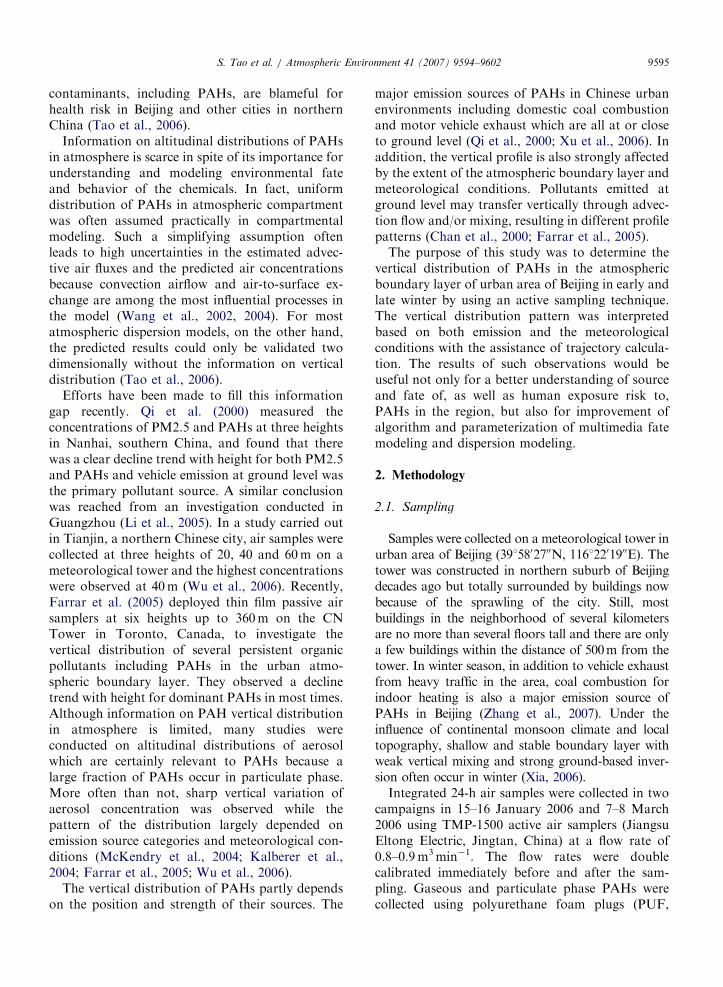
It was found that the lighter PAHs, particularlyNAP, predominated in the gaseous phase, while theparticulate phase PAHs were primarily median tohigher molecular weight compounds includingPHE, FLA, PYR and CHR. Such a pattern wascommonly reported in literature (Harner and Bidle-man, 1998; Kaupp and McLachlan, 1999; Liu et al.,2007). The difference between the two campaignswas not as profound as that between the two phases.Such similarities and dissimilarities were furtheraddressed by a principle component analysis, inwhich, the profiles of major emission sources in thisarea were also included (Zhang et al., 2007). Table 1presents the factor loadings of the principalcomponent analysis and those with loading values40.70 are underlined and marked bold. The factorloadings of the first two principal components (F1and F2) accounted for 55% and 35% of the total
art gas
CHR
part gas
PAH15
p99
p95
p75
p50
mean
p25
p1
p5
Mar
Jan
Jan
AH15 in gaseous and particulate phases measured in the two
og-scaled. Gaseous CHR in March was below the detection limit.
ARTICLE IN PRESS
Table 1
Factor loadings derived from the principal component analysis
PAHs
NAP ACE ACY FLO PHE FLA PYR BaA CHR BbF BkF BaP DahA BghiP Variance (%)
F1 �0.37 �0.15 0.06 �0.12 0.19 0.93 0.89 0.95 0.93 0.95 0.91 0.94 0.72 0.95 0.55
F2 0.89 0.96 0.95 0.98 0.97 0.07 �0.02 �0.16 �0.22 0.03 �0.05 �0.09 0.53 �0.09 0.35
2.5
0.0
-2.5
F2
-1.5 2.50.5
F1
March-g
March-pJan-g
Vehicle
Coal
Jan-p
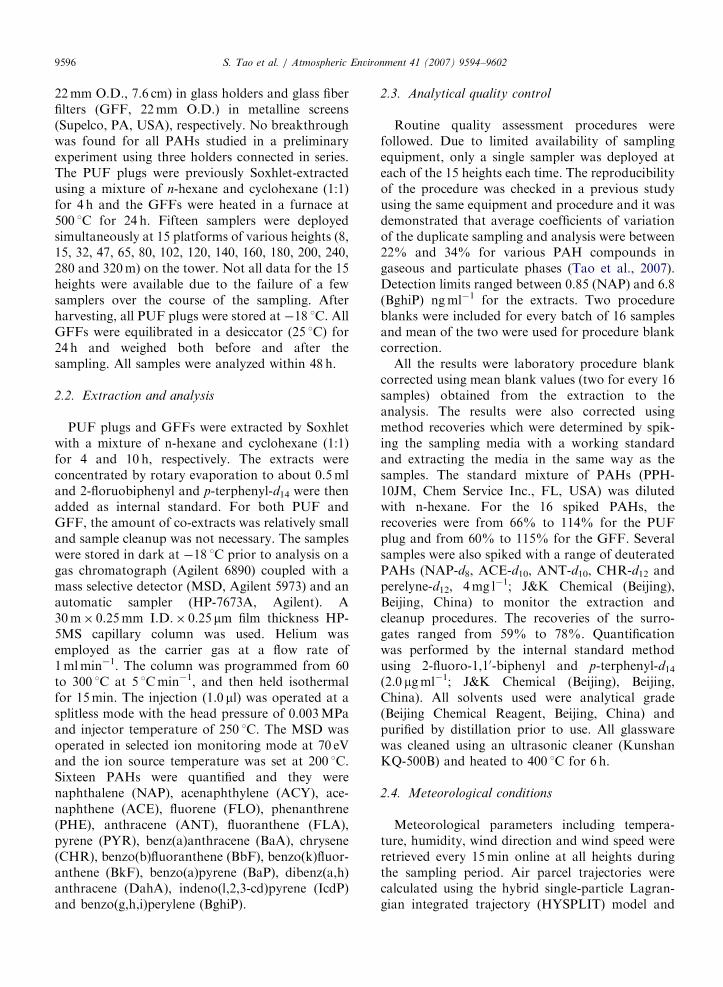
Fig. 2. Factor score plot of F1 against F2 based on PAH profile
compositions of the measured PAHs as well as the major sources
including domestic coal combustion and transportation petro-
leum consumption. Gaseous and particulate phases are presented
as g and p, respectively.
S. Tao et al. / Atmospheric Environment 41 (2007) 9594–96029598
variance (Var.), respectively. F1 was mainly anassociation of median to higher molecular weightPAHs from FLA to BghiP, while F2 representsprincipally the linear combination of lower mole-cular weight PAHs from NAP to PHE. It appearsthat the composition patterns of gaseous andparticulate phases are well distinguished.
The factor score of F1 is plotted against that ofF2 in Fig. 2 to illustrate the similarity or dissim-ilarity of individual samples. The gaseous andparticular phase PAHs are well distinguished inthe plot. The gaseous phase PAH profiles from thetwo sampling periods have relatively lower F1values than those of the particulate phase ones,corresponding to relatively abundant heavier speciesin the latter. A few exceptions among the gaseousphase samples with higher F1 values happened to bethose collected at lower heights with much highertotal concentrations than the others. It appears thatthe samples from the two campaigns can bedistinguished by neither F1 nor F2. It was reportedthat the major emission sources of PAHs in Chinaare biofuel burning, domestic coal combustion and
coke production (Xu et al., 2006). In the case ofurban area of Beijing, similar to many other majormetropolitan areas, biofuel burning and cokingindustry are not major sources while motor vehiclescontribute a significant portion of the total emission(Xue and Warshawsky, 2005; Zhou et al., 2005;Wang et al., 2006). As shown in Fig. 2, bothemission profiles of domestic coal combustion andvehicle emission are similar to the particulate phasePAHs observed in this study.
3.3. Difference between the two campaigns
Although the composition profiles of the samplescollected in two campaigns were similar to eachother, significant difference in concentration wasobserved. The mean concentrations (all heights) ofgaseous and particulate phase PAH15 were6677450 and 3317144 ngm�3 in January and61719 and 2976 ngm�3 in March, respectively.Although both sampling periods were within theheating season which lasted from 15 November to15 March each winter, the difference in PAH15 wasaround one order of magnitude. It was likely thatboth emission and meteorological condition werethe primary reason causing such a difference. Inwinter, coal burning for space heating is a dominantemission source of PAHs in China (Xu et al., 2006).Although the space heating was on at bothoccasions, the different intensities of the activitywere reasonably expected while the daily meantemperatures of the two campaigns were 0.4 and7.3 1C, respectively. Li (1999) investigated thedependence of coal consumption on the ambienttemperature in Beijing and derived a quantitativeequation. By using Li’s equation for heatingcoal consumption, together with the non-heatingcoal consumption provided in literature (BeijingStatistics Bureau, 2006), it was estimated that thecoal consumption during the two campaigns were52,000 and 39,600 t d�1, equivalent to PAH15emission of 17.4 and 12.6 t d�1, respectively.

ARTICLE IN PRESSS. Tao et al. / Atmospheric Environment 41 (2007) 9594–9602 9599
To illustrate the possible source of PAHs, anumber of trajectories (72 h) for several samplingheights were presented in Fig. 3. According to acounty-resolution emission inventory, the emissiondensities in the regions along the pathways of thesetrajectories were all significantly lower than that ofBeijing urban area and the detected PAHs in thisstudy were primarily from local source (Zhanget al., 2007). In January, not only the movement ofair parcels was slower than that in March, theyreached the sampling site from southeast directionpassing through the city center. On the other hand,the air parcels came from northeast in March withfaster speed and less chance of picking up thepollutants on the way and diluting the localpollution. The calculated differences were well-supported by the on-site measured wind speeds(1.4m s�1 versus 0.9m s�1) and directions.
The difference in dispersion status between thetwo campaigns occurred not only horizontally, but
N,
°
56
38
50
44
E, °80 120100
Russia
Mongolia
China
BeijingJan. 15
Fig. 3. Seventy-two hour back-trajectories at various elevations of 8, 47
and 8 March (right).
Heig
ht, m
117.0
E, °
480
0
120
240
360
115.5116.5 116.0
40.8
39.3
40.339.8
N, °
Sampling tower
January 14
Fig. 4. Movement of air mass passing the sampling site at various hei
forward and backward trajectory calculations.
also vertically. Fig. 4 compares the 5-h forward and5-h backward trajectories with initial times of18:00 h. In 7–8 March, strong lifting air fromnortheast passed the sampling site created a condi-tion relatively favorable for dispersion of pollutantsat ground level. In contrast, the air was more staticon 15 January, the wind from southeast tended tocircle around which was favorable for the accumu-lation of pollutants at ground level. It is likely thatthe difference in dispersion conditions was a moreimportant factor controlling PAH concentrationsthan the difference in emission.
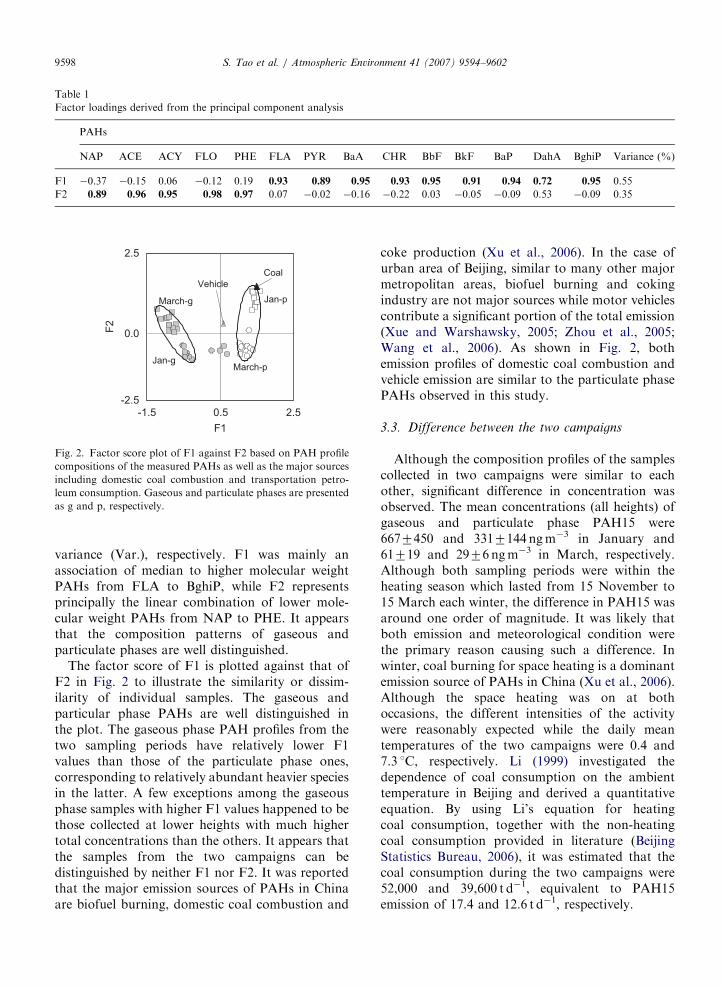
3.4. Vertical distribution of PAHs
Among the few studies on vertical distribution ofPAHs in atmospheric boundary layer, differentconcentration profiles were observed. Farrar et al.(2005) found a clear decline of dominant PAHs withheight in most cases in the urban atmospheric
E, °80 120100
March 7
China
Mongolia
Russia
Beijing
, 102, 160 and 240m with initial times of 6:00 h of 15 January (left)
Heig
ht, m
39.3
N, °
480
0
120
240
360
40.839.8 40.3
117.0
115.5
116.5116.0
E, °
March 7
Sampling tower
ghts in 14–15 January (left) and 7–8 March (right) derived from
ARTICLE IN PRESS
330
0
110
H,
m
220
0 1800900
P15, ng/m3
gaseousJan.
0 10050
P15, ng/m3
gaseousMarch
0 500250
P15, ng/m3
particulateJan.
0 4020
P15, ng/m3
particulateMarch
330
0
110
H,
m
220
0.0 5.02.5
V, m/s
Jan.
March
Fig. 5. Vertical distributions of gaseous and particulate phase PAH15 and daily mean wind velocities in 16–17 January 2006 and 7–8
March 2006.
0
-8
logR
g/p
-4
4 1610
logKoa
r = 0.905
DahA
Fig. 6. Relationship between gaseous/particulate ratio (Rg/p) and
octanol–air partitioning coefficient (KOA), both of which are log-
transformed. Standard deviations of Rg/p (vertical bars) were
derived from the measurements at various heights and standard
deviations of KOA (horizontal bars) were due to changes in
temperature at various heights.
S. Tao et al. / Atmospheric Environment 41 (2007) 9594–96029600
boundary layer of Toronto, Canada. In Tianjin, thecity immediately next to Beijing, Wu et al. (2006)found the highest concentrations of PAHs at aheight of 40m compared to the other two samplingheights of 20 and 60m, presumably due to theheights of chimneys in the surrounding neighbor-hood. As illustrated in Fig. 5, clear decreasing trendswith height are demonstrated for both campaigns inthis study. This is similar to the observed verticaldistributions of aerosol in atmosphere of Beijing andother cities (Li et al., 2005; Yang et al., 2005).
Farrar et al. (2005) proposed three majorscenarios of vertical concentration profiles of atmo-spheric pollutants due to differences in emissionsources, advection and vertical mixing conditions.(1) Even vertical distribution with weak freshemission, dominant advection and well-mixed con-dition; (2) decrease with height with ground sourcedomination and stable atmospheric boundary layerconditions and (3) increase with height with upperboundary layer emission sources. The results of thisstudy fit the second scenario well. As discussedpreviously, the major PAH emission sources inBeijing were motor vehicle emission and domesticcoal combustion, which were practically at groundlevel. Yang et al. (2005) also confirmed that thisspecific site was under strong influences of emissionfrom transportation and domestic combustion ofcoal in adjacent neighborhood. Though the weath-ers were different between the two campaigns, themeteorological conditions prevailing in this regionin winter facilitated the accumulation of mostatmospheric pollutants at lower boundary layer,because the study area generally features in shallowboundary layer, weak vertical mixing and frequenttemperature inversion in winter. Hu et al. (2004)indicated that the average extents of the boundarylayer are 510.0 and 1360.0m in winter and summer,respectively. Under the influence of still current,
local topography, mountain-and-valley wind andcloudy weather, temperature inversion occurred for230 d each year and for 22 d in January in Beijing.Occasionally, the inversion can even last continu-ously for several days in winter (Xia, 2006). Duringthe sampling periods, the ground wind speeds wereonly 0.9 and 1.4m s�1 and ground-based tempera-ture inversion was observed in both cases, particu-larly in 15–16 January. It was unfavorable forpollutants emitted at ground level to travel up-wards, leading to sharp vertical decrease in PAHconcentrations both in gaseous and particulatephases. This is especially true in January.
3.5. Partitioning of PAHs between gaseous and
particulate phases
As a class of semi-volatile chemicals, the gas-particle partitioning of various PAHs are verydifferent. Lighter PAHs with lower vapor pressureare predominantly found in gaseous phase whileheavier ones with five or more rings are almost

ARTICLE IN PRESS
-2.0
-3.4
logR
g/p
-2.7
3.64 3.673.65
1/T, 10-3 k
Jan.
-2.5
-3.3
logR
g/p
-2.9
3.55 3.593.57
1/T, 10-3 k
Marchr = 0.639
3.66
r = 0.578
330
0
110
H, m
220
-1 94
T, °C
Jan.
March
Fig. 7. Relationship between logRg/p and ambient temperature during the two campaigns (left and middle) and vertical variations of
temperatures in January and March.
S. Tao et al. / Atmospheric Environment 41 (2007) 9594–9602 9601
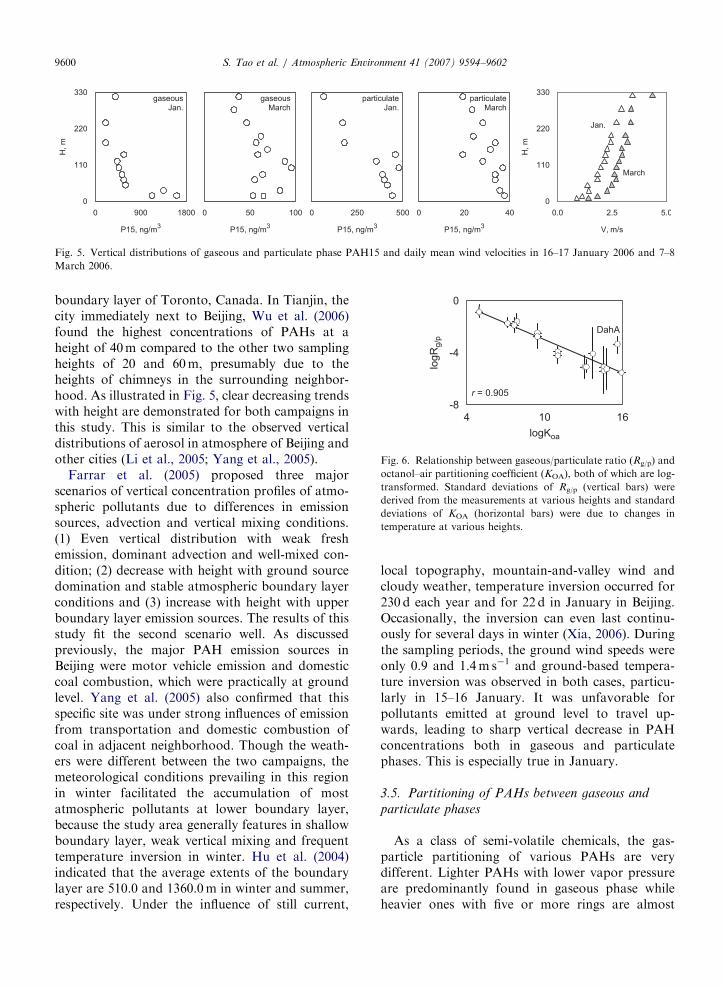
exclusively in the particulate phase (Harner andBidleman, 1998; Kaupp and McLachlan, 1999). Theoctanol–air partition coefficient (KOA) was definedas the equilibrium concentration ratio of chemicalsin air versus in octanol and often used to describethe partitioning of semi-volatile chemicals betweengaseous and particulate phases in atmosphere(Finizio et al., 1997). In this study, the weights ofparticles were measured for all samples and thePAHs in particulate phase can also be presented asweight concentration (ng g�1). The concentrationratios of PAHs in gas (ngm�3) versus solid (ng g�1)phases (Rg/p) were derived, which show a significantcorrelation (Fig. 6) with the literature reported KOA
after log-transformation (Tolls and McLachlan,1994). In Fig. 6, data from the two campaigns arepooled together with the vertical and horizontalbars representing standard deviations of the mea-sured Rg/p at various heights and the influence oftemperature on KOA, respectively. Relatively highvariability of Rg/p for several heavier PAHs can beexplained by the fact that the measured concentra-tions of these compounds in gaseous phase wereclose or sometimes below to the detection limits.This was also the reason that DahA deviates fromthe linear correlation. It should also be noted thatthe active sampling technique has its limitation. Itwas possible that a re-partitioning of PAHs betweenthe solid and gas phases occurred during thesampling when all gaseous PAHs passed throughthe layer of collected particles on the filter prior tobe trapped on PUF.
The temperature dependence of the phase parti-tioning of PAHs is illustrated in Fig. 7, wherelogRg/p is plotted against temperature (1/T) for thetwo campaigns. The vertical temperature profiles
are also presented for reference (right). Significantcorrelation (po0.01) can be seen with Pearsoncorrelation coefficient of 0.639 and 0.578 for the twocampaigns, respectively, demonstrating that coolambient temperature, or high altitude was favoredparticulate phase partitioning.
Acknowledgments
Funding for this study was provided by NationalBasic Research Program (2007CB407301) and Na-tional Scientific Foundation of China (40332015,40428005). We are also grateful to the PekingUniversity President Undergraduate Student Re-search Program for financial support.
Appendix A. Supplementary material
Supplementary data associated with this articlecan be found in the online version at doi:10.1016/j.atmosenv.2007.08.026.
References
Beijing Statistics Bureau, 2006. Statistics Year Book of Beijing.
Chinese Statistics Press, Beijing.
Chan, L.Y., Kwok, W.S., Chan, C.Y., 2000. Human exposure to
respirable suspended particulate and airborne lead in different
roadside microenvironments. Chemosphere 41, 93–99.
Draxler, R.R., Rolph, G.D., 2003. HYSPLIT (HYbrid Single-
Particle Lagrangian Integrated Trajectory) model access via
NOAA ARL READY website /http://www.arl.noaa.gov/
ready/hysplit4.htmlS. NOAA Air Resources Laboratory,
Silver Spring, MD.
Fraser, M.P., Cass, G.R., Simoneit, B.R.T., Rasmussen, R.A.,
1998. Air quality model evaluation data for organics: 5.
C6-C22 nonpolar and semipolar aromatic compounds.
Environmental Science and Technology 32, 1760–1770.

ARTICLE IN PRESSS. Tao et al. / Atmospheric Environment 41 (2007) 9594–96029602
Farrar, N.J., Harner, T., Shoeib, M., Sweetman, A., Jones, K.C.,
2005. Field deployment of thin film passive air samplers for
persistent organic pollutants: a study in the urban atmospheric
boundary layer. Environmental Science and Technology 39,
28–42.
Finizio, A., Mackay, D., Bidleman, T.F., Harner, T., 1997.
Octanol–air partition coefficient as a predictor of partitioning
of semi-volatile organic chemicals to aerosols. Atmospheric
Environment 15, 2289–2296.
Goldstone, S.O., Kirk, M.E., Lester, P.W.W., Lester, J.N., Perry,
R., 1992. Concentration of particulate and gaseous polycyclic
aromatic hydrocarbons in London air following a reduction
in the lead content of petrol in the United Kingdom. Science
of the Total Environment 111, 169–199.
Harner, T., Bidleman, T.F., 1998. Measurement of octanol–air
partition coefficient for polycyclic aromatic hydrocarbons and
polychlorinated naphthalenes. Journal of Chemical Engineer-
ing Data 43, 40–46.
Hu, H.L., Wu, Y.H., Xie, C.B., Yan, F.Q., Wong, N.Q., Fan,
A.Y., Xu, Y.D., Ji, Y.F., Yu, T., Ren, Z.H., 2004. Aerosol
pollutant boundary layer measured by Lidar at Beijing.
Research of Environmental Science 17, 59–73.
Kalberer, M., Henne, S., Prevot, A.S.H., Steinbacher, M., 2004.
Vertical transport and degradation of polycyclic aromatic
hydrocarbons in an Alpine Valley. Atmospheric Environment
38, 6447–6456.
Kaupp, H., McLachlan, M.S., 1999. Gas/particle partitioning of
PCDD/Fs, PCBs, PCNs and PAHs. Chemosphere 38,
3411–3421.
Li, Q.J., 1999. Temperature dependence of coal consumption
loading in design of space heating. Urban Coal Gas 2, 22.
Li, C.L., Fu, J.M., Sheng, G.Y., Bi, X.H., Hai, Y.M., Wang,
X.M., Mai, B.X., 2005. Vertical distribution of PAHs in the
indoor and outdoor PM2.5 in Guangzhou, China. Building
and Environment 40, 327–339.
Li, J., Zhang, G., Li, X.D., Qi, S.H., Liu, G.Q., Peng, X.Z., 2006.
Source seasonality of polycyclic aromatic hydrocarbons
(PAHs) in a subtropical city, Guangzhou, South China.
Science of the Total Environment 355, 145–155.
Liu, D.M., Li, Y.Y., Jiang, B.K., Wang, K., 2003. Preliminary
study of organic pollutants from atmospheric particulates in
Shougang District, Beijing. Journal of China University of
Geosciences 28, 327–332.
Liu, Y.N., Tao, S., Yang, Y.F., Dou, H., Yang, Y., Coveney,
R.M., 2007. Inhalation exposure of traffic police officers
to polycyclic aromatic hydrocarbons (PAHs) during the winter
in Beijing, China. Science of the Total Environment 383,
98–105.
McKendry, I.G., Sturman, A.P., Vergeiner, J., 2004. Vertical
profiles of particulate matter size distributions during winter
domestic burning in Christchurch, New Zealand. Atmo-
spheric Environment 38, 4805–4813.
Park, S.S., Kim, Y.J., Kang, C.H., 2002. Atmospheric polycyclic
aromatic hydrocarbons in Seoul, Korea. Atmospheric En-
vironment 36, 2917–2924.
Qi, S.H., Sheng, G.Y., Fu, J.M., Min, Y.S., Wu, J.X., Jian, Y.T.,
Ye, Z.X., 2000. Study on distributions of polycyclic aromatic
hydrocarbons (PAHs) in aerosols at different levels. Acta
Scientiae Circumstantiae 20, 308–311.
Tao, S., Li, X.R., Yang, Y., Coveney, R.M., Lu, X.X., Chen,
H.T., Shen, W.R., 2006. Dispersion modeling of polycyclic
aromatic hydrocarbons from combustion of biomass and
fossil fuels and production of coke in Tianjin, China.
Environmental Science and Technology 40, 4586–4591.
Tao, S., Liu, Y.N., Xu, W., Lang, C., Liu, S.Z., Dou, H., Liu,
W.X., 2007. Calibration of a passive sampler for both gaseous
and particulate phase polycyclic aromatic hydrocarbons.
Environmental Science and Technology 41, 568–573.
Tolls, J., McLachlan, M.S., 1994. Partitioning of semivolatile
organic compounds between air and Lolium multiflorum
(welsh ray grass). Environmental Science and Technology
28, 159–166.
Wang, X.L., Tao, S., Xu, F.L., Dawson, R.W., Cao, J., Li, B.G.,
Fang, J.Y., 2002. Modeling the fate of benzo[a]pyrene in the
wastewater-irrigated areas of Tianjin with a fugacity model.
Journal of Environment Quality 31, 896–903.
Wang, X.L., Tao, S., Dawson, R.W., Wang, X.J., 2004.
Uncertainty analysis of parameters for modeling the transfer
and fate of benzo(a)pyrene in Tianjin wastewater irrigated
areas. Chemosphere 55, 525–531.
Wang, G., Huang, L., Zhao, X., Niu, H., Dai, Z., 2006. Aliphatic
and polycyclic aromatic hydrocarbons of atmospheric aero-
sols in five locations of Nanjing urban area, China. Atmo-
spheric Research 81, 54–66.
Watts, J., 2005. China: the air pollution capital of the world.
Lancet 366 (9499), 1761–1762.
Wu, S.P., Tao, S., Liu, W.X., 2006. Particle size distributions of
polycyclic aromatic hydrocarbons in rural and urban atmo-
sphere of Tianjin, China. Chemosphere 62, 357–367.
Xia, H.X., 2006. The preliminary study of introducing the super-
high chimney to the plain area of Beijing. Muncipal
Administration and Technology 8, 70–72.
Xu, S.S., Liu, W.X., Tao, S., 2006. Emission of polycyclic
aromatic hydrocarbons in China. Environmental Science and
Technology 40, 702–708.
Xue, W.L., Warshawsky, D., 2005. Metabolic activation of
polycyclic and heterocyclic aromatic hydrocarbons and DNA
damage: a review. Toxicology and Applied Pharmacology
206, 73–93.
Yang, L., He, K.B., Zhang, Q., Wang, Q.D., 2005. Vertical
distributive characters of PM2.5 at the ground layer in
autumn and winter in Beijing. Research of Environmental
Science 18, 23–28.
Zhang, Y.X., Tao, S., Cao, J., Coveney, R.M., 2007. Emission of
polycyclic aromatic hydrocarbons in China by county.
Environmental Science and Technology 41, 683–687.
Zhou, J., Wang, T., Huang, Y., Mao, T., Zhong, N., 2005. Size
distribution of polycyclic aromatic hydrocarbons in urban
and suburban sites of Beijing, China. Chemosphere 61,
792–799.