©verlag ferdinand berger & söhne ges.m.b.h., horn, … · · 2012-08-09determination of the...
TRANSCRIPT

Phyton (Horn, Austria) Vol. 42 Fasc. 1 79-97 29. 7. 2002
Determination of the Osmotic Potential in SecondaryPhloem of Norway spruce (Picea abies (L.) KARST.) Using
Tissue Discs - A Technical Report
Sabine ROSNER*)**) and Silvia B. KIKUTA
With 4 figures
Received October 10, 2001
Accepted November 13, 2001
Key words: Disc method, relative water content, saturation kinetics, vaporpressure osmometry, water content.
Summary
ROSNER S. & KIKUTA S. B. 2002. Determination of the osmotic potential in
secondary phloem of Norway spruce (Picea abies (L.) KARST.) using tissue discs - Atechnical report. - Phyton (Horn, Austria) 42 (1): 79-97, with 4 figures. - English withGerman summary.
Methods for determining relative water content, the osmotic potential at fullsaturation (f o (sat)) and the in situ osmotic potential ("Po (in situ)) on secondaryphloem discs of Picea abies (L.) Karst, are presented.
Osmotic potential at full saturation and relative water content (R), parametersenabling comparisons within the tree or between different trees, were measured onthe same sample. Small water losses during manipulation steps between weighingafter saturation and weighing after cryo-storage did not influence correct determi-nation of Wo (sat) values. Saturation periods of 5 to 10 min were sufficient to reachfull turgor. With these short saturation times, oozing or respiratory loss of osmoti-cally active solutes was negligible.
An improved disc method, termed SFD method, was developed to measureWo (in situ) on saturated, frozen discs that were dehydrated to the initial freshweight on a micro-balance before measurement of the potential. Thus, the osmo-
*) S. ROSNER, S. B. KIKUTA, Institute of Botany, University of Agricultural
Sciences, Vienna, Gregor Mendel Str. 33, A-1180 Vienna, Austria. Telephone: +43 147654 3198. Fax: +43 1 47654 3180. E-mail: [email protected]
**) To whom correspondence should be addressed.
©Verlag Ferdinand Berger & Söhne Ges.m.b.H., Horn, Austria, download unter www.biologiezentrum.at

tic potential was measured exactly at the water content operative at samplecollection.
Wo (in situ) determined with the conventional disc method (tissues frozen with-out saturation) were significantly lower (more negative) because of water loss duringmanipulation steps. The SFD method gives more reliable values for the in situ os-motic potential compared to the conventional disc method. Furthermore, it is possi-ble to measure several different parameters of water status, such as water content,relative water content, and osmotic potential at different water contents, on the samesample. Further advantages of the SFD method over the press-sap and conventionaldisc methods are discussed.
Zusammenfassung
ROSNER S. & KIKUTA S. B. 2002. Bestimmung des osmotischen Potentials vonFichtenbast (Picea abies (L.) KARST.) mittels Gewebescheibchen - Ein technischerReport. - Phyton (Horn, Austria) 42 (1) : 79-97, mit 4 Abbildungen. - Englisch mitdeutscher Zusammenfassung.
In der vorliegenden Arbeit werden Methoden präsentiert, den relativen Wasser-gehalt, das osmotische Potential bei voller Sättigung (To (sat)) und das in situ os-motische Potential (Wo (in situ)) an Bastscheibchen von Fichte zu bestimmen.
Mit der beschriebenen Methode ist es möglich, R und Wo (sat) an derselbenProbe zu messen. Geringe Wasserverluste während nötiger Manipulationsschrittehatten keinen Einfluss auf die korrekte Bestimmung von fo (sat). Sättigungszeitenzwischen 5 und 10 Minuten waren ausreichend, um volle Turgeszenz zu gewährleis-ten, und garantierten keine Verluste von osmotisch aktiven Substanzen oder re-spirative Verluste.
Die Bestimmung von Wo (in situ) erfolgte an gesättigt eingefrorenen Gewebe-scheibchen, die zuvor auf einer Mikrowaage auf das ursprüngliche Frischgewichtdehydriert wurden, wodurch die Potentialmessung exakt beim ursprünglichen in situWassergehalt ermöglicht wurde (SFD Methode). Die Bestimmung von Wo (in situ) mitder herkömmlichen Methode, bei der die Scheibchen ungesättigt eingefroren werden,führte zu signifikant negativeren Werten, welche durch unkontrollierbaren Wasser-verlust bedingt waren.
Die Autoren erachten deshalb die SFD Methode als eine Methode, die re-präsentative Werte für die Bestimmung von Wo (in situ) liefert. Darüber hinaus ist esmöglich, verschiedene Wasserhaushaltsparameter wie den (relativen) Wassergehehaltund das osmotische Potential an derselben Probe bei verschiedenen Sättigungs-graden zu messen.
Abbrevia t ions
Wo osmotic potentialWo (in situ) in situ osmotic potential of secondary phloem discs at sample
collectionWo (sat) osmotic potential of fully saturated secondary phloem discsC water contentC in situ in situ water content at sample collectionC sat water content at full saturationCB crown base
©Verlag Ferdinand Berger & Söhne Ges.m.b.H., Horn, Austria, download unter www.biologiezentrum.at

81
D dry weight
F fresh weight
E relative water content
R in situ in situ relative water content at sample collection
S saturated weight
SFD method method for measuring the osmotic potential at a given fresh
weight (e.g. To (in situ)); discs were Saturated, Frozen, and
Dehydrated to pre-set fresh weights, for instance to the in situ
values
3/1 Oh 3/10 of tree height
In t roduct ion
Münch's pressure-flow model (MUNCH 1930) states that phloem osmo-tic relations play a predominant role in the translocation of photosynthatesin the plant body. Therefore, an osmotically dynamic system has to be ex-pected, with solutes constantly moving from sources (sites of photo-synthate supply) to sinks (sites of metabolism or storage of photo-synthates). Along this pathway, pronounced pressure gradients are gener-ated, associated with differences in the solute concentration. Osmotic po-tential (Wo) of symplastic solutions in plant organs is an important com-ponent of plant water relations describing the effects of dissolved solutes.Measurement of Wo should thus provide information on the amount of as-similates supplied to, transported in and removed from the secondaryphloem, as well as on storage, mobilisation, and distribution of reservematerial.
Two standard methods for the direct measurement of osmotic potentialin bark tissues, such as cortex (defined as the tissue between secondaryphloem and periderm: ESAU 1969, TROCKENBRODT 1990), secondary phloem,and cambium are widely used today: Wo is either measured on press sapsor on killed plant tissue. Cryoscopy of press saps (DIXON & ATKINS 1910)has been the method most frequently used for these tissues. Thermocouplepsychrometry allows a more rapid measurement of osmotic potential withfewer preparatory steps (SPANNER 1951), but only scarce data have beenpublished on stem tissues. KAUFMANN & KRAMER 1967 measured osmoticpotentials of secondary phloem discs from various deciduous tree species.
Only the in situ osmotic potential (Wo (in situ)), defined as the Wo offreshly harvested tissues, has been measured on cortex, secondary phloemand cambium of Norway spruce (Picea abies (L.) Karst.) trees. Water lossfrom these tissues during sampling, killing, and preparation of press sapsfor the determination of Wo (in situ) was not taken into account (KRAEMER1953, MERKER 1956, DÜNISCH & al. 1996). Considerable water loss from cutedges occurs even in leaf discs (WALKER & al. 1984), thus influencing themeasured water potential significantly. Discs of secondary phloem willloose even more water during preparation, since the entire surface is ex-
©Verlag Ferdinand Berger & Söhne Ges.m.b.H., Horn, Austria, download unter www.biologiezentrum.at

82
posed to air. Therefore, it has to be tested if the conventional disc method isreliable for determining in situ osmotic potential.
To (in situ) per se offers limited information on water relations in theplant, since it is influenced by active and passive processes. An activechange of osmotic potential is caused by an increase or a decrease of os-motically active solutes at a given water content. A passive change origi-nates solely from a difference in water content, thus from a change in vo-lume of the symplast. To distinguish between active and passive changes,parameters such as the in situ relative water content (R in situ), that is theactual water content as a fraction of the water in the fully hydrated tissue,or the osmotic potential at full saturation {Wo (sat)) have to be determined.These parameters permit comparisons of water relations in the secondaryphloem within a tree and between trees, as well as the measurement ofseasonal courses and reactions to drought stress.
Considering the importance of assimilate distribution and utilisationfor plant growth and defence, data on the osmotic potential of the phloemcan be helpful in understanding differences in the vitality of trees. Droughtstressed trees may be easierly colonised by aggressive phloem feeding barkbeetle species (Coleoptera: Scolytidae) due to their less effective terpene-based defence system (CHRISTIANSEN & al. 1987, LEWINSOHN & al. 1993,BRYANT & RAFFA 1995, PAINE & al. 1997). Also, they may offer high nutri-tional quality for the beetles, because of the increased levels of minerals,soluble N and sugars in the secondary phloem (CLANCY & al. 1995). Thus,for a better understanding of these plant-insect interactions, osmoticparameters should be measured in the secondary phloem and not in thexylem.
The purpose of this study was to develop reliable methods for deter-mining the in situ relative water content and the osmotic potentials both insitu and at full saturation on secondary phloem tissue of Picea abies. Theconventional disc method introduced by KAUFMANN & KRAMER 1967 wasimproved. Since no data on saturation kinetics for secondary phloem havebeen available, saturation experiments were done to find out how to reachfull turgor with a minimum loss of osmotically active solutes.
Mater ia l and Methods
Plant material
Samples of secondary phloem were taken from Norway spruce trees {Picea abiesL. KARST.) harvested at four low-elevation sites in Lower Austria: Manhartsberg,Prinzersdorf, Rosalia, and Amstetten. Samples were also taken from a high-elevationstand in Styria: Murau. For further details of study sites, trees, and time of samplecollection see table 1.
Samples were either taken in the field immediately after harvesting or fromspruce logs (60 cm length) transported to the laboratory and stored in a cold room(4 °C, 80% r.h.).
©Verlag Ferdinand Berger & Söhne Ges.m.b.H., Horn, Austria, download unter www.biologiezentrum.at

83
Table 1.Characterisation of study sites and harvested trees
Study site
MurauManhartsbergPrinzersdorf
Rosalia
Amstetten
Heighta.s.l. (m) E
1200 14°10'500 15°46'250 15°31'
600 1.6°17'
300 14°50'
N
47°05'48°33'48°12'
47042'
48°05'
Treeage (y)
90
95
65
80
60
75
80
75
75
75
75
20
Tree height(m)
25.024.720.023.519.024.923.623.523.721.821.112.0
Time ofharvesting
August 4, 1995August 17, 1995June 21, 1995August 26, 1996November 5, 1996May 30, 1996
July 22,1996
September 28, 1999
Preparation of discsA core of bark plus one or two annual increments of wood was punched out with
a cork-borer of 6 mm diameter. To avoid water loss during transport to the laboratorythe cores were tightly wrapped in ParafilmIJ (American National Can™, Greenwich)and stored in a styrofoam box kept cool with ice packs.
Starting from the vascular cambium, discs were cut tangentially (in direction tothe periderm) from the core with a scalpel. On the disc cut next to the cambium thewater status of the conducting secondary phloem, consisting of uncollapsed sievecells and parenchyma cells, was determined. In Picea dbies, the sieve cells of the lastand next-to-the-last annual rings remain uncollapsed during summer and transportassimilates axially (HOLDHEIDE 1951). The thickness of the discs had to be chosenaccording to the specimen and varied from 0.2 to 0.5 mm, since the width of theconducting secondary phloem depends on genetics, growth conditions, and the phy-siological age of the bark (BÄUCKER & al. 1998, FRANCESCHI & al. 1998, ROSNER 1998).
The width of secondary phloem (conducting and non-conducting) of the trees in-vestigated was 4 to 6 mm.
About 0.5 mm thick discs were also cut from the central part of the non-con-ducting secondary phloem 1.5 to 2.5 mm distant from the vascular cambium. Bothsampling positions proved suitable for delivering water status parameters com-parable within or between trees. Radial gradients of osmotic potential and relativewater content in secondary phloem were be discussed in another paper (ROSNER & al.2001).
Determination of saturation time for discs (disc saturation method)Osmotic potential at full saturation (fo (sat)) and relative water content (R)
were measured on discs prepared as follows: After determining the fresh weight (F)on a micro-balance (ME/BE22, resolution: 0.001 mg, Mettler, Zürich, CH), the discswere saturated with distilled water according to the method described by SLAVIK1974 for leaves. A water-saturated polyurethane foam sheet with holes of 6 mm in
©Verlag Ferdinand Berger & Söhne Ges.m.b.H., Horn, Austria, download unter www.biologiezentrum.at
o (sat)
o [in situ)
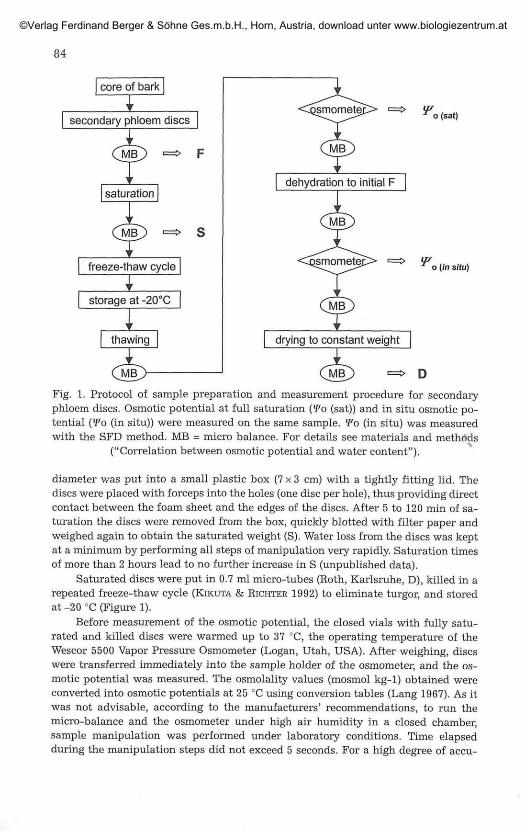
Fig. 1. Protocol of sample preparation and measurement procedure for secondaryphloem discs. Osmotic potential at full saturation (<Fo (sat)) and in situ osmotic po-tential {Wo (in situ)) were measured on the same sample. *Po (in situ) was measuredwith the SFD method. MB = micro balance. For details see materials and methods
("Correlation between osmotic potential and water content").
diameter was put into a small plastic box (7x3 cm) with a tightly fitting lid. Thediscs were placed with forceps into the holes (one disc per hole), thus providing directcontact between the foam sheet and the edges of the discs. After 5 to 120 min of sa-turation the discs were removed from the box, quickly blotted with filter paper andweighed again to obtain the saturated weight (S). Water loss from the discs was keptat a minimum by performing all steps of manipulation very rapidly. Saturation timesof more than 2 hours lead to no further increase in S (unpublished data).
Saturated discs were put in 0.7 ml micro-tubes (Roth, Karlsruhe, D), killed in arepeated freeze-thaw cycle (EJKUTA & RICHTER 1992) to eliminate turgor, and storedat -20 °C (Figure 1).
Before measurement of the osmotic potential, the closed vials with fully satu-rated and killed discs were warmed up to 37 °C, the operating temperature of theWescor 5500 Vapor Pressure Osmometer (Logan, Utah, USA). After weighing, discswere transferred immediately into the sample holder of the osmometer, and the os-motic potential was measured. The osmolality values (mosmol kg-1) obtained wereconverted into osmotic potentials at 25 °C using conversion tables (Lang 1967). As itwas not advisable, according to the manufacturers' recommendations, to run themicro-balance and the osmometer under high air humidity in a closed chamber,sample manipulation was performed under laboratory conditions. Time elapsedduring the manipulation steps did not exceed 5 seconds. For a high degree of accu-
©Verlag Ferdinand Berger & Söhne Ges.m.b.H., Horn, Austria, download unter www.biologiezentrum.at

85
racy, discs were also weighed after measurement of the potential. The mean value ofthe two weighings was used to calculate R (equation [3]) for the potential measured.
On average, the osmometer measurement of one sample required 45 min, butwith some specimens took up to 90 min till vapor pressure equilibrium was reached(for equilibration times of leaves see KIKUTA & RICHTER 1992). Therefore, to process alarge number of samples it was absolutely necessary to store the discs frozen until themeasurement of potentials.
Discs were dried to constant weight for 12 h at 85 °C (LITVAY & MCKIMMY 1975).The values of fresh weight (F), saturated weight (S), and dry weight (D) were used tocalculate the following parameters:
C = (F - D) / D [1]C sat = (S - D) / D [2]R = (F - D) / (S - D) [3]Percentage values were obtained by multiplying C and R by 100.
Determination of osmotic potential at full saturation {To (sat)) on bark pieces(bark piece saturation method)
To detect a possible loss of osmotically active substances during saturation, thedisc saturation method was compared to an alternative saturation approach: Barkpieces (5x5 cm) were saturated by placing them between two wet sheets of poly-urethane. Cores of bark were punched out after saturation for 25, 40, 60, and 130 min.Discs were then cut from the cores and killed in a repeated freeze-thaw cycle beforemeasurement of the osmotic potential. Parallel measurements of To (sat) were donewith the disc saturation method, using 10, 20, 30, and 40 min of saturation.
Determination of in situ osmotic potential (To (in situ)) with the SFD methodThe SFD method allows measurement of the osmotic potential at different water
content levels above, at or below the in situ values.For measurement of To (in situ), discs prepared as described in "Preparation of
discs" were weighed to determine their initial fresh weight, then saturated (methodsee "Determination of saturation time for discs") for 5 min (conducting secondaryphloem) or 10 min (non-conducting secondary phloem), and frozen. Non-conductingsecondary phloem required longer saturation because of changes occurring in thetissue at the end of its functional period, such as collapse of sieve cells, dilatationgrowth, sclerification of parenchyma cells, and accumulation of calcium oxalatecrystals (ESAU 1969).
The stored discs were thawed in closed vials at room temperature, transferred tothe micro-balance and allowed to dehydrate to the initial fresh weight plus a fewtenth of a milligram, exactly 2.5% of the initial fresh weight. The initial fresh weightof each disc was about 10 mg. The potential was measured, and the sample wasweighed again. The mean between the weighings prior to and immediately followingthe To measurement should correspond to the initial fresh weight. Weighing beforeand after To measurement on a number of samples provided sufficient informationon the weight losses during the period between weighing and potential measurement.Therefore, it was possible to estimate the weight to which the samples had to be de-hydrated, so that:
(Weight before To measurement + Weight after To measurement) / 2 = Initialweight
©Verlag Ferdinand Berger & Söhne Ges.m.b.H., Horn, Austria, download unter www.biologiezentrum.at

86
Consequently, we assumed that the potential measured was a reasonableapproximation to Wo (in situ).
Comparison between the conventional disc method and the SFD methodTo validate the SFD method, in situ osmotic potential was also measured on the
same samples with the conventional method: After determining their fresh weight,discs (method see "Preparation of discs") were killed in a freeze-thaw cycle andstored at -20 °C for a few days. After thawing, the discs were weighed again and theosmotic potential was measured. Then the overall decline of water content was cal-culated (conventional disc method).
Water loss during the conventional procedure could be simulated by dehydrat-ing saturated, frozen, and stored discs on the micro-balance: After thawing, *Po (insitu) was measured with the SFD method (in situ, SFD). Then the discs were de-hydrated to a pre-set weight less than the initial fresh weight, and *Fo was measured(< in situ, SFD). The calculation of this weight was based upon the mean percentageloss of initial fresh weight when discs were prepared for Wo measurements with theconventional disc method. If the osmotic potentials show no significant differencesbetween the two methods compared, it is evident that the SFD method gives correctvalues for the in situ osmotic potential and that no physiological changes influen-cing <Po occurred during saturation or dehydration at room temperature.
Correlation between osmotic potential and water contentRegressions between Wo and R or C can be used for calculating the osmotic po-
tential at a given water content. In leaf samples, calculation of Wo for a pre-set R isgenerally not necessary, if •Po (sat) is determined exactly at 100% R. In secondaryphloem discs, determination for a given R might be relevant because small water1 „losses occur after thawing during transfer and weighing. For a high degree of ac-curacy it is possible to calculate R at the measurement of Wo, and, on the otherhand, !Po for a uniform R, for instance at 90 or 95%, provided that S is correctlydetermined before freezing. In our experiments, a correct determination of S wasinsured by placing the saturation boxes at a distance of only 10 cm from the micro-balance and working very rapidly.
For calculating the regression, two or three measurements of potential at dif-ferent water contents are required on the same sample. Figure 1 shows the protocolfor determining the osmotic potential in situ and at full saturation. The mean of theweights before and after the measurement of Wo (sat) was used to determine thecorresponding water content exactly. With the SFD method, measurements of theosmotic potential at several C-levels above, at or below the in situ values are possi-ble. Data of osmotic potential and reciprocals of C or R were used for calculatinglinear regressions, according to the theory of pressure-volume (pV) curves (type Itransformation, TYEEE & RICHTEE 1981, 1982). The linear portion of a pV curve,reached after the turgor loss point, represents the osmotic behavior of the vacuolarsap. By extrapolating this straight line to R values above the turgor loss point, theosmotic potential for any given water content can be estimated, for instance Wo at anR of 100%, which is defined as osmotic potential at full saturation (Wo (sat)). Since inour experiments the osmotic potential of killed tissue was measured (and not thewater potential of living tissue), a linear regression line can be calculated directlyfrom the equations: Wo = a + b * 1/C or Wo = a + b * 1/R.
©Verlag Ferdinand Berger & Söhne Ges.m.b.H., Horn, Austria, download unter www.biologiezentrum.at
87
Short term storage of spruce logsTo detect any possible influence of log storage on osmotic potential and water
content of secondary phloem, samples were taken immediately after tree harvest, andperiodically thereafter, from the stored log.
After harvesting, a log of 60 cm length was cut at breast height from the tree andcores of bark were punched out with a cork borer. Discs of conducting secondaryphloem were cut from the core and saturated for 5 min. Afterwards, the discs werequickly blotted with filter paper, put in vials and frozen in dry ice. Then, the log wastransported to the laboratory, and samples were processed as described in Figure 1.The log was stored for four days in a cold room (4 °C, 80% r.h.). Every day, sampleswere taken for measurement of C in situ, C sat, R in situ, fo (in situ) and To (sat). Forsamples collected immediately after tree harvest, only data of Wo (sat) and C sat areavailable, since it was not possible to use the micro-balance under field conditions.
Statistical analysesStatistical data analyses were carried out with SPSS 7.5.1 for Windows. Mean
values of normally distributed data were tested for significance of differences eitherwith the t-test for independent samples or with one-way ANOVA and subsequentStudent-Newman-Keuls multiple range test. Associations between two variableswere examined using linear regression analyses. Differences or correlations wereaccepted as significant if P was ^ 0.05. *: P ^ 0.05, **: P < 0.01, ***: P «S 0.001.
Box plots show the distribution of data. The lower boundary of the box in-dicates the 25th percentile, the upper boundary the 75th percentile. A line within thebox marks the median. The "whiskers" lines extend from the box to the highest andlowest values.
Results
Saturation time for calculating relative water content (R) using tissue discsFor samples of conducting secondary phloem (n = 5) taken from the
central part of the crown at 19.4 m height of a tree harvested on August 4,1995 at Murau 5 min were sufficient to reach full saturation, leading to acalculated R in situ of 45.7 + 2.7%. Saturating the samples for 10 min ledto values of 44.7 ± 4.5%, and for 20 min to 48.5 ± 5.7%.
Discs of non-conducting secondary phloem of samples taken in 3/10 oftree height (7.4 m) from a tree harvested on August 17, 1995 at Manharts-berg, were fully saturated after 10 min. R in situ was 48.6 + 2.2% and didnot differ significantly from values of discs saturated for 120 min (50.8 ±4.5%).
Osmotic potential of secondary phloem at full saturation (Wo (sat)) ob-tained with the disc saturation method compared to the bark piece sa-turation method
Bark pieces of 5 x 5 cm took six times longer for saturation than discs(Figure 2). Using the disc saturation method, 10 min of saturation weresufficient to determine Wo (sat) for conducting secondary phloem. With the
©Verlag Ferdinand Berger & Söhne Ges.m.b.H., Horn, Austria, download unter www.biologiezentrum.at

-.2
-.4
-.6
S. -.8
CD
-1.0
-1.2
o -1.4-H
8 -1.6
i
O LO OCM CM CO
OLO o
CDo00
Time of saturation [min]
Fig. 2. Osmotic potentials of conducting secondary phloem, duration and mode ofsaturation varying. In situ osmotic potential (time of saturation = 0 min) was ob-tained with the SFD method. Dark filling: bark pieces (5x5 cm); white filling: sec-ondary phloem discs (0 6 mm). Time of harvesting: June 21, 1995 in Prinzersdorf;
sample collection on June 26; n = 5.
bark piece method, conducting secondary phloem reached full saturationafter 60 min only: Wo was significantly different from potentials measuredafter 25 (P ^ 0.01) and 40 min (P sc 0.05) saturation, respectively, but notsignificantly different from results obtained on discs saturated for 10 to40 min. In bark pieces saturated for 130 min osmotic potentials becameless negative, indicating dilution of osmotically active substances: Meanvalues of Wo (sat) after 130 min saturation differed significantly from re-sults of discs saturated for 10 to 40 min (P ^ 0.05, Figure 2).
In conclusion, we think the saturation of discs preferable to thesaturation of bark pieces, because the disc method offers, in addition toshorter saturation periods, the advantage of determining osmotic poten-tial, water content and relative water content on the same sample.
Comparison between the conventional disc method and the SFD methodfor determination of in situ osmotic potential ('Fo (in situ))
With discs treated by the conventional disc method (frozen withoutsaturation), water loss till potential measurement was 26.2% (fresh weightloss of 15.7%) for the experiment done in August, and 11.1% (fresh weightloss of 7.2%) in November.
©Verlag Ferdinand Berger & Söhne Ges.m.b.H., Horn, Austria, download unter www.biologiezentrum.at

89
conventional < in situ, SFD in situ, SFDFig. 3. Osmotic potentials of secondary phloem discs measured with different meth-ods: Discs were (a) non-saturated, frozen, and stored ([conventional] n = 9); (b) satu-rated, frozen, stored, and dehydrated below initial fresh weight (F) ([< in situ, SFD]n = 8); (c) saturated, frozen, stored, and dehydrated to initial F ([in situ, SFD] n = 8).Samples from the central part of secondary phloem were taken on August 28, 1996 at
3/10 tree height (7.1 m) from a tree harvested on August 26 in Prinzersdorf.
Water loss caused by the conventional disc method could be well si-mulated with the SFD method by dehydrating saturated discs to a pre-setweight below the initial fresh weight. Water loss till measurement of thepotential was not significantly different between the two methods, withvalues for the SFD method of 25.1% (14.8% fresh weight loss) in August,and 11.7% (7.7% fresh weight loss) in November [< in situ, SFD].
In August, the osmotic potential was -1.43 + 0.25 MPa for the con-ventional disc method [conventional] and -1.30 + 0.07 MPa for the SFDmethod [< in situ, SFD], with the values not differing significantly(Figure 3). Again, in the November experiment, no significant differenceswere found between the osmotic potentials measured with the conven-tional disc method (-1.27 + 0.09 MPa [conventional]) and the SFD method(-1.23 + 0.08 MPa [< in situ, SFD]) (Figure 4).
Since it is possible to simulate the water loss of discs treated in theconventional way by dehydrating saturated discs on the micro-balancebelow the initial fresh weight, it is assumed that the in situ osmotic po-tential could be restored by the same method.
The osmotic potentials of discs measured with the conventionalmethod were in both experiments significantly more negative than the insitu osmotic potentials determined with the SFD method (P ^ 0.001,
©Verlag Ferdinand Berger & Söhne Ges.m.b.H., Horn, Austria, download unter www.biologiezentrum.at
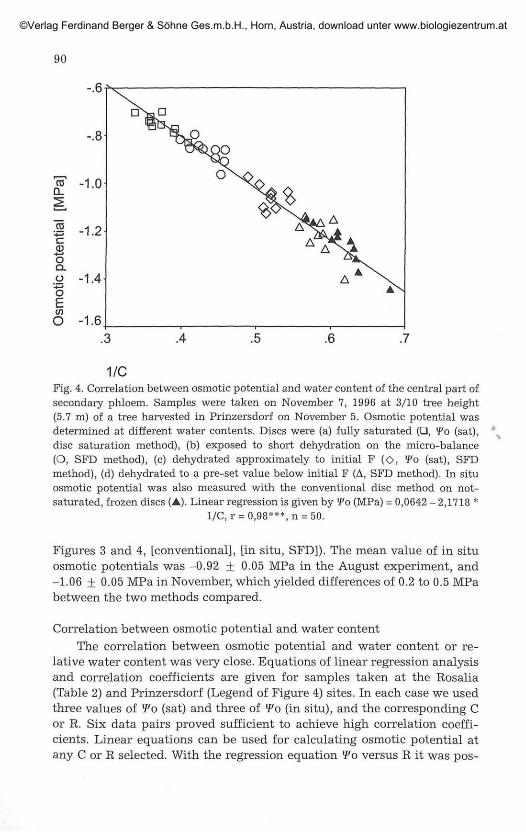
1/CFig. 4. Correlation between osmotic potential and water content of the central part ofsecondary phloem. Samples were taken on November 7, 1996 at 3/10 tree height(5.7 m) of a tree harvested in Prinzersdorf on November 5. Osmotic potential wasdetermined at different water contents. Discs were (a) fully saturated (•, Wo (sat),disc saturation method), (b) exposed to short dehydration on the micro-balance(O, SFD method), (c) dehydrated approximately to initial F (O, fo (sat), SFDmethod), (d) dehydrated to a pre-set value below initial F (A, SFD method). In situosmotic potential was also measured with the conventional disc method on not-saturated, frozen discs (A). Linear regression is given by "Fo (MPa) = 0,0642 - 2,1718 *
1/C, r = 0,98***,n = 50.
Figures 3 and 4, [conventional], [in situ, SFD]). The mean value of in situosmotic potentials was -0.92 + 0.05 MPa in the August experiment, and-1.06 + 0.05 MPa in November, which yielded differences of 0.2 to 0.5 MPabetween the two methods compared.
Correlation between osmotic potential and water contentThe correlation between osmotic potential and water content or re-
lative water content was very close. Equations of linear regression analysisand correlation coefficients are given for samples taken at the Rosalia(Table 2) and Prinzersdorf (Legend of Figure 4) sites. In each case we usedthree values of Wo (sat) and three of Wo (in situ), and the corresponding Cor R. Six data pairs proved sufficient to achieve high correlation coeffi-cients. Linear equations can be used for calculating osmotic potential atany C or R selected. With the regression equation Wo versus R it was pos-
©Verlag Ferdinand Berger & Söhne Ges.m.b.H., Horn, Austria, download unter www.biologiezentrum.at
91
sible to calculate the influence of the water loss between weighing aftersaturation and weighing after storage (at potential measurement) on *Po(sat) values. Water loss, which varied between 2 and 8%, had no significantinfluence on Wo (sat) (Table 2).
Water status of stored logsIn the conducting secondary phloem of logs stored for four days in a
cold room, no significant changes in water status parameters, such as Cin situ, C sat, R in situ, Wo (in situ) and Wo (sat), were observed (Table 3).For Wo (sat), almost identical values were measured throughout the ex-periment.
Discussion
In our opinion, the SFD method presented has various advantagescompared to the conventional disc and the classical press sap methods.
To obtain correct values for Wo (in situ) it is essential that water andsolute loss of the samples is prevented. BENNETT 1990 reviews various pro-blems occurring when the water status of plant tissues is measured withthermocouple psychrometers. An important source of error is the waterloss between sample collection and transfer into the chamber of the osm-ometer, which leads to a passive concentration of solutes. WALKER & al.1984 found a negative correlation between the ratio leaf area/leaf volumeand the measured value of total water potential. Water potential becamemore negative with decreasing radius of the leaf discs or with increasingratio leaf area/leaf volume. In leaf discs, severe water losses may occur atcut edges without cuticle. In secondary phloem discs the entire surface isexposed to air without any barrier in between, thus water losses have to beexpected. The question arose, if these losses have an impact on the correctdetermination of the in situ osmotic potential. Water loss during mani-pulation steps (weighing after saturation - killing - weighing at potentialmeasurement) from rehydrated discs had no impact on the determinationof Wo (sat), because the loss of water in relation to the total water contentwas small (2 to 8%). Thus, it is not necessary to correct measured Wo (sat)values for water loss.
Our experiments showed that it is not possible to obtain reliable va-lues for in situ osmotic potential with the conventional disc method wheremeasurements are done on discs frozen without prior saturation (Figures 3and 4). Water loss during manipulation steps, such as weighing and killingor transfer to vials and osmometer, lowers osmotic potentials considerably.From disc preparation until determination of the initial fresh weight, smallwater losses can occur to the same extent with the conventional discmethod and the SFD method. With the SFD method, further water lossduring the next steps of manipulation was prevented (Figure 1). With the
©Verlag Ferdinand Berger & Söhne Ges.m.b.H., Horn, Austria, download unter www.biologiezentrum.at

Tab
le 2
.C
orre
lati
on b
etw
een
osm
otic
pot
enti
al (
¥ o)
and
wat
er c
onte
nt (
C),
and
rela
tive
wat
er c
onte
nt (
R)
of t
he c
entr
al p
art
of s
econ
dary
phlo
em c
alcu
late
d fo
r tr
ees
from
the
Ros
alia
sit
e (n
=6)
. The
line
ar r
egre
ssio
n is
des
crib
ed b
y th
e eq
uati
ons:
a +
b*l
/C. W
o (
Sat)
is g
iven
as
mea
sure
d va
lue
and
as c
alcu
late
d va
lue
for
R =
100
% u
sing
the
equ
atio
n a
+ b
*l/R
. T
rees
wer
e ha
rves
ted
on M
ay 3
0, 1
996
(num
ber
R1-
R3)
, an
d on
Jul
y 22
, 19
96 (
num
ber
R7-
R9)
. Im
med
iate
ly a
fter
har
vest
ing,
sam
ples
wer
e ta
ken
at 3
/10
h) a
nd a
t br
own
case
(C
B).
Tre
e
Rl
R2
R3
R7
R8
R9
Rel
ativ
ehe
ight
3/10
hC
B3/
10 h
CB
3/10
hC
B3/
10 h
CB
3/10
hC
B3/
10 h
CB
Abs
olut
ehe
ight
(m
)
7.5
16.1
7.1
14.2 7.1
14.2
7.1
15.7 6.5
12.3
6.3
13.3
Lin
ear
regr
essi
on
a
0.04
93-0
.046
7-0
.070
4-0
.037
5-0
.039
8-0
.010
6-0
.031
40.
0226
0.09
910.
0187
-0.0
809
0.01
11
Wo
and
1/C
b
-1.5
286
-1.4
544
-1.1
576
-1.3
717
-1.2
230
-1.2
735
-1.1
968
-1.3
664
-1.4
664
-1.3
867
-1.1
457
-1.2
678
r
0.96
**0.
98**
*0.
92**
0.99
***
2***
0.98
***
0.96
**0.
99**
*0.
98**
*0.
99**
*0.
97**
*0.
97**
*
a
0.00
19-0
.018
2-0
.026
6-0
.056
3-0
.059
3-0
.055
9-0
.024
70.
0313
0.05
390.
0090
-0.0
818
0.02
49
Lin
ear
regr
essi
onf o
an
d 1/
R
b
-0.5
225
-0.6
277
-0.4
339
-0.5
008
-0.4
499
-0.4
625
-0.4
636
-0.5
023
-0.5
796
-0.5
606
-0.4
601
-0.5
136
r
0 92
***
0.98
***
0.98
***
0.97
***
0.99
***
0.99
***
0.98
***
0.99
***
0.93
**0.
94**
0.96
**0.
99**
*
fo
(sat
)
(MPa
)
mea
sure
d
-.51
-.64
-.46
-.55
-.50
-.52
-.49 -.47
-.52
-.54
-.54
-.49
Ml
r o
(sat
)(M
Pa)
calc
ulat
ed
-.48
-.60
-.43
-.52
-.48
-.48
-.45
-.43
-.48
-.51
-.51
-.45
©Verlag Ferdinand Berger & Söhne Ges.m.b.H., Horn, Austria, download unter www.biologiezentrum.at

Tab
le 3
.W
ater
sta
tus
para
met
ers
of d
iscs
fro
m c
ondu
ctin
g se
cond
ary
phlo
em o
f a
spru
ce t
ree
harv
este
d on
Sep
tem
ber
28,
1999
in
Am
stet
ten.
Sam
ples
wer
e co
llec
ted
imm
edia
tely
aft
er t
ree
harv
est
and
from
a l
og (
take
n at
bre
ast
heig
ht)
stor
ed u
p to
4 d
ays
in a
col
d ro
om (
4 °C
,80
% r
.h.)
. Sam
e le
tter
ind
icat
es n
o si
gnif
ican
t di
ffer
ence
s; n
= 5
.
Sam
ple
coll
ecti
on
At
the
mom
ent
of h
arve
stin
g
Aft
er 3
h t
rans
port
to
the
labo
rato
ry
^o
(sat
)(M
Pa)
-0.7
46 +
0.0
70 a
-0.7
48 +
0.0
67 a
CSat
360.
29 +
24.
36 a
359.
60 +
18.
68 a
*o
(in
situ
)(M
Pa)
-0.9
26 +
0.0
59 a
^in
situ
287.
11 +
26.
18 a
"in
situ
79.7
9 +
5.1
1 a
Aft
er s
tora
ge f
or24
h48
h72
h96
h
-0.7
39 +
0.0
71 a
-0.7
37±
0.02
7 a
-0.7
43±
0.06
5a-0
.743
+ 0
.064
a
352.
57 +
35.
26 a
353.
78 +
17.
50 a
351.
69 +
35.
44 a
356.
33 +
24.
52 a
-0.9
36 +
0.0
39 a
-0.9
52 +
B.0
64 a
-0.9
65 +
0.0
79 a
-0.9
64 +
0.0
47 a
287.
08 +
24.
37 a
286.
24 +
14.
60 a
280.
38 +
25.
42 a
284.
36 +
33.
20 a
79.2
4 +
5.5
8 a
80.9
2 +
1.2
9 a
78.9
8 +
2.2
7 a
79.7
5 +
7.0
0 a
©Verlag Ferdinand Berger & Söhne Ges.m.b.H., Horn, Austria, download unter www.biologiezentrum.at

conventional disc method, water loss during manipulation steps after de-termination of the initial fresh weight (such as sample killing and transferto the vials, transfer of thawed samples to the osmometer), lowered theosmotic potential significantly. Therefore, we suppose that the conven-tional disc method does not measure in situ osmotic potentials correctly.This is especially true for samples frozen and stored for subsequent mea-surements of potential. Storing specimens at low temperature is unavoid-able if one has to manage a large number of samples. In this case, the SFDmethod gives obviously more reliable values for in situ osmotic potentialsthan the conventional disc method.
Compared to the press-sap method, the SFD method is superior, sinceseveral water relations parameters can be measured on the same sample.These parameters are water content (C), relative water content (R), in situosmotic potential {To (in situ)) and osmotic potential at full saturation {Wo(sat)).
A prerequisite for correct Wo (in situ) - measurements with the SFDmethod is the exact determination of the initial fresh weight, which shouldbe done either directly in the field or immediately after sample transport tothe laboratory. It is also possible to store spruce logs under low tempera-ture and high humidity, and take the disc samples within the followingdays. For plant material harvested in late summer, our results showed thatup to the fourth day of storage no changes in water status occurred(Table 3). Thus, we consider short term storage of logs acceptable, espe-cially when a large number of samples has to be handled.
Osmotic potential at full saturation permits comparisons of the con-tent of osmotically active solutes within the tree or between different treesat the same relative water content. Saturation times suggested by SLAVIK1974 for leaf discs (more than 8 h) turned out to be far too long for secon-dary phloem discs. Oversaturation of samples may result in excess wateruptake into the apoplast, including the interfibrillar spaces of the cellwall, conduits and intercellular spaces, and in a loss of symplastic solutes.Therefore, the shortest resaturation period sufficient to bring tissues toa *Fo level corresponding to full hydration in the field should be used(PARKER & PALLARDY 1987, ABRAMS 1988, KUBISKE & ABRAMS 1991). Forsecondary phloem discs, 5 to 10 min of saturation were sufficient to reachfull turgor. As our experiments show, oversaturation resulting in excessapoplastic water or leakage of solutes from the sieve cells did not occurduring this short rehydration period: Non-saturated, frozen discs had, atequal water contents, similar osmotic potentials as SFD discs (Figures 3and 4). If any leakage from the sieve cells happened during saturation,SFD discs would have less negative Wo values compared to non-saturatedfrozen discs. In addition, data obtained with the conventional disc methodalso fit perfectly in the regression between osmotic potential and 1/C of
©Verlag Ferdinand Berger & Söhne Ges.m.b.H., Horn, Austria, download unter www.biologiezentrum.at

95
SFD method data (Figure 4). This indicates that 'plateau effects', such asobserved in pV-curve studies (LADIGES 1975, PARKER & PALLARDY 1987,KUBISKE & ABRAMS 1990, ABRAMS & KUBISKE 1994, PARKER & COLOMBO
1995, 1996,), did not occur with the SFD method. Compared to the pV-procedure, the osmotic potential at full saturation can be determined di-rectly and the values need not be corrected (e.g. with the correlation be-tween fresh weight and total water potential).
Another advantage of the short saturation time is that errors in themeasurement of Wo (sat) or R in situ caused by respirative losses of carbo-hydrates can be avoided.
Due to the very close correlation between osmotic potential and watercontent or relative water content, when using the SFD method, it is possi-ble to calculate values of osmotic potential at any pre-set C or R.
In conclusion, with the SFD method for the measurement of osmoticpotential on secondary phloem discs, several different water status para-meters can be measured on the same sample and probably more reliablevalues are given compared to the conventional disc method.
Acknowledgments
This work was supported by Project P 10485-Bio and the Special ResearchProgram Forest Ecosystem Restoration (SF008), funded by the Austrian ScienceFoundation and the Austrian Ministry of Agriculture and Forestry.
Experiments were done at the Institute of Forest Entomology, Forest Pathology,and Forest Protection, University of Agricultural Sciences, 1190 Vienna. The authorsthank Hanno RICHTER for critical comments on the manuscript and Birgit KARTUSCHfor expert advice concerning plant anatomy. Thanks are due to Erwin FÜHRER andPeter BAIER (Institute of Forest Entomology, Forest Pathology, and Forest Protection)for project coordination and helpful discussions.
References
ABRAMS M. D. 1988. Sources of variations on osmotic potentials with special re-ference to North American tree species. - For. Sei. 34: 1030-1046.
— & KUBISKE M. E. 1994. Synchronous changes in tissue water parameters ofmature foliage from well-watered and periodically droughted tree seedlings. -J. Exp. Bot. 45: 171-177.
BÄUCKER E. BUES C.-T. & VOGEL M. 1998. Radial growth dynamics of spruce (Piceaabies) measured by micro-cores. - IAWA Journal 19: 301-309.
BENNETT J. M. 1990. Problems associated with measuring plant water status. -HortScience 25: 1551-1554.
BRYANT J. P. & RAFFA K. F. 1995. Chemical antiherbivore defense. - In: GARTNER B. L.
(Eds.), Plant stems: Physiology and functional morphology, pp. 365-381. -Academic Press. San Diego, New York, Boston, London, Sydney, Tokyo,Toronto.
©Verlag Ferdinand Berger & Söhne Ges.m.b.H., Horn, Austria, download unter www.biologiezentrum.at

96
CHRISTIANSEN E. WARING R. H. & BERRYMAN A. A. 1987. Resistance of conifers to barkbeetle attack: searching for general relationships. - For. Ecol. and Manage. 22:89-106.
CLANCY K. M. WAGNER M. R. & REICH P. B. 1995. Ecophysiology and insect herbivory. -In: SMITH W. K., HINCKLEY T. M. (Eds.), Resource physiology of conifers,acquisition, allocation, and utilisation, pp. 125-180. - Academic Press, SanDiego, NY, Boston, London, Sydney, Tokyo, Toronto.
DIXON H. H. & ATKINS W. R. G. 1910. On osmotic pressure in plants and on a thermo-electric method for determining freezing points. - Scientific Proceedings of theRoyal Dublin Society (New Series) 12: 275-311.
DÜNISCH O. BAUCH J. PULS J. & MÜLLER M. 1996. Biological and chemical woodproperties of long-term polluted spruce (Picea abies (L.) Karst.) at high-alti-tude stands of the Erzgebirge. - Holzforschung 50: 497-506.
ESAU K. 1969. The Phloem. - In: ZIMMERMANN W. OZENDA P. WULFF H. D. (Eds),
Handbuch der Pflanzenanatomie. - Gebrüder Borntraeger, Berlin, Stuttgart.FRANCESCHI V. R. KREKLING T. BERRYMAN A. A. & CHRISTIANSEN E. 1998. Specialized
phloem parenchyma cells in Norway spruce (Pinaceae) bark are an importantsite of defense reactions. - Am. J. Bot. 85: 601-615.
HOLDHEIDE W. 1951. Anatomie mitteleuropäischer Gehölzrinden (mit mikrophoto-graphischem Atlas). - In: Handbuch der Mikroskopie in der Technik, Bd. 5Teil 1, pp. 193-314. - Umschau Verlag, Frankfurt.
KAUFMANN M. R. & KRAMER P. J. 1967. Phloem water relations and translocation. -Plant Physiol. 42: 191-194.
KIKUTA S. B. & RICHTER H. 1992. Leaf discs or press saps? A comparison of techniquesfor the determination of osmotic potentials in freeze-thawed leaf material. -J. Exp. Bot. 43: 1039-1044. ,*
KRAEMER G. D. 1953. Die kritischen Grenzen der Brutbaumdisposition für Borken-käfer an Fichte (Picea excelsa L.). - Z. Angew. Entomol. 34: 463-512.
KUBISKE M. E. & ABRAMS M. D. 1990. Pressure-volume relationships in non-rehy-drated tissue at various water deficits. - Plant, Cell Env. 13: 995-1000.
— & 1991. Seasonal, diurnal and rehydration-induced variation of pressure-volume relationships in Pseudotsuga menziesii. - Physiol. Plant. 83: 107-116.
LADIGES P. Y. 1975. Some aspects of tissue water relations in three populations ofEucalyptus viminalis Labill. - New Phytol. 75: 53-62.
LANG A. R. G. 1967. Osmotic coefficients and water potentials of sodium chloridesolutions from 0 to 40 °C. - Aust. J. Chem. 20: 2017-2023.
LEWINSOHN E. GIJZEN M. MUZIKA R. M. BARTON K. & CROTEAU R. 1993. Oleoresinosis
in grand fir (Abies grandis) saplings and mature trees. Modulation of thiswound response by light and water stress. - Plant Physiol. 101: 1021-1028.
LITVAY J. D. & MCKIMMY M. D. 1975. Determining moisture content and moisturesorption in douglas-fir bark. - Wood Science 7: 284-291.
MERKER E. 1956. Der Widerstand von Fichten gegen Borkenkäferfraß. - Allg. Forst-u. Jagdztg. 127: 129-45; 165-87.
MÜNCH E. 1930. Die Stoffbewegung in der Pflanze. - Jena, Gustav Fischer.PAINE T. D. RAFFA K. F. & HARRINGTON T. C. 1997. Interactions among scolytid bark
beetles, their associated fungi, and live host conifers. - Ann. Rev. Ent. 42:179-206.
©Verlag Ferdinand Berger & Söhne Ges.m.b.H., Horn, Austria, download unter www.biologiezentrum.at

97
PARKER W. C. & PALLARDY S. G. 1987. The influence of resaturation method and tissuetype on pressure-volume analyses of Quercus alba L. seedlings. - J. Exp. Bot.38: 535-549.
— & COLOMBO S. J. 1995. A critical re-examination of pressure-volume analysisof conifer shoots: Comparison of three procedures for generating PV curves onshoots of Pinus resinosa Ait. seedlings. - J. Exp. Bot. 46: 1701-1709.
— & 1996. Cut-shoot vs root rehydration: Effects on pressure-volume analysis ofshoots and fascicles of Pinus resinosa seedlings. - Physiol. Plant. 97: 651-658.
ROSNER S. 1998. Vergleichende Untersuchungen der Anatomie und des Wasser-haushaltes der Rinde von Fichte (Picea abies (L.) Karst.). Doctoral Thesis,University of Agricultural Sciences, Vienna.
— , BAIER P. & KIKUTA S. B. 2001 Osmotic potential in secondary phloem of Nor-way spruce {Picea abies (L.) Karst.) in relation to anatomy. - Trees 15: 472-482.
SLAVIK B. 1974. Water content, water saturation deficit (relative water content). - In:JACOBS J., LANGE O., OLSON J. S., WIESER W. (Eds.), Methods of studying plantwater relations, pp. 136-156. - Academia, Prague, Springer, Berlin, Heidel-berg, New York.
SPANNER D. C. 1951. The Peltier effect and its use in the measurement of suctionpressure. - J. Exp. Bot. 11: 145-168.
TROCKENBRODT M. 1990. Survey and discussion of the terminology used in bark ana-tomy. - IAWA Bulletin n.s. 11: 141-166.
TYREE M. T. & RICHTER H. 1981. Alternative methods of analysing water potentialisotherms: Some cautions and clarifications. I. The impact of non-ideality andof some experimental errors. - J. Exp. Bot. 32: 643-653.
— & 1982. Alternate methods of analysing water potential isotherms: Some cau-tions and clarifications. II. Curvilinearity in water potential isotherms. - Can.J. Bot. 60: 911-916.
WALKER S., OOSTERHUIS D. M. & WIEBE H. H. 1984. Ratio of cut surface area to leafsample volume for water potential measurements by thermocouple psychro-meters. - Plant Physiol. 75: 228-230.
©Verlag Ferdinand Berger & Söhne Ges.m.b.H., Horn, Austria, download unter www.biologiezentrum.at