verification of the srnwp-peps - ecmwf · verification methods workshop 2007 1 verification of the...
TRANSCRIPT
1Verification Methods Workshop 2007
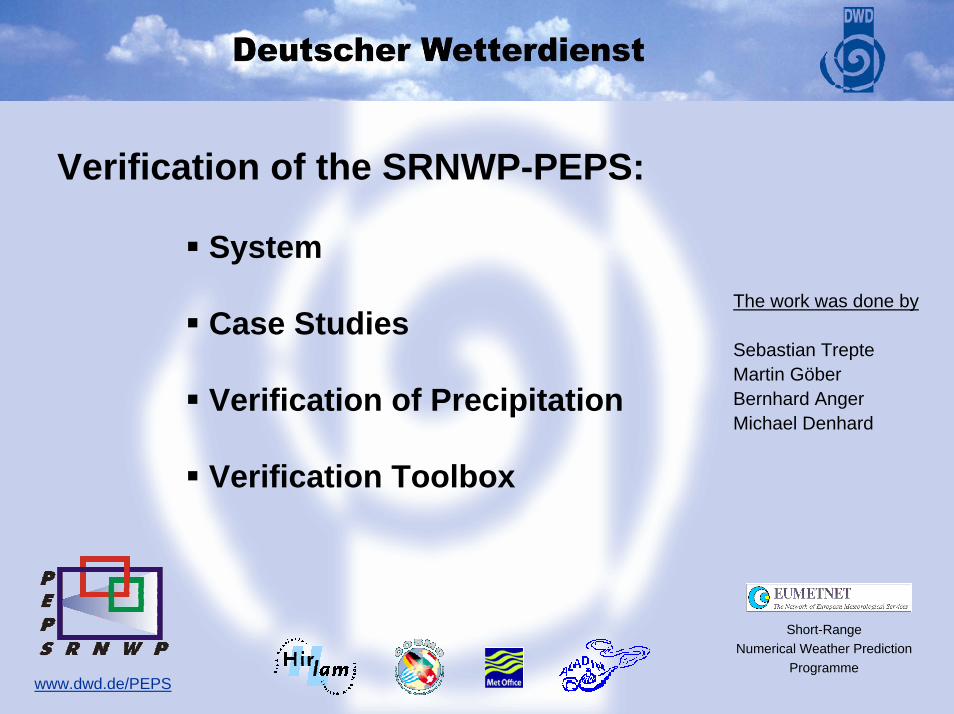
Verification of the SRNWP-PEPS:
www.dwd.de/PEPS
Short-RangeNumerical Weather Prediction
Programme
The work was done by
Sebastian TrepteMartin GöberBernhard AngerMichael Denhard
System
Case Studies
Verification of Precipitation
Verification Toolbox
2Verification Methods Workshop 2007
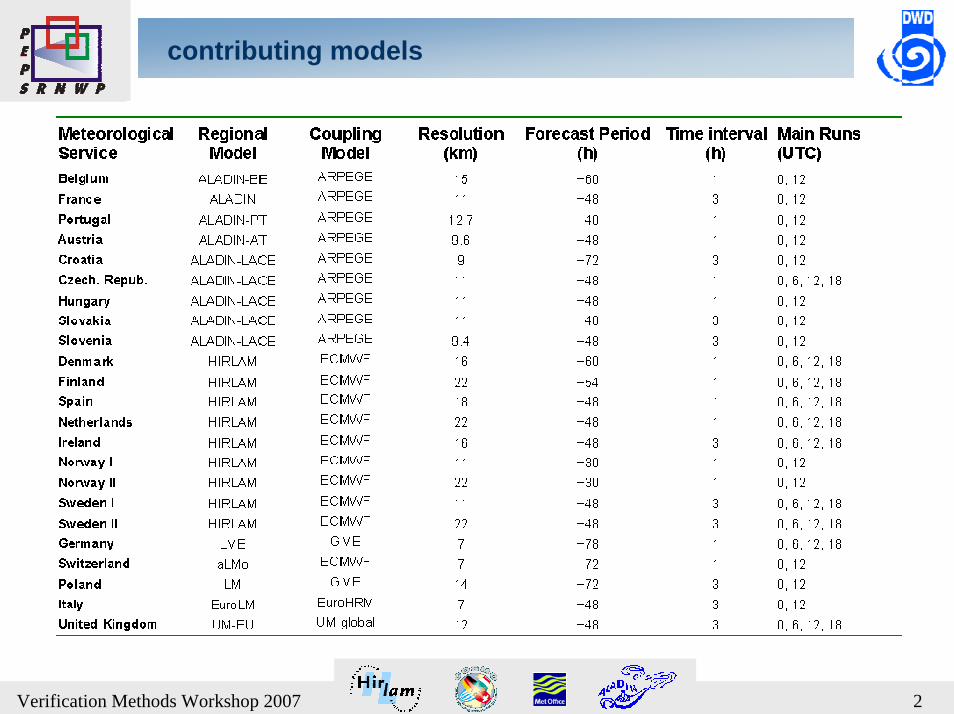
contributing models
3Verification Methods Workshop 2007
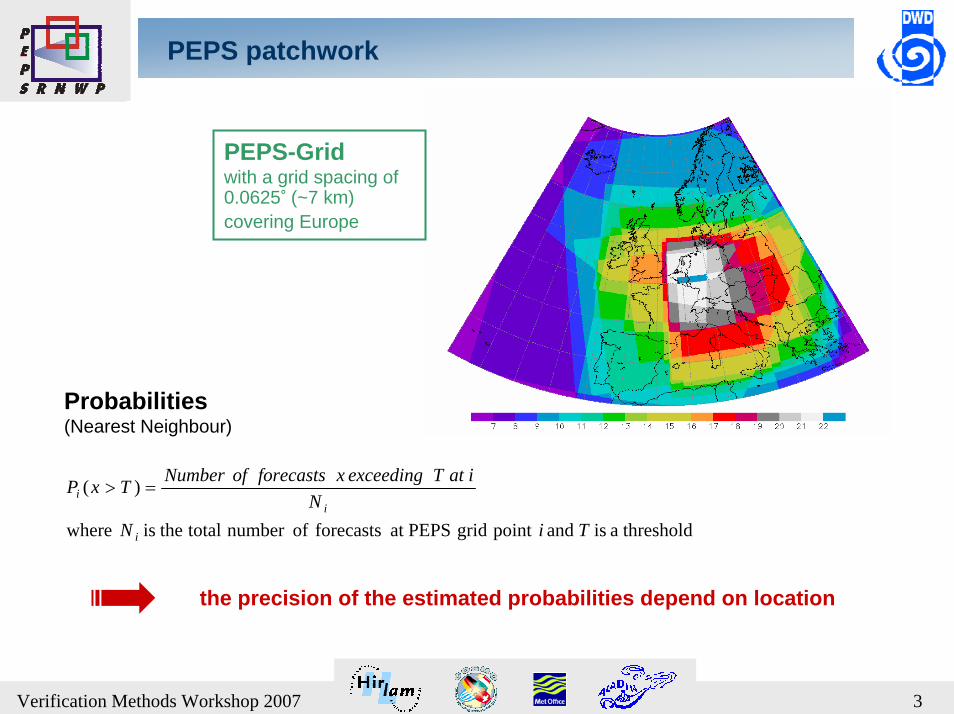
PEPS patchwork
PEPS-Gridwith a grid spacing of 0.0625° (~7 km) covering Europe
thresholdaisandpointgridPEPSatforecastsofnumbertotaltheiswhere
)(
TiNN
iatTexceedingxforecastsofNumberTxP
i
ii =>
Probabilities(Nearest Neighbour)
the precision of the estimated probabilities depend on location
4Verification Methods Workshop 2007
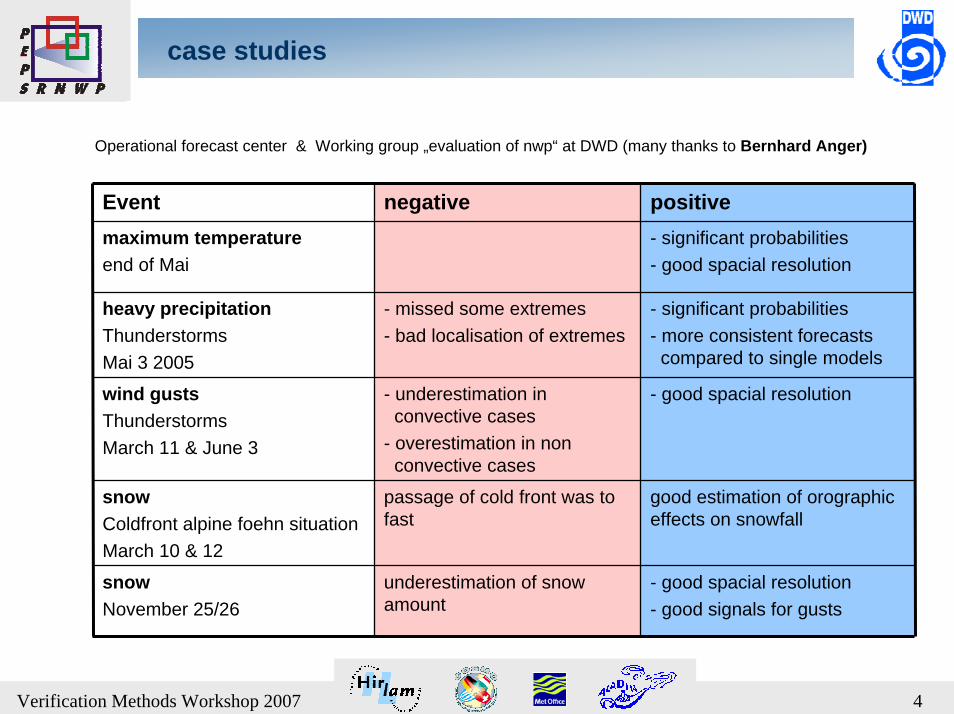
case studies
Operational forecast center & Working group „evaluation of nwp“ at DWD (many thanks to Bernhard Anger)
- good spacial resolution- good signals for gusts
underestimation of snow amount
snowNovember 25/26
good estimation of orographic effects on snowfall
passage of cold front was to fast
snowColdfront alpine foehn situation March 10 & 12
- good spacial resolution- underestimation in convective cases
- overestimation in non convective cases
wind gustsThunderstorms March 11 & June 3
- significant probabilities- more consistent forecasts
compared to single models
- missed some extremes- bad localisation of extremes
heavy precipitationThunderstorms Mai 3 2005
- significant probabilities- good spacial resolution
maximum temperatureend of Mai
positivenegativeEvent
5Verification Methods Workshop 2007
case studies
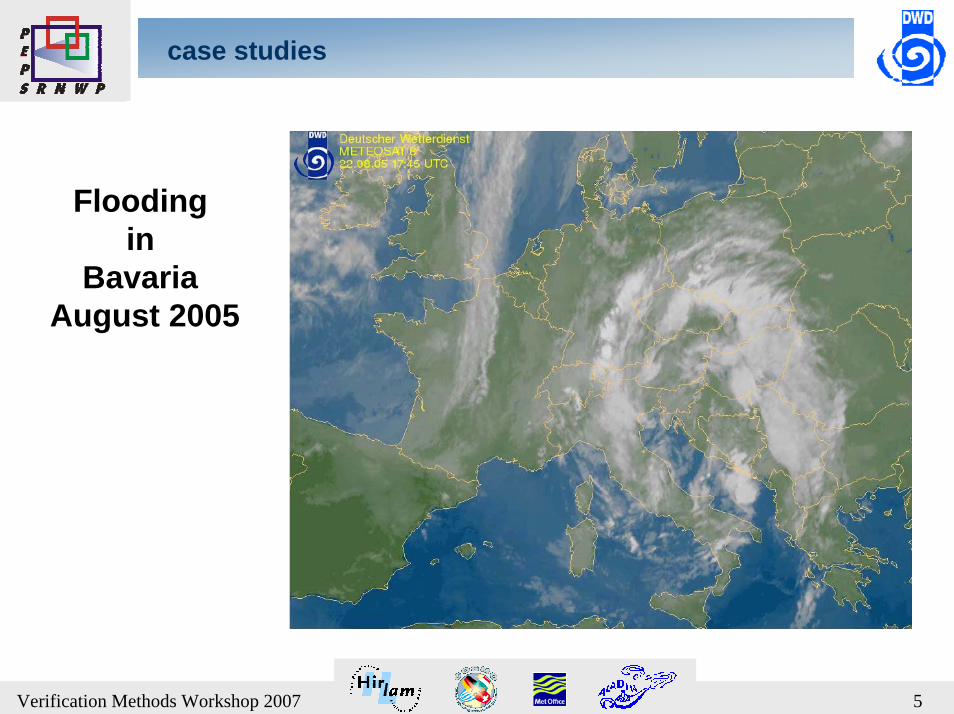
Flooding in
Bavaria August 2005
6Verification Methods Workshop 2007
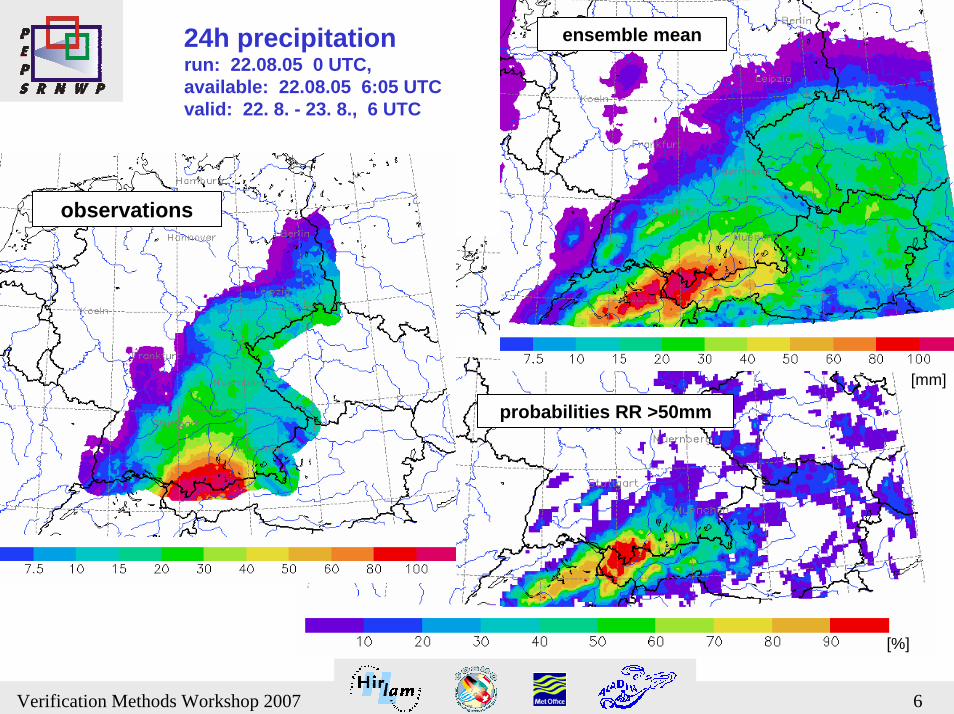
24h precipitationrun: 22.08.05 0 UTC, available: 22.08.05 6:05 UTCvalid: 22. 8. - 23. 8., 6 UTC
[%]
ensemble mean
observations
probabilities RR >50mm
[mm]

7Verification Methods Workshop 2007
verification
Element: 24h total precipitation (RR24) 06...06 UTC
Area: Germany
Observations:� synop (214)� AMDAIII precipitation (650)
Event: RR24 > 20 mm
Time Period: April to September 2005
8Verification Methods Workshop 2007
probabilistic verification
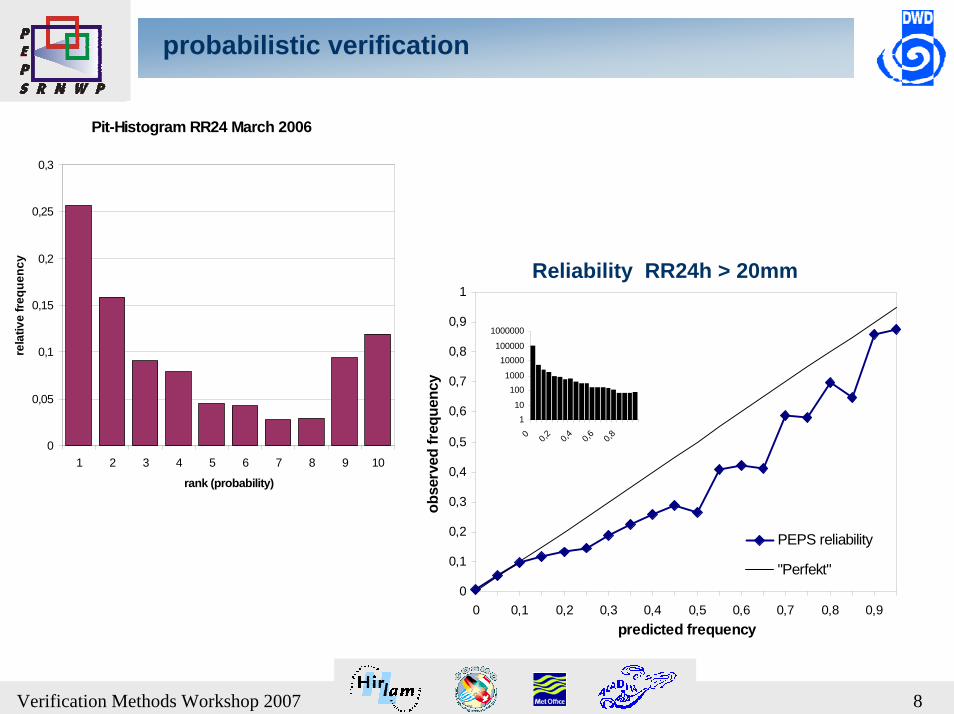
Pit-Histogram RR24 March 2006
0
0,05
0,1
0,15
0,2
0,25
0,3
1 2 3 4 5 6 7 8 9 10
rank (probability)
rela
tive
frequ
ency
0
0,1
0,2
0,3
0,4
0,5
0,6
0,7
0,8
0,9
1
0 0,1 0,2 0,3 0,4 0,5 0,6 0,7 0,8 0,9predicted frequency
obse
rved
freq
uenc
y
PEPS reliability
"Perfekt"
110
1001000
10000100000
1000000
0 0,2 0,4 0,6 0,8
Reliability RR24h > 20mm
28.01.07
probabilistic verification
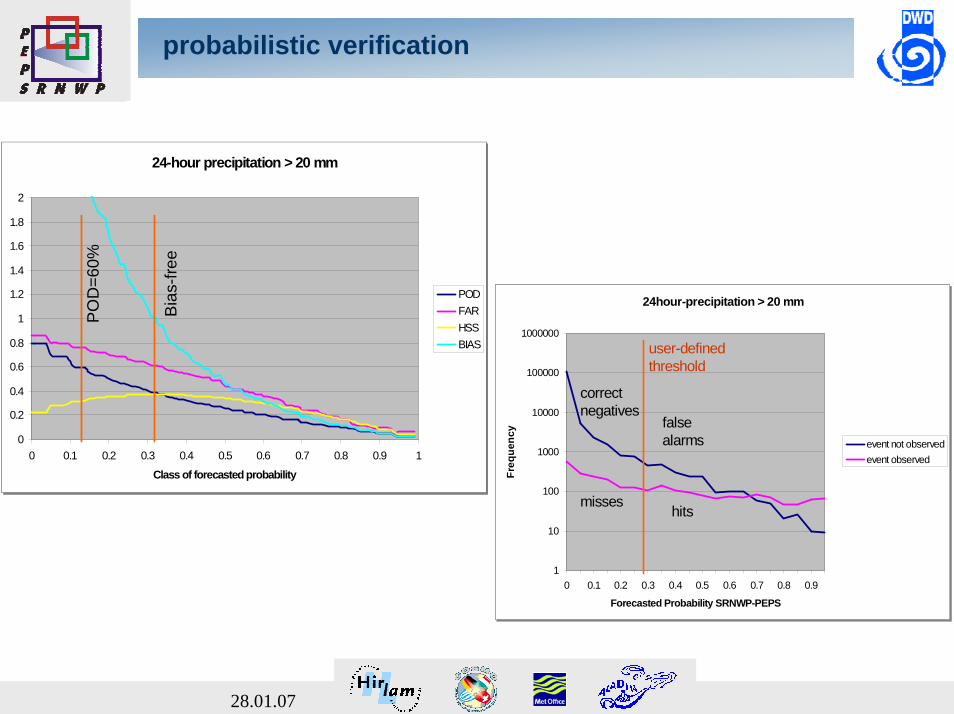
24-hour precipitation > 20 mm
0
0.2
0.4
0.6
0.8
1
1.2
1.4
1.6
1.8
2
0 0.1 0.2 0.3 0.4 0.5 0.6 0.7 0.8 0.9 1
Class of forecasted probability
PODFARHSSBIAS
24-hour precipitation > 20 mm
0
0.2
0.4
0.6
0.8
1
1.2
1.4
1.6
1.8
2
0 0.1 0.2 0.3 0.4 0.5 0.6 0.7 0.8 0.9 1
Class of forecasted probability
PODFARHSSBIAS
PO
D=6
0%
Bia
s-fre
e24-hour precipitation > 20 mm
0
0.2
0.4
0.6
0.8
1
1.2
1.4
1.6
1.8
2
0 0.1 0.2 0.3 0.4 0.5 0.6 0.7 0.8 0.9 1
Class of forecasted probability
PODFARHSSBIAS
24-hour precipitation > 20 mm
0
0.2
0.4
0.6
0.8
1
1.2
1.4
1.6
1.8
2
0 0.1 0.2 0.3 0.4 0.5 0.6 0.7 0.8 0.9 1
Class of forecasted probability
PODFARHSSBIAS
PO
D=6
0%
Bia
s-fre
e
24hour-precipitation > 20 mm
1
10
100
1000
10000
100000
1000000
0 0.1 0.2 0.3 0.4 0.5 0.6 0.7 0.8 0.9
Forecasted Probability SRNWP-PEPS
Freq
uenc
y
event not observedevent observed
24hour-precipitation > 20 mm
1
10
100
1000
10000
100000
1000000
0 0.1 0.2 0.3 0.4 0.5 0.6 0.7 0.8 0.9
Forecasted Probability SRNWP-PEPS
Freq
uenc
y
event not observedevent observed
correctnegatives
falsealarms
misseshits
user-definedthreshold
24hour-precipitation > 20 mm
1
10
100
1000
10000
100000
1000000
0 0.1 0.2 0.3 0.4 0.5 0.6 0.7 0.8 0.9
Forecasted Probability SRNWP-PEPS
Freq
uenc
y
event not observedevent observed
24hour-precipitation > 20 mm
1
10
100
1000
10000
100000
1000000
0 0.1 0.2 0.3 0.4 0.5 0.6 0.7 0.8 0.9
Forecasted Probability SRNWP-PEPS
Freq
uenc
y
event not observedevent observed
correctnegatives
falsealarms
misseshits
user-definedthreshold

10Verification Methods Workshop 2007
deterministic verification
Measured value LM
PEPS-median
Bias-free at 22 mm 15 mmPOD 29 39FAR 72 63HSS 27 37
Measured value LM
PEPS-median
POD=60% at 9 mm 10 mmBIAS 4 2.5FAR 85 76HSS 22 33
Observed precipitation > 20 mm
0.0
0.2
0.4
0.6
0.8
1.0
1.2
1.4
1.6
0 2 4 6 8 10 12 14 16 18 20 22 24 26 28 30 32 34 36 38 40 42 44 46 48 50 52 54 56 58
LM forecast (mm)
PODFARHSSBIAS
Observed precipitation > 20 mm
0.0
0.2
0.4
0.6
0.8
1.0
1.2
1.4
1.6
0 2 4 6 8 10 12 14 16 18 20 22 24 26 28 30 32 34 36 38 40 42 44 46 48 50 52 54 56 58
LM forecast (mm)
PODFARHSSBIAS
LMLMObserved precipitation > 20 mm
0.0
0.2
0.4
0.6
0.8
1.0
1.2
1.4
1.6
0 2 4 6 8 10 12 14 16 18 20 22 24 26 28 30 32 34 36 38 40 42 44 46 48 50 52 54 56 58
SRNWP-PEPS median forecast (mm)
PODFARHSSBIAS
Observed precipitation > 20 mm
0.0
0.2
0.4
0.6
0.8
1.0
1.2
1.4
1.6
0 2 4 6 8 10 12 14 16 18 20 22 24 26 28 30 32 34 36 38 40 42 44 46 48 50 52 54 56 58
SRNWP-PEPS median forecast (mm)
PODFARHSSBIAS
SRNWP-PEPSSRNWP-PEPS
Measured value LM
PEPS-median
Bias-free at 22 mm 15 mmPOD 29 39FAR 72 63HSS 27 37
Measured value LM
PEPS-median
POD=60% at 9 mm 10 mmBIAS 4 2.5FAR 85 76HSS 22 33
Observed precipitation > 20 mm
0.0
0.2
0.4
0.6
0.8
1.0
1.2
1.4
1.6
0 2 4 6 8 10 12 14 16 18 20 22 24 26 28 30 32 34 36 38 40 42 44 46 48 50 52 54 56 58
LM forecast (mm)
PODFARHSSBIAS
Observed precipitation > 20 mm
0.0
0.2
0.4
0.6
0.8
1.0
1.2
1.4
1.6
0 2 4 6 8 10 12 14 16 18 20 22 24 26 28 30 32 34 36 38 40 42 44 46 48 50 52 54 56 58
LM forecast (mm)
PODFARHSSBIAS
LMLMObserved precipitation > 20 mm
0.0
0.2
0.4
0.6
0.8
1.0
1.2
1.4
1.6
0 2 4 6 8 10 12 14 16 18 20 22 24 26 28 30 32 34 36 38 40 42 44 46 48 50 52 54 56 58
LM forecast (mm)
PODFARHSSBIAS
Observed precipitation > 20 mm
0.0
0.2
0.4
0.6
0.8
1.0
1.2
1.4
1.6
0 2 4 6 8 10 12 14 16 18 20 22 24 26 28 30 32 34 36 38 40 42 44 46 48 50 52 54 56 58
LM forecast (mm)
PODFARHSSBIAS
LMLMObserved precipitation > 20 mm
0.0
0.2
0.4
0.6
0.8
1.0
1.2
1.4
1.6
0 2 4 6 8 10 12 14 16 18 20 22 24 26 28 30 32 34 36 38 40 42 44 46 48 50 52 54 56 58
SRNWP-PEPS median forecast (mm)
PODFARHSSBIAS
Observed precipitation > 20 mm
0.0
0.2
0.4
0.6
0.8
1.0
1.2
1.4
1.6
0 2 4 6 8 10 12 14 16 18 20 22 24 26 28 30 32 34 36 38 40 42 44 46 48 50 52 54 56 58
SRNWP-PEPS median forecast (mm)
PODFARHSSBIAS
SRNWP-PEPSSRNWP-PEPSObserved precipitation > 20 mm
0.0
0.2
0.4
0.6
0.8
1.0
1.2
1.4
1.6
0 2 4 6 8 10 12 14 16 18 20 22 24 26 28 30 32 34 36 38 40 42 44 46 48 50 52 54 56 58
SRNWP-PEPS median forecast (mm)
PODFARHSSBIAS
Observed precipitation > 20 mm
0.0
0.2
0.4
0.6
0.8
1.0
1.2
1.4
1.6
0 2 4 6 8 10 12 14 16 18 20 22 24 26 28 30 32 34 36 38 40 42 44 46 48 50 52 54 56 58
SRNWP-PEPS median forecast (mm)
PODFARHSSBIAS
SRNWP-PEPSSRNWP-PEPS
28.01.07
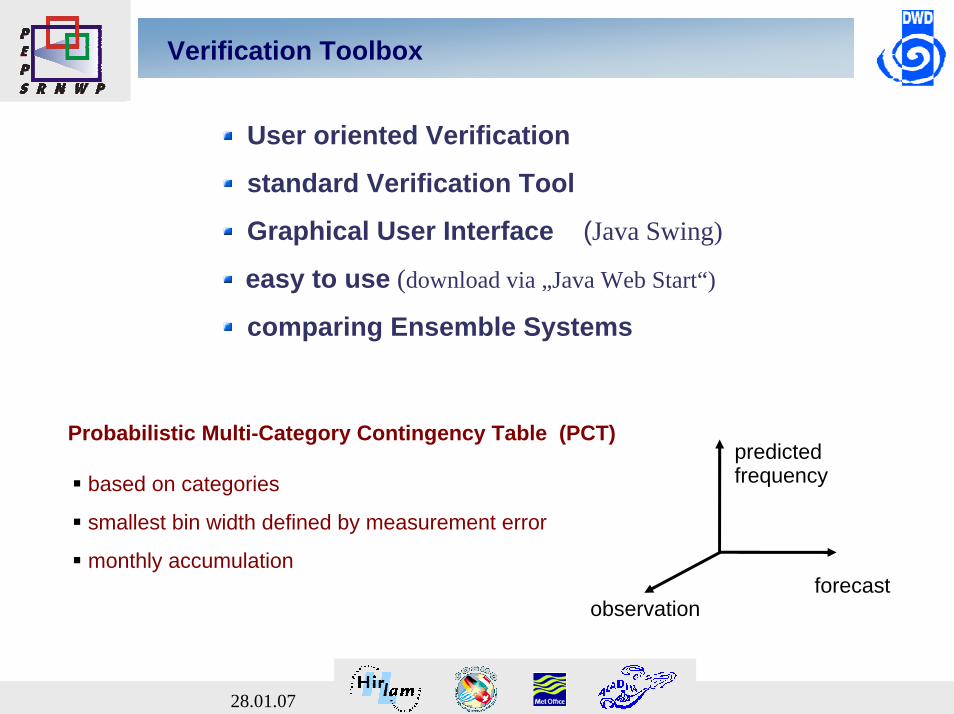
Verification Toolbox
User oriented Verification
standard Verification Tool
Graphical User Interface (Java Swing)
easy to use (download via „Java Web Start“)
comparing Ensemble Systems
forecastobservation
predicted frequency
Probabilistic Multi-Category Contingency Table (PCT)
based on categories
smallest bin width defined by measurement error
monthly accumulation
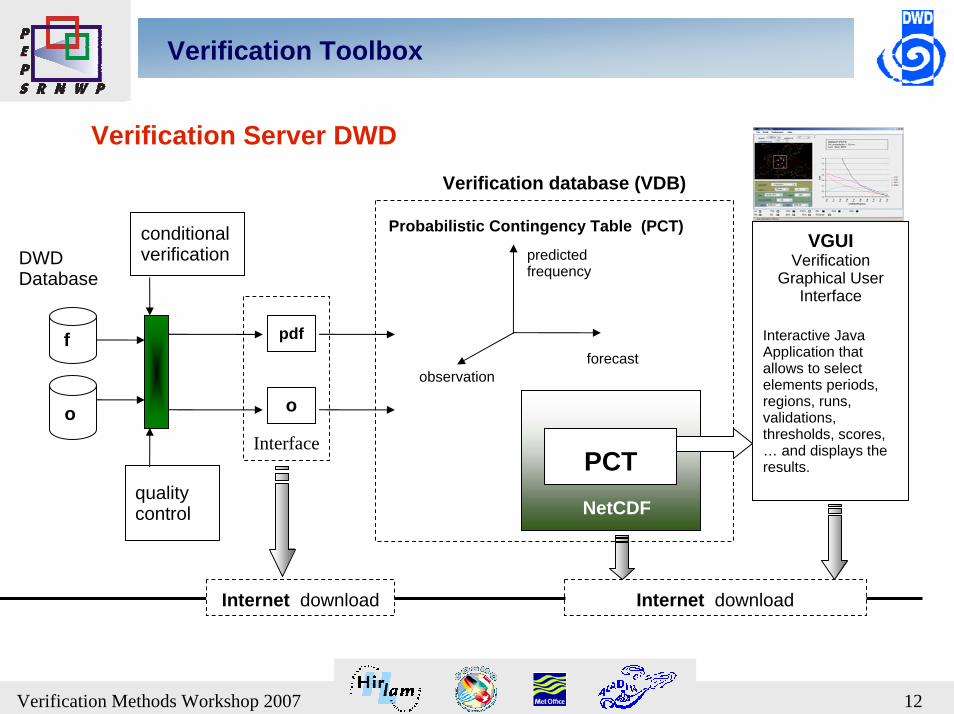
12Verification Methods Workshop 2007
o
f
DWDDatabase
o
quality control
conditionalverification
(VDB)
VGUIVerification
Graphical User Interface
Interactive Java Application that allows to select elements periods, regions, runs, validations, thresholds, scores, … and displays the results.
NetCDF
PCT
Verification Server DWD
Internet download
forecastobservation
predicted frequency
Verification database (VDB)
Probabilistic Contingency Table (PCT)
Internet download
Interface
Verification Toolbox
13Verification Methods Workshop 2007
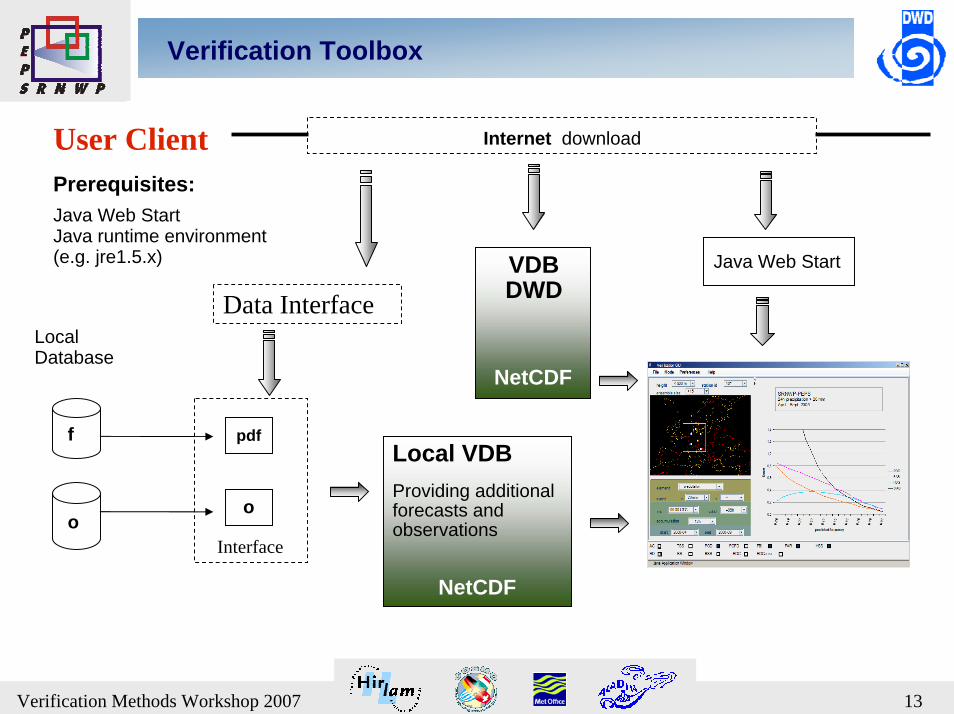
Verification Toolbox
o
f
LocalDatabase
Prerequisites:Java Web StartJava runtime environment (e.g. jre1.5.x) Java Web Start
NetCDF
NetCDF
Internet downloadUser Client
Local VDBProviding additional forecasts and observations
VDBDWD
o
Interface
Data Interface

14Verification Methods Workshop 2007
Verification Toolbox
Verification Graphical User Interface
area/station idheight
init/valid
element
event
accumulation
time period
score
15Verification Methods Workshop 2007
Time Schedule 2007
First version of Verification Tool Box ready end of May
Report on basic PEPS verification at SRNWP Ensemble meeting in November
Calibration with modified Bayesian Model Averaging (BMA)
Operational distribution of calibrated PEPS products in Spring
Thank you to the
contributingWeather Services !