ventilator graphics - lane community college media server · pdf fileventilator graphics ......
TRANSCRIPT

Ventilator Graphics
Chapter 10

Graphics
• Monitor the function of the ventilator • Evaluate the patient’s response to the ventilator • Help the clinician adjust the ventilator settings • Both scalar and loops
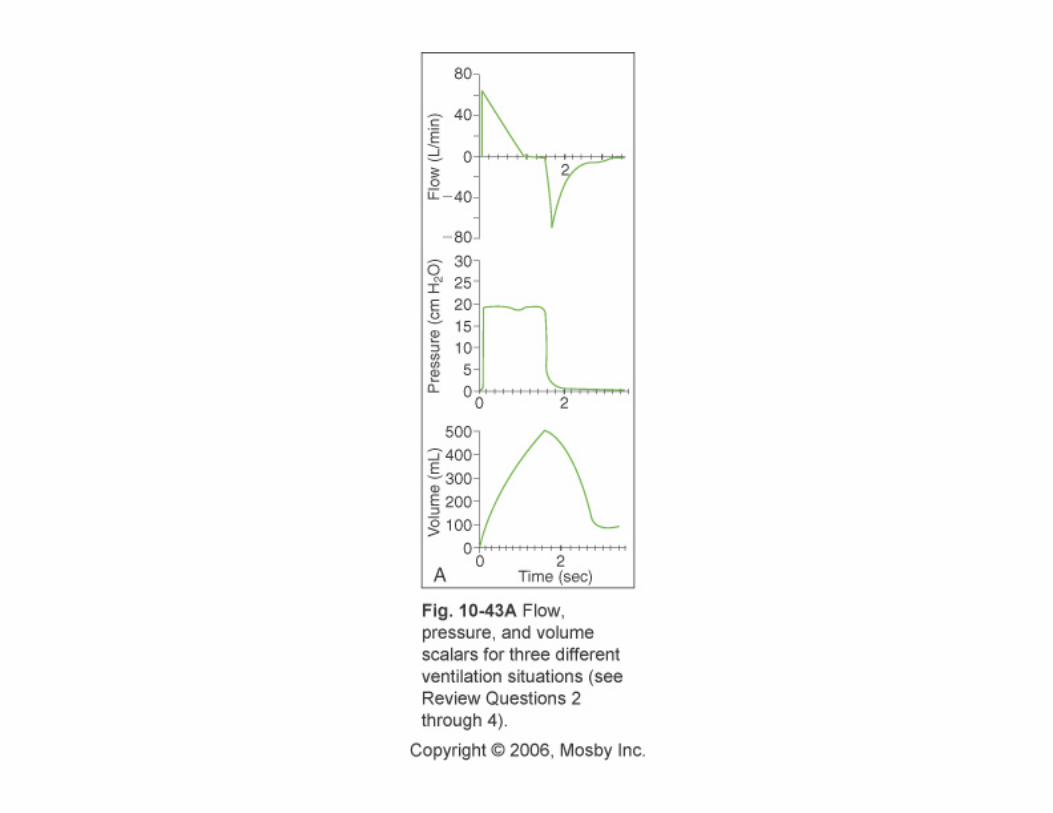
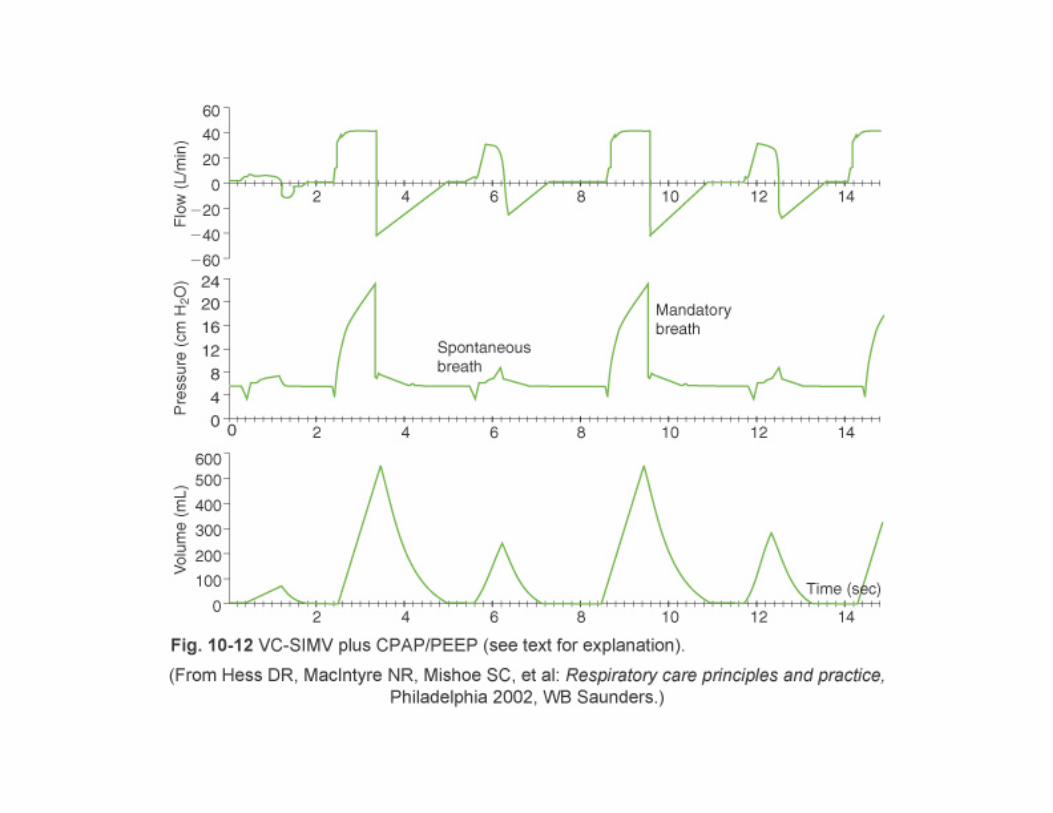
– Scalar: pressure volume and flow graphed against time
– Loops: two variable plotted on the X and Y axis, pressure vs volume and flow vs volume


Clinical Rounds 10-1, p. 182 A patient is volume ventilated at the following settings: PIP 24cmH2O; Pplat 17cmH2O; Vt 400ml; PEEP 5 cmH2O
1. What is the Pta? 2. What is the Cstat? 3. Flow is about 35L/min,
what is the Raw? 4. Is this Raw normal?
1. Pta=PIP-Pplat: 24-17=7cmH2O 2. Cstat=Vt/Pplat-PEEP: 400/17-5= 33.3ml/cmH2O 3. Raw=Pta/flow: 7/(35/60)=12cmH2O/L/s 4. The patient has increased Raw
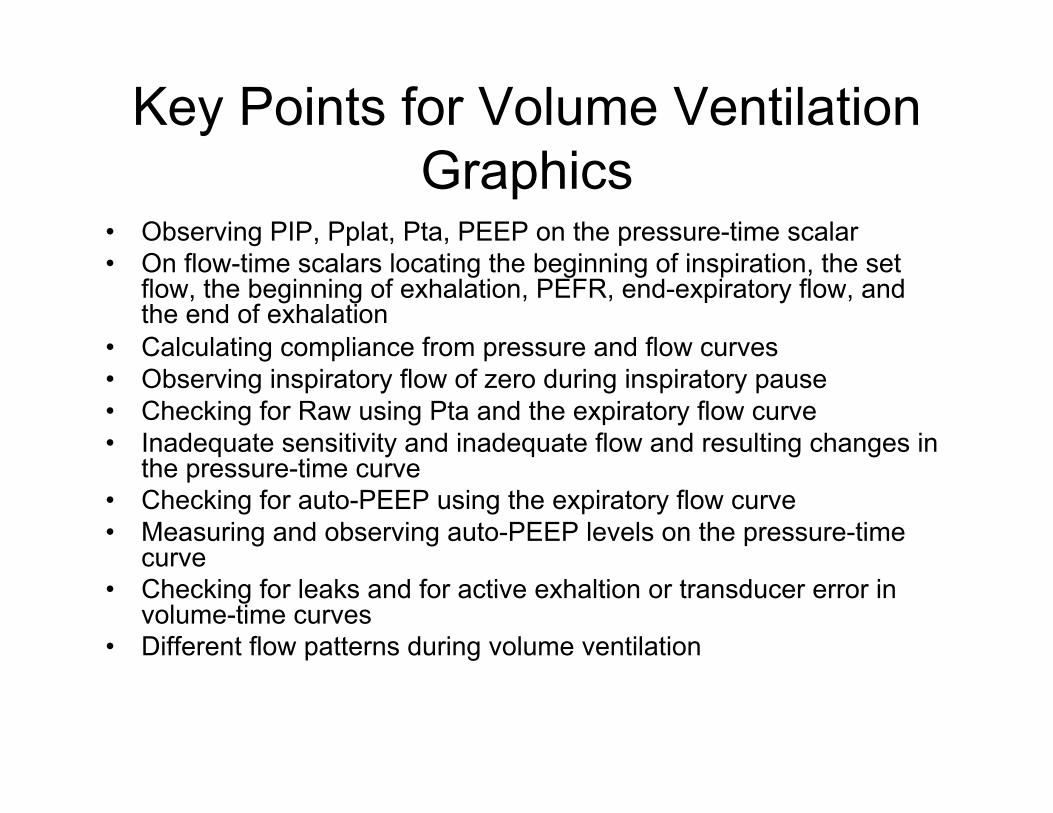
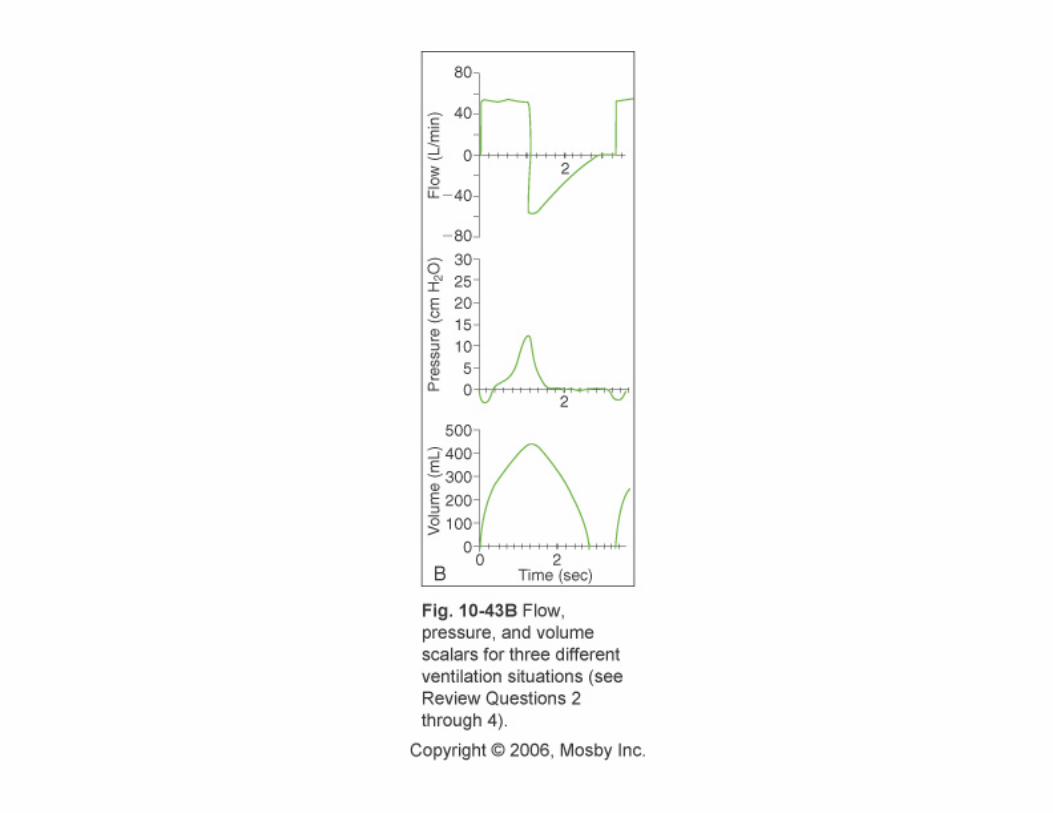
Key Points for Volume Ventilation Graphics
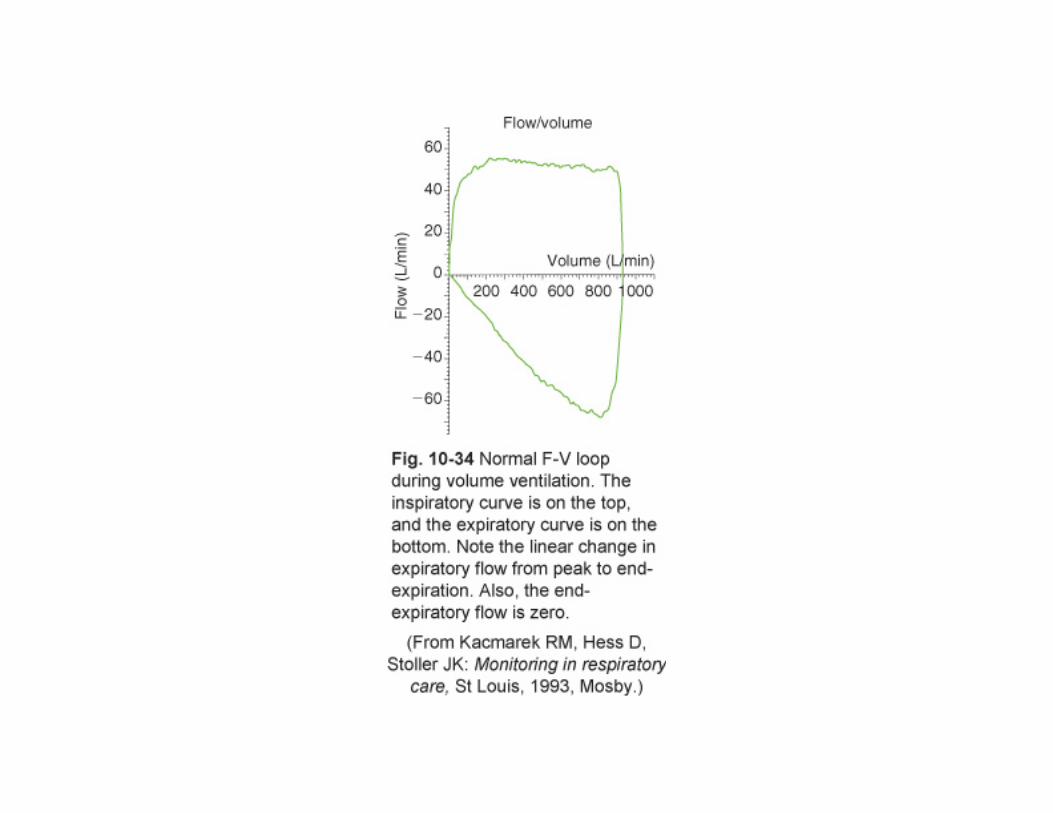
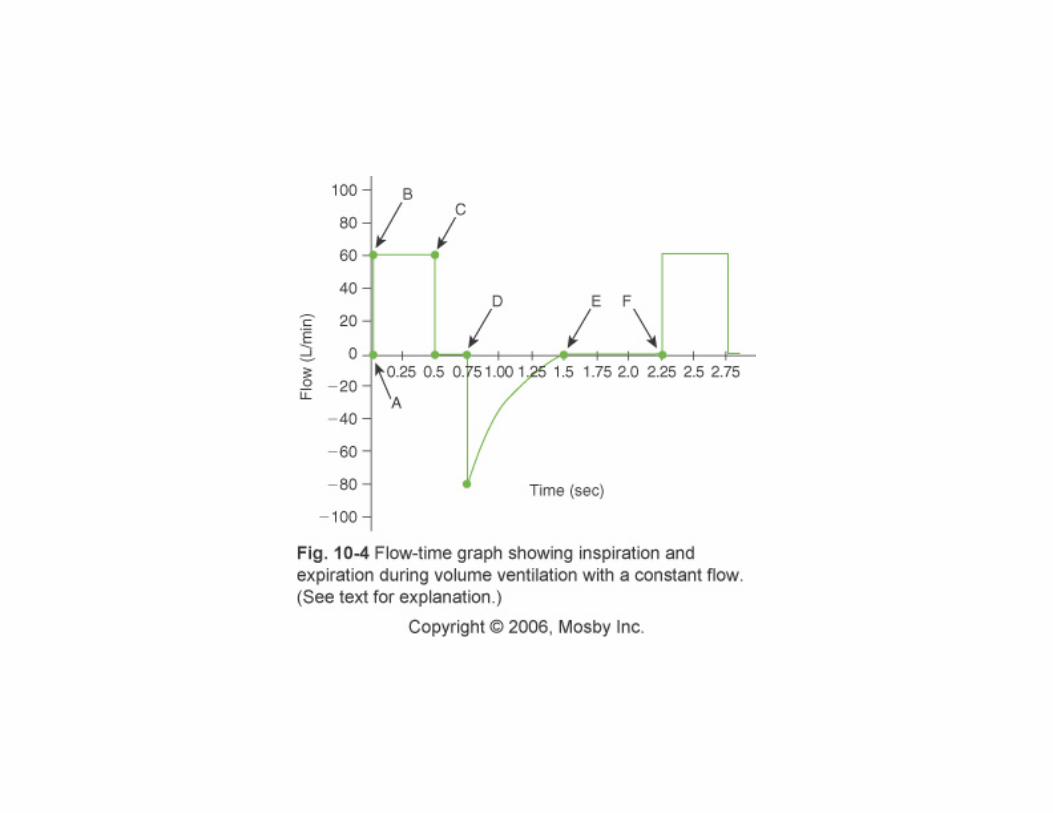
• Observing PIP, Pplat, Pta, PEEP on the pressure-time scalar • On flow-time scalars locating the beginning of inspiration, the set
flow, the beginning of exhalation, PEFR, end-expiratory flow, and the end of exhalation
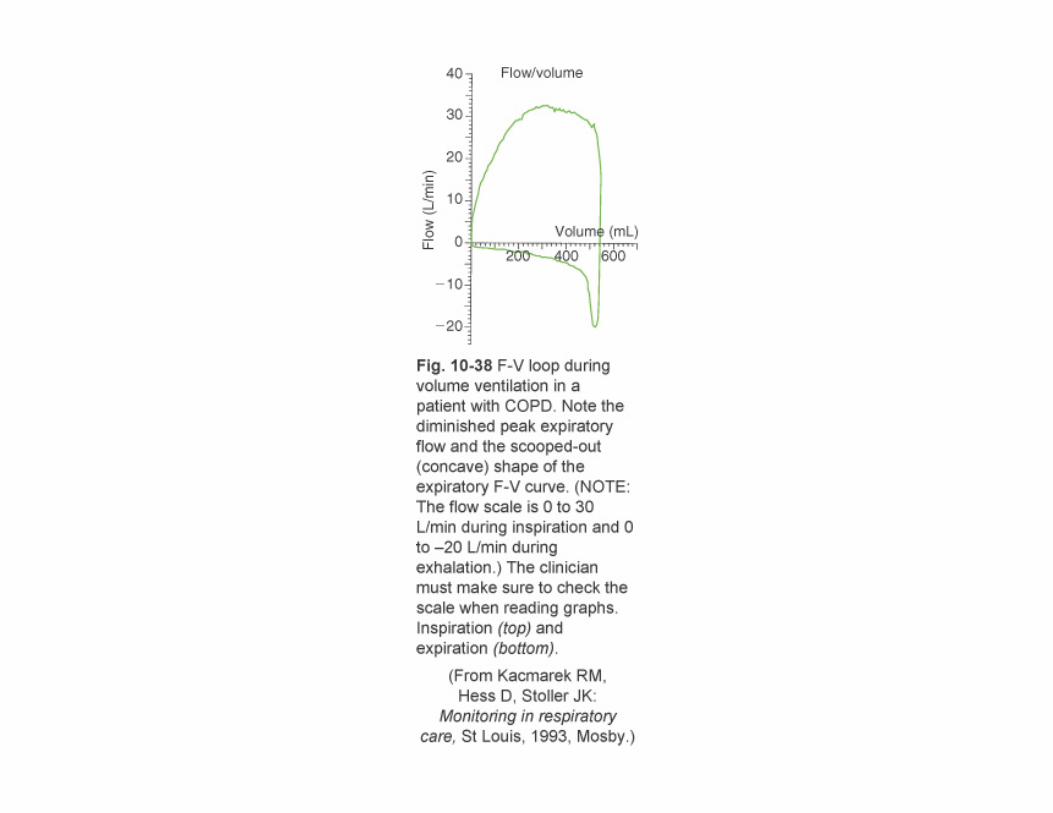
• Calculating compliance from pressure and flow curves • Observing inspiratory flow of zero during inspiratory pause • Checking for Raw using Pta and the expiratory flow curve • Inadequate sensitivity and inadequate flow and resulting changes in
the pressure-time curve • Checking for auto-PEEP using the expiratory flow curve • Measuring and observing auto-PEEP levels on the pressure-time
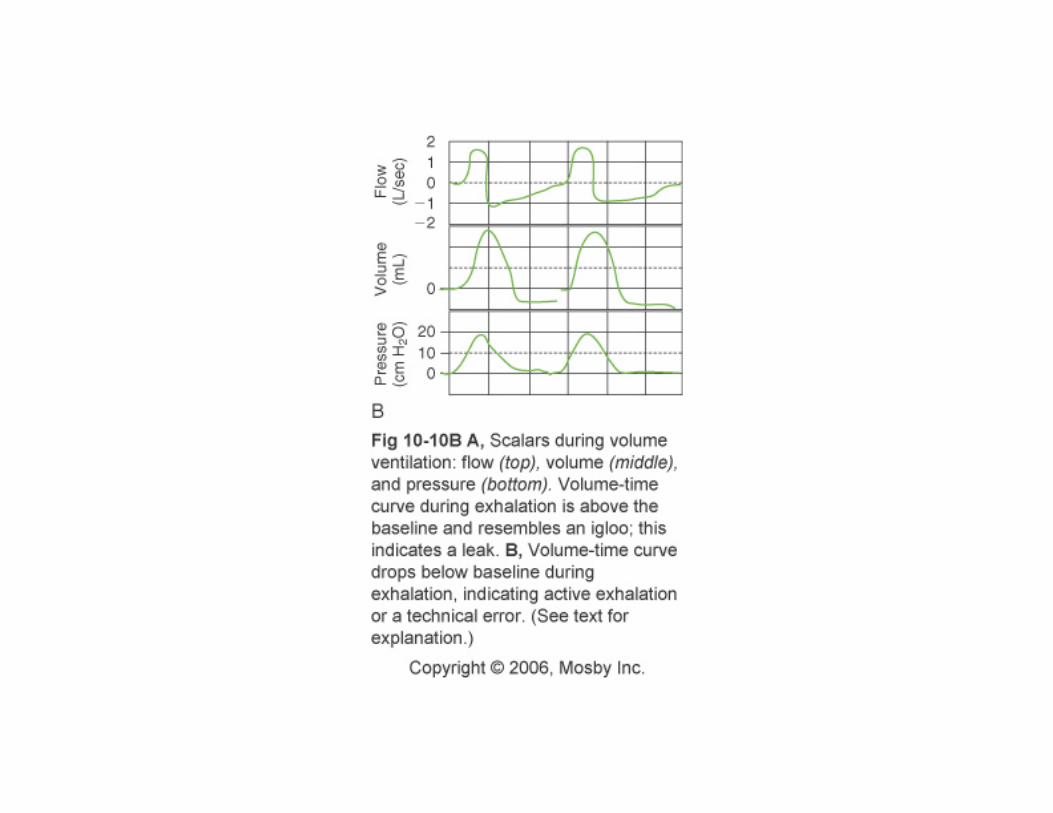
curve • Checking for leaks and for active exhaltion or transducer error in
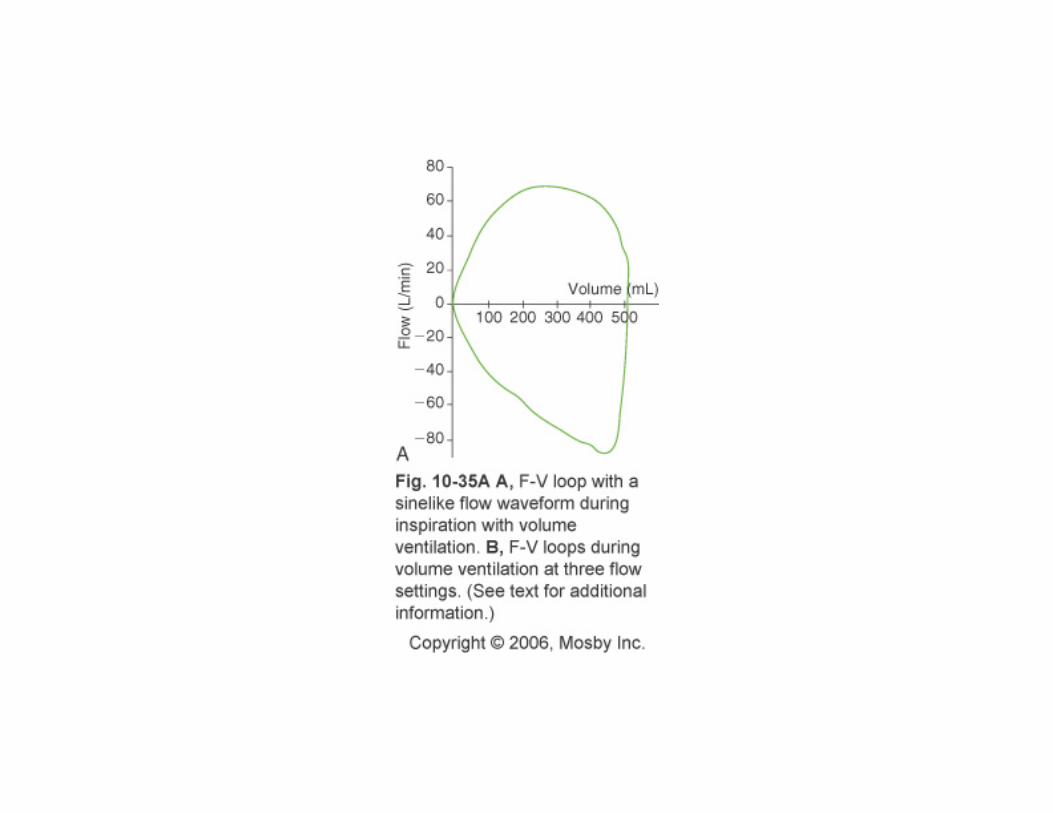
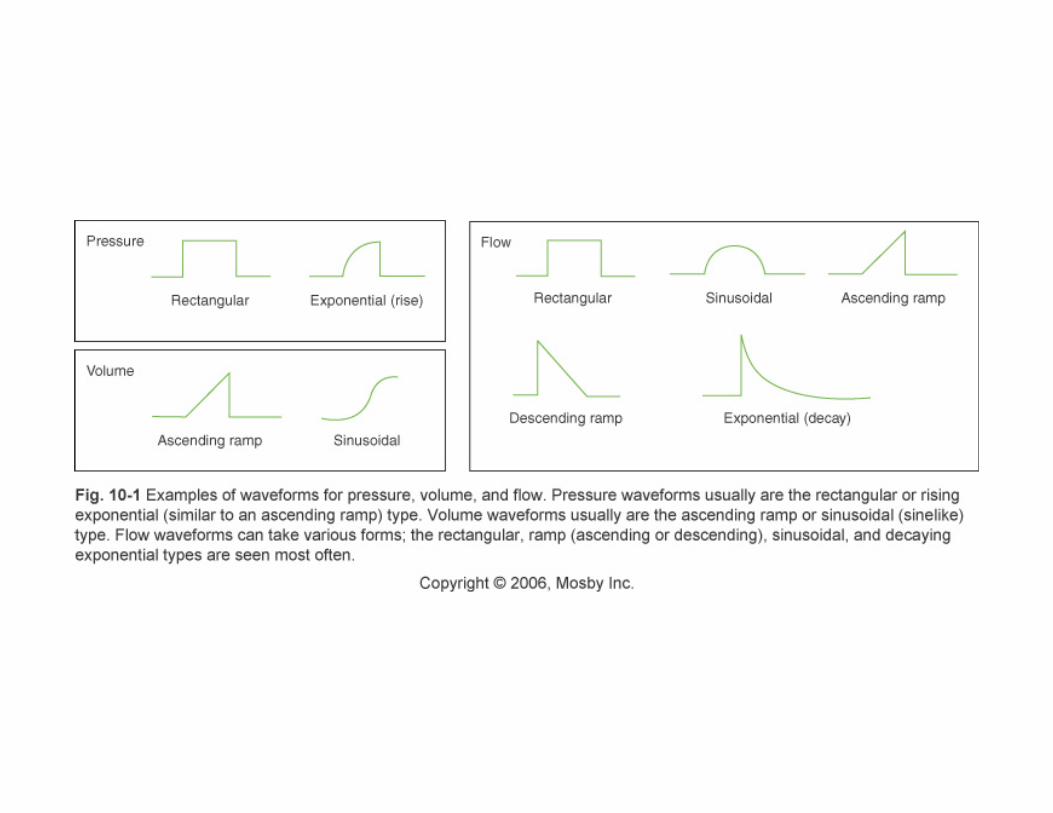
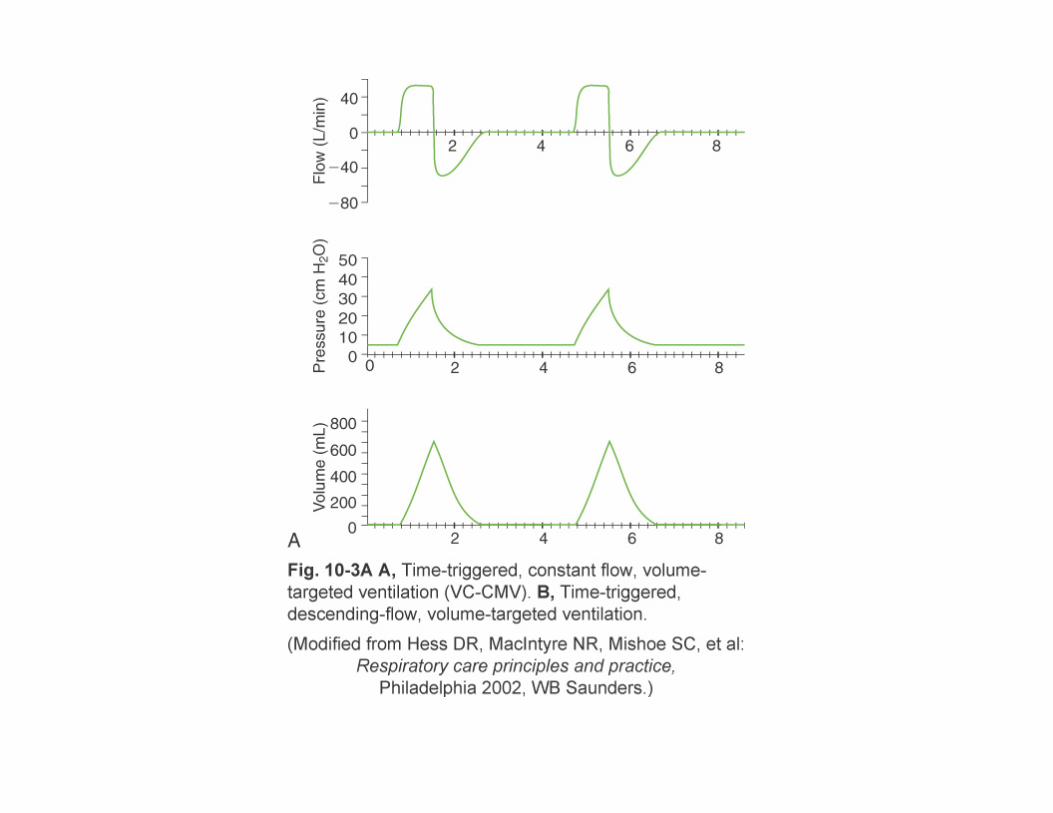
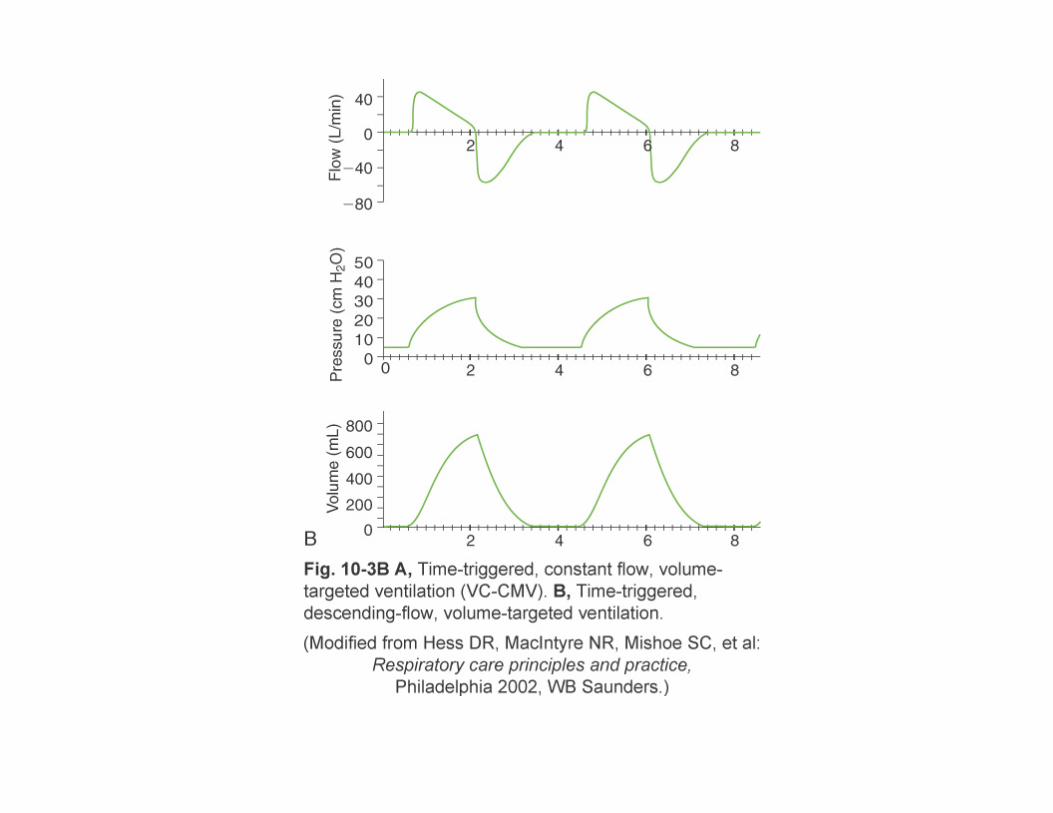
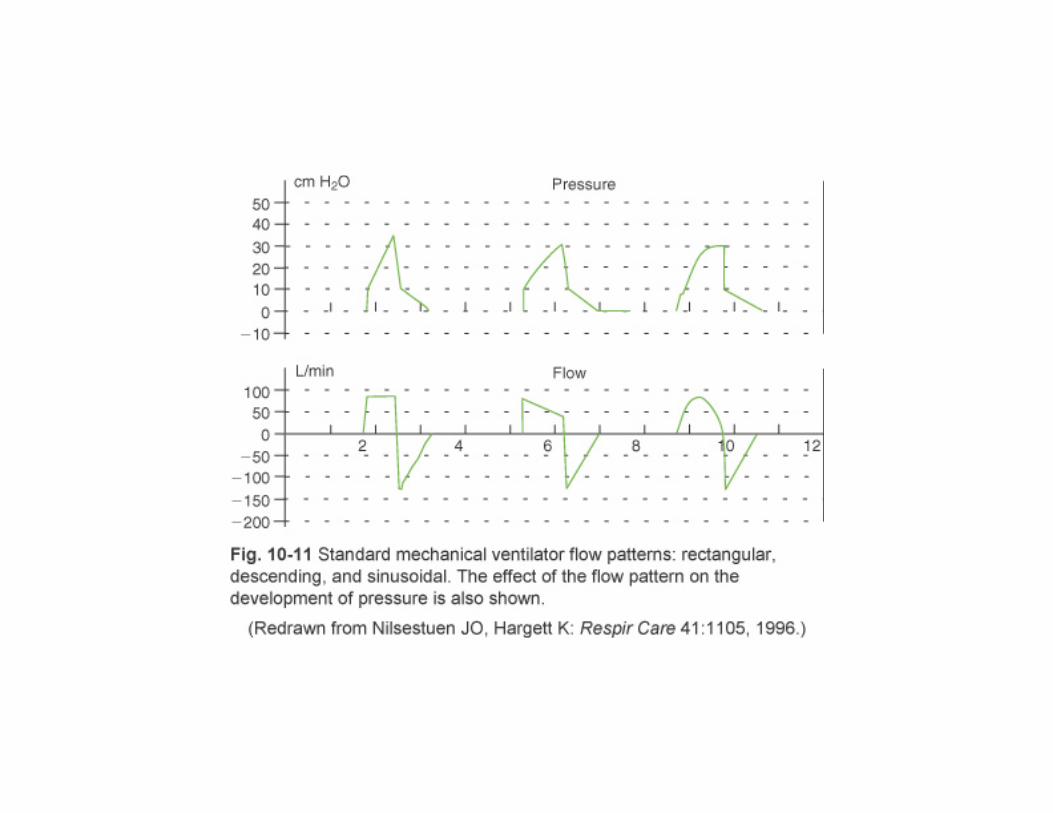
volume-time curves • Different flow patterns during volume ventilation
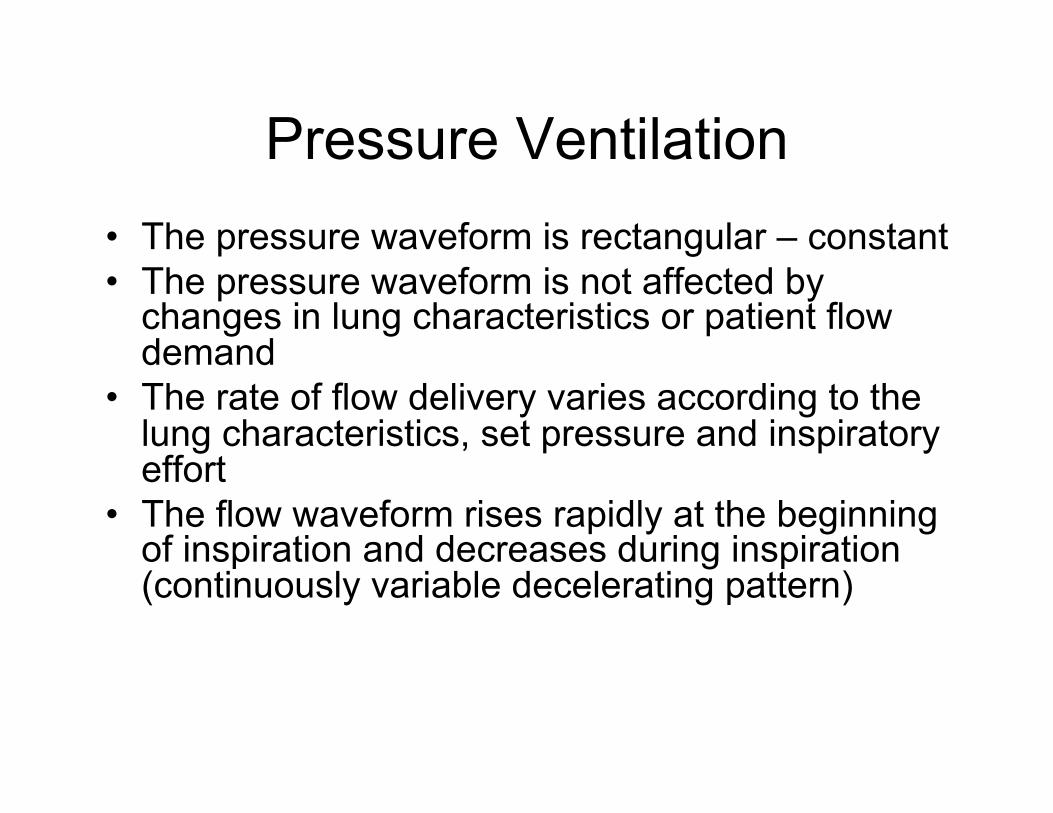
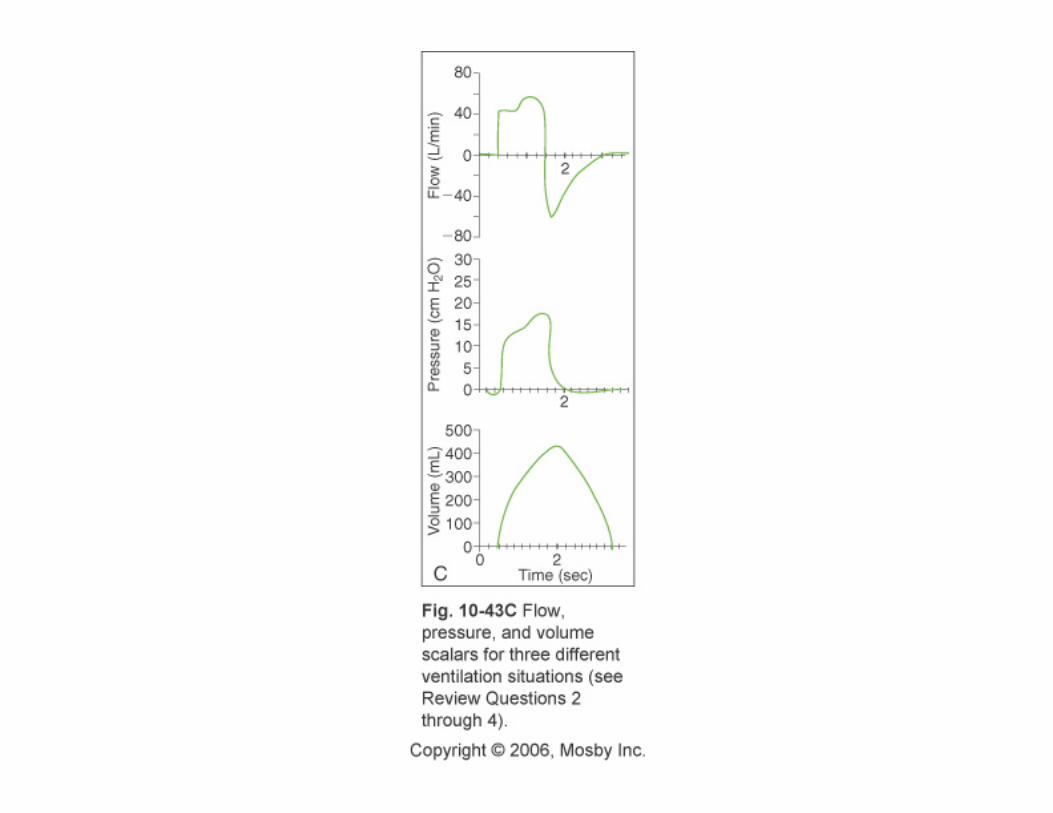
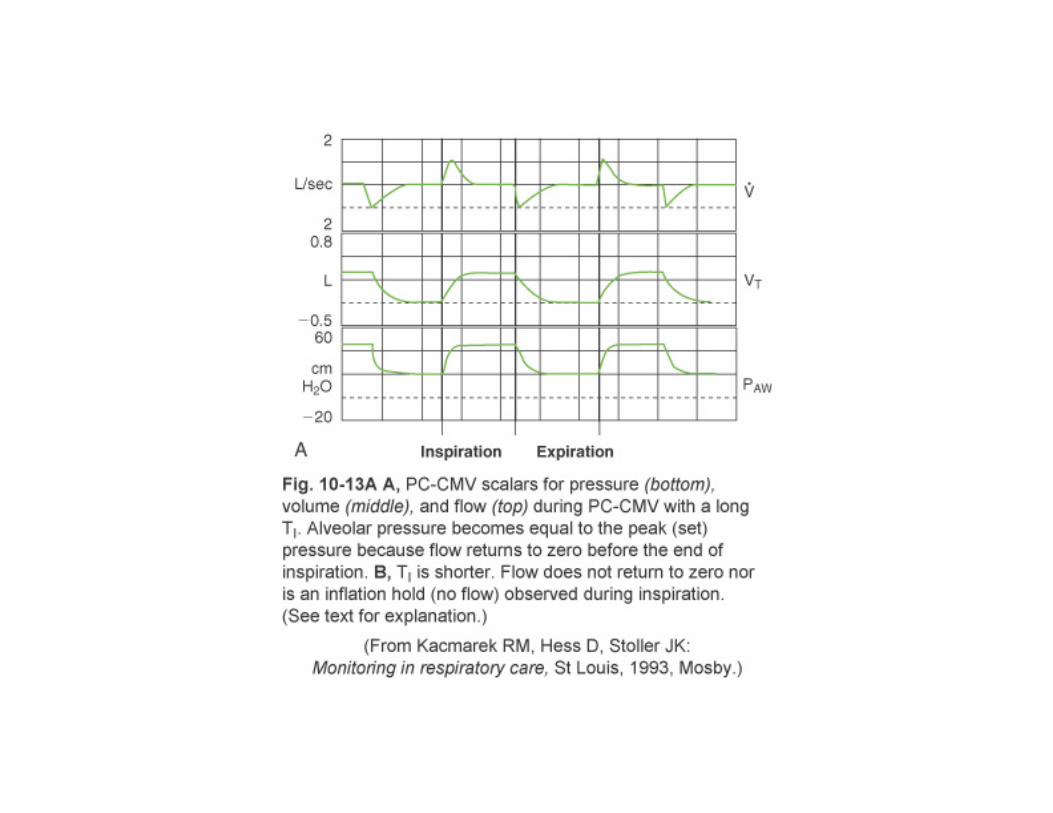
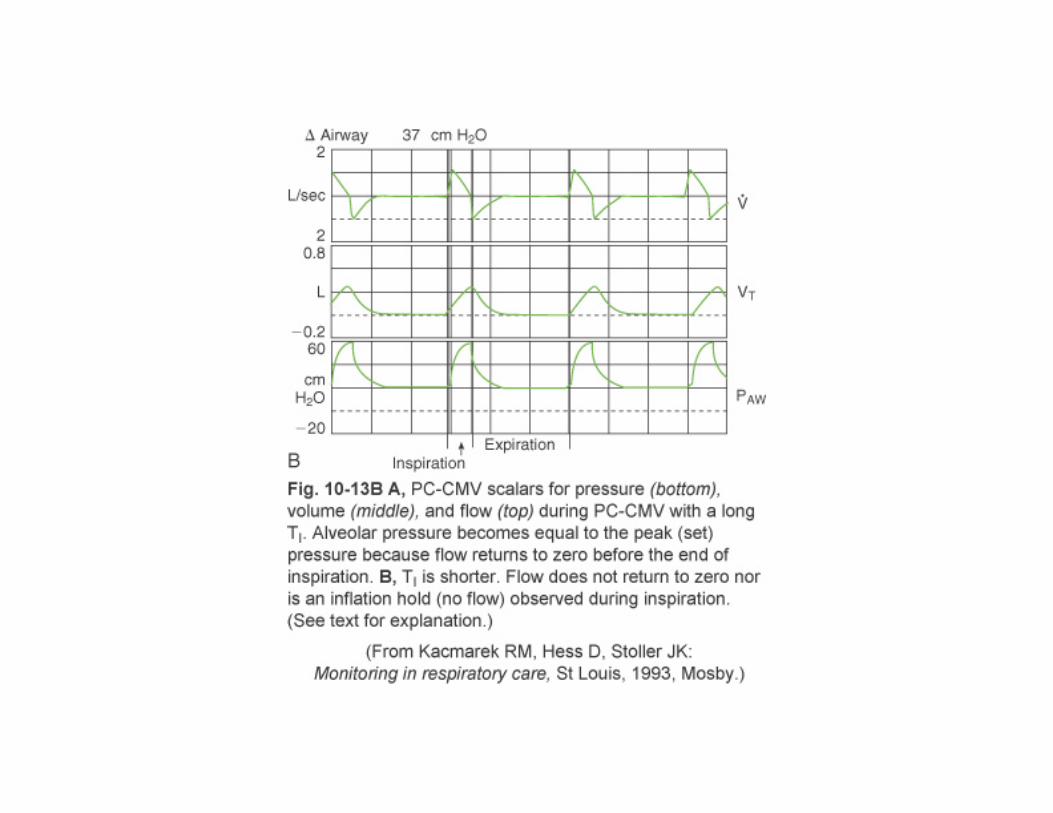
Pressure Ventilation • The pressure waveform is rectangular – constant • The pressure waveform is not affected by
changes in lung characteristics or patient flow demand
• The rate of flow delivery varies according to the lung characteristics, set pressure and inspiratory effort
• The flow waveform rises rapidly at the beginning of inspiration and decreases during inspiration (continuously variable decelerating pattern)


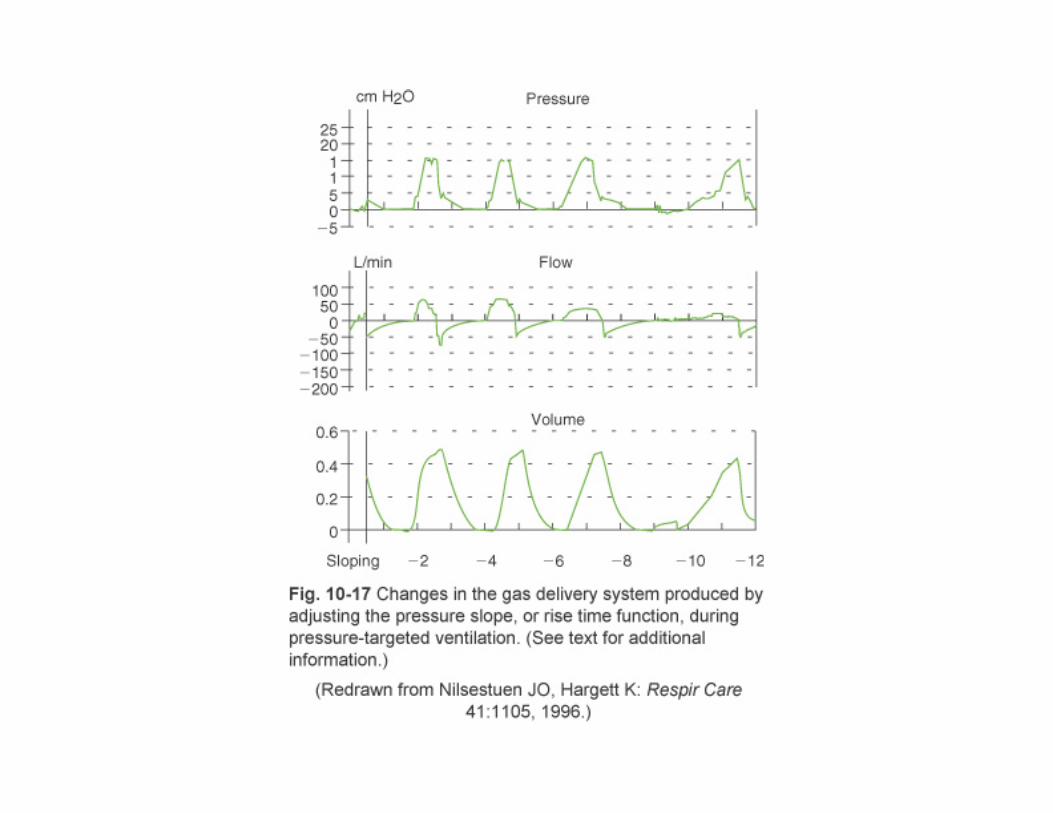

Clinical Rounds 10-2 p. 191 A patient with ARDS is on PCV with the following settings PEEP=10; FiO2=.8; IP=18; PIP=28; Vt=350 (down from 450ml) slope set at the slowest possible flow delivery. ABG’s on these settings are 7.28/49/53 (↓O2 ↑CO2 from previous). The RT notices that PIP reaches only 23cmH2O. No leaks are found in the system. What recommendations might be made to improve this patient’s ABG’s?
Initially it was considered to increase IP to improve ventilation and the FiO2 to improve oxygenation; but better ventilation is actually accomplished by adjusting the slope to achieve a faster pressure delivery and increase the Vt, the PIP will return to 28 cmH2O and the patient's ABG values will improve without further adjustments Evidence in the waveform with a tapered inspiratory pressure waveform


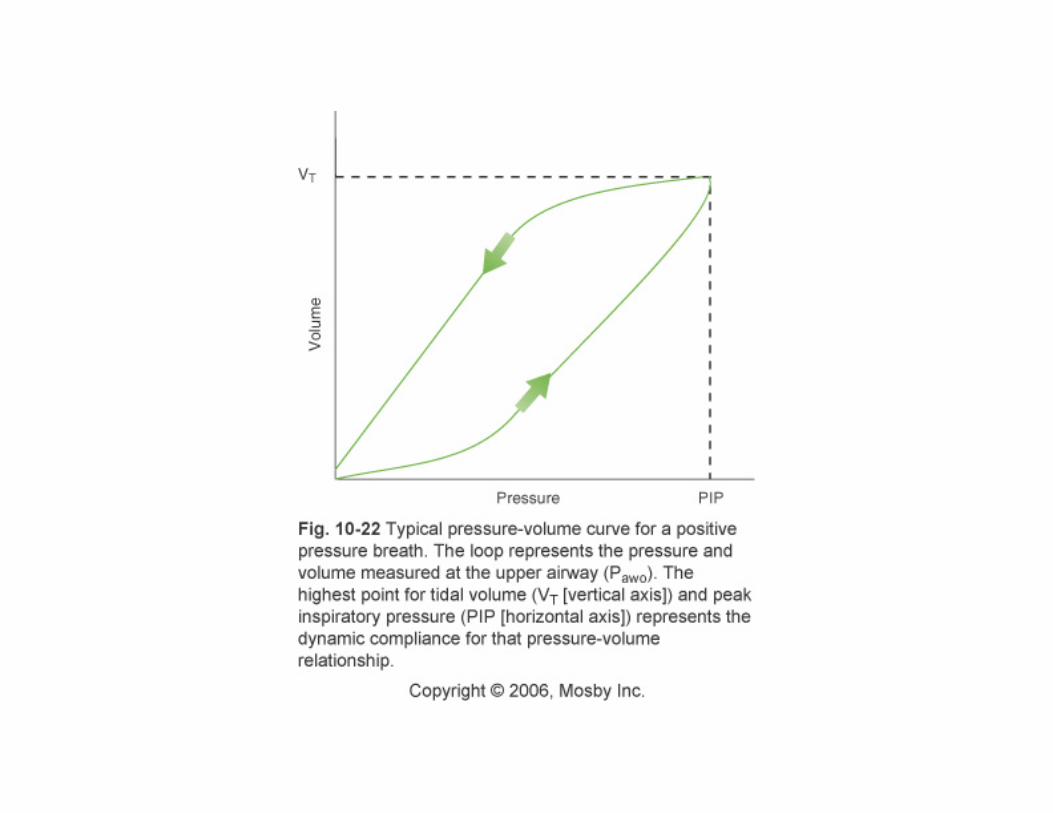
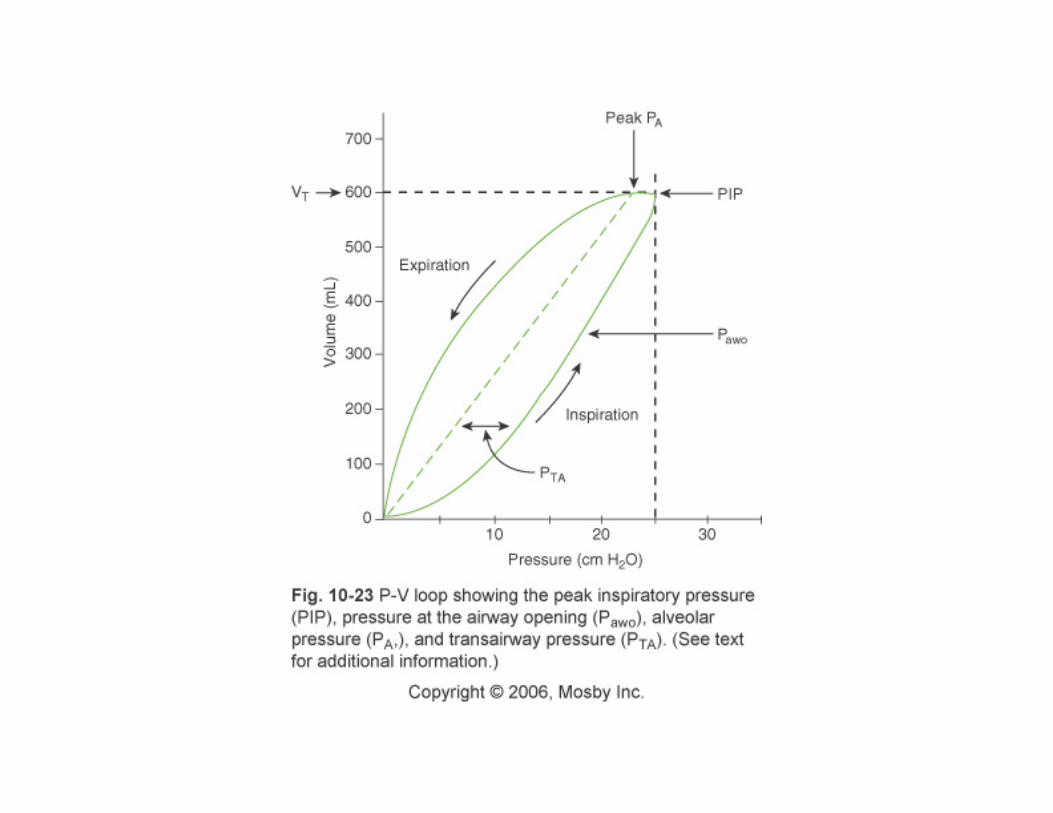

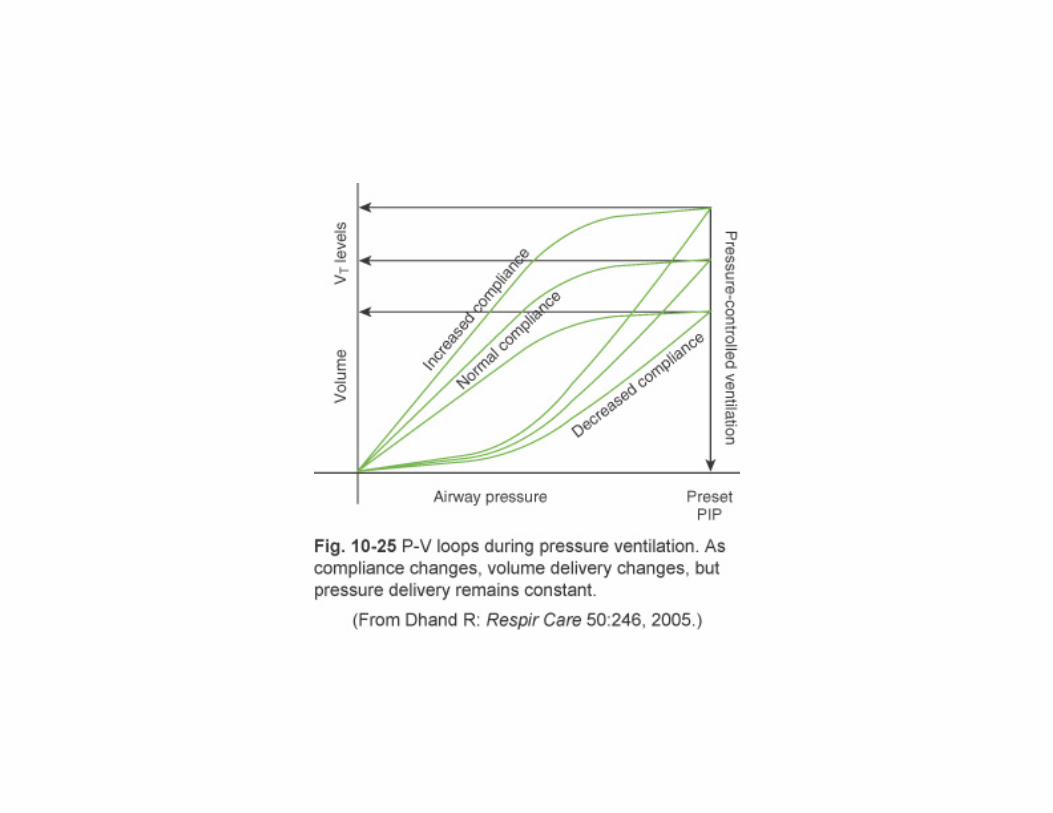
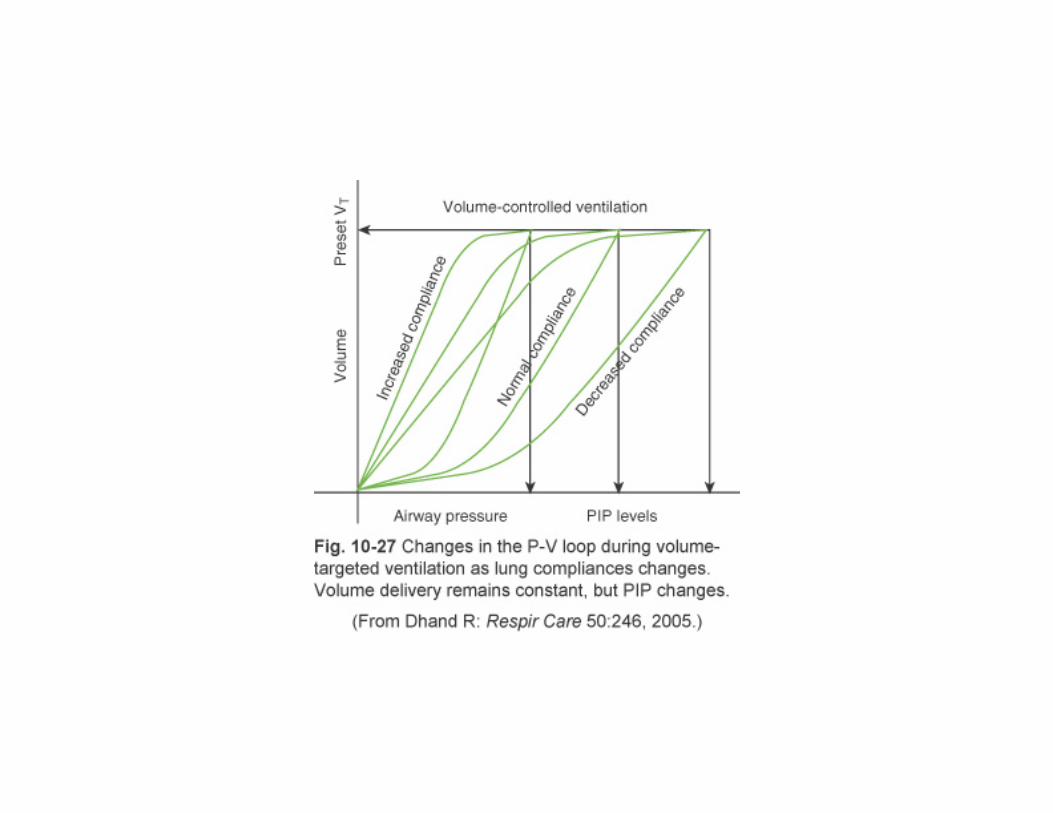


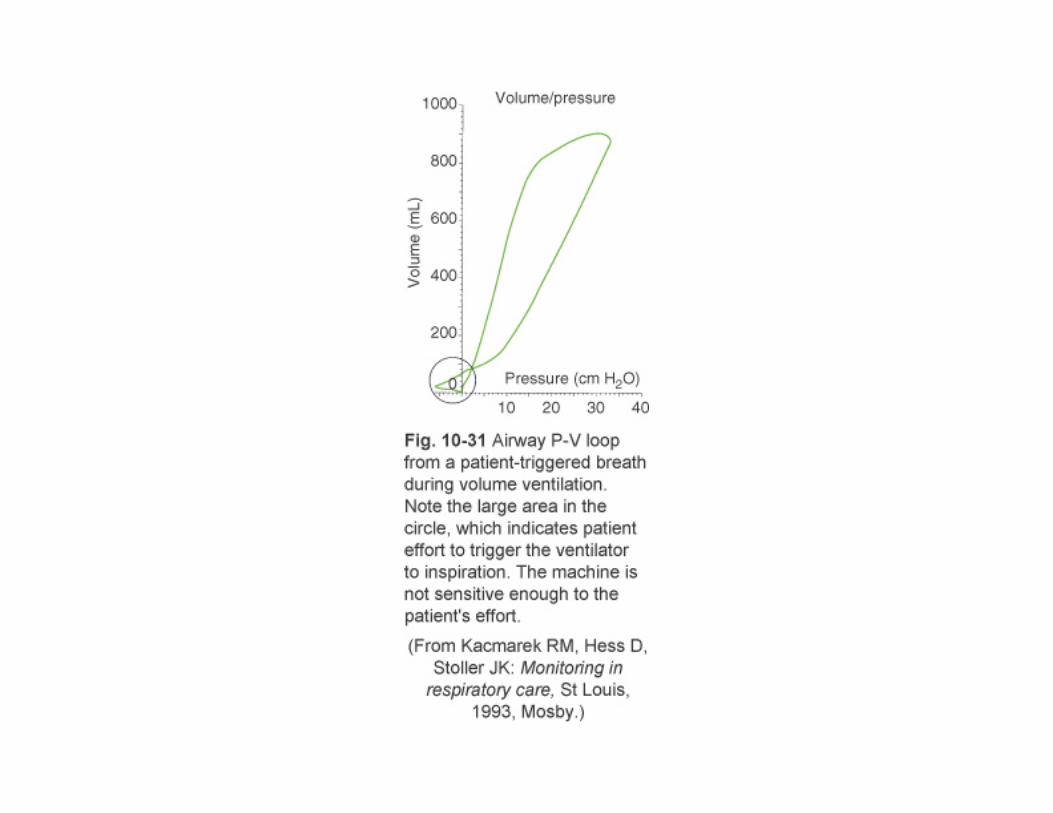
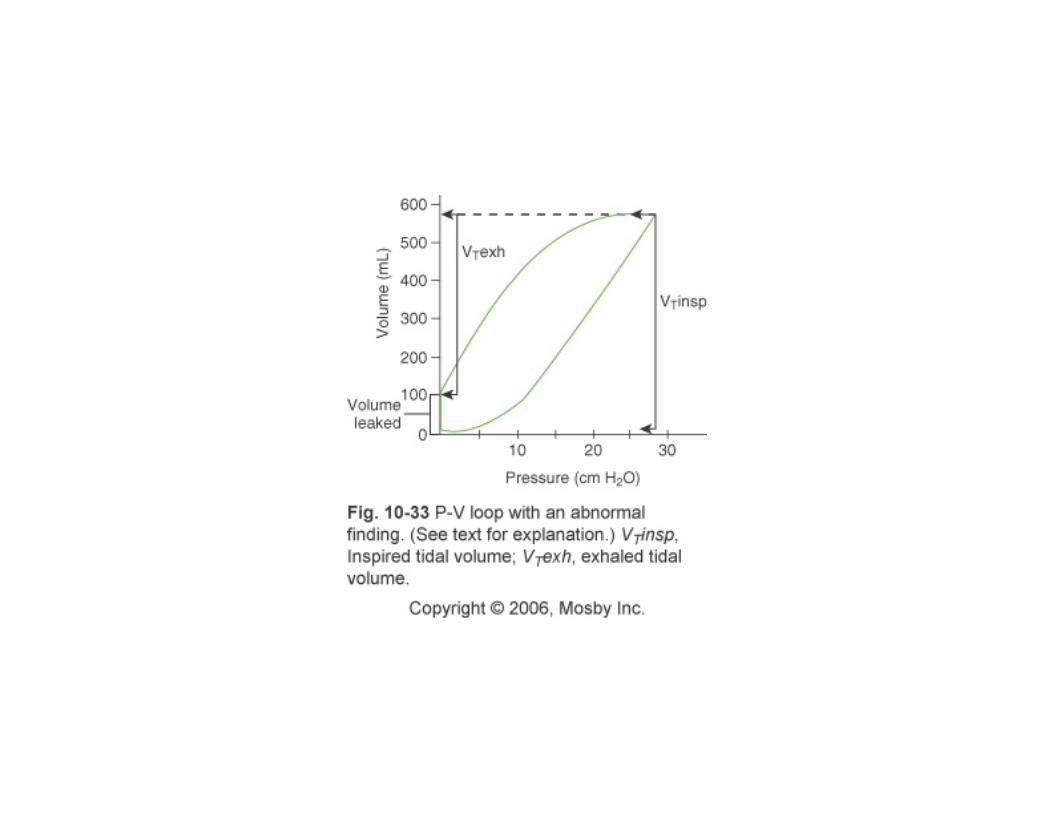

Figure 4-5 Identification and correction of overdistention as seen in P-V loops Rapid Interpretation of Ventilator Waveforms by Waugh, Deshpande, Harwood
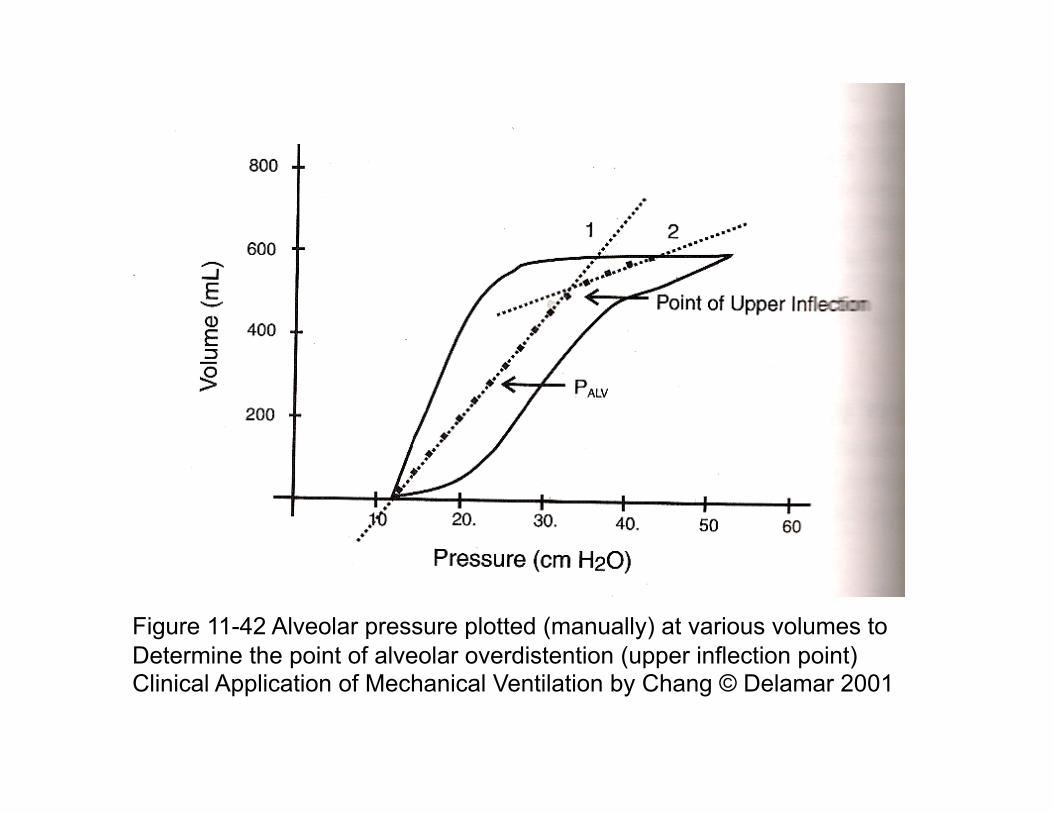
Figure 11-42 Alveolar pressure plotted (manually) at various volumes to Determine the point of alveolar overdistention (upper inflection point) Clinical Application of Mechanical Ventilation by Chang © Delamar 2001

Clinical Applications of Mechanical Ventilation by Chang © Delamar 2001