ventilation and heart rate monitoring in drivers using - iopscience
TRANSCRIPT

Journal of Physics Conference Series
OPEN ACCESS
Ventilation and Heart Rate Monitoring in Driversusing a Contactless Electrical BioimpedanceSystemTo cite this article R Maciacuteas et al 2013 J Phys Conf Ser 434 012047
View the article online for updates and enhancements
You may also likeCO2 experimental measurements towardsthe development of a predictive frameworkusing user actions in smart buildingsRui Oliveira Jeacuterocircme Kaumlmpf RomeuVicente et al
-
An integrated 3D sound intensity sensorusing four-wire particle velocity sensors IDesign and characterizationD R Yntema J W van Honschoten and R JWiegerink
-
The method of calculating LC parametersof balancing compensators in a three-phase four-wire circuit for an unbalancedlinear receiverK Zajkowski and I Rusica
-
This content was downloaded from IP address 91126110117 on 19022022 at 0411
Ventilation and Heart Rate Monitoring in Drivers
using a Contactless Electrical Bioimpedance System
R Macıas1 M A Garcıa1 J Ramos1 R Bragos1 and M Fernandez1
1Department of Electronic Engineering Universitat Politecnica de Catalunya Campus NordEdifici C-4 08034 Barcelona Spain
E-mail raulmaciasupcedu
Abstract Nowadays the road safety is one of the most important priorities in the automotiveindustry Many times this safety is jeopardized because of driving under inappropriate stateseg drowsiness drugs andor alcohol Therefore several systems for monitoring the behavior ofsubjects during driving are researched In this paper a device based on a contactless electricalbioimpedance system is shown Using the four-wire technique this system is capable of obtainingthe heart rate and the ventilation of the driver through multiple textile electrodes These textileelectrodes are placed on the car seat and the steering wheel Moreover it is also reported severalmeasurements done in a controlled environment ie a test room where there are no artifactsdue to the car vibrations or the road state In the mentioned measurements the system responsecan be observed depending on several parameters such as the placement of the electrodes or thenumber of clothing layers worn by the driver
1 Introduction
According to [1] crash statistics suggest that about 10-20 of all crashes might be sleep orfatigue related For that reason detecting drowsiness or fatigue states has received increasingattention recently Research efforts on that field can be classified into three main branches Firstone is based on driving performances ie unintended lane departures steerings and brakesThe second one is related to camera systems that allow detect the percentage of eye closure(PERCLOS) head movements and blinks [2] Finally the last one is based on monitoringbiomedical signals eg EEG ECG or heart rate variability (HRV) [3]
Therefore in this paper a set of measurements realized using a system based on the lastgroup is shown This system through measuring the bioimpedance using the 4-wire techniqueis capable of monitoring the ventilation and also heart rate of a driver It is worth mentioningthat the measurements were done in a laboratory environment where there are no interferencescaused by the state of the road or the car engine vibrations
2 System
The bioimpedance system designed for monitoring the ventilation consists of several textileelectrodes and two main blocks an analog front-end (AFE) and a generator-demodulator blocksee figure 1 It is worth mentioning that all the system is controlled by LabView and thegenerator-demodulator block consists of the PXI System by National Instruments Briefly asinusoidal signal with a frequency of 625 kHz is generated using one of the PXI modules NI
XV Int Conf on Electrical Bio-Impedance amp XIV Conf on Electrical Impedance Tomography IOP PublishingJournal of Physics Conference Series 434 (2013) 012047 doi1010881742-65964341012047
Published under licence by IOP Publishing Ltd 1
PXI-5422 Later this generated signal is injected to the AFE block In the injection stage ofthe AFE the voltage signal coming from the PXI is converted to a current signal by a secondgeneration current conveyor (CCII) [4] By this way the injected signal to the driver by thetextile electrodes connected to HC and LC in figure 1 is a current driving instead of a voltagedriving In the voltage sensing stage a differential to single ended voltage conversion is done by awideband differential amplifier However before this conversion the voltage difference betweenthe pair of sensing electrodes HP and LP in figure 1 is measured by a pair of high-impedancebuffers Finally the output signal of the AFE is acquired using other PXI module NI PXI-5122and an In Phase-Quadrature (IQ) demodulation is done by LabView It is worth mentioningthat there is also a Common-Mode Feed-Back (CMFB) stage in the AFE which is useful toreduce the effect of high electrode mismatch
GEN
DEMOD
GEN amp DEMODAFE
DIF-DIF
AMP
CMFB
V-I
V-I
DIF AMP
S5 S6 S7 S8
S1 S3
S2S4
HC
LC
LP
HP
Figure 1 A block diagramof the system It consists of aPXI system an AFE and severaltextile electrodes attached to thesteering wheel and the car seat
3 Measurements
31 Comparison to a Reference Signal
To check the proper work of the system several volunteers are monitored not only by the designedsystem but also by a commercial one made by BIOPAC Systems This commercial deviceacquires the ventilation signal using a piezoresistive thoracic band Therefore the designedsystem works properly if the measured signal fits to the signal related to the thoracic band iefor the same period of time the exhalation-inhalation ratio is the same in both signals
50 60 70 80 90 100 110 120minus5
0
5
10
Time (s)
Ma
gn
itu
de
(Ω)
Thoracic Band vs Impedance VentilationRight Hand minus Back Seat Conguration
50 60 70 80 90 100 110 120minus5
0
5
10
Time (s)
Ma
gn
itu
de
(Ω)
Left Hand minus Back Seat Conguration
Thoracic Band
Impedance
(a) Volunteer 1
20 40 60 80 100 120 140minus5
0
5
Time (s)
Mag
nitu
de(Ω
)
Thoracic Band vs Impedance VentilationRight Hand minus Back Seat Configuration
20 40 60 80 100 120 140minus5
0
5
Time (s)
Mag
nitu
de(Ω
)
Left Hand minus Back Seat Configuration
Thoracic BandImpedance
(b) Volunteer 2
Figure 2 Comparison between the Thoracic Band and the Bioimpedance Device for twovolunteers (Top) Configuration where both pairs of driving-sensing electrodes are in the rightside of the body (Bottom) Configuration where a pair of electrodes is in the left hand andthe other pair is in the right side of the back In both plots the upper line is related to thebioimpedance device and the bottom one comes from the thoracic band
As observed in figure 2 for each volunteer two different configurations are tested On onehand in the upper graphs all four electrodes are placed at the right side ie whereas S1 and S5in figure 1 are the driving electrodes S2 and S6 are the sensing electrodes On the other handin the bottom graphs whereas the electrodes on the back seat remain at the same point (S5 andS6) both electrodes on the steering wheel are moved to the left side (S3 and S4 in figure 1)
Note that for all cases except for the bottom graph of the second volunteer both signals fromthe bioimpedance device and from the thoracic band match up and show a normal respiration
XV Int Conf on Electrical Bio-Impedance amp XIV Conf on Electrical Impedance Tomography IOP PublishingJournal of Physics Conference Series 434 (2013) 012047 doi1010881742-65964341012047
2
rate ie between 11 and 20 breaths per minute in adults and in normal conditions The specialcase can be due to the lack of contact between any textrode and the volunteer Due to thisfact it is important to check the system according others parameters such as the placement ofelectrodes or the dependencies on clothing
32 Configuration of Electrodes
In this second group of measurements to check the system whereas the placement of theelectrodes is changed the same test is done That test consists of a two-minute monitoringand around the last 30 seconds five deep breathing are taken Therefore changing the place ofdriving and sensing electrodes three configurations are tested Steering Wheel-Steering WheelConfiguration (SW-SW) Steering Wheel-Back Seat Configuration (SW-BS) and Back Seat-BackSeat Configuration (BS-BS)
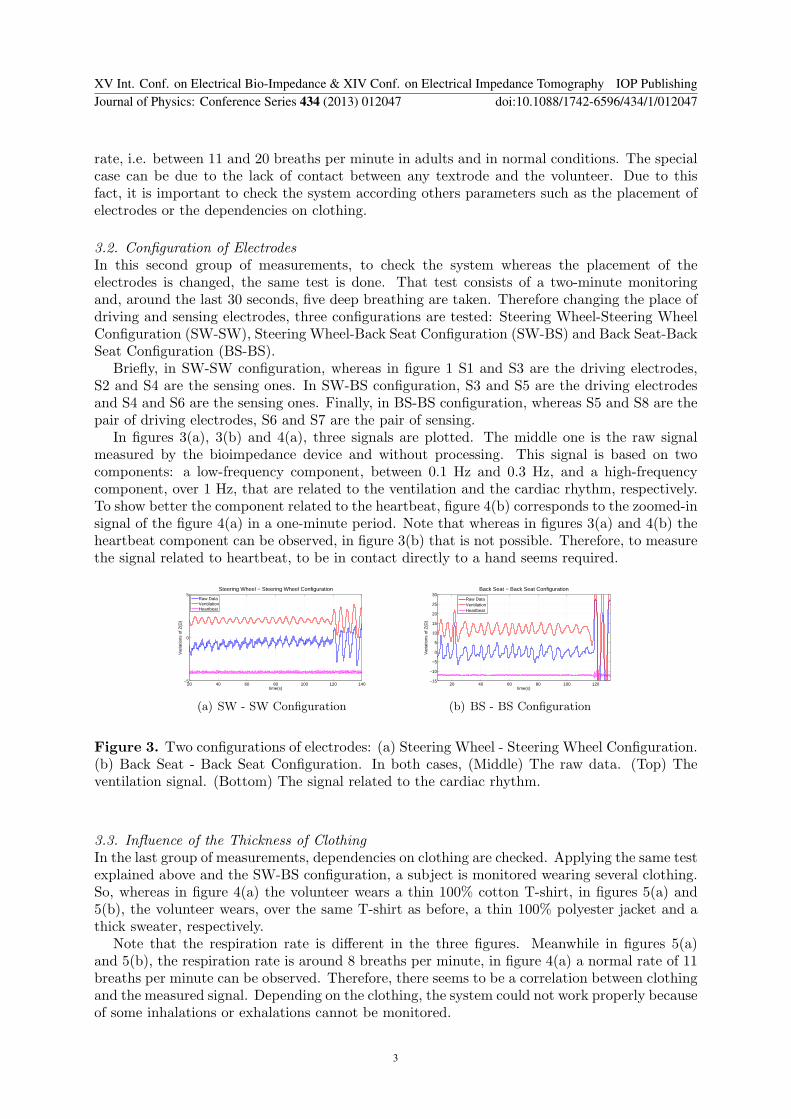
Briefly in SW-SW configuration whereas in figure 1 S1 and S3 are the driving electrodesS2 and S4 are the sensing ones In SW-BS configuration S3 and S5 are the driving electrodesand S4 and S6 are the sensing ones Finally in BS-BS configuration whereas S5 and S8 are thepair of driving electrodes S6 and S7 are the pair of sensing
In figures 3(a) 3(b) and 4(a) three signals are plotted The middle one is the raw signalmeasured by the bioimpedance device and without processing This signal is based on twocomponents a low-frequency component between 01 Hz and 03 Hz and a high-frequencycomponent over 1 Hz that are related to the ventilation and the cardiac rhythm respectivelyTo show better the component related to the heartbeat figure 4(b) corresponds to the zoomed-insignal of the figure 4(a) in a one-minute period Note that whereas in figures 3(a) and 4(b) theheartbeat component can be observed in figure 3(b) that is not possible Therefore to measurethe signal related to heartbeat to be in contact directly to a hand seems required
20 40 60 80 100 120 140minus5
0
5
time(s)
Var
iatio
ns o
f Z(Ω
)
Steering Wheel minus Steering Wheel Configuration
Raw DataVentilationHeartbeat
(a) SW - SW Configuration
20 40 60 80 100 120minus15
minus10
minus5
0
5
10
15
20
25
30
time(s)
Var
iatio
ns o
f Z(Ω
)
Back Seat minus Back Seat Configuration
Raw DataVentilationHeartbeat
(b) BS - BS Configuration
Figure 3 Two configurations of electrodes (a) Steering Wheel - Steering Wheel Configuration(b) Back Seat - Back Seat Configuration In both cases (Middle) The raw data (Top) Theventilation signal (Bottom) The signal related to the cardiac rhythm
33 Influence of the Thickness of Clothing
In the last group of measurements dependencies on clothing are checked Applying the same testexplained above and the SW-BS configuration a subject is monitored wearing several clothingSo whereas in figure 4(a) the volunteer wears a thin 100 cotton T-shirt in figures 5(a) and5(b) the volunteer wears over the same T-shirt as before a thin 100 polyester jacket and athick sweater respectively
Note that the respiration rate is different in the three figures Meanwhile in figures 5(a)and 5(b) the respiration rate is around 8 breaths per minute in figure 4(a) a normal rate of 11breaths per minute can be observed Therefore there seems to be a correlation between clothingand the measured signal Depending on the clothing the system could not work properly becauseof some inhalations or exhalations cannot be monitored
XV Int Conf on Electrical Bio-Impedance amp XIV Conf on Electrical Impedance Tomography IOP PublishingJournal of Physics Conference Series 434 (2013) 012047 doi1010881742-65964341012047
3
20 40 60 80 100 120 140minus20
minus15
minus10
minus5
0
5
10
15
20
25
time(s)
Var
iatio
ns o
f Z(Ω
)
Steering Wheel (Left Hand) minus Back Seat Configuration
Raw DataVentilationHeartbeat
(a) SW - BS Configuration
50 60 70 80 90 100 110minus3
minus2
minus1
0
1
2
3
4
5
time(s)
varia
tions
of Z
(Ω)
Steering Wheel (Left Hand) minus Back Seat ConfigurationZoom in 1minusminute Period
Raw DataVentilationHeartbeat
(b) Zoom in a one-minute period
Figure 4 Steering Wheel - Back Seat configuration of electrodes (b) is a zoom in a one-minuteperiod to the signal shown in (a) In both cases (Middle) The raw data (Top) The ventilationsignal (Bottom) The signal related to the cardiac rhythm
20 40 60 80 100 120 140minus15
minus10
minus5
0
5
10
15
20
25
time(s)
Var
iatio
ns o
f Z(Ω
)
Steering Wheel minus Back Seat Configuration wearing a Thin Jacket
Raw DataVentilationHeartbeat
(a) Wearing a thin Jacket
20 40 60 80 100 120 140minus15
minus10
minus5
0
5
10
15
20
time(s)
Var
iatio
ns o
f Z(Ω
)
Steering Wheel minus Back Seat Configuration wearing a Thick Sweater
Raw DataVentilationHeartbeat
(b) Wearing a thick sweater
Figure 5 Measurements wearing several clothes in a SW-BS configuration In (a) the subjectis wearing a thin jacket made of polyester (100) over a thin T-shirt made of cotton (100)In (b) the subject is wearing a thick sweater made of woolen (33) polyester (27) acrylic(27) and polyurethane (13) over a thin T-shirt made of cotton (100)
4 Conclusions
Basically in this paper is shown that monitoring the ventilation and heart rate using abioimpedance system with textile electrodes placed over the clothes is possible To check thisthe designed system and a commercial device are compared and as shown in this paper bothsignals match up However it is worth mentioning that the system has been only tested in asimulation environment It is to be expected that in a real environment the lack of contactwith the textile electrodes will appear because of the vibrations and the state of the roadFurthermore the system could not work properly at an injected frequency of 625 kHz due tothe high capacitive behaviour of the interface between clothing and textile electrodes Thusalthough testing the system in a real environment or with a higher injected frequency is requiredthe results obtained in a controlled environment are encouraging
References[1] Anund A Kecklund G Peters B and Akerstedt T 2008 Driver sleepiness and individual differences in
preferences for countermeasures J Sleep Res 17 16ndash22[2] Sommer D and Golz M 2010 Evaluation of PERCLOS based current fatigue monitoring technologies Proc of
the 32th Annual Int Conf of the IEEE EMBS (Buenos Aires) 4456ndash9[3] Michail E Kokonozi A Chouvarda I and Maglaveras N 2008 EEG and HRV markers of sleepiness and loss of
control during car driving Proc of the 30th Annual Int Conf of the IEEE EMBS (Vancouver) 2566ndash9[4] Bragos R Rosell J and Riu P 1994 A wide-band AC-coupled current source for electrical impedance
tomography Physiol Meas 15 A91ndash9
XV Int Conf on Electrical Bio-Impedance amp XIV Conf on Electrical Impedance Tomography IOP PublishingJournal of Physics Conference Series 434 (2013) 012047 doi1010881742-65964341012047
4

Ventilation and Heart Rate Monitoring in Drivers
using a Contactless Electrical Bioimpedance System
R Macıas1 M A Garcıa1 J Ramos1 R Bragos1 and M Fernandez1
1Department of Electronic Engineering Universitat Politecnica de Catalunya Campus NordEdifici C-4 08034 Barcelona Spain
E-mail raulmaciasupcedu
Abstract Nowadays the road safety is one of the most important priorities in the automotiveindustry Many times this safety is jeopardized because of driving under inappropriate stateseg drowsiness drugs andor alcohol Therefore several systems for monitoring the behavior ofsubjects during driving are researched In this paper a device based on a contactless electricalbioimpedance system is shown Using the four-wire technique this system is capable of obtainingthe heart rate and the ventilation of the driver through multiple textile electrodes These textileelectrodes are placed on the car seat and the steering wheel Moreover it is also reported severalmeasurements done in a controlled environment ie a test room where there are no artifactsdue to the car vibrations or the road state In the mentioned measurements the system responsecan be observed depending on several parameters such as the placement of the electrodes or thenumber of clothing layers worn by the driver
1 Introduction
According to [1] crash statistics suggest that about 10-20 of all crashes might be sleep orfatigue related For that reason detecting drowsiness or fatigue states has received increasingattention recently Research efforts on that field can be classified into three main branches Firstone is based on driving performances ie unintended lane departures steerings and brakesThe second one is related to camera systems that allow detect the percentage of eye closure(PERCLOS) head movements and blinks [2] Finally the last one is based on monitoringbiomedical signals eg EEG ECG or heart rate variability (HRV) [3]
Therefore in this paper a set of measurements realized using a system based on the lastgroup is shown This system through measuring the bioimpedance using the 4-wire techniqueis capable of monitoring the ventilation and also heart rate of a driver It is worth mentioningthat the measurements were done in a laboratory environment where there are no interferencescaused by the state of the road or the car engine vibrations
2 System
The bioimpedance system designed for monitoring the ventilation consists of several textileelectrodes and two main blocks an analog front-end (AFE) and a generator-demodulator blocksee figure 1 It is worth mentioning that all the system is controlled by LabView and thegenerator-demodulator block consists of the PXI System by National Instruments Briefly asinusoidal signal with a frequency of 625 kHz is generated using one of the PXI modules NI
XV Int Conf on Electrical Bio-Impedance amp XIV Conf on Electrical Impedance Tomography IOP PublishingJournal of Physics Conference Series 434 (2013) 012047 doi1010881742-65964341012047
Published under licence by IOP Publishing Ltd 1
PXI-5422 Later this generated signal is injected to the AFE block In the injection stage ofthe AFE the voltage signal coming from the PXI is converted to a current signal by a secondgeneration current conveyor (CCII) [4] By this way the injected signal to the driver by thetextile electrodes connected to HC and LC in figure 1 is a current driving instead of a voltagedriving In the voltage sensing stage a differential to single ended voltage conversion is done by awideband differential amplifier However before this conversion the voltage difference betweenthe pair of sensing electrodes HP and LP in figure 1 is measured by a pair of high-impedancebuffers Finally the output signal of the AFE is acquired using other PXI module NI PXI-5122and an In Phase-Quadrature (IQ) demodulation is done by LabView It is worth mentioningthat there is also a Common-Mode Feed-Back (CMFB) stage in the AFE which is useful toreduce the effect of high electrode mismatch
GEN
DEMOD
GEN amp DEMODAFE
DIF-DIF
AMP
CMFB
V-I
V-I
DIF AMP
S5 S6 S7 S8
S1 S3
S2S4
HC
LC
LP
HP
Figure 1 A block diagramof the system It consists of aPXI system an AFE and severaltextile electrodes attached to thesteering wheel and the car seat
3 Measurements
31 Comparison to a Reference Signal
To check the proper work of the system several volunteers are monitored not only by the designedsystem but also by a commercial one made by BIOPAC Systems This commercial deviceacquires the ventilation signal using a piezoresistive thoracic band Therefore the designedsystem works properly if the measured signal fits to the signal related to the thoracic band iefor the same period of time the exhalation-inhalation ratio is the same in both signals
50 60 70 80 90 100 110 120minus5
0
5
10
Time (s)
Ma
gn
itu
de
(Ω)
Thoracic Band vs Impedance VentilationRight Hand minus Back Seat Conguration
50 60 70 80 90 100 110 120minus5
0
5
10
Time (s)
Ma
gn
itu
de
(Ω)
Left Hand minus Back Seat Conguration
Thoracic Band
Impedance
(a) Volunteer 1
20 40 60 80 100 120 140minus5
0
5
Time (s)
Mag
nitu
de(Ω
)
Thoracic Band vs Impedance VentilationRight Hand minus Back Seat Configuration
20 40 60 80 100 120 140minus5
0
5
Time (s)
Mag
nitu
de(Ω
)
Left Hand minus Back Seat Configuration
Thoracic BandImpedance
(b) Volunteer 2
Figure 2 Comparison between the Thoracic Band and the Bioimpedance Device for twovolunteers (Top) Configuration where both pairs of driving-sensing electrodes are in the rightside of the body (Bottom) Configuration where a pair of electrodes is in the left hand andthe other pair is in the right side of the back In both plots the upper line is related to thebioimpedance device and the bottom one comes from the thoracic band
As observed in figure 2 for each volunteer two different configurations are tested On onehand in the upper graphs all four electrodes are placed at the right side ie whereas S1 and S5in figure 1 are the driving electrodes S2 and S6 are the sensing electrodes On the other handin the bottom graphs whereas the electrodes on the back seat remain at the same point (S5 andS6) both electrodes on the steering wheel are moved to the left side (S3 and S4 in figure 1)
Note that for all cases except for the bottom graph of the second volunteer both signals fromthe bioimpedance device and from the thoracic band match up and show a normal respiration
XV Int Conf on Electrical Bio-Impedance amp XIV Conf on Electrical Impedance Tomography IOP PublishingJournal of Physics Conference Series 434 (2013) 012047 doi1010881742-65964341012047
2
rate ie between 11 and 20 breaths per minute in adults and in normal conditions The specialcase can be due to the lack of contact between any textrode and the volunteer Due to thisfact it is important to check the system according others parameters such as the placement ofelectrodes or the dependencies on clothing
32 Configuration of Electrodes
In this second group of measurements to check the system whereas the placement of theelectrodes is changed the same test is done That test consists of a two-minute monitoringand around the last 30 seconds five deep breathing are taken Therefore changing the place ofdriving and sensing electrodes three configurations are tested Steering Wheel-Steering WheelConfiguration (SW-SW) Steering Wheel-Back Seat Configuration (SW-BS) and Back Seat-BackSeat Configuration (BS-BS)
Briefly in SW-SW configuration whereas in figure 1 S1 and S3 are the driving electrodesS2 and S4 are the sensing ones In SW-BS configuration S3 and S5 are the driving electrodesand S4 and S6 are the sensing ones Finally in BS-BS configuration whereas S5 and S8 are thepair of driving electrodes S6 and S7 are the pair of sensing
In figures 3(a) 3(b) and 4(a) three signals are plotted The middle one is the raw signalmeasured by the bioimpedance device and without processing This signal is based on twocomponents a low-frequency component between 01 Hz and 03 Hz and a high-frequencycomponent over 1 Hz that are related to the ventilation and the cardiac rhythm respectivelyTo show better the component related to the heartbeat figure 4(b) corresponds to the zoomed-insignal of the figure 4(a) in a one-minute period Note that whereas in figures 3(a) and 4(b) theheartbeat component can be observed in figure 3(b) that is not possible Therefore to measurethe signal related to heartbeat to be in contact directly to a hand seems required
20 40 60 80 100 120 140minus5
0
5
time(s)
Var
iatio
ns o
f Z(Ω
)
Steering Wheel minus Steering Wheel Configuration
Raw DataVentilationHeartbeat
(a) SW - SW Configuration
20 40 60 80 100 120minus15
minus10
minus5
0
5
10
15
20
25
30
time(s)
Var
iatio
ns o
f Z(Ω
)
Back Seat minus Back Seat Configuration
Raw DataVentilationHeartbeat
(b) BS - BS Configuration
Figure 3 Two configurations of electrodes (a) Steering Wheel - Steering Wheel Configuration(b) Back Seat - Back Seat Configuration In both cases (Middle) The raw data (Top) Theventilation signal (Bottom) The signal related to the cardiac rhythm
33 Influence of the Thickness of Clothing
In the last group of measurements dependencies on clothing are checked Applying the same testexplained above and the SW-BS configuration a subject is monitored wearing several clothingSo whereas in figure 4(a) the volunteer wears a thin 100 cotton T-shirt in figures 5(a) and5(b) the volunteer wears over the same T-shirt as before a thin 100 polyester jacket and athick sweater respectively
Note that the respiration rate is different in the three figures Meanwhile in figures 5(a)and 5(b) the respiration rate is around 8 breaths per minute in figure 4(a) a normal rate of 11breaths per minute can be observed Therefore there seems to be a correlation between clothingand the measured signal Depending on the clothing the system could not work properly becauseof some inhalations or exhalations cannot be monitored
XV Int Conf on Electrical Bio-Impedance amp XIV Conf on Electrical Impedance Tomography IOP PublishingJournal of Physics Conference Series 434 (2013) 012047 doi1010881742-65964341012047
3
20 40 60 80 100 120 140minus20
minus15
minus10
minus5
0
5
10
15
20
25
time(s)
Var
iatio
ns o
f Z(Ω
)
Steering Wheel (Left Hand) minus Back Seat Configuration
Raw DataVentilationHeartbeat
(a) SW - BS Configuration
50 60 70 80 90 100 110minus3
minus2
minus1
0
1
2
3
4
5
time(s)
varia
tions
of Z
(Ω)
Steering Wheel (Left Hand) minus Back Seat ConfigurationZoom in 1minusminute Period
Raw DataVentilationHeartbeat
(b) Zoom in a one-minute period
Figure 4 Steering Wheel - Back Seat configuration of electrodes (b) is a zoom in a one-minuteperiod to the signal shown in (a) In both cases (Middle) The raw data (Top) The ventilationsignal (Bottom) The signal related to the cardiac rhythm
20 40 60 80 100 120 140minus15
minus10
minus5
0
5
10
15
20
25
time(s)
Var
iatio
ns o
f Z(Ω
)
Steering Wheel minus Back Seat Configuration wearing a Thin Jacket
Raw DataVentilationHeartbeat
(a) Wearing a thin Jacket
20 40 60 80 100 120 140minus15
minus10
minus5
0
5
10
15
20
time(s)
Var
iatio
ns o
f Z(Ω
)
Steering Wheel minus Back Seat Configuration wearing a Thick Sweater
Raw DataVentilationHeartbeat
(b) Wearing a thick sweater
Figure 5 Measurements wearing several clothes in a SW-BS configuration In (a) the subjectis wearing a thin jacket made of polyester (100) over a thin T-shirt made of cotton (100)In (b) the subject is wearing a thick sweater made of woolen (33) polyester (27) acrylic(27) and polyurethane (13) over a thin T-shirt made of cotton (100)
4 Conclusions
Basically in this paper is shown that monitoring the ventilation and heart rate using abioimpedance system with textile electrodes placed over the clothes is possible To check thisthe designed system and a commercial device are compared and as shown in this paper bothsignals match up However it is worth mentioning that the system has been only tested in asimulation environment It is to be expected that in a real environment the lack of contactwith the textile electrodes will appear because of the vibrations and the state of the roadFurthermore the system could not work properly at an injected frequency of 625 kHz due tothe high capacitive behaviour of the interface between clothing and textile electrodes Thusalthough testing the system in a real environment or with a higher injected frequency is requiredthe results obtained in a controlled environment are encouraging
References[1] Anund A Kecklund G Peters B and Akerstedt T 2008 Driver sleepiness and individual differences in
preferences for countermeasures J Sleep Res 17 16ndash22[2] Sommer D and Golz M 2010 Evaluation of PERCLOS based current fatigue monitoring technologies Proc of
the 32th Annual Int Conf of the IEEE EMBS (Buenos Aires) 4456ndash9[3] Michail E Kokonozi A Chouvarda I and Maglaveras N 2008 EEG and HRV markers of sleepiness and loss of
control during car driving Proc of the 30th Annual Int Conf of the IEEE EMBS (Vancouver) 2566ndash9[4] Bragos R Rosell J and Riu P 1994 A wide-band AC-coupled current source for electrical impedance
tomography Physiol Meas 15 A91ndash9
XV Int Conf on Electrical Bio-Impedance amp XIV Conf on Electrical Impedance Tomography IOP PublishingJournal of Physics Conference Series 434 (2013) 012047 doi1010881742-65964341012047
4