vegetation, water and soil characteristics of the
TRANSCRIPT
Louisiana State UniversityLSU Digital Commons
LSU Agricultural Experiment Station Reports LSU AgCenter
1972
Vegetation, water and soil characteristics of theLouisiana coastal regionR H. Chabreck
Follow this and additional works at: http://digitalcommons.lsu.edu/agexp
This Article is brought to you for free and open access by the LSU AgCenter at LSU Digital Commons. It has been accepted for inclusion in LSUAgricultural Experiment Station Reports by an authorized administrator of LSU Digital Commons. For more information, please [email protected].
Recommended CitationChabreck, R H., "Vegetation, water and soil characteristics of the Louisiana coastal region" (1972). LSU Agricultural Experiment StationReports. 147.http://digitalcommons.lsu.edu/agexp/147
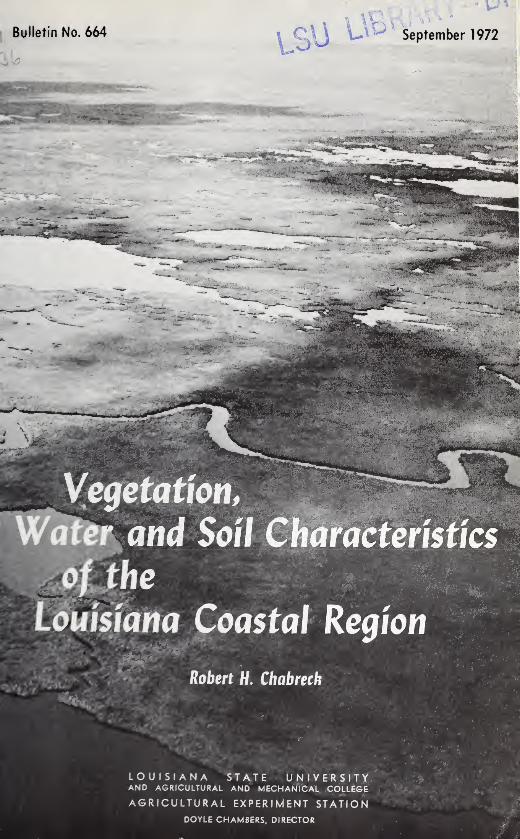

TABLE OF CONTENTS
PageLIST OF TABLES 9
LIST OF FIGURES 3
ACKNOWLEDGMENTS 4
ABSTRACT 4
INTRODUCTION 5
DESCRIPTION OF THE AREA 6
Topography g
Coastal Origin g
Soils g
Tides g
Climate jq
METHODS AND MATERIALS 12
Subdivision of the Coastal Region 12
Hydrologic Units 12
X'egetative Types 14
\'egetation Sampling I4
Soil and Water Sampling I5
Soil Analysis I5
Correction Factor I7
\\^ater Salinity Analysis I7
Surface Feature Description I7
Computing Acreages I7
Computing the Number of Ponds and Lakes 18
RESULTS Ig
Coastal Surface Features Ig
Vegetation^ I9
Natural Marshes I9
Ponds and Lakes 20
Soil and Water Summary by Plant Species 20
Soil and Water Summary by Location 20
LITERATURE CITED 7I
I
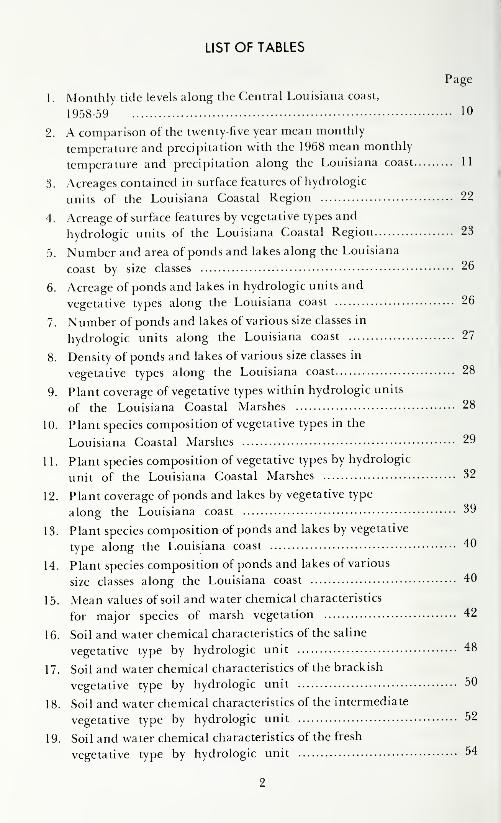
LIST OF TABLES
Page
1. Monthly tide levels along the Central Louisiana coast,
10
2. A comparison of the twenty-five year mean monthly
temr3eratin-e and precipitation with the 1968 mean monthly111temperature and precipitation along the Louisiana coast 11
3. Acreages contained in surface features of hydrologic
units of the Louisiana Coastal Region 22
4. Acreage of surf^ice features by vegetative types and
hydrologic units of the Louisiana Coastal Region 23
5. Number and area of ponds and lakes along the Louisiana
26
6. Acreage of ponds and lakes in hydrologic units and
26
7. Number of ponds and lakes of various size classes in
27
8. Density of ponds and lakes of various size classes in
28
9. Plant coverage of vegetative types within hydrologic units
28
10. Plant species composition of vegetative types in the
29
11. Plant species composition of vegetative types by hydrologic
, 32
12. Plant coverage of ponds and lakes by vegetative type
39
13. Plant species composition of ponds and lakes by vegetative
40J IT O
14. Plant species composition of ponds and lakes of various
40
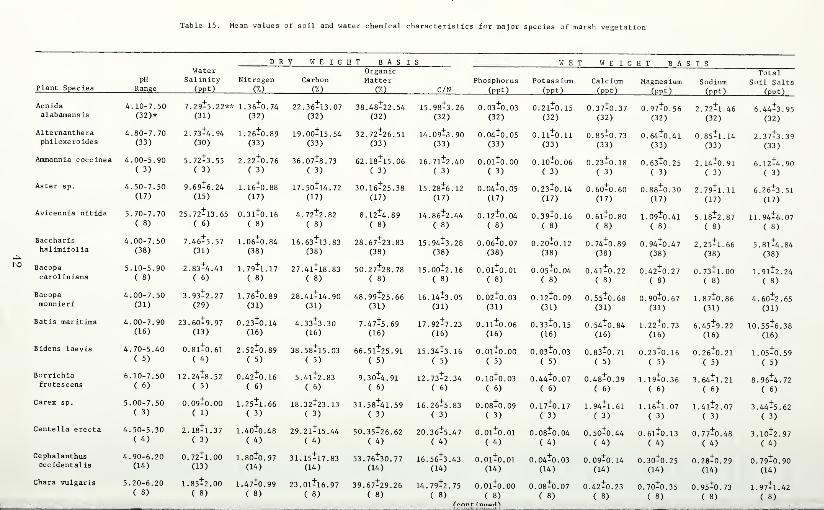
15. Mean values of soil and water chemical characteristics
42
16. Soil and water chemical characteristics of the saline
48
17. Soil and water chemical characteristics of the brackish
50
18. Soil and water chemical characteristics of the intermediate
52
19. Soil and water chemical characteristics of the fresh
54
2

20. \Vatcr salinitv (ppt) by hydrologic unit and vegetative
tvpe 57
21. Total soil salts (ppt) by hydrologic unit and\egetati\e type 58
22. Organic matter content (percent) of marsh soils by
hydrologic luiit and vegetative type 59
23. Nitrogen content (percent) of marsh soils by hydrologic
unit and \egetative t\pe 60
24. Carbon/nitrogen ratio of marsh soils by hydrologic unit
and vegetative type 51
25. Phosphorus content (ppt) of marsh soils by hydrologic
unit and vegetative type 62
26. Potassium content (ppt) of marsh soils by hydrologic
unit and vegetative type 63
27. Calcium content (ppt) of marsh soils by hydrologic
unit and vegetative type 64
28. Magnesium content (ppt) of marsh soils by hydrologic
unit and vegetative type 65
29. Sodium content (ppt) of marsh soils by hydrologic
unit and vegetative type 66
30. Soil reaction (pH) by hydrologic unit and vegetative
type 67
31. Alphabetical listing of plants included in this study 68
LIST OF FIGURES
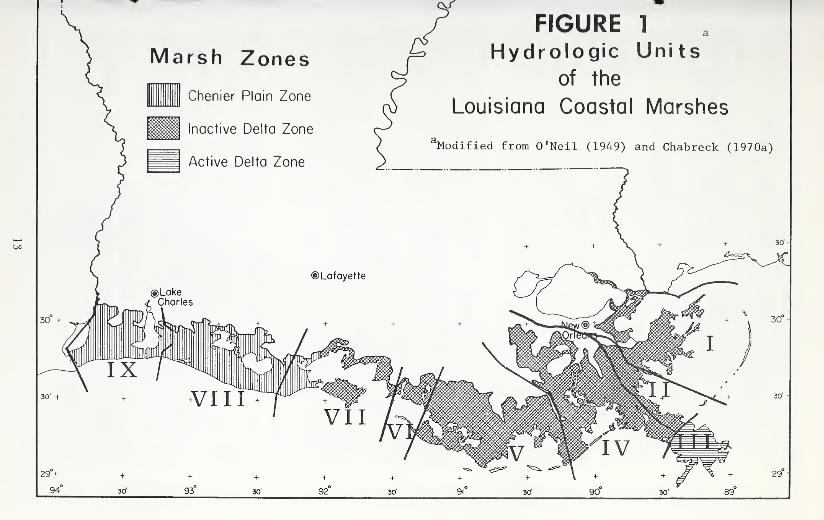
Page1. Hydrologic units of the Louisiana Coastal Marshes. 13
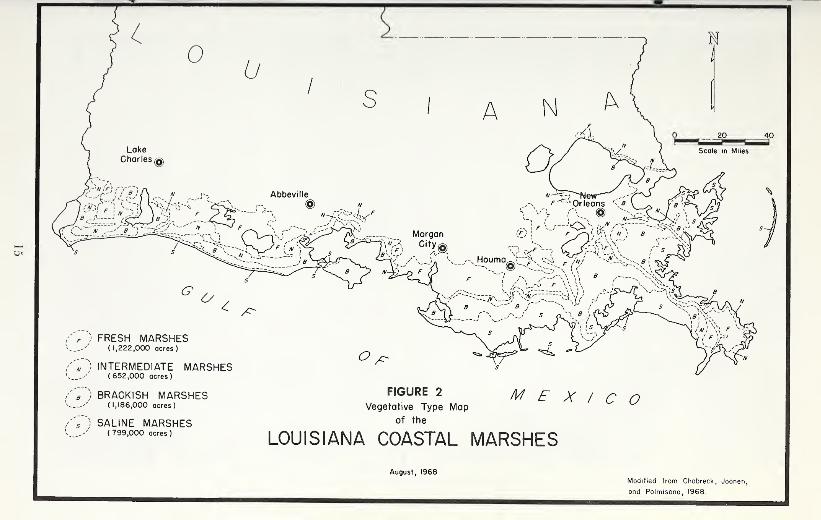
2. Vegetative type map of the Louisiana Coastal Marshes 15
3. Isohaline map of the Louisiana coast 36-37
4. Percent soil organic matter in the Louisiana Coastal
Marshes 36-37
3

ABSTRACTThe vegetation, soils, and waters were sampled in the Louisiana
Coastal Marshes in August 1968. The coastal region was subdivided
into geographical units for descriptive purposes and the vegetation,
water, and soil characteristics of each area determined. The surface
features of each subdivision including marshes, water bodies, swamp,
and dry land were measured and the area of each feature presented.
ACKNOWLEDGMENTS
This study could not have been possible without the cooperation
and assistance of various agencies and people. Mr. R. K. Yancey and
Mr. Allan B. Ensminger, Louisiana Wild Life and Fisheries Commis-
sion, were instrumental in setting up the study and providing funds.
Mr. John D. Newsom of the Louisiana Cooperative Wildlife Research
Unit provided valuable help. Dr. A. W. Palmisano, Mr. Ted Joanen,
Mr. Hugh Bateman, and Mr. David Soileau assisted in the collection of
soil samples.
The U. S. Corps of Engineers, New Orleans District, provided funds
for helicopter rental and soil analysis. Personnel of Louisiana State
University contributed a tremendous amount of time and effort to
the study. Special recognition is due Dr. Clair A. Brown, Department
of Botany, for help in plant identification and project planning, Mr.
Robert H. Brupbacher, Soil Testing Laboratory, and Dr. Prentiss
Schilling and Mr. Ray Christopher, Department of Experimental Statis-
tics, for soil and data analyses, respectively.
4

Vegetation, Water and Soil Characteristics
Of the Louisiana Coastal Region
Robert H. Chabreck^
INTRODUCTION
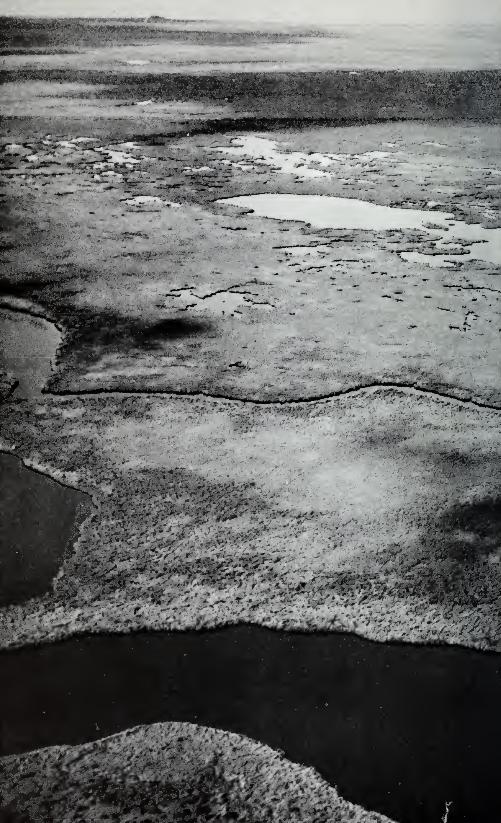
The Louisiana Coastal Region encompasses an area of almost 8
million acres. This area originated mostly from alluvial deposits of
the Mississippi River and its distributaries. Over the centuries these
deposits accumulated to form a broad, flat plain.
About one-half of the coastal region is made up of water bodies,
including ponds, lakes, bays, sounds, bayous, rivers, canals, and ditches.
Natural marshes make up about one-third of the coastal region andthe remainder consists of dry land such as beaches, cheniers, spoil
deposits, bayou and lake banks, and dewatered marshes or pump-outs.
The marshes and adjacent water bodies encompass the full coast-
line of the state and vary in width from 15 to 50 miles. Since these
marshes extend inland from the Gulf of Mexico for such great dis-
tances, widely varying environmental conditions occur.
Soil and water conditions within the coastal zone regulate plant
growth, and different environmental factors produce different plant
communities (Penfound and Hathaway, 1938). Generally, the set of
conditions in a particular area is favorable for the growth of a
number of species; and, so long as a specific environment prevails, the
species will occupy the site. However, a change in conditions will
usually result in a change in plant species (O'Neil, 1949). Chamber-lain (1957) reported that natural vegetational changes appeared to be
an adjustment of the vegetation to development of marsh soil andvariation in salinity and water levels.
The coastal marshes and estuaries are tremendous producers of
fur-bearing animals and other wildlife resources (O'Neil, 1949; St.
Amant, 1959). Cattle grazing is an important land-use practice, andthe water bodies associated with coastal marshes are well known for
their high production of marine organisms (Gunter, 1967; Chabreck,
1968).
The high animal productivity of the Louisiana Coastal Region
is directly related to the abundance and diversity of plant growth.
Photosynthetic plants are the foundation upon which the ultimate
yield of these resources rests (Palmisano, 1970), and soil and water con-
^Associate Professor of Forestry and Wildlife Management, School of Forestry and Wild-life Management, Louisiana Agricultural Experiment Station, Baton Rouge.
5
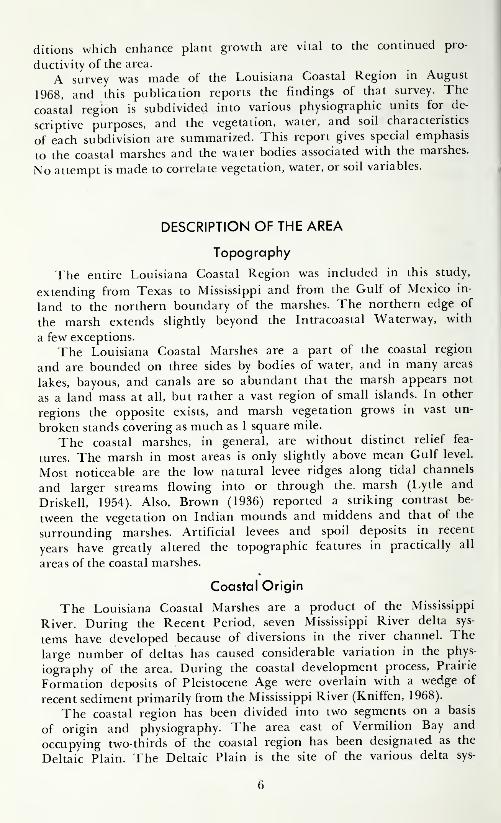
ditions which enhance plant growth are vital to the continued pro-
ductivity of the area.
A survey was made of the Louisiana Coastal Region in August
1968, and this publication reports the findings of that survey. The
coastal region is subdivided into various physiographic units for de-
scriptive purposes, and the vegetation, water, and soil characteristics
of each subdivision are summarized. This report gives special emphasis
to the coastal marshes and the water bodies associated with the marshes.
No attempt is made to correlate vegetation, water, or soil variables.
DESCRIPTION OF THE AREA
Topography
The entire Louisiana Coastal Region was included in this study,
extending from Texas to Mississippi and from the Gulf of Mexico in-
land to the northern boundary of the marshes. The northern edge of
the marsh extends slightly beyond the Intracoastal Waterway, with
a few exceptions.
The Louisiana Coastal Marshes are a part of the coastal region
and are bounded on three sides by bodies of water, and in many areas
lakes, bayous, and canals are so abundant that the marsh appears not
as a land mass at all, but rather a vast region of small islands. In other
regions the opposite exists, and marsh vegetation grows in vast un-
broken stands covering as much as 1 square mile.
The coastal marshes, in general, are without distinct relief fea-
tures. The marsh in most areas is only slighdy above mean Gulf level.
Most noticeable are the low natural levee ridges along tidal channels
and larger streams flowing into or through the. marsh (Lytle and
Driskell, 1954). Also, Brown (1936) reported a striking contrast be-
tween the vegetation on Indian mounds and middens and that of the
surrounding marshes. Artificial levees and spoil deposits in recent
years have greatly altered the topographic features in practically all
areas of the coastal marshes.
Coastal Origin
The Louisiana Coastal Marshes are a product of the Mississippi
River. During the Recent Period, seven Mississippi River delta sys-
tems have developed because of diversions in the river channel. The
large number of deltas has caused considerable variadon in the phys-
iography of the area. During the coastal development process, Prairie
Formation deposits of Pleistocene Age were overlain with a wedge of
recent sediment primarily from the Mississippi River (Kniffen, 1968).
The coastal region has been divided into two segments on a basis
of origin and physiography. The area east of Vermilion Bay and
occupying two-thirds of the coastal region has been designated as the
Deltaic Plain. The Deltaic Plain is the site of the various delta sys-
6

terns. The area west of Vermilion Bay has been named the ChenierPlain and was formed from river sediment swept westward by long-shore currents in the Gulf of Mexico (Coleman. 1966).
Over a period of some 8,000 years the Mississippi River has al-
tered its course periodically, forming new deltas with each move. Whenviewed at the present time, older deltas show less rate of change thanthe younger deposits. The older deltas, having had more time forcompaction, subsidence, and wave modification, show greater stability(Morgan and Larimore, 1957).
Continuous subsidence over a long period of years has modified theolder deltas so that original deposits are far below sea level. BretonSound, Chandeleur Sound, Barataria Bay, and Timbalier Bay are typi-cal areas which were formerly marshes on the outer reaches of deltasbut were lost because of subsidence. O'Neil (1949) described such wa-ter bodies as drowned marsh. Within the same delta system submergenceof original deposits has also taken place further inland. However, sub-sidence is less noticeable here because of the extensive floatingmarshes which have developed (Russell, 1942).
The developmental process of the Chenier Plain was considerablydifferent from that of the Deltaic Plain. Silt and clay sediment fromthe Mississippi River was carried westward by currents in the Gulfof Mexico and gradually accumulated as mud flats against the shore-line. The amount of material carried and the duration of flow deter-mined the extent of the buildup. The mud flats soon became occupiedby salt-tolerant vegetation and new marsh was thus created (Coleman1966).
The building process in the Chenier Plain continued until a changein the river's course resulted in a loss of sedimentary material. Once thebuilding process ceased, the new marsh came under attack by waveaction. Shoreline retreat then followed, with a corresponding forma-tion of local beach deposits. The beach deposit remained along thepoint of wave attack until another change in course caused a resump-tion in the buildup along the shoreline. This process caused the marshesto again advance seaward, leaving the beaches stranded (Russell andHowe, 1935).
The stranded beaches, or cheniers as they are termed locally, extendin an east-west direction and have a strategic role in the drainage pat-terns of the Chenier Plain. In contrast, topographic features of theDeltaic Plain, such as the natural levees of past and present drainagesystems, generally run in a north-south direction.
O'Neil (1949) used the term Prairie Marshes in describing themarshes of the Chenier Plain in Southwestern Louisiana and char-acterized the area as being poorly drained and having shallow peat soils.
He classified the marshes of the Deltaic Plain as Delta Marshes and Sub-delta Marshes and stated that the basic geology of the areas wassimilar. Noticeable differences occurred, however, in the plant com-munities of the two areas as a result of subsidence, peat deposits, andsalinity. The marshes of the Deltaic Plain are referred to as marsh
7

zones (Chabreck, 1970) and termed Inactive Delta Marsh Zone and
Active Delta Marsh Zone (Figure 1).
The Active Delta Marsh Zone, which consists of the present Missis-
sippi River Delta, is greatly influenced by the vast amount of fresh
water supplied by the river and its distributaries. Daily tidal action in
the older Inactive Delta Marsh Zone and the absence of a sizeable fresh
water flow resulted in saline conditions over a large portion of the area.
Soils
The coastal marsh soils are generally classified as peats, mucks, and
clays with all occurring in various proportions. The dominant morpho-
logical characteristics are the dark brown and black colors of the peats,
mucks, and organic clays, and the gray colors associated with water-
logged, reduced soil conditions (Lytle, 1968).
The soil materials are silts, silty clays, and clays of recent alluvial
origin, plus marine silts and clays, overlain at various locations by peats
and mucks (Lyde and Driskell, 1954). The depth of the orgamc soil is
determined by the amount of subsidence and the vegetative history of a
particular area. According to Russell (1942), the organic layer has been
found at depths ranging from a few inches to 20 feet.
The organic soils are classified on a basis of the stage of decomposi-
tion. Dachnowski-Stokes (1940) classified peat as soil which has a brown
or black color and contains plant parts only partially decomposed and
generally with over 50 percent organic matter. Mucks are usually black
or dark gray and contain organic material which is finely divided and
well decomposed with none of the plant parts identifiable. The organic
content of muck usually ranges from 15 to 50 percent, and soils with
less than 15 percent organic matter are classified as mineral soil.
Tides
The tidal cycle in the coastal areas of Louisiana is controlled largely
by tides in the Gulf of Mexico, although local conditions have some
influence. As in most large bodies of water, the dynamics of tides
in the Gulf of Mexico is a complicated problem. The irregular shape
of its basin and connections with the Atlantic Ocean and Caribbean Sea
cause co-oscillation with the tidal movements in those bodies of water
(Marmer, 1954).
At any location the tides not only vary in range from day to day, but
also from month to month and year to year. The changes in range and
character of tides are influenced primarily by changing positions of
the moon in relation to the earth and sun, with different localities re-
sponding in a different fashion. The tidal cycle follows the moon cycle
with two principal types of fluctuations, the daily tide and the semidaily
tide. According to Marmer (1954), the fluctuations occur at intervals
with an average length of 24 hours and 50 minutes along the northern
Gulf coast.
Gunter (1967) reported that at the beginning of the cycle tides are
8

normally the daily type with one maximum and one minimum eachday. The maximum fluctuation is 26 inches, which occurs only oncea month. Then, every succeeding day it declines slightly until thevariation is only 2 or 3 inches a day with the tide standing a littleabove mean low. This is further complicated by a changeover to semi-daily tides during the period of small fluctuations. The semidailytides have two high waters and two low waters in a tidal day, with aninterval between highs of about 12 hours and 30 minutes (Marmer1954).
The periodic rise and fall of the tide is subject to the effects of chang-ing weather conditions. Changing meteorological conditions may changethe level of the water from which the tides rise and fall, altering boththe time of occurrence and the levels of high and low tides. With strongsoutherly winds, Gulf waters will pile up along the Louisiana coastand move inland through the many bays, bayous, and canals. Periodswith prolonged winds frequently result in inundation of the marshes.The depth of flooding is determined by the duration and velocity ofthe winds, the elevation of the marsh, and its distance from the Gulf.Extremely high tides are associated with tropical storms and hurri-canes, and tide water may be pushed inland for considerable distances.
During the winter strong northerly winds have an opposite effect,and at times tides as low as 2 feet below normal are not uncommon.Marshes drained by tidal channels will be practically dry at such times.Channel size determines the rate of water exchange, and interior marshesconnected to the Gulf by large channels are influenced to a greaterextent by tides than marshes with small drainage systems. Gunter (1967)reported that heavy local rainfall would raise water levels in back baysand other coastal areas having slow drainage. Such rains have a slightdisturbance on tide levels, but the effects are only temporary. Accordingto Nichols (1959), periods of high water during rainy seasons in ad-jacent upland areas may curtail the tidal effect in the marsh streamsuntil the freshwater level is lowered to that of the current high tidelevel.
A study of tide levels along the central Louisiana coast at MarshIsland by Chabreck and Hoffpauir (1962) revealed considerable monthlydifferences in mean tides. During the period included, 1958 and 1959,the area was not influenced by tropical storms or hurricanes; therefore,the tide levels as shown in 1 able I could be considered normal. The datawere collected using continuous water level recorders and showed thattides ranged from a mean high of 1.26 feet above sea level in Septemberto a mean low of minus 0.62 foot in December. The mean tide levelover the 24-month period was 0.43 foot above sea level. Normal marshelevations on the Chenier Plain average about 1 foot above sea level(Nichols, 1959), and because of subsidence, elevations on the DeltaicPlain average even less. Although normal high tides commonly in-undate the marshes, mean marsh levels are several inches above meantide levels, thus favoring the growth of emergent vegetation.
9

Table 1. Monthly tide levels along the Central Louisiana coast,
1958-59^
Mean
Month
JanuaryFebruaryMarchAprilMayJuneJulyAugustSeptemberOctoberNovemberDecember
MeanLow
MeanWater
Highest Lowest
Individual Individual
Annual
Ti rip Tide Level Tide Tide
, 39 -.35 .02 1.5 -2.0
.56 -.26 .15 1.6 -1.8
.60 -.18 .21 1.3 -1.5
.78 .09 .43 1.2-7
- . /
1.13 .40 .76 2.4 - .7
1.19 .18 .69 1.7 - .7
.83 -.06 .39 1.5 -1.0
.83 .11 .47 1.6 - .8
1.26 .69 .97 2.6 - .2
1.06 .39 .72 1.8 - .5
.85 .07 .46 1.5 -2.1
.37 -.62 -.12 1.4 -2.2
.82 .04 .43 2.6 -2.2
'From Chabreck and Hoffpauir, 1962.
Climate
The climate along the Louisiana coast is influenced greatly by
its subtropical latitude and its proximity to the Gulf of Mexico. Themarine tropical effect results from the fact that the average water tem-
perature of the Gulf along the Louisiana shore ranges from 64° F
in February to 84° F in August (Sanders, 1959). Prevailing southerly
winds in summer provide moist, semitropical weather and frequently
produce afternoon thundershowers. Whenever westerly or northerly
winds interrupt the prevailing moist conditions during the summer,
hotter and dryer weather results. During the winter the state is sub-
jected to alternating cold continental air and warmer tropical air, caus-
ing drastic variations in climatic conditions.
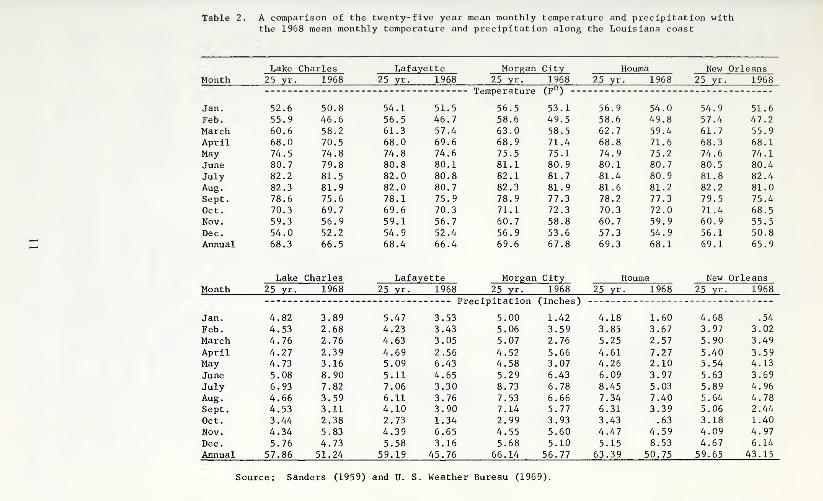
The mean monthly temperature, as shown in Table 2, is lowest in
January and highest in August. Mean temperatures vary only slightly
going from west to east across the state. The mean temperature in the
spring and summer of 1968, prior to this study, compared favorably
with the 25-year average. Temperatures in February averaged about
9° F below normal; otherwise, monthly temperature averages in 1968
were within 2° of the 25-year average. According to Kniffen (1968)
the growing season along the Louisiana coast, or the period between
the last freeze in the spring and the first in the fall, averages 317 days.
The Louisiana coast generally has an abundance of rainfall, with
annual averages ranging from 57.86 inches at Lake Charles to 66.14
inches at Morgan City (Table 2). The rainfall is fairly well distributed
throughout the year, with the maximum occurring in July and the
10
o
n•H
cOhJ
0)
0)
^4
3uC8
aoc
<U
0
i-
CO
0)
co
J=
CO
ucoa
eo
c<D
to
aeuCOcCO
<u
)-l
3>
CO;j
1(U
aiJ
eC
o<u
+J
30)^
j=u
uco
oc
CCO
o(1)
CO
e•H
C»vD
iI—
1
0)
x:
00
•HUcCOo
00vO
0)ON
4-1
0)
CO
IMCO
ij
>•
m
voc>j<3Nr-)i—i<3-<ro<fLnLnoooN
c3N<ri^rovDLnoocMm<t-ON.-i^
000<r^CMr^CTNCNlCOOONON,—
I
ON
>sD
1^
00
ON
<j-vo
CO
CO
CO
r-imLn-<r'— ionp^oncocooovooo
4J
uOvOOCTnuOi—l^-^coO^I—(r^ONvO
Lnr^<tvOvOr-ioo^r>»ONcor^<t<f
.-(incooooooooi-ivOi-iON<)-
>1
-uCO
inu
00
100
m00
00m
ON
vo
r>.
<3NCMm
CO00
1ON
00
ON
oCM
ON
,H
00
CO
CO
COvO
(UvO
100
cn
r-lON
00m
t-HCO
00
CM
(UON
1o
00o
1—1
I—
1in
ON
eg
vO
I-lON
r-l
1m
m00
00
vomm
vO
urH
1CO
CM
CM
CM
CO
00
1^
CO
00
CMm
<!
r-l
uCO
mCO
43U
o1
C3NvOom
CM
CO
vO
CO
COo
CO
^1
CM
CO
vO
1^
CO
00
CO
VO
CO
<t
-vfvO
VO
>1
CO
100m
CM
oON
vo
in
<r
CO
00
CO
1CNJ
ino
00
<ro
CM
CS
00O
ON
Cl-00
h3
LTl
1inm
vO
vO
00
00
00
r>.
min
vO
in
1o-
<}•<h
<!
mvO
<f
<j-CO
<f
in
r».
Csl
CM
in
t-H
i-t
J=
t-l
CO
J2
x:
r-t
CO
•H
<u
'U
'4J
u•H
f>N
•4J
..
3c
GJ3
M,-1M
Cl,
4-1>
oi
u>-l
st>0O.
4-1>
CJ
oCO
0)
COa
CO3
33
0)
<Jo
<u
oCO
<U
COa
CO
33
3QJO
O<u
15
S^<S
'^
>-5<
cnO
13Q
cocoCO<fCO<h<t-CMi-l<fvOCO
oor^o
o<j-cooN<)-«ooocjNr^Ln
vOONON<fLnvOOOvOOi—lOvDvO
<)-coLnininLninminco<t-<tON
I—icocNi^cMcomr^co
ininin<t-<}-inoor^r^cM<d-invo
in<f-<j->*ininr^vo<tcM<i-in<J>
11
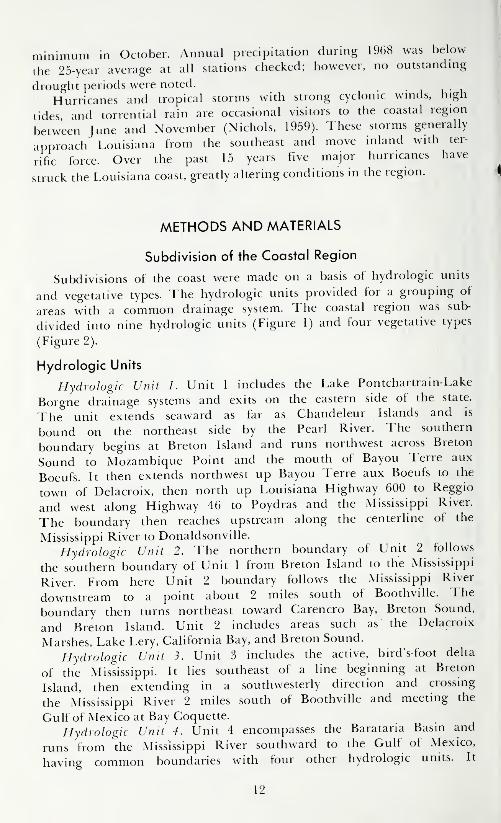
minimum in October. Annual precipitation during 1968 was below
the 25-year average at all stations checked; however, no outstandmg
drought periods were noted.
Hurricanes and tropical storms with strong cyclonic wnids, high
tides and torrential rain are occasional visitors to the coastal region
between June and November (Nichols, 1959). These storms generally
approach Louisiana from the southeast and move inland with ter-
rific force. Over the past 15 years five major hurricanes have
struck the Louisiana coast, greatly altering conditions in the region.
METHODS AND MATERIALS
Subdivision of the Coastal Region
Subdivisions of the coast were made on a basis of hydrologic units
and vegetative types. The hydrologic units provided for a grouping of
areas with a common drainage system. The coastal region was sub-
divided into nine hydrologic units (Figure 1) and four vegetative types
(Figure 2).
Hydrologic Units
Hydrologic Unit 1. Unit 1 includes the Lake Pontchartrain-Lake
Borgne drainage systems and exits on the eastern side of the state.
The unit extends seaward as far as Chandeleur Islands and is
bound on the northeast side by the Pearl River. The southern
boundary begins at Breton Island and runs northwest across Breton
Sound to Mozambique Point and the mouth of Bayou Terre aux
Boeufs. It then extends northwest up Bayou Terre aux Boeufs to the
town of Delacroix, then north up Louisiana Highway 600 to Reggio
and west along Highway 46 to Poydras and the Mississippi River.
The boundary then reaches upstream along the centerline of the
Mississippi River to Donaldsonville.
Hydrologic Unit 2. The northern boundary of Unit 2 follows
the southern boundary of Unit 1 from Breton Island to the Mississippi
River. From here Unit 2 boundary follows the Mississippi River
downstream to a point about 2 miles south of Boothville. The
boundary then turns northeast toward Carencro Bay, Breton Sound,
and Breton Island. Unit 2 includes areas such as the Delacroix
Marshes, Lake Lery, California Bay, and Breton Sound.
Hydrologic Unit 3. Unit 3 includes the active, bird's-foot delta
of the Mississippi. It lies southeast of a line beginning at Breton
Island, then extending in a southwesterly direction and crossing
the Mississippi River 2 miles south of Boothville and meeting the
Gulf of Mexico at Bay Coquette.
Hydrologic Unit 4. Unit 4 encompasses the Barataria Basin and
runs from the Mississippi River southward to the Gulf of Mexico,
having common boundaries with four other hydrologic units. It
12
13

borders Unit 1 along its northern side, Unit 2 along its eastern side
and Unit 3 at its southeastern corner. Bayoti Lafourche forms the
western boundary of Unit 4 and separates it from Unit 5.
Hydrologic Unit 5. Unit 5 has the largest marsh area and extends
from Bayou Lafourche westward to the east levee of the Atchafalaya
River. It includes numerous large bays such as Timbalier Bay,
Terrebonne Bay, Caillou Bay, and Four League Bay, plus vast
marsh areas draining into the bays.
Hydrologic Unit 6, Unit 6 is the smallest hydrologic unit and
includes primarily the marsh area between the Atchafalaya River
and Wax Lake Outlet.
Hydrologic Unit 7. Unit 7 includes Marsh Island, Vermilion Bay,
West and East Cote Blanche Bays, and the marsh areas surrounding
these bays. The eastern boundary of Unit 7 is Wax Lake Oudet. The
western boundary lies along a line beginning at the Gulf of Mexico
in Vermilion Parish about 5 miles west of the mouth of Freshwater
Bayou Gulf Outlet. From this point the line follows a northeasterly
direction to the Schooner Bayou Control Structure and the Vermilion
Locks, then north from the locks to the northern boundary of the
coastal marsh..
Hydrologic Unit 8. Unit 8 encompasses the Mermentau Basin,
which includes the Mermentau River, Grand Lake, White Lake, and
the associated marshes. Along its eastern side it shares a common
boundary with Unit 7. Its western boundary begins at the Gulf of
Mexico at a point 5 miles west of the Mermentau River, then runs
north to Louisiana Highway 27. The boundary then follows Highway
27 east and north to the Intracoastal Waterway, then west along the
Intracoastal Waterway to the Calcasieu Locks.
Hydrologic Unit 9. Unit 9 lies principally in the western half of
Cameron Parish and includes the marshes drained by the Calcasieu
River and the Sabine River. Its eastern boundary coincides with the
western boundary of Unit 8. Its western boundary follows the Louis-
iana State Line in the Sabine River and Sabine Lake.
Vegetative Types
The Louisiana Coastal Marshes were subdivided into four vegeta-
tive types on a basis of the classification reported by Penfound and
Hathaway (1938). The vegetation present along the transect lines
was used in establishing the boundaries of the various types. The
vegetative types (saline, brackish, intermediate, and fresh) follow a
general east-west direction, parallel the coast, and are shown on a
map (Figure 2) prepared by Chabreck, Joanen, and Palmisano (1968).
Vegetation Sampling
Vegetation was sampled in the Louisiana Coastal Marshes in
August 1968. Samples were taken along 39 north-south transect lines
equally spaced at 7.5 minutes of longitude along the coast. Two
14
15

helicopters were employed for transportation, and vegetation esti-
mates were made at 0.25-mile intervals along each transect line while
hovering above the station. Landings were made at 2-mile intervals
for collecting soil and water samples and for making ground measure-
ments of the vegetation. A modification of the line-intercept method
as described by Canfield (1941) was used for vegetation sampling.
Soil and Water Sampling
Soil and water samples were taken in August 1968 at 2-mile
intervals along the transect lines and also in special areas not included
by the routine landings. Soil samples were taken at depths ranging
from the surface to 12 inches. This depth included the root zone for
practically all marsh plants in the coastal area. Water samples were
taken from free soil water.
Approximately 1 quart of soil was collected from each station and
placed in a plastic bag. The plastic bag was then inserted inside a
cloth bag to minimize the danger of accidental breakage. Water samples
were collected and transported in 1 -ounce glass jars. The station
number was written on the bag for identification and the samples
were stored in refrigeration at 35° F during the interval between
collection and drying.
Soil Analysis
During the study 391 soil samples were collected in the coastal
area for chemical analysis. Prior to the analysis each sample was
weighed, air-dried, then reweighed to determine the original moisture
content. The samples were dried at normal air temperature. Because
of an extremely high moisture content, drying required several weeks.
The dried samples were analyzed by the Louisiana Soils Testing
Laboratory at Louisiana State University. Tests included in the
analysis were those for soil reaction (pH), total salts, phosphorus,
potassium, calcium, magnesium, sodium, nitrogen, and carbon. Most
analytical methods used are described in a bulletin by Brupbacher,
Bonner, and Sedberry (1968).
The phosphorus concentrations of the soil samples were deter-
mined by colorimetric analysis (Stannous Chloride Reduction Method),
as described by Page (1965). The phosphorus concentration was
determined with a spectrophotometer which measured the intensity of
blue color developed by the selective reduction of the phosphomolybid
complex in an acid medium.
Organic carbon in the soils was determined by the dry combustion
method described by Allison, Bollen, and Moodie (1965). A 0.15-
gram sample of soil was transferred to a ceramic boat^ and placed
in a combustion tube which had been preheated to 950° C. Purified
oxygen was passed through the system in the presence of a platinum
catalyst to convert the carbon evolved from the soil sample to
carbon dioxide. The carbon dioxide gas was absorbed in pre-weighed
16
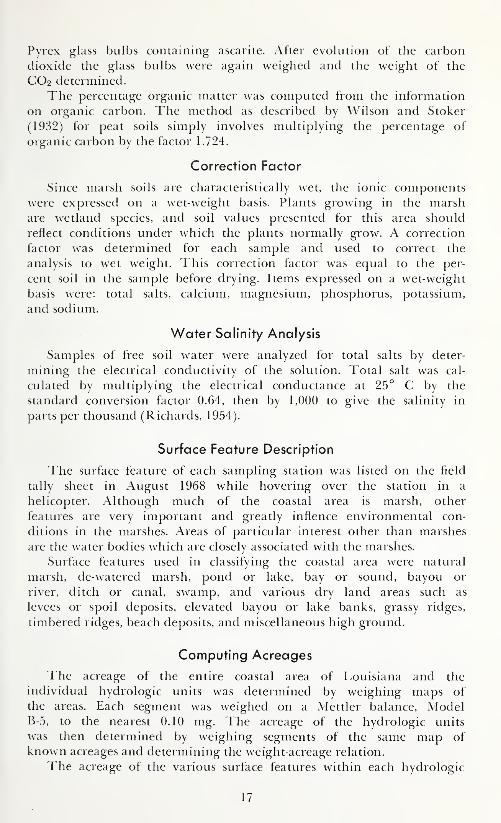
Pyrex glass bulbs containing ascarite. After evolution of the carbon
dioxide the glass bulbs were again weighed and the weight of the
CO2 determined.
The percentage organic matter was computed from the information
on organic carbon. The method as described by Wilson and Stoker
(1932) for peat soils simply involves multiplying the percentage of
organic carbon by the factor 1.724.
Correction Factor
Since marsh soils are characteristically wet, the ionic componentswere expressed on a wet-weight basis. Plants growing in the marshare wetland species, and soil values presented for this area should
reflect conditions under which the plants normally grow. A correction
factor was determined for each sample and used to correct the
analysis to wet weight. This correction factor was equal to the per-
cent soil in the sample before drying. Items expressed on a wet-weight
basis were: total salts, calcium, magnesium, phosphorus, potassium,
and sodium.
Water Salinity Analysis
Samples of free soil water were analyzed for total salts by deter-
mining the electrical conductivity of the solution. Total salt was cal-
culated by multiplying the electrical conductance at 25° C by the
standard conversion factor 0.64, then by 1,000 to give the salinity in
parts per thousand (Richards, 1954).
Surface Feature Description
The surface feature of each sampling station was listed on the field
tally sheet in August 1968 while hovering over the station in a
helicopter. Although much of the coastal area is marsh, other
features are very important and greatly inflence environmental con-
ditions in the marshes. Areas of particular interest other than marshes
are the water bodies which are closely associated with the marshes.
Surface features used in classifying the coastal area were natural
marsh, de-watered marsh, pond or lake, bay or sound, bayou or
river, ditch or canal, swamp, and various dry land areas such as
levees or spoil deposits, elevated bayou or lake banks, grassy ridges,
timbered ridges, beach deposits, and miscellaneous high ground.
Computing Acreages
The acreage of the entire coastal area of Louisiana and the
individual hydrologic units was determined by weighing maps of
the areas. Each segment was weighed on a Mettler balance, ModelB-5, to the nearest 0.10 mg. The acreage of the hydrologic units
was then determined by weighing segments of the same map of
known acreages and determining the weight-acreage relation.
The acreage of the various surface features within each hydrologic
17

unit was determined from the field data. The percentage frequency
with which the stations occurred in each surface feature was used as
the factor for computing acreages in the hydrologic unit involved.
Computing the Number of Ponds and Lakes
Surface features were checked and classified at 7,127 stations along
the Louisiana coast. The percentage frequency of stations occupied by
ponds and lakes was multiplied by the total acreage of the area
sampled to calculate the total acreage of ponds and lakes. The size
of the area sampled was 7,823,386 acres (Chabreck, 1970).
The acreage of ponds and lakes in the coastal area was also
calculated by size classes. This was done by first determining the
percentage frequency of ponds in each size class and multiplying
the percentage value by the total acreage in ponds and lakes. The
values obtained were the total acreages in ponds and lakes of
different size classes. Ten size classes were used; they ranged from ponds
less than 0.01 acre to lakes larger than 64,000 acres.
The number of ponds and lakes in each size class was computed
from the total acreage. In this procedure the acreage of each size
class was divided by the mid-point value of the size class.
RESULTS
Coastal Surface Features
The acreages of the various hydrologic units are shown in Table 3.
The total acreage of the Louisiana Coastal Region was 7,823,386
acres, according to the study. This included both land and water
areas. Of this amount, natural marshes made up 2,459,555 acres, or
slighdy less than one-third of the area. The brackish and fresh vegeta-
tive types were of about equal size, making up a total of 61 percent
of the natural marshes. The saline vegetative type made up 25
percent and the intermediate comprised only 14 percent of the marsh
area.
The acreage of the various surface features of each hydrologic
unit is shown by vegetative type in Table 4.
Hydrologic Unit 1 was the largest (Table 3); however, a great
portion of this was taken up by water bodies such as Chandeleur
Sound, Lake Pontchartrain, and Lake Borgne. The largest area of
natural marshes was found in Hydrologic Unit 5, which included
the Terrebonne Parish marshes. Hydrologic Units 4 and 8 also encom-
passed large areas of natural marsh.
Almost one-fourth of the entire coastal area consisted of ponds and
lakes (Table 3). Ponds and lakes were classified into 10 size classes,
and all size classes were well represented (Table 5). A general increase
in total acreage occupied was noted with each increase in size class.
The study revealed a total of 5.3 million ponds and lakes in
18

the coastal area (Table 5). Of these, over one-half were less than O.OIacre in size. 1 he number of ponds and lakes decreased with increasesin size classes. An interesting point in this regard was that the ponds0.01 to 0.1 acre in size outnumbered those less than 0.01 acre insize in Hydrologic Units 7, 8, and 9 (Table 7). These hydrologicunits occupy the western portion of the Louisiana coast and includethe Chenier Plain. The acreage of ponds and lakes varied greatlybetween units, with Hydrologic Unit 1 having the largest acreage(Table 6).
The brackish vegetative type had the greatest density of pondsand lakes (Table 8). This type exceeded the others in practically allpond and lake size classes on a per unit area basis. The fresh typeranked second and the saline type had the lowest density of pondsand lakes.
Vegetation
Plant coverage and plant species composition were determined forthe natural marshes and for ponds and lakes of the coastal region.
Natural Marshes
Plant coverage refers to the degree to which a marsh is coveredwith vegetation, and is shown for each vegetative type and hydrologicunit in Table 9. In general, fresh marshes had the highest plantcoverage, with the exception of the saline type in Hydrologic Units 8and 9 and the intermediate type in Unit 3.
A total of 118 species of vascular plants were found at samplingpoints along the transect lines. The species present in greatestamounts were Spartina patens, making up one-fourth of the vegetationin the coastal marshes. Other major species were Spartina alterniflora,Panicum hemitomon, Distichlis spicata, and Sagittaria falcata.
The species composition was determined for the four vegetativetypes (Table 10). The saline vegetative type was dominated by Spartinaalterniflora along with Distichlis spicata, Juncus roemerianus, andSpartina patens. The major species in the brackish and intermediatevegetative types was Spartina patens. Distichlis spicata was alsoabundant in the brackish type and Phragmites communis and Sagittariafalcata in the intermediate type. The fresh vegetative type included93 species, with Panicum hemitomon being dominant. Other majorfresh marsh plants were Sagittaria falcata, Eleocharis sp., and Alter-nant hera philoxeroides.
The species composition was . also determined by vegetative typefor each hydrologic unit (Table 11). The species listed are thosemaking up 1.0 percent or more of the plants present. Species com-prising less than 1.0 percent were grouped under "other species."All species encountered during the study and their percent composi-tion of the vegetative types are shown in Table 10.
19

Ponds and Lakes
Percent plant coverage of pond and lake bottoms was inversely
proportional to water salinity (Table 12). Ponds and lakes of the
fresh vegetative type had the greatest plant coverage, followed by the
intermediate, brackish, and saline types in descending order. No
vegetation was found in ponds and lakes sampled in the saline vege-
tative type. Likewise, no vegetation was found in any lake greater than
3,200 acres in size.
Thirty species of vascular plants were found at the sampling
stations in ponds and lakes. In addition, an alga, Chara vulgaris,
was included because of its abundance and use as food by waterfowl.
As with plant coverage, the number of species was inversely related
to water salinity. Of the 31 species encountered, 29 were found in the
fresh vegetative type, 10 in the intermediate, 6 in the brackish, and
none in the saline (Table 13).
A brackish water species, Riippia maritima, was the dominant
plant along the entire Louisiana coast in ponds and lakes. Other
major species were Lemna minor, Myriophyllym spicatum, Chara
vulgaris, Ceratophyllum demersum, and Eleocharis parvula (Table 13).
The plant species composition of ponds and lakes of different size
classes is shown in Table 14. A comparison of the number of plant
species by pond size shows that the 1- to 10-acre size class contained
the greatest number of species. The number of species declined pro-
gressively both below and above this class.
Lakes larger than 1 square mile in size usually contained few
plants. Several of the larger lakes, such as Lake Pontchartrain,
contained aquatic plants in the shallow water around the shoreline.
However, no plants occurred at the sample stations, indicating a very
narrow distribution. Additional information on ponds and lakes of the
Louisiana Coastal Region and their value to fish and wildlife are
presented in a separate report (Chabreck, 1971).
Soil and Water Summary by Plant Species
The plant species present at each soil and water sampling station
were recorded on the tally sheet. The conditions under which each
species was growing was determined by summarizing the soil and
water variables at stations where each species occurred.
Only species which occurred at three or more sampling stations
were included in this summation. Of the 118 species encountered
along the transect lines, 83 met this requirement. The results of this
segment of the investigation are listed in Table 15.
Soil and Water Summary by Location
The results of the soil and water analyses are shown in Tables 16
through 30 and are grouped by hydrologic unit and vegetative type.
The values for all variables measured are shown for each hydrologic
unit by vegetative type in Tables 16 through 19. The values for
20

individual variables are summarized by vegetative types and hydroloeicunits in Tables 20 through 30.
Two principal factors affecting plant distribution and growth aresalinity and soil organic matter (Palmisano and Chabreck, 1972). Watersalinity and total soil salts were greatest at the Gulf of Mexico anddecreased inland (Figure 3); however, soil organic matter was lowestalong the coasdine and increased inland (Figure 4).
Plant nutrients were highest in the saline vegetative type anddecreased inland, with lowest concentrations in the fresh type. Calciumwas the only nutrient that exhibited only small differences betweenvegetative types. Soil reaction (pH) was slightly lower in the freshvegetative type.
21

Table 3. Acreages contained in surface features of hydrologic
units of the Louisiana Coastal Region
Hydrologic Unit
Surface Feature
Acres
Marshes :
Natural marsh 261,198 143,850 81,738 469,311 583,101
De-watered marsh 18,300 2,373 - - 27,748 18,226
Water Bodies:
Ponds and lakes 603,306 49,517 95,391 292,056 228,390
Bays and sounds 1,019,066 212,260 122,625 108,841 320,082
Bayous and rivers 26,040 5,888 17,004 43,795 16,965
canals and ditches 9,234 7,075 12,476 5,198 9,365
Swamp 15,419 22,853
DryLand-^ 263,835 27,108 27,234 327,428 202,172
TOTAL 2,200,979 448,071 356,468 1,289,796 1,401,154
Hydrologic Unit
Surface FeatureTotal
Acres
Marshes
:
Natural marsh 40,554 271,087 396,353 212,362 2,459,554
De-watered marsh - - 4,511 54,773 39,858 165,789
Water Bodies:
Ponds and lakes 20,825 33,904 230,747 228,552 1,782,688
Bays and sounds 64,668 332,127 - - - " 2,179,669
Bayous and rivers 3,288 4,781 4,174 3,262 125,197
canals and ditches 1,095 5,328 3,849 3,855 57,475
21,920 8,256 - - - - 68,448
4,383 54,204 26,456 51,746 984,566
156.733 714 .198 716.352 53 9.635 7.823,386
^Includes active beaches, cheniers ,spoil deposits, ridges and elevated
bayou and lake banks.
Swamp
Dry Land
TOTAL
22
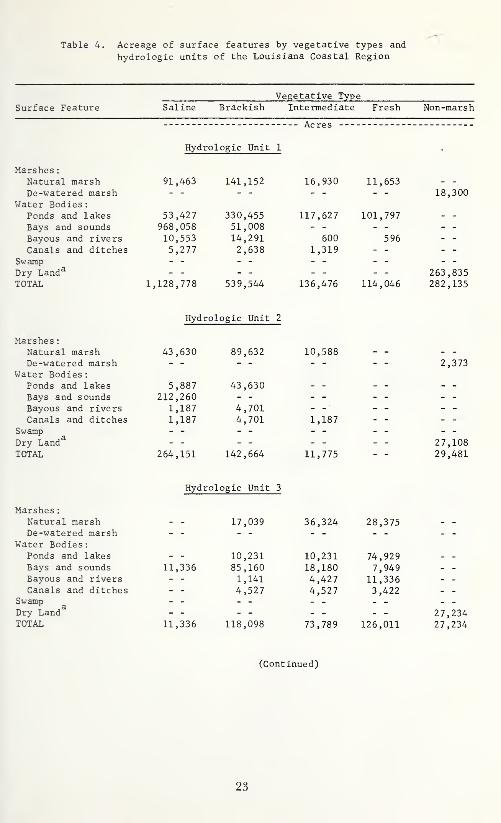
Table 4. Acreage of surface features by vegetative types and
hydrologic units of the Louisiana Coastal Region
Vegetative TypeSurface Feature Saline Brackish Intermediate Fresh Non-marsh
Acres
Hydrologic Unit 1
Marshes
:
Natural marsh 91,463 141,152 16,930 11,653 - -
De-watered marsh -- -- -- -- 18,300Water Bodies
:
Ponds and lakes 53,427 330,455 117,627 101,797 - -
Bays and sounds 968,058 51,008Bayous and rivers 10,553 14,291 600 596 - -
Canals and ditches 5,277 2,638 1,319Swamp - - -- -- - - - -
Dry Land^ - - - - - - - - 263,835TOTAL 1,128,778 539,544 136,476 114,046 282,135
Hydrologic Unit 2
Marshes
:
Natural marsh 43,630 89,632 10,588 - - - -
De-watered marsh -- - - - - - - 2,373Water Bodies
:
Ponds and lakes 5,887 43,630 - - - - - -
Bays and sounds 212,260 - - - - _ _ '
, ,^
Bayous and rivers 1,187 4,701 - - - - ' ^ -
Canals and ditches 1,187 4,701 1,187 - - - ^—Swamp -- -- -- --Dry Land^ -- -- -- -- 27,108TOTAL 264,151 142,664 11,775 - - 29,481
Hydrologic Unit 3
Marshes
:
Natural marsh - - 17,039 36,324 28,375 - -
De-watered marsh - - - - - - - -
Water Bodies:Ponds and lakes - - 10,231 10,231 74,929 - -
Bays and sounds 11,336 85,160 18,180 7,949 - -
Bayous and rivers - - 1,141 4,427 11,336 - -
Canals and ditches - - 4,527 4,527 3,422 - -
Swamp -- -- -- -- --Dry Land^ -- -- -- -- 27,234TOTAL 11,336 118,098 73,789 126,011 27,234
(Cont inued)
23
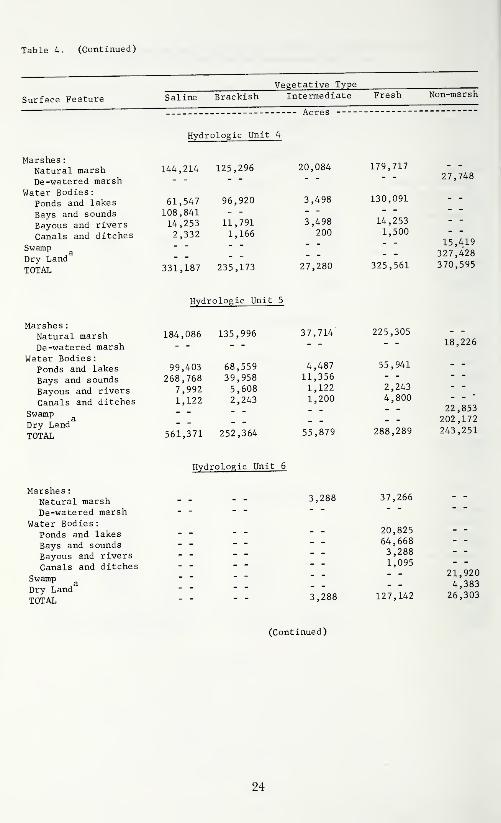
Table 4. (Continued)
Vegetative Type
Surface Feature Saline Brackish Intermediate Fresh Non-marsh
Marshes
:
Natural marshDe-watered marsh
Water Bodies:Ponds and lakes
Bays and sounds
Bayous and rivers
Canals and ditches
Swamp^
Dry LandTOTAL
Marshes
:
Natural marshDe-watered marsh
Water Bodies
:
Ponds and lakes
Bays and sounds
Bayous and rivers
Canals and ditches
Swamp^
Dry LandTOTAL
Marshes
:
Natural marshDe-watered marsh
Water Bodies:Ponds and lakes
Bays and soundsBayous and rivers
Canals and ditches
Swamp^
Dry LandTOTAL
61,547 96,920
108,841 - -
14,253 11,791
2,332 1,166
99,403 68,559
268,768 39,958
7,9921,122
5,6082,243
Acres
Hydrologic Unit 4
144,214 125,296 20,084
3,498
3,498200
27,280331,187 235,173
Hydrologic Unit 5
184,086 135,996 37,714'
4,48711,3561,1221,200
561,371 252,364 55,879
Hydrologic Unit 6
3,288
3,288
179,717
130,091
14,2531,500
325,561
225,305
55,941
2,2434,800
288,289
37,266
20,82564,6683,2881,095
127,142
27,748
15,419327,428370,595
18,226
22,853202,172243,251
21,9204,38326,303
(Continued)
24

Table 4. (Continued)
Surface Feature Saline BrackishVegetative Type
Intermediate Fresh Non-marsh
Marshes
:
Natural marshDe-watered marsh
Water Bodies:Ponds and lakesBays and soundsBayous and riversCanals and ditches
SwampDry LandTOTAL
Acres
Hydrologic Unit 7
3,383 134,416 85,851
- - 24,8819,022 271,765- - 2,256- - 2,028
12,405 435,346
6,7676,1591,1252,300
102,202
47,437
2,25645,1811,4001,000
97,274
4,511
8,25654,20466,971
Marshes
:
Natural marshDe-watered marsh
Water Bodies
:
Ponds and lakesBays and soundsBayous and riversCanals and ditches
SwampDry LandTOTAL
Hydrologic Unit
20,379 80,300
1,287 21,666
1,000- - 750
21,666 103,716
76,439
10,225
600
525
87,789
219,235
197,569
2,5 74
2,574
421,952
54,773
26,45681,229
Hydrologrjc Unit 9
Marshes
:
Natural marshDe-watered marsh
Water Bodies
:
Ponds and lakesBays and soundsBayous and riversCanals and ditches
SwampDry LandTOTAL
6,455 84,073
178,958
1,2271,675
6,455 265,933
91,658
30,176
1,3601,880
125,074
30,176
19,418
675300
50,569
39,858
51,74691,604
havn IZ^fV t^^i^^beaches, cheniers, spoil deposits, ridges and elevatedbayou and lake banks.
25

Table 5. Number and area of ponds and lakes along the
Louisiana coast by size classes
Size Classes(Acres)
No . Pondsand Lakes
Total AreaIncluded (Acres)
<.01 2,950,000 28,340
.01 .10 1,889,000 75,230
. 10 1.0 425,800 132,275
1 ni . u 10 43,460 123,360
10 80 5,472 148,140
80 640 722 150,640
640 - 3,200 149 222,300
3,200 - 16,000 15 114,800
16,000 - 64,000 7 359,200
> 64, 000 1 428,403
Total 5,314,626 1,782,688
Table 6. Acreage of ponds and lakes in hydrologic units and
vegetative types along the Louisiana coast
Vegetative Type
Hydrologic Unit Saline Brackish Intermediate Fresh
Acres
1 53,427 330,455 117,627 101,797 603,306
2 5,887 43,630 0 0 49,517
3 0 10,231 10,231 74,929 95,391
4 61,547 96,920 3,498 130,091 292,056
5 99,403 68,559 4,487 55,941 228,390
6 0 0 0 20,825 20,825
7 0 24,881 6,767 2,256 33,904
8 1,287 21,666 10,225 197,569 230,747
9 0 178,958 30,176 19,418 228,552
Total 221,551 775,300 183,011 602,826 1.782,688
26
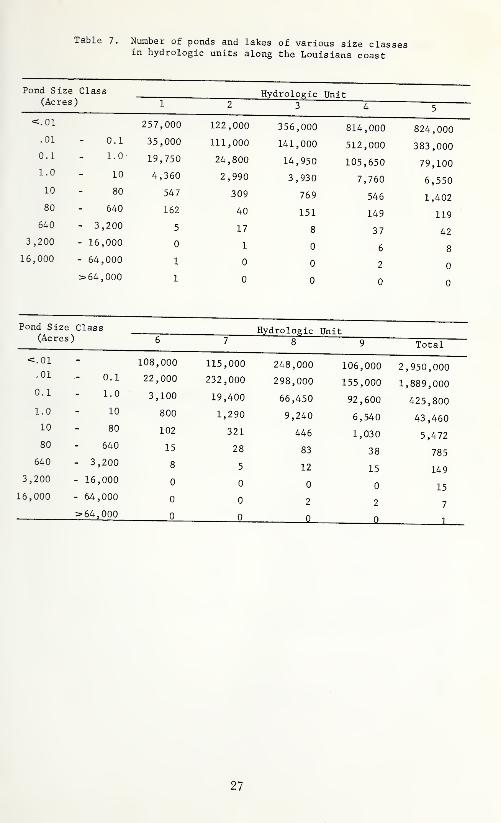
Table 7. Number of ponds and lakes of various size clasin hydrologic units along the Louisiana coast
Pond Size Class Hydrologic UnitAc res ; 1 2 3 4 c
<. 01 izz , UUU 356,000 814,000 824,000. 01 0.1 jD , uuu 111 , 000 141,000 512,000 383,000n 1
i . (J24 , 800 14,950 105,650 79,100
1.0 10 4,360 2,990 3,930 7,760 6,55010 80 j4 / 309 769 546, 1,40280 640 162 40 151 149 119
640 - 3,200 5 17 8 37 423,200 - 16,000 0 1 0 . 6 8
16,000 - 64,000 1 0 0 2 ' 0
> 64, 000 1 0 0 0
Pond Size Class Hydrologic Unit(Acres
)
6 7 8 9 Total
<. 01 1 n O AAAiUo , uuu 115,000 248,000 106,000 2,950,000. 01 0.1 99 nnn
, uuu 151 ,000 298,000 155,000 1,889,0000.
1
1 ni . U % 1 nn~> , iUU 19 ,400 66,450 92,600 425,800
1 . 0 iU O AAbUU 1,290 9,240 6,540 43,46010 80 1 n9i uz 321 446 1,030 5,47280 640 28 83 38 785
640 - 3,200 8 5 15 1493,200 - 16,000 0 0 0 0 15
16,000 - 64,000 0 0 2 2 7
> 64, 000 0 0 0 0 1
27
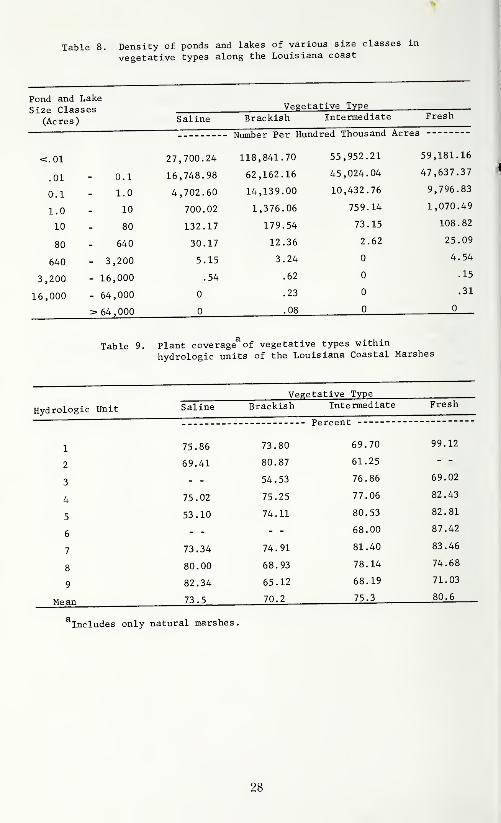
Table 8. Density of ponds and lakes of various size classes in
vegetative types along the Louisiana coast
Pond and Lake
Size Classes Vegetative Type
(Acres) Saline Brackish Intermediate
—'. Number Per Hundred Thousand Acres
<.01 27,700.24 118,841.70 55,952.21 59,181. 16
.01 0.1 16,748.98 62,162.16 45,024.04 47,637.37
0.1 1.0 4,702.60 14,139.00 10,432.76 9,796.83
1.0 10 700.02 1,376.06 759.14 1,070.49
10 80 132.17 179.54 73.15 108.82
80 640 30.17 12.36 2.62 25.09
640 - 3,200 5.15 3.24 0 4.54
3,200 - 16,000 .54 .62 0 .15
16,000 - 64,000 0 .23 0 .31
> 64,000 0 .08 0 0
Table 9. Plant coverage of vegetative types within
hydrologic units of the Louisiana Coastal Marshes
Vegetative Type
Hydrologic Unit Saline Brackish Intermediate
Percent
75.86 73.80 69.70 99.12
2 69.41 80.87 61.25
3 54.53 76.86 69.02
4'
75.02 75.25 77.06 82.43
5 53.10 74.11 80.53 82.81
668.00 87.42
7 73.34 74.91 81.40 83.46
8 80.00 68.93 78.14 74.68
9 82.34 65.12 68.19 71.03
Mean 73.5 70.2 75.3 80.6
^Includes only natural marshes
.
28

Table 10. Plant species composition of vegetative typesin the Louisiana Coastal Marshes
Vegetative TypeSpecies Saline Brackish Intermediate Fresh
Percent
Acnida alabamensis - - ,10 .30 .02Aeschynomene virginica - - - - - - ,07Alternanthera philoxeroides - - - - 2.47 5.34Aster sp. - - .08 .44 .13Avicennia nitida .60 _ _ . _ _ _ _
Azolla caroliniana - - - - _ _ 13Baccharis halimifolia - - .10 .56 .02Bacopa caroliniana - - - - ' .28 .34Bacopa monnieri - - ,92 4.75 1.44Bacopa rotundifolia - -
. 11 ,32 - -
Batis maritima 4.41 - - _ _ _ _
Bidens laevis - - - - _ _ 08Borrichia frutescens .67 .11 - - - -
Brasenia schreberi - - - - _ _ 57Caboma caroliniana - - - - _ _ jiCarex sp. - - - - V' - - - .02Centella erecta - - - - .16 .12Cephalanthus occidentalis - - - - - - .21Ceratophyllum demersum - - - - _ _ 1.50Cladium jamaicense - - - - _ _ 84Colocasia antiquorum - - - - _ _ 39Cuscuta indecora - - .02 - - - -
Cjmodon dactylon - - - - _ _ .10Cyperus compressus - - - - _ _ 02Cyperus odoratus - - .84 2.18 1.56Daubentonia texana - - - - .04 .17Decodon verticillatus - - - - - - .51Dichromena colorata - - - - _ _ 03Distichlis spicata 14.27 13.32 . .36 .13Dryopteris thelypteris
var. haliana - - - - _ _ 44Echinochloa walteri - - .36 2.72 ,77Eichornia crassipes - - - - _ _ I.43Eleocharis parvula - - 2.46 .49 .54Eleocharis sp. - - ,82 3.28 10.74Eupatorium capillifolium - - - - _ _ 05Eupatorium sp. - - - - .08 .03Fimbristylis castanea .04 .11 .12 - -
Gerardia maritima .01 .08 - -.. - -
Heliotropium curassavicum - - .02 - - _ _
Hibiscus lasiocarpus - - - - .10 .05Hydrocotyle bonariensis - - - - - - .02Hydrocotyle ranunculoides - - - - _ _ .
.
n
Hydrocotyle umbellata - - - - _ _2^ 93
Hymenocallis occidentalis - - - - .04 .14Hypericum virginicum - - - _ _ _ ^07Ipomoea stolonifera - - _ _ _
(Continued)
29

Table 10. (Continued)
Vegetative Type
Species Saline Brackish Intermediate Fresh
Ipomoea sagittata
Iva frutescens
Juncus effusus
Juncus roemerianus
Jussiaea diffusa
Jussiaea sp.
Kosteletzkya virginica
Lemna minorLeptochloa fascicularis
Leptochloa filiformis
Limnobium spongia
Lippia nodiflora
Lycium carolinianum
Lythrum lineare
Myrica ceriferaMyriophyllum spicatum
Myriophyllum heterophyllum
Najas quadalupensis
Nelumbo lutea
Nymphaea odorata/tuberosa
Nymphoides aquaticum
Osmunda regal is
Ottelia alismoides
Panicum hemitomon
Panicum repens
Panicum virgatumPanicum sp.
Paspalum dissectumPaspalum vaginatum
Philoxerus vermicular is
Phragmites communis
Pluchea foetida
Pluchea camphorataPolygonum sp.
Pontederia cordata
Potamogeton nodosus
Potamogeton pusillus
Ruppia maritimaSacciolepis striata
Sagittaria falcataSagittaria latifolia
Sagittaria platyphylla
Sagittaria sp.
Salicornia bigelovii
Salicornia virginica
Salix nigraSaururus cernuus
Scirpus americanus
Scirpus californicus
Scirpus olneyi
Scirpus rebus tus
10
03
,10
13
,63
66
.13
.10
3.93
.02
.02
.32
.16
.15
.14
1.38
.31
.87
3.83
Percent
84
72
4.97
1.78
.18
.16
2.17.04
.18
.44
1.03
.16
.76
.92
2.51
.40
4.46.08
6.63
2.26
.28
.24
.64
6.47
.08
1.271.83
3.26
.68
.19
.11
.60
.24
.84
.07
2.31.49
.16
.06
.07
.16
1.56.19
1.07.54
1.15.11
.43
.03
25.62.24
.45
.10
.42
.35
.01
2.54.02
.36
.56
.07
.03
.62
.06
15.15.21
.23
.06
.16
.13
.42
.45
(Cont inued)
30
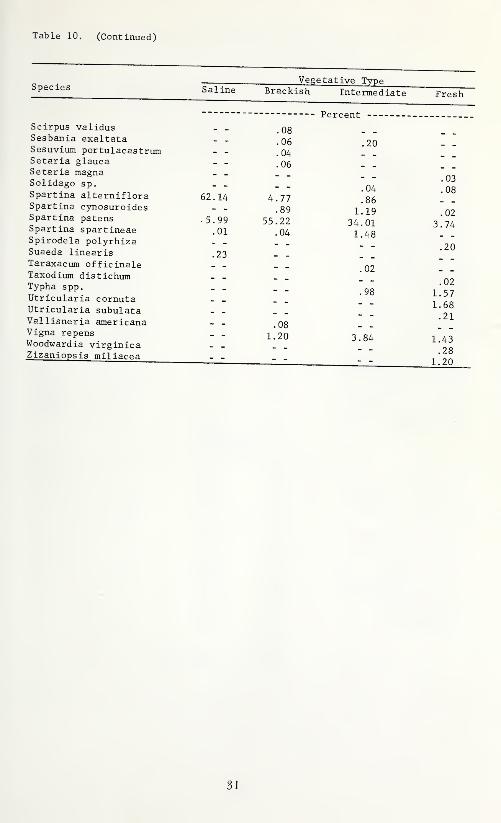
Table 10. (Continued)
.Vegetative Type
P^*^^^^ Saline Brackish Intermediate Fresh
PercentScirpus validus - _ qqSesbania exaltataSesuvium portulacastrum - -
, 04Setaria glauca _ _ 06Setaria magnaSolidago sp.
Spartina alterniflora 62.14 4.77
06 .20
.02
.0304 ,08.86 - -
Spartina cynosuroides - - .89 1 19 02Spartina patens .5.99 55! 22 34*01 3*74Spartina spartineae .01 .04 1 48 - -Spirodela polyrhiza - - _ _ :
Suaeda linearis .23 - _
Taraxacum officinale - - _ _
Taxodium distichum _ _ _
Typha spp. _ _ _
Utricularia cornuta - - _ _
Utricularia subulata - - _ _
Vallisneria americana - - .08Vigna repens - - i[20 3 54 i'a^Woodwardia virginica - - _ _ ,
Zizaniopsis miliacea - - _ „
20
.02
1.571.68.21
.28
1.20
i
31
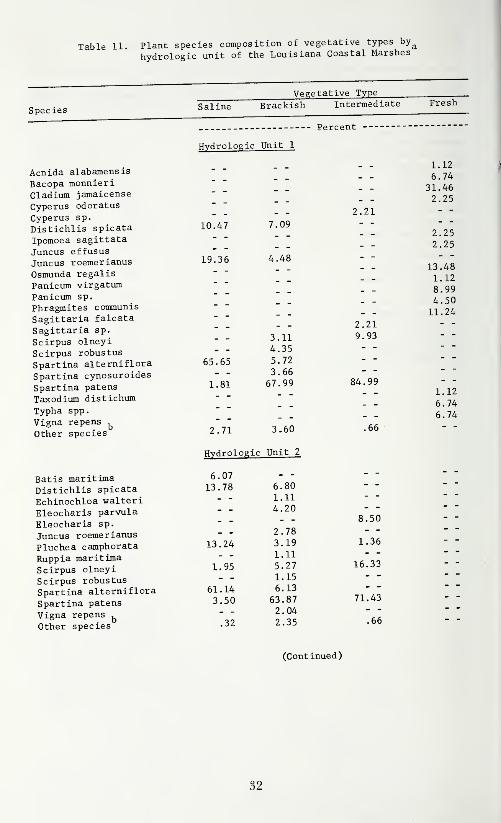
Table 11. Plant species composition of vegetative types by^
hydrologic unit of the Louisiana Coastal Marshes
Vegetative Type
Species
Acnida alabamensis
Bacopa monnieriCladium jamaicense
Cyperus odoratus
Cyperus sp.
Distichlis spicata
Ipomoea sagittata
Juncus effusus
Juncus roemerianus
Osmunda regal is
Panicum virgatumPanicum sp.
Phragmites communis
Sagittaria falcata
Sagittaria sp.
Scirpus olneyi
Scirpus robustus
Spartina alterniflora
Spartina cynosuroides
Spartina patens
Taxodium distichum
Typha spp.
Vigna repens^
Other species
Batis maritimaDistichlis spicata
Echinochloa walteri
Eleocharis parvula
Eleocharis sp.
Juncus roemerianus
Pluchea camphorata
Ruppia maritimaScirpus olneyiScirpus robustusSpartina alterniflora
Spartina patens
Vigna repens^
Other species
Saline Brackish Intermediate Fresh
Hydrologic Unit 1
10.47 7.09
19.36 4.48
65.65
1.81
2.71
3.114.355.723.6667.99
3.60
Hydrologic Unit 2
6.0713.78
13.24
1.95
61.143.50
.32
6.801.114.20
2.783.191.115.271.156.13
63.872.042.35
Percent
2.21
2.219.93
84.99
.66
8.50
1.36
16.33
71.43
.66
1.12
6.7431.462.25
2.252.25
13.481.128.994.5011.24
1.12
6.746.74
(Cont inued)
32
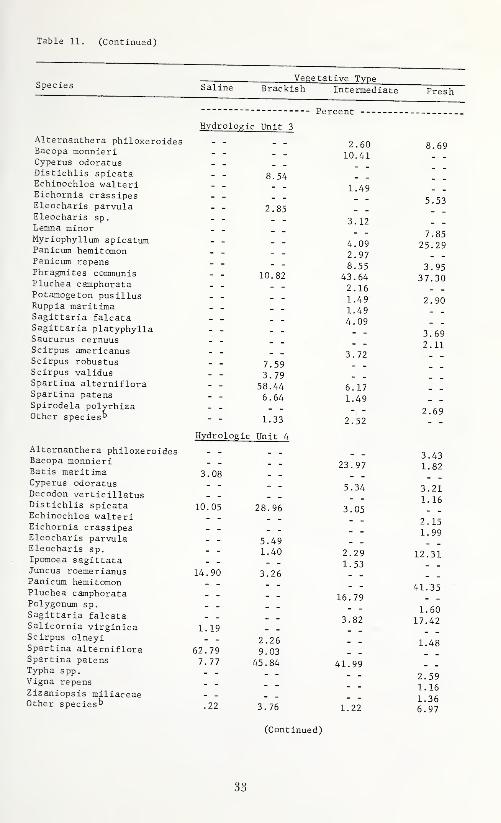
Table 11. (Continued)
Spec ies SalineVegetative Type
Brackish Intermediate Fresh
Alternanthera philoxeroidesBacopa monnieriCyperus odoratusDistichlis spicataEchinochloa walteriEichornia crass ipesEleocharis parvulaEleocharis sp.
Lemna minorMyriophyllum spicatumPanicum hemitomonPanicum repensPhragmites communisPluchea camphorataPotamogeton pusillusRuppia maritimaSagittaria falcataSagittaria platyphyllaSaururus cernuusScirpus americanusScirpus robustusScirpus validusSpartina alternifloraSpartina patensSpirodela polyrhiza
Hydrologic Unit 3
1.54
Percent
2.85
10.82
Other species
Alternanthera philoxeroidesBacopa monnieriBatis maritimaCyperus odoratusDecodon verticillatusDistichlis spicataEchinochloa walteriEichornia crassipesEleocharis parvulaEleocharis sp.Ipomoea sagittataJuncus roemerianusPanicum hemitomonPluchea camphorataPolygonum sp.
Sagittaria falcataSalicornia virginicaScirpus olneyiSpartina alternifloraSpartina patensTypha spp.
Vigna repensZizaniopsis miliaceaeOther species^
- - 7.59- - 3.79- - 58.44
6.64
- - 1.33
Hydrologic Unit 4
3.08
10.05
14 . 90
1.19
62.797.77
.22
28.96
5.491.40
3.26
2.269.03
45.84
3.76
2.6010.41
1.49
3.12
4.092.978.55
43.642.161.49'
1.494.09
3.72
6.171.49
2.52
23.97
5.34
3.05
2.291.53
16.79
3.82
41.99
1.22
69
5.53
7.85
25.29
3.9537.30
2.90
3.692.11
2.69
3.431.82
3.21.1.16
2.151.99
12.31
41.35
1.6017.42
1.48
2.591.16
1.366.97
(Continued)
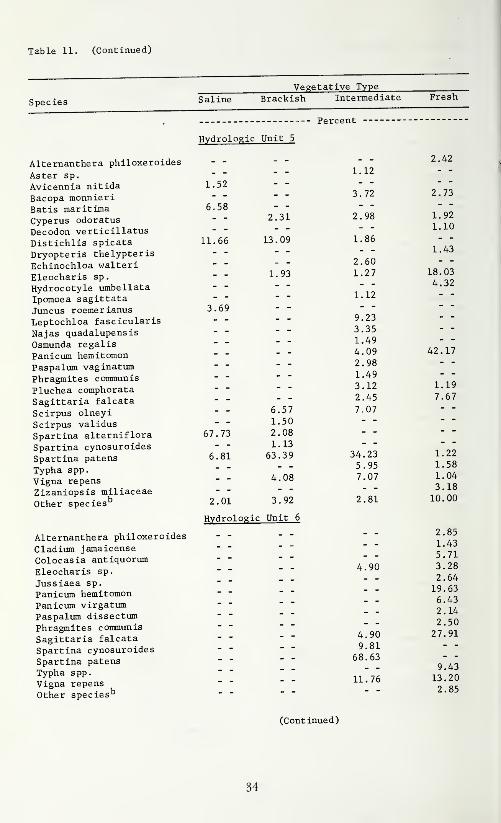
Table 11. (Continued)
Vegetative Type
Species Saline Brackish Intermediate Fresh
Alternanthera philoxeroides
Aster sp.
Avicennia nitidaBacopa raonnieri
Bat is maritimaCyperus odoratusDecodon verticillatus
Distichlis spicata
Dryopteris thelypteris
Echinochloa walteriEleocharis sp.
Hydrocotyle umbellataIpomoea sagittata
Juneus roemerianusLeptochloa fascicularis
Najas quadalupensisOsmunda regal is
Panicum hemitomonPaspalum vaginatumPhragmites communis
Pluchea comphorataSagittaria falcata
Scirpus olneyiScirpus validusSpartina alternifloraSpartina cynosuroidesSpartina patens
Typha spp.
Vigna repensZizaniopsis miliaceae
Other species^
Alternanthera philoxeroides
Cladium jamaicense
Colocasia antiquorum
Eleocharis sp.
Jussiaea sp.
Panicum hemitomonPanicum virgatumPaspalum dissectumPhragmites communis
Sagittaria falcataSpartina cynosuroidesSpartina patens
Typha spp.
Vigna repens
Hydrologxc•
Unit J
- Percent
2 .421i.
.
1 9
3
.
72 2.73
6 . 582
.
98 1. 92
1. 10
11. 66 1 0 no 11
.
861 .43
9
1 Q"?1 . yJ 1 27 18. 03
4.32
1,,12
3 . 69_ _
9..23 _ _
3,.35 _ _
1,.49 _ _
4,. 09 42.17
2 . 98
\ .49_ _ 3 .12 1.19
- - 2 .45 7.67
6.5/-7
/ . U /
1.50
SI. 12, 2.081.13
6.81 63.39 34 .23 1.22
5 .95 1.58
4.08 7 .07 1.043.18
2.01 3.92 2 .81 10.00
Hvdrologic Unit 6
4.90
4.909.81
68.63
11.76
Other species'
2.851.435.713.282.6419.636.432.142.50
27.91
9.4313.202.85
(Cont inued)
34

Table 11. (Continued)
Spec ies Saline BrackishVegetative Type
Intermediate
Percent
Fresh
Hydrologic Unit 7
Alternanthera philoxeroides - - - -
Aster sp. - - _ _
Batis maritima 18.18 - -
Borrichia frutescens 9.10 - -
Cladium jamaicense - - _ _
Colocasia antiquorum - - _ _
Cyperus odoratus - - 1.12Distichlis spicata - - 5.16Echinochloa walteri - - _ _
Eleocharis sp. - - _ _
Hydrocotyle umbellata - - _ _
Hymenocallis occidentalis - - - -
Ipomoea sagittata - - _ _
Juncus effusus 27.27 14.59Panicum hemitomon - - _ _
Panicum virgatum - - 1.03Paspalum dissectum - - _ _
Paspalum vaginatum - - 1.24Phragmites communis - - _ _
Pluchea camphorata - - _ _
Sacciolepis striata - - _ _
Sagittaria falcata - - _ _
Scirpus validus - - 11,11Scirpus robustus 18.18 1.12Spartina alterniflora 27.27 - -
Spartina cynosuroides - - 1.01Spartina patens - - 56.70Typha spp. _ _ _ _
Vigna repens - - 2.81Woodwardia virginica - - - -
Other species - - 4.11
1.30
4.055.19
2.111.62
8.591.621.95
1.462.11
12.645.51
3.4130.632.278.591.62
5.33
3.44
4.011.15
1.158.605.161.43
10.602.004.581.15
2.2924.06
1.1519.201.43
5.443.16
Hydrologic Unit 8
Aeschynomene virginicaAlternanthera philoxeroidesBacopa carol inianaBacopa monnieriBacopa rotundifoliaBorrichia frutescensBrasenia schreberiCabomba carolinianaCyperus odoratusDistichlis spicataEchinochloa walteriEleocharis parvulaEleocharis sp.
Gerardia maritimaJussiaea sp.
Leptochloa fascicularis
4.69
68.75 27.872.081.61
1.38
8.311.284.051.70
6.17
5.54
2.98
1.719.461.14
1.711.01
5.60
1.79
(Continued on Page 38)
35

36


Table 11. (Continued)
Species
Vegetative Type
Saline Brackish Intermediate
Percent
Fresh
Hydrologic Unit 8 (Continued)
Lycium carol inianumNelumbo luteaNymphaea odorataPanicum hemitomonPaspalum dissectumPaspalum vaginatumPhragmites communisPluchea camphorataPotamogeton pusillusSagittaria falcataSalicornia bigeloviiScirpus americanusScirpus robustusSesuvium portulacastrumSpartina alternifloraSpartina cynosuroidesSpartina patensSpartina spartineae
Utricularia cornutaVigna repensOther species
1.56
1.56
6.25
10.94
6.25
1.84
4.19
2.0853.80
5.15
Hydrologic Unit 9
6.395.962.47
2.55
4.68
2.98
36.841.28
1.495.33
1.322.4121.501.40
1.0128.00
8.09
3.42
10.43
Acnida alabamensis - -
Alternanthera philoxeroides - -
Bacopa monnieri - -
Batis maritima 20.24
Cynodon dactylon - -
Daubentonia texana - -
Distichlis spicata 54.66
Echinochloa walteri - -
Eleocharis sp. - -
Juncus effusus - -
Leptochloa fascicularis - -
Numphaea odorata - -
Panicum hemitomon - -
Paspalum vaginatum - -
Ruppia maritima - -
Phragmites communis - -
Sagittaria falcata - -
Scirpus californicus - -
Scirpus olneyi - -
Scirpus robustus - -
Sesbania exaltata - -
Setaria glauca - -
Spartina alterniflora 24.29
5.33
8.96
1.212.242.49-
7.22
1.18
6.992.49
1.38
3.00
13.29
3.974.596.736.211.212.07
25.872.99
2.991.291.992.198.461.99
1.991.995.77
22.884.98
(Cont inued)
38
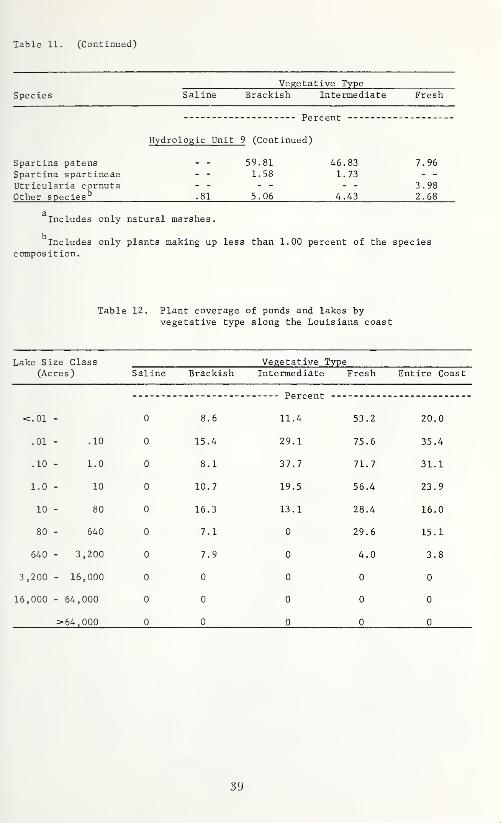
Table 11. (Continued)
Vegetative Type
Species Saline Brackish Intermediate Fresh
Percent --
Hydrologic Unit 9 (Continued)
Spartina patens - - 59.81 46.83Spartina spartineae - - 1.58 1.73
Utricularia cornuta - - - - - -
Other species^ ._8l 5.06 4.43
^Includes only natural marshes.
^Includes only plants making up less than 1.00 percent of the speciescompos ition.
7.96
3.982.68
Table 12. Plant coverage of ponds and lakes byvegetative type along the Louisiana coast
Lake Size Class Vegetative Type(Acres) Saline Brackish Intermediate Fresh Entire Coast
Percent
«=.01 0 8.6 11.4 53.2 20.0
.01 .10 0 15.4 29.1 75.6 35.4
.10 1.0 0 8.1 37.7 71.7 31.1
1.0 10 0 10.7 19.5 56.4 23.9
10 80 0 16.3 13.1 28.4 16.0
80 640 0 7.1 0 29.6 15.1
640 3,200 0 7.9 0 4.0 3.8
3,200 - 16,000 0 0 0 0 0
.6,000 - 64,000 0 0 0 0 0
>64,000 0 0 0 0 0
39

Table 13. Plant species composition of ponds and lakes byvegetative type along the Louisiana coast
Vegetative Type
Plant Species Brackish Intermediate Fresh Entire Coast
Percent
Alternanthera philoxeroides _ - . - 1.29 .89
Azolla caroliniana - - . - .59 .40
Bacopa caroliniana _ _ . - .35 .24
Bacopa monnieri 4.97 11. 69 .35 2.46
Bacopa rotundifolia 2.29 . - _ _ .49
Brasenia schreberi _ _ . _ 2.23 1.54
Cabomba caroliniana _ _ . _ 3.64 2.51
Centella erecta - - - - .63 .44
Ceratophyllum demersum - - . - 11.15 7.68
Chara vulgaris _ _ 32. 47 8.10 8.81
Eichornia crassipes _ _ . _ 4.53 3.12
Eleocharis parvula 23.01 10.,07 1.60 6.97
Eleocharis sp. 3 .98 6.,82 11.27 9.28
Hydrocotyl bonariensis . _ .12 .08
Hydrocotyl umbellata _ _ . _ 1.67 1.15
Hymenocallis occidentalis _ _ . _ .47 .32
Jussiaea sp. _ _ . _ .23 .16
Lemna minor - - 2,,43 15.26 10.75
Limnobium spongia _ _ . _ 1.13 .78
Myriophyllum spicatum 3.06 8..93 11.03 9.14
Myriophyllum heterophyllum .47 .32
Najas quadalupensis 8,.93 5.75 4.85
Nelumbo lutea 1.88 1.29
Nymphaea odorata 4.93 3.40
Potamogeton nodosus .23 .16
Potamogeton pusillus 4,.87 2.70 2.34
Ruppia maritima 62.69 12 .98 .23 14.72
Sagittaria falcata 1.24 .86
Scirpus californicus .81 .08
Spirodela polyrhiza .94 .65
Utricularia cornuta 5.99 4.12
^No vegetation in saline vegetative type.
Table 14. Plant species composition of ponds and lakes of various
size classes along the Louisiana coast
Pond Size Classes
Plant species <.01 .01-. 10 .10-1.0 1.0-10 10-80
Percent
Alternanthera philoxeroides 1,,01
Azolla caroliniana ,52 1,,69
Bacopa caroliniana 1,,26
Bacopa monnieri 12.,67 ,85 2.,02
Bacopa rotundifolia 2.,53
Brasenia schreberi 1.92 5.,49
Cabomba caroliniana 1,,04 .32 5.,07 8.,06
Centella erecta 8,.33 ,85
Ceratophyllum demersum 3 .63 2.88 4,.22 2,.02
Chara vulgaris 1,.04 20.50 9,.71 10..08
Eichornia crassipes 24.,51 6.28 2,.11
Eleocharis parvula 40,,20 10,.70 4.68 5,.32 3 .53
(Continued)
40

Table 14. (Continued)
Pond Size Classes
Plant Species < . 01 .01-. 10 .10-1.0 1.0-10 10-80
Percent22 . 06 26
,
, 17 14
.
.41 2
,
. 95 20Hvdrocotvl bonariensis ,52
Hydrocotyl umbellata ,46 1,, 15 .85
Hvmenoc al 1 is occidentalis 2
.
, 08
Jussiaea sp. . 64
Lemna minoir 9,, 35 11
,
, 34 12
,
. 92 5
,
54T 1 mn oh T 1 nn spon^ia 4
,
, 67 . 25
Myr iophvll um spicatum 3
,
, 20 26. 21
Mviriophy 11 mn heterophyllurn I ,, 69
Najas quadalupensis 1,,04 5,,13 15..20 3. 02
Nelumbo lutea 1.,28 1. 01
N>Tnphaea odorat a 1.,04 5.,13 5.,07 4. 03
Potamogeton nodosus ,85
Potamogeton pusillus 1.,60 5.,49 1. 01
Ruppia maritima 6.,75 10,.89 11,.40 32. 26
Sagittaria falcata 3.,42 .64
Scirpus californicus ,32
Spirodela polyrhiza 2.,59 ,85
Utricularia cornuta 4.90 8.,31 7.,69 3..38
Pond Size Classes640- 3,200- 16,000-
Plant Species 80-640 3,200 16,000 64,000 >64,000
Alternanthera philoxeroides 3.84 2.70Azolla caroliniana - - - -
Bacopa caroliniana - - - -
Bacopa monnieri - - - -
Brasenia schreberi - - - -
Cabomba caroliniana - - - -
Centella erecta - - - -
Ceratophyllum demersum 21.43 35.14Chara vulgaris - - 5.41Eichornia crassipes - - - -
Eleocharis parvula 8.24 - -
Eleocharis sp. 1.65 - -
Hydrocotyl bonariensis - - - -
Hydrocotyl umbellata - - - -
Hymenocallis occidentalis - - - -
Jussiaea ep. - - - -
Lemna minor 20.88 - -
Limnobium spongia - - - -
Myriophyllum spicatum 26.92 2.70
Myriophyllum heterophyllum - - - -
Najas quadalupensis - - - -
Nelumbo lutea 5.49 - -
Nymphaea odorata 2.20 - -
Potamogeton nodosus - - - -
Potamogeton pusillus 4.95 - -
Ruppia maritima 2.20 54.05Sagittaria falcata 1.10 - -
Scirpus californicus - - - -
Spirodela polyrhiza .55 - -
Utricularia cornuta .55 - -
Percent
^Pond size m acres
41
OU
x:a
a.
ai
CJN
o00
CN
in
NO
00
CO
ON
CJN
+1
<N
<t^
+?
^O
r~-CO
CN
+.
+1
00
c:nn^
00
N-'
+1
00
CN
OCO
,vO
/-^
+1
nD
m^
moN-/
NO
ON
+^
CO
+1
ON
i-l
1-1
/-s
+1
OO
ON
N_/
CN
ND
NO
uo
dOO
CO
o
NO
OONO
00
CN
C-J
O00<t
CJN
CM
CM
cn
0^
CN^
"^oo^
-i
+1
00
in
CO
CMN^
+1
00
CO
CO
00
N_-
CT>^
+1
NO
<f
N--
dNO
CN
N-'
<t
N-^
o^
O^
+1
<f
ON W
ONO
oCO
od
d
O<f
nD
CO
NO
nD
CO
OCO
.97-0
(32)
o^
<1-
CO
o--^
+1
CO
O-
00
nI^-
o" ^
+1
00
C3N
ON-'
o^
+1
00
<t
CO
CJN
O^
+1
00
d^
+1
.-1
OCO
d^
+1
vo
CM
N-'
o^
+1
in
CO
ONO
NO
O/-N
NO ^
CO
N-'
+?«
oo
oo
oo
dd
CO
CO
CO
Oo00
C3N
00
CN
<fCO
CJN
NO
cn
cn
o^CO
00^
CD^
O-t
+?
00
VO
N—
-
+1
oo
O'-N
+1
00
<f
CD
+
1
in
CO
mN—
-
o^
+1
NO
Ln ^
o^
+1
in
S^
d00
CJ\
N-'
o^
+oin
N-'
d/-N
+1
o-
CTvrH
O^
O/-s
-(-1
<X)
-J ^
OO
oo
Od
do
dd
in
oNO
CM
o-o
CJN
oin
COo
o<to
oo
O'-v
+^
CSI
or-lCO
o^
oo^
cn
i-H
CM
N-'
ON
O'-v
+1
00
OCO
CM
N-'
O/-N
+1
oo
inO
d^
CN
CO
d+1
NO
CO
.-1
CO
•~'
d/-N
+1
in
COo
N^
d^
+1
NO
o^
+1
d^
00O
N-'
o+i
<f
vt
.-1
ON-'
d^-N
+1
00
00O
N-/
CD
Oo
Oo
do
dd
dd
cno
oO
vTo
oo
ONOo
ooo
<7n
oo
ooo
.03-0
(32)+?<f
CO
oo^
O^
o^
CM
CD
/-N
+1
00
NO
CO
ON_^
+1
00
O
d^
+1
1-1
ON^
d/-N
+1
NO
d^
+1
in
o^
d^
o' ^
+1
CO
ooO
d^
o^
d/-N
+o-
I-l
r-<
ON^
O<-N
-hi
OO
ON-"
oo
oo
dd
dd
Od
CN
oo<}
CN
<t<f
00
NO
ino
CO
NO
CO
CO00
cn^
+1
CM
CO
cn
C3N w
CQ ^
+1
CO
ON
CO
ON-'
_^csi
z;^
CM^
CM
+1
00
NO
00N^
cA^
<t
CO
ON
N-^
oo^
<f
CO
CM
1-1
ON
N_^
CO ^<f
CO^
+1
NO
CO
+1
CO
NO
CN
N-'
in ^
+1
<)
NO
CO^
CO ^
+"
NO
r-l
in
N-/
CM ^
+1
00
On
UO
in
NO
NOO
00
CO
CO
00
00
NO
NO
ON
CJN
ON
oCO ^
a\in
CNNO
NO
CN
.48-22
(32)+
1CO
+ND
!^
CO
,CN ^
+1
00
NO
oo
mCM/—
^
+1
r-<
ON
CO
CJNN^
NO
in ^
+1
NO
vT ^
in
ooin
NO
CM ^
+1
<t
in
CO ^
dNO
ON
.CM ^
+1
OO
vO
N-*
00cn
OCO
00
00
oNO
ON
dCO
ON
r~-
O<rin
CO
CN
CO
00
CO
00
OCJN
OCO
COo
CO
00
CO
VO
CO
CO^
+^^
O
00 ^
+1
CO
ON^
UO—
'
"'"ci!
°°
+^
So
NO
00
+T'
So
r-lCO
,C0
+1
NO
CO
i-<
CO ^
in
In
00
,CM ^
+1
NO
-J ^
CO
+^
Jo
CMCO ^
m+^?
mrH
NO
+1
00
o^
cr>
NO
I
vO
CM
0C3
CN
00CO
m00
CJN
CN
CO
cn
CM
00
NO
<f
00
o\00
<t
"J
CJN
00
NO
"^
NONO
OO
CJN
ON
<JN
.36-0
(32)
CD ^
+1
CO
NO
CO
CNl
O/-N
+T
CO
CSI ^
o^
+TvO
i-l
CON^
+°»
NO
CO
o^
CJN
"^nO
CO
+?o
CN—
'
CMin
N-'
CN
Jo
mCNN-'
+?>
Or-l
00
N_/
O+1
00
Od
CNi
CN
CN
UO
NO
CO
in
ON
NO
CMm
OoCO
ooOo
ON
cn
CO
'-N
CN
NO ^
+^
in
VO
CN
NO
CO
CO00
N_-
CM^
+1
ON
ON
ON
/-N
+1
CO
o.-<
NON^
00
N-'
00
'-N
+1m
<}
CN—
'
CTN
ON^
+1
cn
00
+1
cn
CN
rH
CM«^
+t
oo
m00N^
CN
UO
CN
CO
CM
dCN
dd
O•
}:
Oo
OUO
Ooin
oON
oin
oON
oo-
Oin
omoCO
oCM
O
OCO
1CO
OCO
00
1CO
oON^
O.-1
100
or
oo
OCO
ON^
100
o^
OCO
ON-'
1NO
o^
o^
CD
1NO
o1
CO
oOs^
inN^
100
oCM
Nw/
<r
<r
UO
~3-
m<f
NO
in
in
T3
J3
Cr-l
Ocd
42

oo
in
CSI
Oo
<f
<t
CM
oo
r-(
C3
JJ
4J
BQ^^
+7
00
00
O^
a^
<r^
+1
cn
0^ON^
nNO
ON
CM
c:n
CM^
+1
00
CM00NW
>-l
CJN
00N^
NO
Co
o^
00
N-^
00vO
N-'
,oo ^
+1
C3^
ON_-
OO ^
+1
ON
oo
N-'
+V
o^
00
N-'
^0
<D
OCO
00
CM
dND
CO
1-4
oin
00
in
OO
00
CM
tn
ON
oo
CM
r-
a._&
-aa
0^
+c
CO
<6^
+1
d'-^
ONCO^
00 ^
+?S
in
\D
din
CM
ON
N_^
in
dON
CO^
+1
<t
CM
(3N
d^
+1
in
oCO^
CMnS
o^
+1
r-~
oo
OM—
'
+'T
oT
OCNJ
-H*
o^
.-1NO
oo^
o^
-I-l
ON
o
§^
Jo
CM
ON
nD
Oin
CO
tN
CTN
CM
CO
CM
00in
oo
in
ca
OS
-u
01
o.
ca
+1
CO
00^
O^
+1
d^
+1o
o^
O00
vD
d^
OCM
O/-V
oo
d^
oo^
in
<3N
d^
+1
in
in
O-d-
d^
NO
O^
-1-
1CJN
Oy-^
+1
ON
ONO
NO
CO^
ac
oO
do
dd
Od
Oo
OO
o00
CM
CO
CM
On
CM
OCM
oo
3u
0.
+1
oo
O^
+1m
+?«
d^
+1
<f
d^
+1
in
o^
+1
NO
d^
O^
+1
ON
O'-^
+1
CTN
NO
00VON^
oo
Oo
oo
H63
Oo
oo
oo
CM
oCJN
o00o
o3
OJ
.u
CO
o.
<3a
C+1
00
O^
CD^
+1
cn
Or--
do
do-l
nD
o^
-J-
CM
d^
COO
N^
d^
+1
<!•
COo
O^
+1
<f
ON
c:^
CM
N—
-
NOo^
O--N
+1
NO
o^
ON-'
d^
-f
1ON
in
CM
O/->
-I-l
ON
00
NO
oNOO
N^
oo
Oo
oo
od
CO
vOO
ino
cnO
in
oo
OO
oCMo
oCMo
Oi->
s:a
aa
50^
O/-V
+1
00
O^
CD^
+
1
o^
O^
COo
+?
CO
CO
NO
o^
+?
?^
in
CM
o^
+°
oo
ON--
d^
+1
-J
NO
CJN
O^
d/—
+1
NO
CM
<r
oN--
Oy-^
+1
OOo^
d/-^
+1
ON
CM
CM
ON^
1-1NO
ON^
d+1
ON
T1-4
C
Of
0o
oo
Od
oo
oin
oin
ro
ON
CO
NO
C3N
On
CM
oo
oo
+1
00
+1
f-l
in^
+1
nC
cn
+1
NO
OCNj
COin
CM
On
-H
^n
OO
+.
NO
CO^
u00
NO
OO
NO
in
v£)
00CM
<r
ON
CM
NO
<r
CM
ON
CM
CM
in
NO
COin
-d
<ea
CQJ ^
ao
jj
'
OX
d+1
oo
in
CM
OO^
,CM ^
00
00
+^<t
nD
O—
'
i-lCM
a\
NO
ONN^
00
NO
ON
O,CO
+1
in
CM
N-^
00
CM^
+1
NO
.-1
o-
oo
On^
+7
o^
CM
N--
CM
/-N
-fl
ON
ONO
oo
CO
•—
^
-{-1
ON
NO
<r
r~
CJN
CM
<rin
fNj
CMCM
in
<t
NO
in
C
c
CN
in
r~
CM00
NO
ONO
CM
ON
CM
in
NO
d
oo
<f
NO
in
NO
in
NO
00
b.
3
0e£5
to
+1
ca
CM^
+1
vD
+1
ro
ON^
+1
NO
00
NO
+1
r-
+1
<3-
00^
+1
<1-
o^
+1
in
NO^
+1
NO
in
<[
•d;^
CMN^
CM
NO
VO
N_-
00
>
u00
CM
dCO
<f
CM
CO
CO
OO
CM
in
1-1
NO
CM
CO
CO00
acc60/-
o^s
o^
+1
oo
Sd/-V
+1n
cn
CTn
O00ON
d^
CO
NO
d^
CO
00
NO
NO
d^
+1
<f
r~.
CJN
ON
C3^
<r
d^
+1
NO
O<f
00
O+1
r~-
o
oo
CO
CM
ON
NO
-H
o^
NO
zd
dCM
d
00U1
00
o«
CO
ON
OO
i-ic
c
CM^
cn
d'-^
CM^
+1
-n
o^
+1
CM
CM^
ONO
+1
<f
CO
ON
d^
+1o
CM
00
O/-V
+1
CJN
<f
ooo
4-^
ON
do
(O
CM
CM
CO
do
NO
oo
oo-3-
Oo
oo
oO
oo
Oo
ooo
O00
aB
100
o:
in ^
1m
o<r ^
ooCM
N—
'
1NO
OvO
00^
OCM
CO ^
100
oCO
N-'
1<t
O^
OON
1in
oCO ^
1NO
O<f
00
oin
N—
'
OOM
ONO
o^
in
mo-
CO
2o.
i•H1
(U
J01
UC
01
o
«
i
w3
td
tdo
3
01
0)
<o
01w
cd
c
c«
Co
tdC
nJ
12
•H
a!
0)
D.
u>-.
td
0001
01
Cd
cu
•H
o.
C-H01
utd
01
td
x:
r-l
ISOrH
=^
EB
««
OJ
a"
oo.u
^C
3al
0-o
01C
31-1
s.§
3tfl
l-i
l-i
<UO
D.T3
cc
0)
n)
J33
OJ
0-H
T3
4-1
OO(U
(U
>
uo
OO
•H
U
•H
<J
01
a<
H0)
D.
.-1
O0)
I-l
JJ
C4-"
£td
O01
J2
(d
ou
•H
O
o>
OM
tu
td
r-l
o.
ooOJ
td
D.
atd
3tj
cL,
Oo
«o
3-H
OO
>NO
OO
OQ
Qo
uCd
43
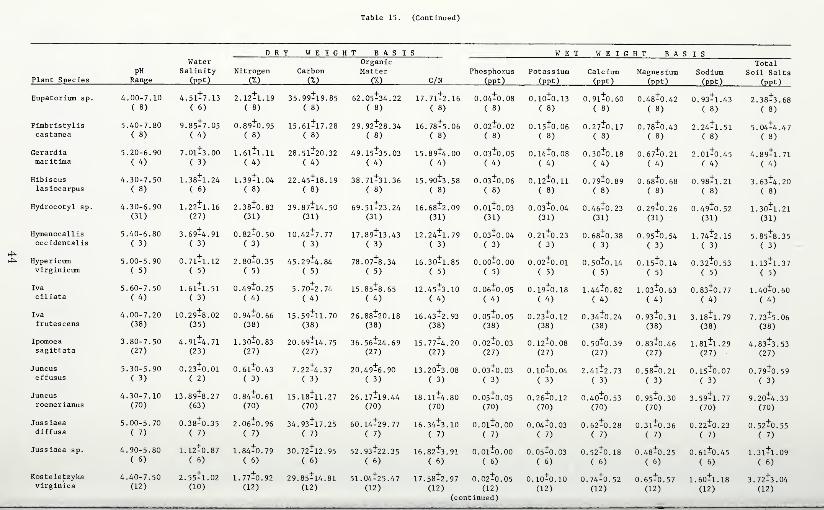
•Ha
•oa
00
VD
<!
OCM
cn
CO
ONO
NOo
CO
ONin
COCO
inin
ONO
o+
1OO
00
+1
00
ON
+1
00
+1
f-l
ocn
00 ^
+1
CO
+1
in
CO
d^
+1
<!•
Om^
+.
CO
CO
CO
CO ^
+1
o^
+1
CO
+ro
O/-V
+.
ftQ
<)
OCO
<f
in
CSI
CM
ro
CJN
C3N
CM
oCO
CM
in
CO
ftW
m<»
o^
+1
<r
+tM
00
CJN
CO
<)
CO
+t
TO
CO
CO
-ftO
o^
4-'^?M
OCM
CM
Od
dd
CO
oCO
dd
CSI
o-
o-
CM
00
vO
NO
CM
CO
<!
oCO
NO
CO
CM
in
+T
00
00
O+1
CO
00
O^
00
+?^
ON
CO
CO
CO
CO
+?
;^
CO
CM
00
+?o
o^
+•
+1
NO
o^
4-1
CM
dd
Oo
do
do
do
dd
oo
SCM
CO
CO
in
CM
00
in
+?«
ON^
CSI
^-^
oCO
--^
+?
00
ON
vO
CO
+?;^
COO
N_-
oin ^
<f
CO
CO
+?O
CM
in^
o^
+1o
Or-
o-^
O^
+1
o^
+1o
ins^
dO
od
dd
do
dCM
do
dO
Oo
oCM
oo
oo
COo
O
od
'-N
+1
00
CM
o^
+1
.-1
CO
CO+2^
d^
+1
in
CM
d^
ON
O+1
00
CO
CO
d^
CM
CM
od^
4-1
d^
+1
N£>
d^
4-1
CM
OU
^a
COo^
4-1
r--
C-J
CM
4j
Cpi
NO
o00
ON
ON
in
oCO
o00
oo
oo
in
o00
ON
CM
o00
CJN
ON
CM^
m'-N
4--f?
CO ^
CO ^
CO^
CM^
4-1
00
4-1
00
4-1
CO
4-'T*^
ft
4-1
o-
4--rc
4-1
CO
4-to
4-7P
4-7
4-1
eg
00
CJN
o00
CO
oin
CO
CO
CM
00
.-1
CO^
CJNN^
CM
N-^
CO
-J- ^
CO
CO
N_^
in
~-—
-
in
»o
NO
in
0C3
NO
NO
CM
<t
CO
NO
<f
CO
CO
ON
CM
CO
oCO
CM
<!
<f
in
NO
o<t
CO
<f
CO
NO
CJN
<f
00
u-1
CO
CO
d<f
ON
ON
CM
in
4-^
So
,CM
/-N
CO
/-N
CO
CO
/-N
,00 ^
VO
.CM
/-V
CM^
4-1
00
4-1
<f
4-1
00
ft
4-1m
4-1
<f
4-'^
So
4-^P
4-1
CO
fto
4-1
r--
4-1
NO
4-7
mCM
mr-lCO
CJN
oo
CO
NO
CM
CJN
CJN
CJN
00
CJN
CO
UO
NO
NO
ONO
dCM
CM
<t
CO
NO
CO
CM
CM
NO
in
in
in
00
CM
CJN
Oo
in
i-i
00
CM
CO
in
<f
CM-
ON
00
00
CO
CJN
doo'
<J-
r-t
<f
O-
CM
fi^
4-1
00
4-^
00
4-'^00
ft^
4-^
ft^
ftX
ft^
4-Vo
4-^P
4-Vo
On
mCO
ON
oCJN
CO
ON
CM
00
CM
mr-l
CJN ^
in ^
oo ^
CM
N-/"
mON
00
mm
00
CJN
din
Oin
OtJN
CO
CM
CM
CO
CO
CO
CnI
ON
mo
in
vO
CO
CO
NO
ON
CJN
Os
in
CO
NO
00
-J
NO
ON
ON
ft
00
4-?«
1-H^
d^
d^
d^
d^
d^
4-1
ftM
4-1^
4-1
CO
4-1
in
4-1
CO
4->o
4-?P
4-?o
4-75
CM
ON
CO
CO
CM
oCJN
<!
CO
OCM
NO
00
CO
00 ^
00N^
CJN ^
CO
'~'
VO
CON^
ON-^
00N^
N—
-
CM
dCnI
dCM
do
dd
CO
mo
in
oo
CM
CJN
in
oo
CO
CO
oCO ^
CC3
/-s
fi^
d^
00 ^
dd^
4-|T
4-^^
4-1
CO
4^
Co
4-'^
4-^*tn
4-'V
4-1
in
4-1
CNJ
4-1
CO
4-1
r-
4-1
NO
4-7o
in
00
CM
CM
CJN
ON
CO
CO
ON
NO
CO
CM
in
r-l
in
<f
CJN
CO
dd
<!
dCO
d
oo
oO
Oo
oo
oO
oo
oO
o00
CJN
mCJN
CO
CJN
in
mON
r-~
00
m
100
100
1CO
1CO
100
1CO
1o
1r~
1NO
oo
oo
OCO
oo
oO
CO
OCM
oO
r~
Oo
in
<)•
<)
in
in
CO
in
in
-d-
ristylis
tanea
rdia
itima
scus
iocarpus
Fimb
cas
Gera
mar
Hibi
las
OT5
C-r-l
44

sin
OO
00
Cs] ^
<f^
o^
in
+°
so
"^00
csi
d/-s
"^00
d^
so
d^
in
d/-s
00
in
"'so
CO
<—
>
CM
CO
dCO
CO
CO
OCM
oCO
in
CO
42-0.
(16)
O+1o
00
-J
O.-s
O^
+1
so
OO
CN
d^
+1
so
o^
o^
so
O^
+^in
d^
+1
so
so
d^
+1o
00m
d+1
r-.
CO
O—1
o^
+^
tn
CO
CO
oo
oCN
dd
dd
od
SO
5o
c5
in
CO
O^
o^
T1O
CO^
O"
'-s
+1
<r
in
O'-^
d^
+1
CO
CO
CM
o^
+1
so
in
>—
1
d^
+1
r~.
CO
d/-s
+1
in
CO
d^
+1
so
in
d^
+1o
OS
in
d/-^
so
d+1
O^
O'-s
00
,-^
d^
+1
in
CO
oo
od
dd
dd
dd
do
oc
CM
oo
S
36^0.
(16)
o"
+1o
00
O/—
od
--^
+1
so
OS
d^
+1
CO
CO
csj
d^
+1
so
o^
d/-s
+1
r--
CO
d^
+1
in
d/-s
+1
so
00
o^
+1o
00
in
d^
in
d'-N
+1
.-1
d^
in
r-l
d/-s
+1
in
<t
CO
oo
od
dd
dd
dO
Od
d
inO
oo
oo
oo
oO
o
05-0.
(16)
o^
+1o.-1
o^
+1
<r
o^
+1
so
d^
+1
CO
CO
Csl
d^
+1
so
CO^
d^
OS
o^
+1
in
<!
o^
+1
so
<r
d+1o
<rm
d^
d+1
CO
i-i
d^
+1
t-.
mr-l
d^
+1m
00
CO
oo
oo
oo
OO
oo
dd
dd
r~-
OCMo
oooo
COo
oo
oooo
osoo
oo
O
o^
o^
+1o
CsJ—
1
o^
o"
/-V
+1
<r
os_-
d/-s
+1
so
os^
d.-s
+1
CO
CM
CM
O^
O/-s
+1
so
o
d^
+1
r-
Os^
d/-V
+1
in
o^
d^
+1
so
Os^
+1o
,-4
in
o^
o^
-J
d^
Os-'
d^
+1
1^
d^
+1
in
so
CO
o^
oo
dd
Oo
Oo
dd
od
dd
o00
00
CM
mS
+.
so
OS
^-^
ro
/-^
OS
in ^
r~
Csl
_^CO^
SD
r-l
00
CM ^
+1
in
so
+1
so
00
in
00^
C3S
CO
<r
mso
r--
CO
mso
mCM
CNi
Oo
oCO
oo
oON
Os
OSCM
>
+1
sD
+1o
00^
OS
ON
so
CM
y-s
+1
CO
r-~
csj
<t
CM^
+1
so
00^
00
+1P
+T
in
r~
,00
'-s
+1
so
CM
so
+1O
COm
+1
so
in
,CSJ^
+1
in
f-i
CO
+dS
in
.CM ^
+•m
fsj
CO
in
00
SO
in
so
dCO
00
OS
so
so
00
CO
I-l
<!
CM
OT.
tjs
,-1
+1o
Csl
,-(
+1
<!
OS
+1
so
CO
+^
CO
+1
so
+1
r--
m+f
so
+o
oom
+a\
+00
r-l
-l-tm
mCO
o^
CM
OOSCO
OS
CM
OS
00
CM
in
-J
in
CO
CO
CM
d<t
sDO
OOo
OsoSO
OS
<)
00
in
OCM
00
00
00
SO00
CO
+^o
00
d^
+.
so
in
d/-s
+.
CO
OS
CM
d+1
so
CO
.-1
CM
in
O/-s
+1o
oin
CO
—1
+?^;
CM
CO
00
s-^
CM
CM
CM
CM
do
d
sO
OS
sD
OCO
CM
CO
CO
CM
00so
J-
so
c^
o^
+1
CO
CO
>-<
CO^
in
O/-V
d/-s
in
CM
+25
d/-s
+1
r-
+V
(o
in
+'V
?o
CM
-d-
+V
Co
CO
CO
-t-l
OS
CO
CM
od
dCO
CO
CO
co
oOS
oo
oso
oCM
o<f
ooCO
ooO
ooo
1so
o^
1o
O—1
O1
so
o1
CO
OCsl
1so
OO
oin
1so
o1O
oin
oO
r-l
1
Or-l
OCO
<r
01
CO
in
(0
m-J-
in
mCO
12
I
ao
r^
C
D,
00
45

<uc
aUl
•'-I
cd
.-I
3tfl
-3-
C7^
CM
u-1
On
00
00
UOCO
00
CM
in
CO
+?O
00
U-I
CO
+V
Jo
CM
CM
ON-'
vOas w
+1
°°
OCM
St ^
+V
J?
00
CO
o^
+7m
COVON^
+f^
u-1CM
CO
+?G
OVO
-h7
So
00
VO
d/-V
-H
1CO
COVO
N-/
CM
'-N
-Hi
00
CM
r-l
CM ^
u-i
CM
<r
CM
vO
u-i
Oo
UlO
CMu-1
vO
CO
00o
CM
00
u-1
CO
oVO
CM
0000
08-1.
(50)
d^
+1
u-1
.-1
00
~—
-
O^
+1
CO
<f^
+1
VO
OCM
<t ^
CO
+1'CM
N-'
O-I-I
00
r-l
CM
u-1 ^
O-1-1
CO
oo
o^
+1
in
CM
o^
r-lVD
<f
vO
u-1N^
-H?
Jo
in ^
o^
-Hi
oo
-t
1-1
CO
dd
•o-
do
do
'-'
CO
d
<r
CM
CO
o<r
00
CJN
<f
<)
<r
00
CO
CM
u-1
CO
ooo
ONu-1
o^
+>o
ON
LO
d^
+1m
oo^
d/-^
-t-l
CO
CO
d^
-1-1
vO
VD
CNI
d^
-1-1u-1
r-^
o^
+1
00
r-
CM
O'-v
-1-1
CO
VO
O-H^u^
OOCM
00
vD
-H?
So
VO
vO
-H?
Jo
CO
-H?
00
CJv^
Od
o•-'
dd
dd
do
dd
d
U-1
CM
oON
CM
vO
oCO
oCM
CM
CM
CM
Ul
d+1
u-1
d^
+1
CO
d^
-Hi
VO
u-1CM
CO ^
o^
+vi;t
O~
-1-1
00
<r
CN
VO^
-H??r
u-1
00^
+°^
r-
CM
00
VO
CM
N-'
-H?
00
VD
VO
CO
-H?
Jo
u-1
u-1N—
'
-H?
00
VD
1-1
CD
dd
dd
dd
dd
dd
dd
u-1
Ou-1
OVOo
C7N
ou-1
oONo
CO
od^
\0
r-l
Ow
d^
+1
CO
O^
o^
+1
VO
UN|CM
CM
N-'
VOO
N--
O.—
N
+1
u^
CM
o^
-I-I
oo
NO
CM
ON^
+?m
ON^
+?
In
-H?^
CO
CM
c^
vo
.H?S?
r~
vD
-H?J^
oH?S?
dd
dd
dd
od
dd
do
dd
sCMo
COo
COo
CMo
CMo
<ro
VOo
oo
oo
oo
03-0.
(50)
o^
CM
O
o^
+1
r-l
1-1
ON^
o^
+1
u^
o^
-)-l
00
CM
CM
o^
+?J^
o^
-H?^
CM
CM
o^
CO
NO
ON-'
-H?S?
u-1VD
o^
-H?
Jo
u-1
o^
-H?
00
dd
dd
do
dd
dd
dd
dd
VDoCTn
U-1
CO^
u^
+7
^n
CO
1-1
CO^
o4-'^
CO
CM
ON
+?
G"
CM
CM
oVO
N-'
ou-1
dVO
CO
+7
So
u-1CM
00
00
+^
Jo
00
-H"f ^
u-1
CO^
CO00
+7<t
CM
ON W
CO ^
-Hi
NO
VO
VD
CO
/—
>
-Hi
00
00
VO
ON^
-h'VJo
ON
N--
<f ^
-Hi
00
oo^
CJV
v-'
u-1
VD
mVD
VO
vD
Ul
<!
00
vOo
Ul
o>
ON
CMOv
ovO
ON
COON
c^
CO
/-V
-H
1u-1
VO
oo
o<)•
ON
80-25.
(50)
dCO
/-^
+1m
00
r-4
as
.CM
/-N
+1
CO
Ov1-1
C3NCM
00NW
<:n
1-1^
+1
u-1
U-\N^
-H«
00
CM
u-1 ^
1-1
<f ^
+1
CO
VO
u-1 ^
oo
CM
-H
1NO
1-1NO
CO
f-l
y-^
r-<VO
<J- ^
u-1
I-I
N-^
_^CM^
00
r-l
0\
N-/
CO<f
U-1
CO
NO
ON<r
ou-1
COu-1
CO
CO
CM
CO
CO
COo
<J-
o-
I-I
ON
ovO
ON
CM
oON
CO
CO
sUl
Ou-1
<J- ^
r-
i-i<^
o^
vD
H-T*Jo
ON ^
+t
(o
ON
CM
Ul ^
vO
00
ON ^
vD
-1-
100
•st-CM
CO ^
<!•
-Hi
oo
o^
CO
+1
u-1
CJv
vO^
u-1
+1
1-1
<r
CM
1-4
+1
VO
CM
vO
df-l ^
-H
1CO
CM
^O
ON-'
do.*^J^
-H^co
u^
r-l
I-I
00 ^
u-1
CM
CO
du-1
00
CM
dONCM
CO
CM
CM
oCM
CT\
OON
u-1
u-»
CO
C7N
CJN
ou-1
CJN
CM
vO
00
VD
u-1
CM
iTi
U-1
U-1>w
OCO
CM
CM
ON W
d/-N
-Hi
.-I
00
d^
+1
U"l
vOo^
d^
-Hi
00
OCM
00
+1'
Jo
O/—V
-Hi
u^
0^
1-1
N-^
\0
CM
CO ^
u-1VO
CM
N-'
-H?S?
OVO
oo ^
vO
oo ^
-H?
00
oo^
CM
d^'
diH
dd
co
1^O
vDo
ONCO
ON
u-1
a\
u-1
ou-1
oCM
VD
ON
u-1
/-s
+1
r-«
<J-
-H
Jm
00
u-1CM
ON
OVO
VO
+^
CM
00
+?
Jo
CO
CM
CJN ^
-H?
Jo
CO
u-1
N-'
+^o
CO
CM
vO
N-'
+1
CO
CO
NO
CM
N-/
u->^
ON W
d^
-H
1oo
CM
I-Iy-\
+1
1^
ON
,-1
u-1N-/
vO
ooo
<!
oo
ooO
oNO
ooCO
oou-1
o<r
o00
ooON
oON
ooo
ou-1
00
/-N
1o
Ul1
U-1
"l*CO
VO ^1
vO
vO ^1
I-I
00
/-N
1Ul
or-- ^100
OCM
VO1
CO
o1
u-1
ovO
OCM
vO1
VO
OVO
VO ^1
00
OVO
u-1 ^1oo
o
CO
CO
VO
<t
u-1
vO
u-1
-J-
M4-1
O«
0-r-i
O1-1
U01
V4
1-1
•1-1
ta
46
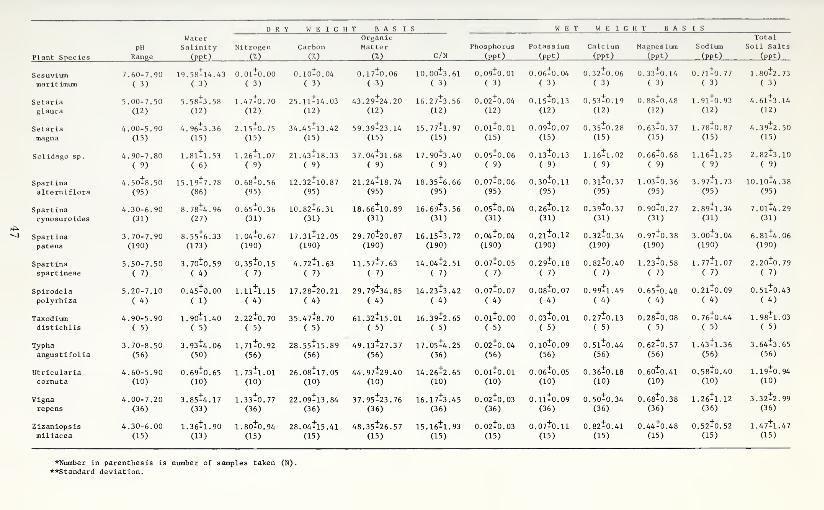
a)
CO
O-H
oin
ooo
CO
ON
oON
CO
<f
COo
in
vO
ON
C3N
ON
<)
1.80^2.( 3
)CM
CM
+1
in
O0^
/-^
+1^
r-lCO
•J-
'-v
+1o
i-l
CTn
d^
Od—
N
+>
<f
+1
in
00
CO ^
+1
VO
<}
u-l
d/->
+1o
CJN
r-l
H-'Vio
CM
+1
U1
<f ^
00
in
CSi
CO
CO
Oo
ONo
-J
VD
CO
OCM
CM
d^
+1
C-l
+7
in
00^
+7'
+'Vi^
ON
CO
O<3N
+?
i?
+?i;^
+7"
io
CO
in
00
r-l
+t
VO
vO
CO
O/-\
+1
lO
CM
1-1
OCO
CM
00
od
dd
<r
oo-J
00
vO
00
CO
00in
00
00o
vT
00CO
00
d--v
r-i
+?
CN
OO^
+?
in
+?
i^
OCO
+?O
+?CO
+?i?
+?
in
00
+?
Co
CM
in
+?o
o^
+?i?
00
CO
<t
.-1
dd
dO
od
do
dd
od
o00
CMO
CO
CO
oCJN
<f
CO
<f
00
-J
CO
d/-V
+1n
d
+?d
o
+7
ST
vO
+?
in
d
0>
CO
d
+?o
CM
ON
d
CM
d
H-'T'i?
c:n
d
+?
i?^
d
+?G
.-1
in
o
lO
r-l
O
-f"?io
OCO
d
CM
t-l
00
N-'
d
oo
nCM
00
oo
oinO
ONo
0.06^0.( 3
)
d
+?
in
a^
.-J
dd
+?
in
OON
d
CO
d
+?O
>-<ON
d
CJN
d
+?
i?
00
o
CO
d
+?
io
oin
d
+?o
vO
r-l
d
+?i?
t-lCO
d
o<^
-hi
in
r~-
t-l
Od
oo
oo
oo
oo
oo
oo
odo^
d^
+1
C-J
CM
.—1
O^
d^
+1
in
o^
d—
~
+1
ON
ino
-
d+1
in
o^
d^
in
CO
o^
d+1o
°s
d^
Oo^
o^
+?i?
CMm
o^
d^
-I-lo
O
.d^
+1
VO
CM
CO
ON--
ON^
dd
dd
dd
dd
dd
dd
dd
in
CO
O1-1
OCO
15
J3
60
bO
<u
•r-lU
>
47
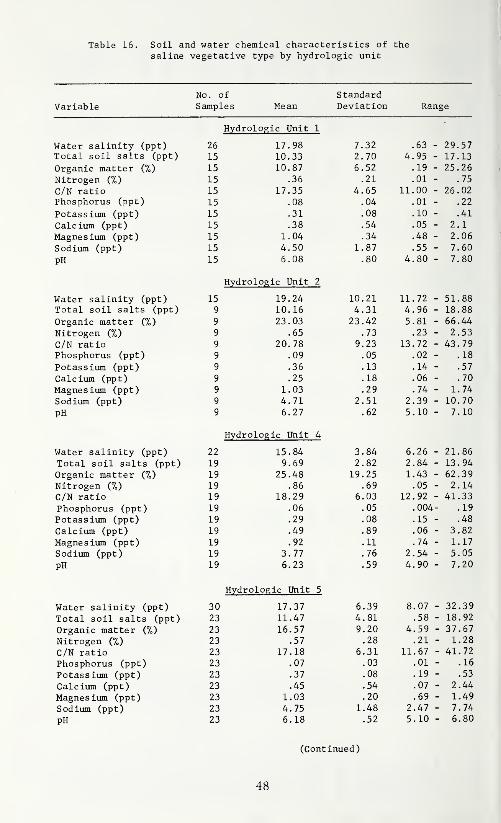
Table 16. Soil and water chemical characteristics of the
saline vegetative type by hydrologic unit
No. of StandardVariable Samples Mean Deviation Range
Hydrologic Unit 1
Water salinity (ppt) 26 17.98 7.32 .63 29.57Total soil salts (ppt) 15 10.33 2.70 4.95 - 17.13
Organic matter (%) ID i U . o / 0 . ji. 1 Q 9 9fi
Nitrogen (%) 15 .36 .21 .01 . 75
f /N tin 15 17.35 4. 65 11,00 26.02Phosphorus (ppt) 15 . 08 .04 .01 .22
Potassium (ppt) 15 .31 .08 . 10 _ .41
Pxi 1 n 1 um ^r>'nt" ^Od X ^ X Liiu ^ ^ ^ 1. y 15 .38 .54 . 05 2 .
1
Magnesium (ppt) 15 1.04 .34 .48 2.06
Sodium (ppt) 15 4.50 1.87 .55 7.60
dH 15 6. 08 .80 4.80 7.80
Hydrologic Unit 2
Water salinity (ppt) 15 19.24 10.21 11. 72 51.88Total soil salts (ppt) 9 10.16 4.31 4.96 - 18.88
Organic matter (%) Q J . oi DO . H-t
Nif'T'OP'pn CL^1- ^J^^LL \/0/ 9 .65 .73 .23 2.53
C/N ratio 9 20. 78 9.23 13. 72 43. 79
Phosphorus (ppt) 9 .09 .05 .02 . 18
i L. CLO O J- ULU y ^ U y 9 .36 . 13 . 14 .57
9 . 25 . 18 . 06 . 70
9 1.03 .29 . 74 1. 74
OUUXLLUl ^ppuy 9 4. 71 2.51 2.39 10. 70
pn 9 6.27 . 62 5. 10 7. 10
Hydrologic Unit 4
Water salinity (ppt) 22 15.84 3.84 6.26 21.86
Total soil salts (ppt) 19 9.69 2.82 2.84 - 13.94DTCTflnir mattPT ("/
^
19 25.48 19.25 1.43 62.39Nitrogen (%) 19 .86 .69 .05 _ 2.14C/N ratio 19 18.29 6.03 12.92 _ 41.33
Phosphorus (ppt) 19 .06 .05 .00^ - .19
Potassium (ppt) 19 .29 .08 .15 - .48
Calcium (ppt) 19 .49 .89 .06 - 3.82
Magnesium (ppt) 19 .92 .11 .74 _ 1.17
Sodium (ppt) 19 3.77 .76 2.54 _ 5.05
PH 19 6.23 .59 4.90 _ 7.20
W^TflTnl no-i r TTn i t" 5
Water salinity (ppt) 30 17.37 6.39 8. 07 32.39
Total soil salts (ppt) 23 11.47 4.81 .58 18.92
Organic matter (%) 23 16.57 9.20 4.59 37.67
Nitrogen (%) 23 .57 .28 .21 1.28
C/N ratio 23 17.18 6.31 11.67 41.72
Phosphorus (ppt) 23 .07 .03 .01 .16
Potassium (ppt) 23 .37 .08 .19 .53
Calcium (ppt) 23 .45 .54 .07 2.44
Magnesium (ppt) 23 1.03 .20 .69 1.49
Sodium (ppt) 23 4.75 1.48 2.47 7.74
pH 23 6.18 .52 5.10 6.80
(Continued)
48
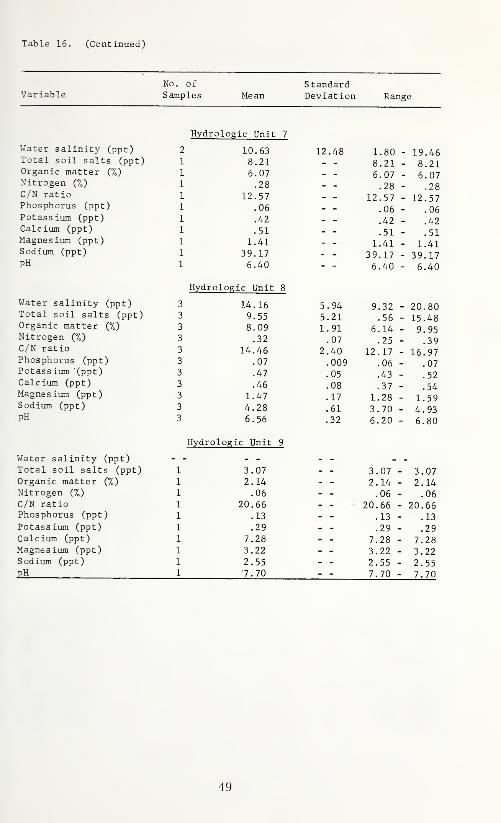
Table 16. (Continued)
No. of StandardVariable Samples Mean Deviation Range
Water salinity (ppt)Total soil salts (ppt)Organic matter (7o)
Nitrogen (%)C/N ratioPhosphorus (ppt)
Potassium (ppt)Calcium (ppt)
Magnesium (ppt)Sodium (ppt)
PH
Hydrologic Unit 7
10.638.216.07.28
12.57.06
.42
.51
1.4139.176.40
12.48 1.808.216.07.28
12.57.06
.42
.51
1.4139.176.40
19.468.216.07.28
12.57.06
.42
.51
1.4139.176.40
Hydrologic Unit 8
Water salinity (ppt) 3 14.16 5.94 9.32 -
Total soil salts (ppt) 3 9.55 5.21 .56 -
Organic matter (%) 3 8.09 1.91 6.14 -
Nitrogen (%) 3 .32 .07 .25 -
C/N ratio 3 14.46 2.40 12.17 -
Phosphorus (ppt) 3 .07 .009 .06 -
Potassium (ppt) 3 .47 .05 .43 -
Calcium (ppt) 3 .46 .08 .37 -
Magnesium (ppt) 3 1.47 .17 1.28 -
Sodium (ppt) 3 4.28 .61 3.70 -
pH 3 6.56 .32 6.20 -
20.8015.489.95
.39
16.97.07
.52
.54
1.594.936.80
Hydrologic Unit 9
Water salinity (ppt) - -
Total soil salts (ppt) 1 3 07 3 07 - 3. 07Organic matter (%) 1 2 14 - - 2 14 - 2. 14Nitrogen (%) 1 06 06 - 06C/N ratio 1 20 66 - - 20 66 - 20. 66Phosphorus (ppt) 1 13 13 - 13Potassium (ppt) 1 29 29 - 29Calcium (ppt) 1 7 28 - - 7 28 - 7. 28Magnesium (ppt) 1 3 22 3 22 - 3. 22Sodium (ppt) 1 2 55 - - 2 55 - 2. 55pH 1 •7 70 7 70 - 7. 70
49

Table 17. Soil and water chemical characteristics of the
brackish vegetative type by hydrologic unit
No. of Standard
Variable Samples Mean Deviat ion Range
Hydrologic Unit i
Water salinity (ppt) 31 10.87 3.77 4. 67 - 18.39
Total soil salts (ppt) 25 7.36 1.96 3. 75 - 10.35
Organic matter (7c,) 25 29.22 1 Q 9 QJ .A7 _0 /
- ftc: 79
Nitrogen (%) 25 1.01 .93 11 - 5.00
C/N ratio 25 19.22 5.82 1. 76 - 32.07
Phosphorus (ppt) 25 .04 9'^
Potassium (ppt) 25 0.23 ii -. D 1
Calcium (ppt) 25 .18 9 ^'\
Magnesium (ppt) 25 .83 . 27 53 - 1. 93
soaium ^ppt^ 25 3.22 . 92 X
.
60 - 4 . 92
nilpH 25 5.45 . 87 3
.
, 70 - 7.80
Hydrologic Unit 2
Water salinity (ppt) 17 11.55 3.27 4,.35 - 14.96
Total soil salts (ppt) 16 8. 94 4.10 4,.85 - 21.25
Organic matter (%) 16 29.25 16.94 1,.95 - 57.83
Nitrogen (%) 16 1. 16 .72 .08 - 2.66
C/N ratio io 1 /i 1 r> 4.79 1,.00 - 20.48
Phosphorus (ppt) io . Uj .03 .01 - .11
Potassium (ppt) 1 A 9 1 .06 .15 - .39
Calcium (ppt) io on .21 .05 - .72
Magnesium (ppt) io ft7 .15 .62 - 1.17
Sodium (ppt) io .86 1,.72 - 4.90
pH 16 5.56 .92 4 .00 - 6.90
Hydrologic Unit J
Water salinity (ppt) 8 8.54 5.69 1,.34 - 17.51
Total soil salts (ppt) 6 7.82 3.51 3,.63 - 13.38
Organic matter (%) 6 26.43 9Q fil /. 79 7"^
Nitrogen (%) 6 .69 .73 .10 - 1.89
C/N ratio 6 23.81 12.51 12 .69 - 45.20
Phosphorus (ppt) 6 .10 07 . 19
Potassium (ppt) 6 .23 no 19 _. J J
Calcium (ppt) 6 .64 Q7 . 08 - 2 . 50
Magnesium (ppt) 6 .94 9fi 70 - 1.42
Sodium (ppt) 6 2.24 1 1. OU
pH 6 5.86 ft9. oZ J 10- 7.30
Hydrologic Unit /,
Water salinity (ppt) 21 9. 68 5.11 3 .28 - 28.08
Total soil salts (ppt) 21 7.44 3.39 2 .10 - 15.17
Organic matter (%) 21 48.74 18.92 14 .72 - 77.25
Nitrogen (%) 21 1.59 .611 .64 - 2.47
C/N ratio 21 18.07 4.76 13 .31 - 36.20
Phosphorus (ppt) 21 .01 .01 .003- .06:
Potassium (ppt) 21 .16 .06 .07 - .34
Calcium (ppt) 21 .17 .10 .03 - .41
Magnesium (ppt) 21 .76 .21 .44 - 1.45
Sodium (ppt) 21 3.19 1.10 1 .47 - 5.94
pH 21 5.48 .58 4 .40 - 6.40
(Continued)
50
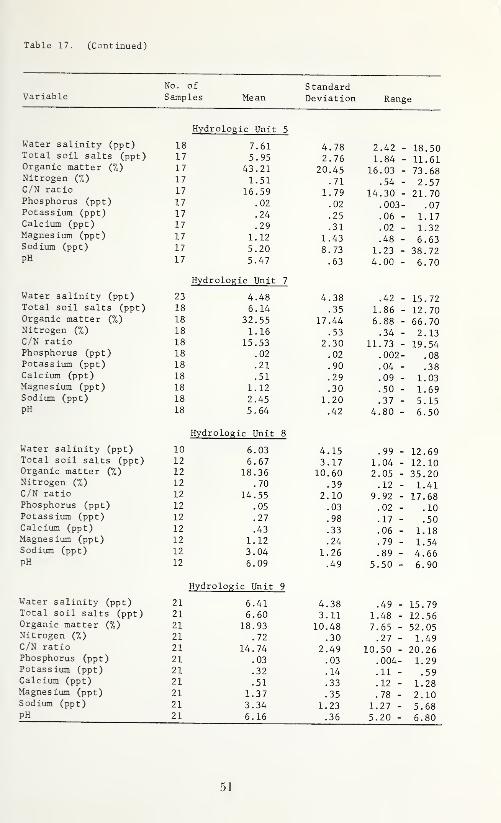
Table 17. (Continued)
No. of StandardVariable Samples Mean Deviation Range
Hydrologic Unit 5
Water salinity (ppt) 18 7. 61 4 . 78 oi. .42 io . DU
Total soil salts (ppt) 17 5.95 2.76 1 .84 11 .61Organic matter (7o) 17 43.21 20.45 16 .03 73 .68Nitrncpn (^''^ ^i1 J. L. J. WgC 11 \/oJ
1 7i / 1.51 . 71 .54 2 .57C/N ratio 1 71 / 16.59 1. 79 14 .30 21 . 70Phosphorus (ppt) 1 7
. 02 .02 .003- .07Potassium (ppt) 1 7
.25 .06 1 .171 7 .29 .31 .02 1 .32
!•(p OTIP Q T MTTl /'T^Tlt-^ilCi^llCo 1. Lliil I p U L J1 7
1. 12 1.43 .48 6 .63Sodium (ppt) 17 5.20 = 8.73 1 .23 38 ,72
1 -7
17 5.47 .63 4 .00 6 .70
Hydrologic Unit 7
Water salinity (ppt) 23 4.48 4.38 .42 J. J 79Total soil salts (ppt) 18 6.14 .35 1 .86 12 .70Organic matter (%) io 32 . 55 17.44 6 .88 66 . 70Nitrogen (%) 18 J. . i.O . JJ .34 2 . 13C/N ratio 18 15 . 53 9 ii .73 1 nib . 54Phosphorus (ppt) 18 no no .002- . 08Potassium (ppt) 18 91 QO
. 04 .38Calcium (ppt) 18 • D i.
0 Q. zy .09 1 . 03
Magnesium (ppt) 18 1 19 .50 1 . 69Sodium (ppt) 18 1 9C\ .37 5 . 15pH 18 5 . 64 /, .80 o C A
. jU
HvdTn1ncn'r> TTn-Il- filljr vxi. v./ VJllJ-l- t)
Water salinity (ppt) 10 6. 03 4 . 15 .99 . OyTotal soil salts (ppt) 12 6.67 3.17 1,.04 12,.10
12 18.36 10. 60 2
,
.05 35,.20Nitrogen (%) 12 .70 . J7 .12 1
.
C/N ratio 12 14.55 2. 10 Q ,92 1 7, Do
Phosphorus (ppt) 12 .05 . \jo ,02 1 r>, iU
Potassium (ppt) 12 .27 QS. yo ,17 c r\
, _)U
Calcium (ppt) 12 .43 . JJ ,06 1i ., io
Magnesium (ppt) 12 1.12 79 1 54Sodium (ppt) 12 3.04 19ft
i. • Z0 89 /,^-
.
c cDOpH 12 6.09 cJ . 50 o
.
yu
Hydrologic Unit 9
Water salinity (ppt) 21 6.41 4.38 49 15. 79Total soil salts (ppt) 21 6.60 3.11 1. 48 12. 56Organic matter (%) 21 18.93 10.48 7. 65 52. 05Nitrogen (%) 21 .72 .30 27 1. 49C/N ratio 21 14.74 2.49 10. 50 20. 26Phosphorus (ppt) 21 .03 .03 004 1. 29Potassium (ppt) 21 .32 .14 11 59Calcium (ppt) 21 .51 .33 12 1. 28Magnesium (ppt) 21 1.37 .35 78 2. 10Sodium (ppt) 21 3.34 1.23 1. 27 5. 68pH 21 6.16 .36 5. 20 6. 80
51

Table 18. Soil and water chemical characteristics of the
intermediate vegetative type by hydrologic unit
No. of Standard
Variable Samples Mean Deviation Range
H\7H Toloo'ir' TTnil" I
• •
Water salinity (ppt) 2 2 . 74 . 04 2 . 71 2. 77
Total soil salts (ppt) 2 3.99 .96 3.31 - 4.67
Organic matter (%) 2 38.21 38 . 48 11 . 00 65 .43
Nitrogen 2 1 . 29 1.67 .43 2.26
C/N ratio 2 15 . 81 1 . 38 14 . 83 16. 79
Phosphorus (ppt) 2 . 04 . 05 . 004 . 08
Potassium (ppt) 2 , 18 . 17 . 06 .30
Calcium (ppt) 2 . 09 . 05 . 05 . 14
2 . 63 .31 .40 .85
Sodium (ppt) 2 1 . 68 . 28 1.48 1.88
ptl 2 5 . 40 .56 5 . 00 5.80
fJ-iT/^ vol o cr "1 n TTn n t"ny u. L u i. u j:^ XL. uiixL 2
Water salinity (ppt)
}
A4 . J O 4.58 4 . 58
Total soil salts (ppt) 3.53 - - 3.53 - 3.53
Organic matter (%) 69.03 69. 03 69. 03
Nitrogen (%) 1 . 95 1. 95 1. 95
kj / vi rat lo 20. 53 20. 53 20. 53
Phosphorus (ppt) . 005 . 005 . OOf
Potassium (ppt) . 05 .05 . 05
Calcium (ppt)-
, 03 . 03 . 03
.41 .41 .41
Sodium (ppt) 1.46 1.46 1.46
3.80 3.80 3.80
Hydrologic Unit 3
Water salinity (ppt) 2.55 2 . 33 .49 5 . 93
Total soil salts (ppt) 2.86 1.52 .24 4.58
Organic matter (%) 11.99 20.60 .64 58.44
Nitrogen (%) .55 1.01 .02 2.83
C/N ratio 14.54 2.88 11,22 18.50
Phosphorus (ppt) .13 .05 .02 .20
Potassium (ppt) .22 .16 .06 .57
Calcium (ppt) 1.12 .84 .18 2.41
Magnesium (ppt) 1.08 .53 .33 2.05
Sodium (ppt) 1.45 .99 .50 3.01
PH 6.97 .90 5.80 8.10
(Continued)
52
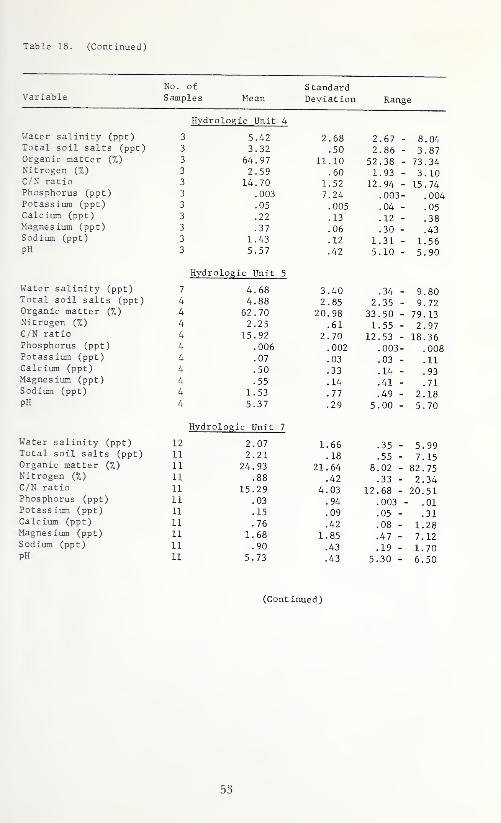
Table 18. (Continued)
No. of StandardVar iab le Samples Mean Deviation Range
Hydro log ic Unit 4
Water salinity (ppt) 3 5.42 2.68 2 .67 - 8 .04Total soil salts (ppt) 3 3.32 .50 2 86 - 3 .87Organic matter (%) 3 64.97 11.10 52 38 - 73 34Nitrogen (%) 3 2.59 .60 1 93 - 3 10C/N ratio 3 14.70 1.52 12 94 - 15 .74Phosphorus (ppt) 3 .003 7.24 003- 004Potassium (ppt) 3 .05 .005 04 - 05Calcium (ppt) 3 .22 .13 12 - 38Magnesium (ppt) 3 .37 .06 30 - 43Sodium (ppt) 3 1.43 .12 1 31 - 1 56PH 3 5.57 • .42 5 10 - 5 90
Hydrologic Unit 5
Water salinity (ppt) 7 4.68 3 40 .34 - 9.80Total soil salts (ppt) 4 4.88 2 85 2 35 - 9.72Organic matter (%) 4 62.70 20 98 33 50 - 79.13Nitrogen {%) 4 2.25 61 1 55 - 2.97C N ratio 4 15.92 2 70 12 53 - 18.36Phosphorus (ppt) 4 .006 002 003- .008Potassium (ppt) 4 .07 03 03 - .11Calcium (ppt) 4 .50 33 14 - .93Magnesium (ppt) 4 .55 14 41 - .71Sodium (ppt) 4 1.53 77 49 - 2.18pH 4 5.37 29 5 00 - 5.70
Hydrologic Unit 7
Water salinity (ppt)Total soil salts (ppt)Organic matter (%)Nitrogen (%)
C/N ratioPhosphorus (ppt)Potassium (ppt)
Calcium (ppt)
Magnesium (ppt)
Sodium (ppt)
pH
2.07 1.66 .35 - 5 992.21 .18 .55 - 7 15
24.93 21.64 8.02 - 82 75.88 .42 .33 - 2 34
15.29 4.03 12.68 - 20. 51.03 .94 .003 • 01.15 .09 .05 - 31.76 .42 .08 - 1. 28
1.68 1.85 .47 - 7. 12.90 .43 .19 - 1. 70
5.73 .43 5.30 - 6. 50
(Continued)
53

Table 18. (Continued)
Variable
No. of
Samples MeanStandardDeviation Range
Water salinity (ppt)
Total soil salts (ppt)
Organic matter (%)
Nitrogen (7o)
C/N ratioPhosphorus (ppt)
Potassium (ppt)
Calcium (ppt)
Magnesium (ppt)
Sodium (ppt)
pH
Hydrologic Unit 8
Water salinity (ppt) 9 1 85
Total soil salts (ppt) 8 2 39
Organic matter (%) 8 21 11
Nitrogen (%) 8 79
C/N ratio 8 14 69
Phosphorus (ppt) 8 03
Potassium (ppt) 8 21
Calcium (ppt) 8 67
Magnesium (ppt) 8 1 .45
Sodium (ppt) 8 1 .44
pH 8 5 .70
Hydrologic Unit 9
.65 .53 - 5.38
1 .36 .64 - 4.30
13 .71 6.81 - 52.50
.31 .35 - 1.35
3 .94 11.28 - 22.55
.02 .006- .09
.09 .07 - .37
.29 1.11 - .44
.31 1.04 - 1.93
.56 .76 - 2.42
.37 5.10 - 6.10
2 43 1.45 .90 - 6.04
5 12 4.52 .55 - 16.53
28 35 22.51 2 .60 - 69.19
1 05 .53 .39 - 2.20
15 62 4.49 8 .19 - 24.14
01 .01 .002- .05
.16 .09 .05 - .31
.63 .42 .13 - 1.45
1 .30 .72 .40 - 3.06
2 .20 1.50 .42 - 5.88
5 .78 .38 5 .30 - 6.30
Table 19. Soil and water chemical characteristics of the
fresh vegetative type by hydrologic unit
Var iable
No. of
Samples MeanStandardDeviation Range
Water salinity (ppt)
Total soil salts (ppt)
Organic matter (%)
Nitrogen (%)
C/N ratioPhosphorus (ppt)
Potassium (ppt)
Calcium (ppt)
Magnesium (ppt)
Sodium (ppt)
pH
Hydrologic Unit 1
5 3.98 2.11 1.09 - 6.66
3 2.49 .49 2.13 - 3.04
3 52.99 23.77 25.77 - 69.67
3 1.67 1.00 .63 - 2.64
3 19.97 4.28 15.30 - 23.73
3 .01 .01 .002- .024
3 .05 .02 .02 - .08
3 .14 .08 .06 - .23
3 .35 .09 .29 - .46
3 .76 .12 .71 - .81
3 4.76 .23 4.50 - 4.90
(Continued)
54

Table 19. (Continued)
VariableNo . of
Samples MeanStandardDeviation Range
Hydrologic Unit 3
Water salinity (ppt) 12 .89 . 63 .37 - 2 64Total soil salts (ppt) 9 1.24 1. 13 .30 - 3 88Organic matter (7o) 9 6.22 3.55 2 .91 - 12 38Nitrogen (%) 9 .23 . 15 HQ
. uy - 59C/N ratio 9 16.39 • 4.24 22 .81 - 25Phosphorus (ppt) 9 .17 - .08 .08 - 30Potassium (ppt) 9 .16 . 09 -
Calcium (ppt) 9 1.49 . 97 27 - 3 08Magnesium (ppt) 9 .99 .25 56 - I 38Sodium (ppt) 9 .39 .20 19 - 84pH 9 6.61 '.72 5 30 - 7 ^ 20
Hydrologic Unit 4
Water salinity (ppt) 24 1.81 1.22 100- 4. 51Total soil salts (ppt) 25 1.79 1.11 06 - 4. 09Organic matter (%) 25 67.35 18.58 23 12 - 89. 03Nitrogen (7r,) 25 2.28 .60 79 - 3. 12L, / JN rac lo 25 17.28 2 . 22 11 04 - 22. 60Phosphorus (ppt) 25 .007 .006 002- 027Potassium (ppt) 25 .02 .01 004- 06Calcium (ppt) 25 .44 .30 07 - 1. 23Magnesium (ppt) 25 .22 .13 03 - 54Sodium (ppt) 25 .64 .45 02 - 1. 49pH 25 5.10 .42 4 10 - 5. 90
Hydrologic Unit 5
Water salinity (ppt) 30 .73 .92 09 - 4. 54Total soil salts (ppt) 28 1.48 2.19 003- 9. 07Organic matter (%) 28 67.57 22.31 7 69 - 88. 77Nitrogen (%) 28 2.37 .74 39 - 3. 35C/N ratio 28 16.40 3.28 10 33 - 24. 22Phosphorus (ppt) 28 .008 .009 001- 04Potassium (ppt) 28 .04 .04 008- 20Calcium (ppt) 28 .84 .62 05 - 2. 10Magnesium (ppt) 28 .40 .46 08 - 2. 25Sodium (ppt) 28 .46 .63 05 - 2. 43pH '28 5.24 .43 4 30 - 6. 30
(Continued)
55
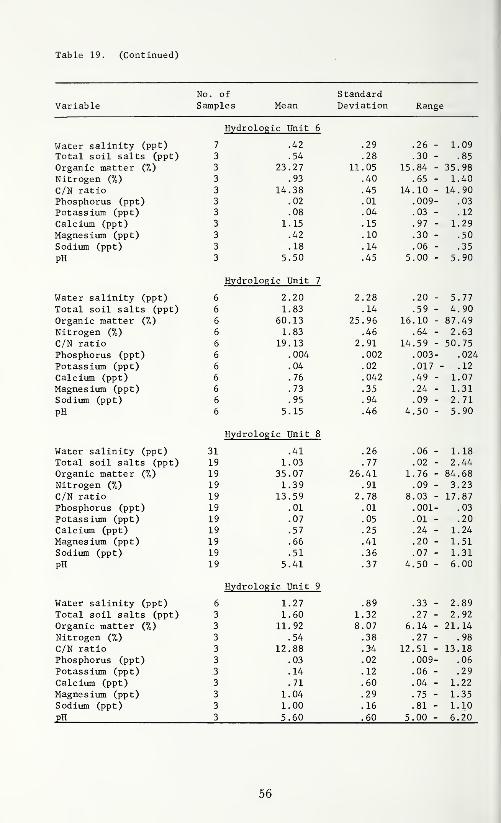
Table 19. (Continued)
No. of StandardVariable Samples Mean Deviation Range
Hydrologic Unit 6
Water salinity (ppt) 7 .42 .29 .26 - 1.09Total soil salts (ppt) 3 .54 .28 .30 - .85
Organic matter (7o) 3 23.27 11.05 15.84 - 35.98Nitrogen (%) 3 .93 .40 .65 - 1.40
C/N ratio 3 14.38 .45 14.10 - 14.90Phosphorus (ppt) 3 . 02 .01 .009- .03
Potassium (ppt) 3 . 08 . 04 .03 -. 12
Calcium (ppt) 3 1. 15 . 15 . 97 - 1 .29
Magnesium (ppt) 3 .42 . 10 .30 - .50
Sodium (ppt) 3 . 18 . 14 .06 - .35
PH 3 5.50 .45 5.00 - 5. 90
Hydrologic Unit 7
Water salinity (ppt) 6 2.20 2.28 .20 - 5.77Total soil salts (ppt) 6 1.83 .14 .59 - 4. 90
Organic matter (7o) 6 60.13 25.96 16.10 - 87.49Nitrogen (%) 6 1.83 .46 .64 - 2.63
C/N ratio 6 19. 13 2.91 14.59 - 50.75Phosphorus (ppt) 6 .004 .002 .003- .024
Potassium (ppt) 6 .04 .02 .017 •- .12
Calcium (ppt) 6 . 76 .042 .49 - 1.07
Magnesium (ppt) 6 .73 .35 .24 - 1.31Sodium (ppt) 6 .95 . 94 .09 - 2. 71
pH 6 5. 15 .46 4.50 - 5.90
Hydrologic Unit 8
Water salinity (ppt) 31 .41 .26 .06 - 1.18Total soil salts (ppt) 19 1.03 .77 .02 - 2.44Organic matter (7o) 19 35.07 26.41 1.76 - 84.68Nitrogen (%) 19 1.39 .91 .09 - 3.23
C/N ratio 19 13.59 2.78 8.03 - 17.87Phosphorus (ppt) 19 .01 .01 .001- .03
Potassium (ppt) 19 .07 .05 .01 - .20
Calcium (ppt) 19 .57 .25 .24 - 1.24Magnesium (ppt) 19 .66 .41 .20 - 1.51Sodium (ppt) 19 .51 .36 .07 - 1.31
pH 19 5.41 .37 4.50 - 6.00
Hydrologic Unit 9
Water salinity (ppt) 6 1.27 .89 .33 - 2.89Total soil salts (ppt) 3 1.60 1.32 .27 - 2.92Organic matter (%) 3 11.92 8.07 6.14 - 21.14Nitrogen (%) 3 .54 .38 .27 - .98
C/N ratio 3 12.88 .3-4 12.51 - 13.18Phosphorus (ppt) 3 .03 .02 .009- .06
Potassium (ppt) ,3 .14 .12 .06 - .29
Calcium (ppt) 3 .71 .60 .04 - 1.22
Magnesium (ppt) 3 1.04 .29 .75 - 1.35Sodium (ppt) 3 1.00 .16 .81 - 1.10
pH 3 5.60 .60 5.00 - 6.20
56

Table 20. Water salinity (ppt) by hydrologicunit and vegetative type
Hydrologic No. of StandardUnit Samples Mean Deviation Range
Saline Vegetative Type
1 26 17.98 7.,32 63 - 29.57
2 15 19.24 10,,21 11. 72 51.88
3
4 22 15.84 3,,84 6. 26 21.86
5 30 17.37 6.,39 8. 07 32.39
6
7 2 10.63 12.48 1. 80 - 19.46
8
9
3 14.16 5,
-
.94-
9. 32 20.80
Brackish Vegetative Type
1 31 10.81 3,.77 4. 67 - 18.39
2 17 11.55 3,.27 4. 35 14. 96
3 8 8.54 5,.69 1
.
34 17.51
4 21 9.68 5,. 11 3, 28 28.08
5 18 7.61 4,.78 2. 42 18.50
6
7 23 4.48
-
4,
-
.38 42 - 15.72
8 10 6.03 4,.15 99 12.69
9 21 6.41 4,.38 49 15.79
Intermediate Vegetative Type
1 2 2.74 .04 2. 71 - 2.77
2 1 4.58 4. 58 4. 58
3 7 2.55 2,.23 49 5.93
4 3 5.42 2,.68 2. 67 8.04
5 7 4.68 3,.40 34 _ 9.80
6
7 12 2.07 1,.66 35 5.998 9 1.85 1..65 53 5.38
9 10 2.43 1,.45 90 6.04
Fresh Vegetative Type
1 5 3.98 2,.11 1. 09 6.662
3 12 .89 .63 37 2.64
4 24 1.81 1.22 100- 4.515 30 .73 .92 09 4.546 7 .42 .29 26 1.09
7 6 2.20 2.28 20 5.778 31 .41 .26 06 1.189 6 1.27 ,89 33 2.89
57
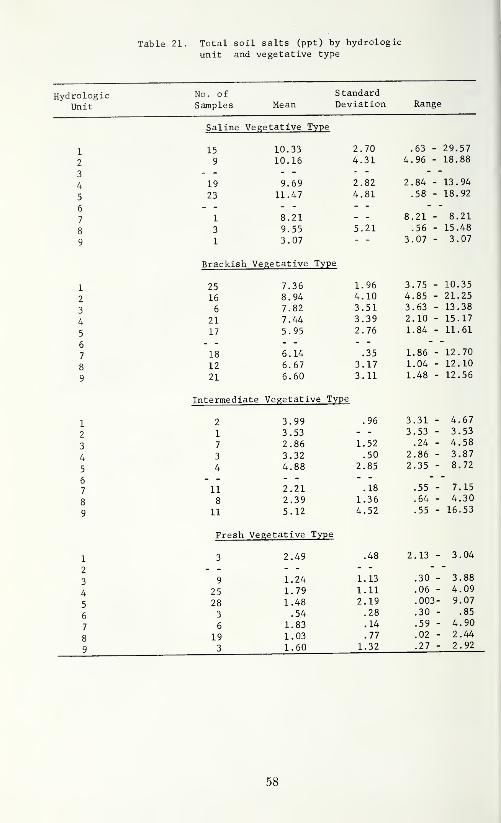
Table 21. Total soil salts (ppt) by hydrologic
unit and vegetative type
Hydrologic No. of Standard
Unit Samples Mean Deviation Range
Saline Vegetative Type
1 15 10.33 2. 70 .63 - 29.57
2 9 10.16 4
.
31 4. 96 - 18 . 88
oJ1,M- 19 9.69 2. 82 2.84 - 13.94cJ 23 11.47 4. 81 .58 - 18.92
c.D
7 1 8.21 _ _ 8.21 - 8.21
fio 3 9.55 5. 21 .56 - 15.48
y 1 3.07 3.07 - 3.07
Brackish Vegetative Type
1 25 7.36 1. 96 3.75 - 10.35
2 16 8.94 4 10 4.85 - 21. 25
J 6 7.82 3 51 3.63 - 13.38A4 21 7.44 3 39 2.10 - 15.17
5 17 5.95 2 76 1.84 - 11.61
6
7 18 6.14 35 1.86 - 12.70
8 12 6.67 3 17 1.04 - 12. 10
9 21 6.60 3 11 1.48 - 12.56
Intermediate Vegetative Type
1 2 3.99 .96 3.31 - 4.67
2 1 3.53 3.53 - 3.53
7 2.86 1.52 .24 - 4.58
3 3.32 .50 2.86 - 3.87
5 4 4.88 2 .85 2.35 - 8. 72
67 11 2.21 .18 .55 - 7.15
Q '
O 8 2.39 1 .36 .64 - 4.30
11 5.12 4 .52 .55 - 16.53
Fresh Vegetative Type
1 3 2.49 .48 2.13 - 3.04
2
3 9 1.24 1 .13 .30 - 3.88
4 25 1.79 1 .11 .06 - 4.09
5 28 1.48 2 .19 .003- 9.07
6 3 .54 .28 .30 - .85
7 6 1.83 .14 .59 - 4.90
8
9
19 1.03 .77 .02 - 2.44
3 1.60 1 .32 .27 - 2.92
58

Table 22. Organic matter content (percent) of marsh soils byhydrologic unit and vegetative type
irologic No. of StandardUnit Samples1 Mean Deviat ion Range
Saline Vegetative Type
1 15 10.87 6.52 .19 - 25.262
3
9 23.03 23 .42 5.81 - 66.44
4 19 25.48 19 .25 1.43 - 62,395
5
23 16.57 9.20 4.59 - 37. 67
7 1 6.07 6.07 - 6.07so 3 8.09 1 .91 6.14 - 9.95Q 1 2.14 2.14 - 2. 14
Brackish Vegetative Type
1 25 29.22 19 .25 3.67 - 85.722 16 29.25 16.94 1.95 - 57.833 6 26.43 29 .61 4.98 - 72.754 21 48.74 18 .92 14.72 - 77.255 17 43.21 20 .45 16.03 - 73.68
7 18 32.55 17 .44 6.88 - 66.708 12 18.36 10 .60 2.05 - 35.209 21 18.93 10 .48 7.65 - 52.05
Intermediate Vegetative Type
l 2 38.21 38,.48 11.00 - 65.432 1 69.03 69.03 - 69.033 7 11.99 20,.60 .64 - 58.444 3 64.97 11..10 52.38 - 73.345
64 62.70 20.98 33.50 - 79. 13
7 11 24.93 21.,64 8.02 - 82. 758 8 21.11 13. 71 6.81 - 52.509 11 28.35 22. 51 2.60 - 69. 19
Frei3h Vegetative Type
23 52.99 23. 77 25.77 - 69.67
3 9 6.22 3. 55 2.91 - 12.384 25 67.35 18. 58 23.12 - 89.035 28 67.57 22. 31 7.69 - 88.776 3 23.27 11. 03 15.84 - 35.987 6 60.13 25. 96 16.10 - 87.498 19 35.07 26. 41 1.76 - 84.689 3 11.92 8. 07 6.14 - 21.14
59
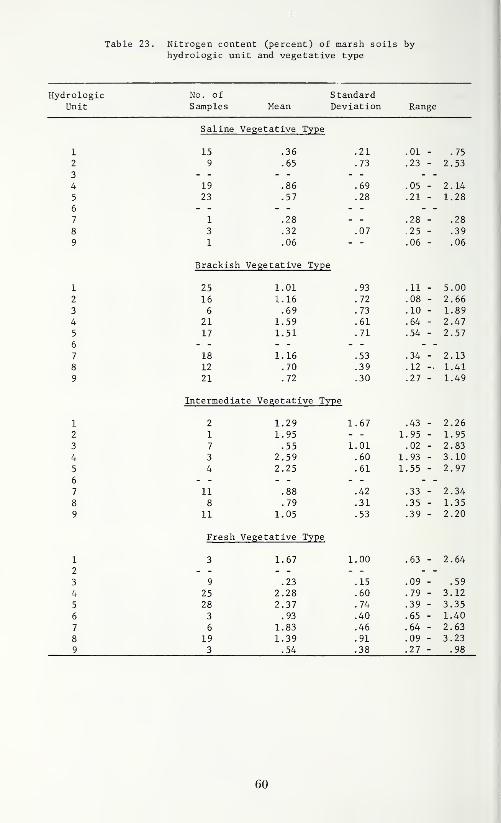
Table 23. Nitrogen content (percent) of marsh soils byhydrologic unit and vegetative type
Hydrologic No. of StandardUnit Samples Mean Deviation Range
Saline Vegetative Type
1 15 .36 21 .01 - .75
2 9 .65 73 .23 2.53
3
4 19 .86 69 .05 2. 14
5 23 .57 28 .21 1.28
6
7 1 .28 - - .28 - .28
8 3 .32 07 .25 .39
9 1 .06 . 06 .06
Brackish Vegetative Type
1 25 1.01 93 .11 - 5.002 16 1.16 72 .08 2.663 6 .69 73 . 10 1 . 89
4 21 1.59 61 . 64 2 .47
5 17 1.51 71 . 54 2.576
7 18 1.16 53 .34 2. 13
8 12 .70 39 . 12 1.41
9 21 .72 30 .27 1.49
Intermediate Vegetative Type
1 2 1.29 1 67 .43 - 2.26
2 1 1.95 1. 95 1. 95
3 7 .55 1 01 .02 - 2.83
4 3 2.59 60 1.93 3.10
5 4 2.25 61 1.55 2.97
6
7 11 .88 42 .33 2.34
8 8 .79 31 .35 1.35
9 11 1.05 53 .39 2.20
Fresh Vegetative Type
1 3 1.67 1 00 .63 2.642
3 9 .23 15 .09 .59
4 25 2.28 60 .79 3.12
5 28 2.37 74 .39 3.35
6 3 .93 40 .65 1.40
7 6 1.83 46 .64 2.63
8 19 1.39 91 .09 3.23
9 3 .54 38 .27 .98
60
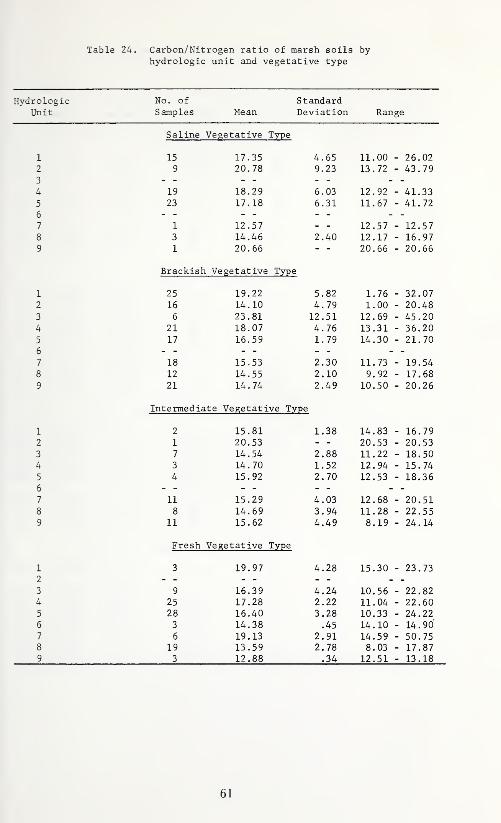
Table 24. Carbon/Nitrogen ratio of marsh soils byhydrologic unit and vegetative type
Hydrologic No. of StandardUnit Samples Mean Deviation Range
Saline Vegetative Type
1 15 17.35 4
,
65 11
.
00 26. 02
2 9 20.78 9
.
23 13
.
72 43 . 79
3
4 19 18.29 6. 03 12. 92 - 41.33
5 23 17.18 6. 31 11. 67 - 41.726
7 1 12.57 12, 57 12.578 3 14.46 2. 40 12. 17 - 16.97
9 1 20.66 20. 66 20.66
Brackish Vegetative Type
1 25 19.22 5. 82 1.,76 32.072 16 14.10 4. 79 1.,00 20.483 6 23.81 12. 51 12.,69 45.204 21 18.07 4. 76 13.,31 - 36.205 17 16.59 1. 79 14.,30 21.706
7 18 15.53 2. 30 11.,73 19.548 12 14.55 2. 10 9..92 - 17.689 21 14.74 2. 49 10.50 20.26
Intermediate Vegetative Type
1 2 15.81 1. 38 14.83 16.792 1 20.53 20.53 20.533 7 14.54 2. 88 11.,22 18.504 3 14.70 1.52 12.,94 15. 74
5
6
4 15,92 2. 70 12.,53 18.36
7 11 15.29 4. 03 12.,68 20. 51
8 8 14.69 3. 94 11.,28 22.559 11 15.62 4.49 8.19 24.14
Fresh Vegetative Type
1
2
3 19.97 4. 28 15.,30 23.73
3 9 16.39 4. 24 10.,56 22.824 25 17.28 2. 22 11.,04 22.605 28 16.40 3. 28 10.,33 24.226 3 14.38 45 14.,10 14.907 6 19.13 2. 91 14.,59 50.758 19 13.59 2. 78 8.,03 17.879 3 12.88 34 12.,51 13.18
61
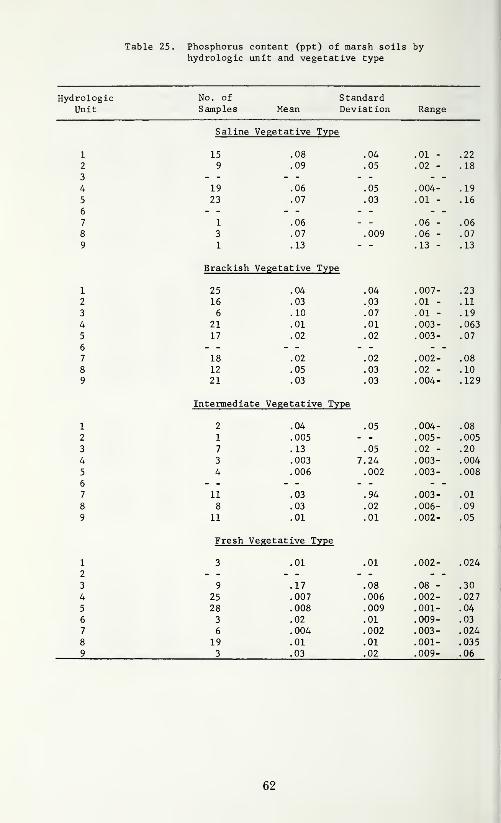
Table 25. Phosphorus content (ppt) of marsh soils byhydrologic unit and vegetative type
Hydrologic No. of StandardUnit Samples Mean Deviation Range
Salme Vegetative Type
1 1 cij .08 .04 m. Ui -
. ZZ
2 9 .09 .05 .02 - .18
3
4 19 .06 . 05 .004- .19
5 23 .07 . 03 .01 - .16
b•7
7 1 .06 _ _. Uo -
. Uofto 3 .07 .009 . Uo -
. U /
Q 1 .13 1 Q 1
Brackish Vegetative Type
1 25 .04 .04 . UU /- o o. li
2 16 .03 .03 .01 - .11
3 6 .10 .07 .01 - .19
4 21 .01 . 01 .003- .063
5 17 .02 . 02 .003- .07
67/ 18 .02 . 02 . UUZ- . UoQo 12 .05 . 03 . UZ -
Q 21 .03 . UJ nn/i -. \J\JH~ . iz?
Intermediate Vegetative Type
1 2 .04 .05 . KJyjH - . Uo
2 1 .005 .005- .005
3 7 .13 .05 .02 - .20
4 3 .003 7.24 .003- .004
5 4 .006 . UUZ .003- .008
6
7 11 .03 . 94 .003- .01QO 8 .03 .02 . uud- . uy
11 .01 . 01 . UUZ- . yJD
Fresh Vegetative Type
I
2
3 .01 .01 . uuz- no/,. uz^
3 9 .17 .08 .08 - .30
4 25 .007 .006 .002- .027
5 28 .008 .009 .001- .04
6 3 .02 .01 .009- .03
7 6 .004 .002 .003- .024
8 19 .01 .01 .001- .035
9 3 .03 .02 .009- .06
62

Table 26. Potassium content (ppt) of marsh soils byhydrologic unit and vegetative type
HydrologicUnit
No. of
SamplesStandard
Mean Deviation Range
Saline \7A O" P 1" ^5 t" T "t/P T'^r T\
Q
1 15 .31 .08 . 10 - .44
2 9 .36 .13 .14 - .57
3
4 19 .29 .15 - .48
5 23 .37 .19 - .53
6
7 1 .42 , 42 - .42
g 3 .47 .43 -. 52
Q 1 .29 .29 -. 29
Brackish Vegetative Type
25 .23 .10 . 11 - .57
2 16 .21 ,06 .15 - .39
3 6 .23 HQ .12 - .35
4 21 .16 . uo .07 - .34
5 17 .24 .06 - 1.17
5
7 18 .21 on. 04 -
. 38QO 12 .27 Qfi 17-
. jyJ
Q 21 .32 1 /. 11 -
Intermediate Vegetative Type
1X 2 .18 .17
2 1 .05 .05 - .05
3 7 .22 1 A .06 - .57
4 3 .05 .04 - .05
5 4 .06 .03 - .11
g7 11 .15 _
. \jj . J L
8 8 .21 .09 . 07 - .37
9 11 .16 .09 .05 - .31
Fresh Vegetative Type
3 .05 .02 . 02 -. 08
2
3 9 .16 .05 .09 - .24
4 25 .02 .01 .004- .064
5 28 .04 .04 .008- .20
6 3 .08 .04 .03 - .12
7 6 .04 .02 .017- .12
8 19 .07 .05 .01 - .209 3 .14 .12 .06 - .29
63
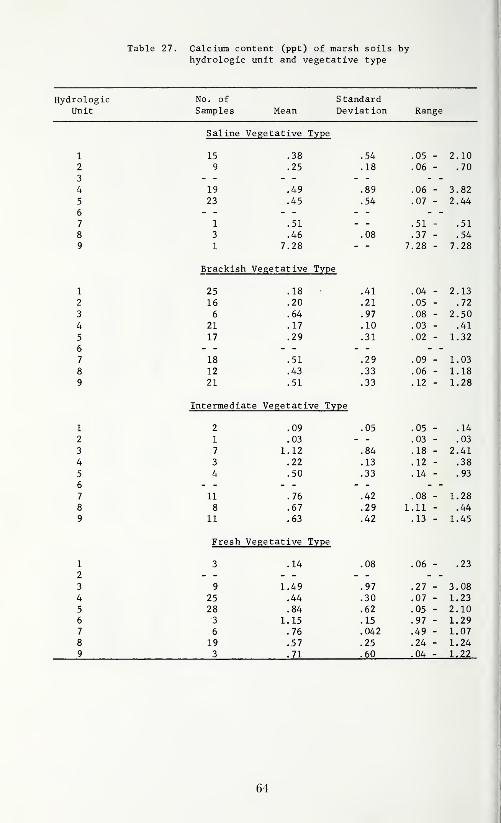
Table 27. Calcium content (ppt) of marsh soils byhydrologic unit and vegetative type
HydrologicUnit
No. of
SamplesStandard
Mean Deviation Range
Saline Vegetative Type
1 15 .38 .54 .05 2. 10
2 9 .25 .18 .06 - .70
3 - - -
4 19 .49 .89 .06 - 3.82
5 23 .45 .54 .07 - 2.446 - - -
7 I .51 - - .51 - .51
8 3 .46 .08 .37 - .54
9 1 7.28 7. 28 7.28
Brackish Vegetative Type
1 25 .18 .41 .04 2 . 13
2 16 .20 .21 .05 - .72
3 6 .64 . 97 .08 2.50
4 21 .17 . 10 .03 - .41
5 17 .29 .31 .02 - 1.32
6 ~ -
7 18 .51 .29 .09 1.03
8 12 .43 .33 .06 - 1. 18
9 21 .51 .33 . 12 - 1.28
Intermediate Vegetative Type
1 2 .09 .05 .05 . 14
2 1 .03 .03 - ,03
3 7 1.12 .84 .18 2.41
4 3 .22 .13 .12 - .38
5 4 .50 .33 .14 - .93
6 - - -
7 11 .76 .42 .08 - 1.28
8 8 .67 .29 1.11 - .44
9 11 .63 .42 .13 - 1.45
Fresh Vegetative Type
1
2
3 .14 .08 .06 .23
3 9 1.49 .97 .27 3.084 25 .44 .30 .07 1.23
5 28 .84 .62 .05 2.106 3 1.15 .15 .97 1.297 6 .76 .042 .49 1.07
8 19 .57 .25 .24 1.249 3 .71 .60 .04 1,22
64

Table 28. Magnesium content (ppt) of marsh soils byhydrologic unit and vegetative type
Hydrologic No. of StandardUnit Samples Mean Deviation Range
Saline Vegetative Type
1 15 1.04 . .34 .48 - 2.062 9 1.03 .29 . 74 1. 74
3
4 19 .92 . 11 . 74 1. 17
5 23 1.03 .20 .69 1.49
6
7 1 1.41 1 .41 1.41
8 3 1.47 . 17 1 . 28 1.599 1 3.22 3 . 22 3.22
Brackish Vegetative Type
1 25 .83 .27 .53 - 1.93
2 16 .87 .15 .62 1.173 6 .94 .26 . 70 1.42
4 21 .76 .21 .44 1.45
5 17 1.12 1.43 .48 6. 63
6
7 18 1.12 .30 .50 - 1.698 12 1.12 .24 . 79 1.54
9 21 1.37 .35 .78 2.10
Intermediate Vegetative Type
1 2 .63 .31 .40 - .85
2 1 .41 .41 .41
3 7 1.08 .53 .33 2.05
4 3 .37 .06 .30 .43
5
6
4 .55 . 14 .41 . 71
7 11 1.68 1.85 .47 7. 12
8 8 1.45 .31 1 .04 1. 93
9 11 1.30 .72 ,40 3.06
Fresh Vegetative Type
1 3 .35 .09 .29 .46
2
3 9 .99 .25 .56 1.38
4 25 .22 . 13 .03 .54
5 28 .40 .46 .08 2.256 3 .42 .10 .30 .50
7 6 .73 .35 .24 1.318 19 .66 .41 .20 1.519 3 1.04 .29 .75 1.35
65

Table 29. Sodium content (ppt) of marsh soils byhydrologic unit and vegetative type
Hydrologic No. of StandardUnit Samples Mean Deviation Range
Saline Vegetative Type
1 15 4.50 1.87 .55 - 7.602 9 4.71 2.51 2.39 10. 70
3
4 19 3.77 .76 2.54 _ 5.055 23 4.75 1.48 2.47 _ 7.746
7 1 4.22 - - 4.22 - 4.228 3 4.28 .61 3.70 4.939 1 2.55 2.55 2.55
Brackish Vegetative Type
1 25 3.22 .92 1.60 - 4.922 16 3.43 . 86 1. 72 4. 90
3 6 2.24 1.31 .60 3.82
4 21 3.19 1.10 1.47 _ 5.945 17 5.20 8. 73 1,23 38. 72
6
7 18 2.45 1.20 .37 - 5.158 12 3.04 1.26 .89 4.669 21 3.34 1.23 1.27 5.68
Intermediate Vegetative Type
1 2 1.68 .28 1.48 - 1.882 1 1.46 1.46 1.463 7 1.45 .99 .50
'_
3.014 3 1.43 . 12 1.31 1.565 4 1.53 .77 .49 _ 2.186
7 11 .90 .43 .19 _ 1.70
8 8 1.44 .56 .76 _ 2.429 11 2.20 1.50 .42 _ 5.88
Fresh Vegetative Type
1 3 .82 .12 .71 .95
2
3 9 .39 .20 .19 .84
4 25 .64 .45 .02 1.49
5 28 .46 .63 .05 2.43
6 3 .18 .14 .06 .35
7 6 .95 .94 .09 2.718 19 .51 .36 .07 1.319 3 1.00 .16 .81 1.10
66
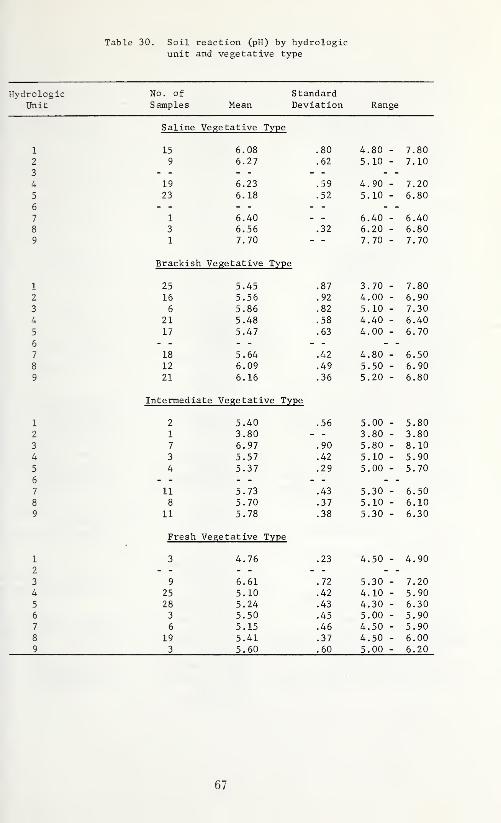
Table 30. Soil reaction (pH) by hydrologicunit and vegetative type
Hydrologic No. of StandardUnit Samples Mean Deviation Range
Saline Vegetative Type
1 15 6.08 .80 4,.80 - 7.80
2 9 6.27 . 62 5,.10 7 . 10
3
4 19 6.23 .59 4,.90 _ 7.20
5 23 6.18 .52 5,.10 _ 6.806 _ _ . _
7 1 6.40 _ _ 6.40 _ 6.408 3 6.56 .32 6,.20 - 6.809 1 7.70 - - 7,.70 - 7.70
Brackish Vegetative Type
1 25 5.45 .87 3 .70 - 7.8016 5.56 Q9
. vL 4,.00 D
.
3 6 5.86 .82 5 .10 _ 7.30
4 21 5.48 .58 4.40 _ 6.40
5 17 5.47 .63 4,.00 _ 6.70
6 _ _ . _
7 18 5.64 .42 4,.80 _ 6.50
8 12 6.09 .49 5 .50 _ 6.90
9 21 6.16 .36 5 .20 _ 6.80
Intermediate Vegetative Type
1 2 5.40 .56 5 .00 - 5.801 3.80 3 .80 -J . oU
3 7 6.97 .90 5 .80 8.104 3 5.57 .42 5 .10 _ 5.905 4 5.37 .29 5 .00 _ 5.706 _ _ . _
7 11 5.73 .43 5 .30 _ 6.508 8 5.70 .37 5 .10 _ 6.109 11 5.78 .38 5 .30 _ 6.30
Fresh Vegetative Type
1 3 4.76 .23 4.50 4.902
3 9 6.61 .72 5 .30 7.20
4 25 5.10 .42 4 .10 5.905 28 5.24 .43 4,.30 6.306 3 5.50 .45 5 ,00 5.907 6 5.15 .46 4 .50 5.908 19 5.41 .37 4,.50 6.009 3 5.60 .60 5,.00 6.20
67
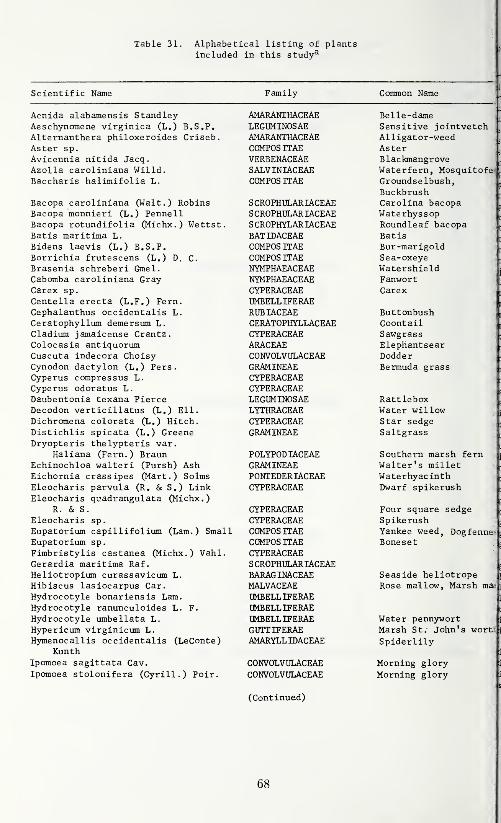
Table 31. Alphabetical listing of plantsincluded in this study^
Scientific Name Family Common Name
Acnida alabamensis Standley AMARANTHACEAE Be lie -dame^
Aeschynomene virginica (L.) B.S.P, LEGUMINOSAE Sensitive jointvetchj
Alternanthera philoxeroides Criseb. AMARANTHACEAE Alligator-weed^
Aster sp. COMPOS ITAE AsterJ
Avicennia nitida Jacq. VERBENACEAE Blackmangrove^
Azolla caroliniana Willd. SALVINIACEAE Waterfern, Mosquitofe^
Baccharis halimifolia L. COMPOS ITAE Groundselbush,p
Buckbrush^
Bacopa caroliniana (Walt.) Robins SCROPHULARUCEAE Carolina bacopap
Bacopa monnieri (L.) Pennell SCROPHULARIACEAE Waterhyssop^
Bacopa rotundifolia (Michx.) Wettst. SCROPHYLARIACEAE Roundleaf bacopa ij.
Bat is maritima L. BATIDACEAE Batis Ij
Bidens laevis (L.) B.S.P. COMPOS ITAE Bur -marigoldBorrichia frutescens (L.) D. C- COMPOS ITAE Sea-oxeye
jj.
Brasenia schreberi Gmel. NYMPHAEACEAE Watershieldj
Cabomba caroliniana Gray NYMPHAEACEAE Fanwortjj
Carex sp. CYPERACEAE Carex„,
Centella erecta (L.F.) Fern. UMBELLIFERAEn
Cephalanthus occidentalis L. RUBUCEAE Buttonbush^
Ceratophyllum demersum L. CERATOPHYLLACEAE Coontail\^
Cladium jamaicense Crantz. CYPERACEAE SawgrassColocasia antiquorum ARACEAE Elephantsear .„
Cuscuta indecora Choisy CONVOLVULACEAE Dodder„
Cynodon dactylon (L.) Pers. GRAMINEAE Bermuda grass ^Cyperus compressus L. CYPERACEAE mCyperus odoratus L. CYPERACEAE
is
Daubentonia texana Pierce LEGUMINOSAE Rattleboxjj
Decodon vertic illatus (L.) Ell. LYTHRACEAE Water willowDichromena colorata (L.) Hitch. CYPERACEAE Star sedge
j
Distichlis spicata (L.) Greene GRAMINEAE Saltgrass„
Dryopteris thelypteris var.y
Haliana (Fern.) Braun POLYPODIACEAE Southern marsh fernEchinochloa walteri (Pursh) Ash GRAMINEAE Walter's millet
,„
Eichornia crass ipes (Mart.) Solms PONTEDERIACEAE Waterhyacintht
Eleocharis parvula (R. & S.) Link CYPERACEAE Dwarf spikerusht
Eleocharis quadrangulata (Michx.)p
R. & S. CYPERACEAE Four square sedge^
Eleocharis sp. CYPERACEAE Spikerush|g
Eupatorium capillifolium (Lam.) Small COMPOS ITAE Yankee weed, Dogfenne|g
Eupatorium sp. COMPOS ITAE Bonesetg
Fimbristylis castanea (Michx.) Vahl. CYPERACEAEGerardia maritima Raf. SCROPHULARIACEAE
Is
Heliotropium curassavicum L. BARAGINACEAE Seaside heliotrope |'
Hibiscus lasiocarpus Car. MALVACEAE Rose mallow, Marsh maaj;
Hydrocotyle bonariensis Lam. UMBELLIFERAEHydrocotyle ranunculoides L. F. UMBELLIFERAE u
Hydrocotyle umbellata L. UMBELLIFERAE Water pennywort i
Hypericum virginicum L. GUTTIFERAE Marsh St. John's wort i
Hymenocallis occidentalis (LeConte) AMARYLLIDACEAE Spiderlily1Kunth
Ipomoea sagittata Cav. CONVOLVULACEAE Morning glory ii
Ipomoea stolonifera (Cyrill.) Poir. CONVOLVULACEAE Morning glory 'i
iS
(Continued)
68
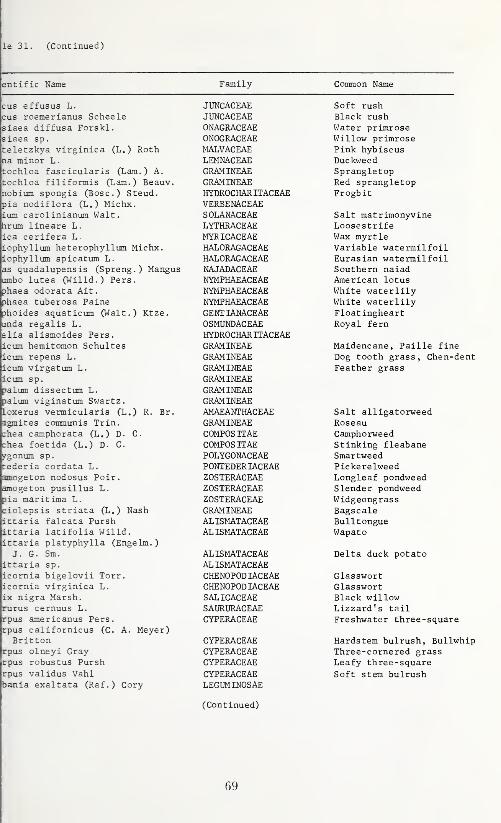
le 31. (Continued)
entific Name Family Common Name
cus effusus L. JUNCACEAE Soft rushcus roemerianus Scheele JUNCACEAE Black rushsiaea diffusa Forskl. ONAGRACEAE Water primrosesiaea sp. ONOGRACEAE Willow primroseteletzkya virginica (L.) Roth MALVACEAE Pink hybiscusna minor L
.
LEMNACEAE Duckweedtochloa fascicularis (Lam.) A. GRAMINEAE Sprangletoptochloa filiformis (Lam.) Beauv. GRAMINEAE Red sprangletopnobium spongia (Bosc.) Steud. HYDROCHARITACEAE Frogbitpia nodiflora (L.) Michx. VERBENACEAEium carolinianum Walt. SOLANACEAE Salt matrimonyvinehrum lineare L. LYTHRACEAE Loosestrifeica cerifera L MYRICACEAE Wax myrtleiophyllum heterophyllum Michx. HALORAGACEAE Variable watermilfoiliophyllum spicatum L. HALORAGACEAE Eurasian watermilfoilas quadalupensis (Sprang.) Mangus NAJADACEAE Southern naiadumbo lutea (Willd.) Pers. NYMrHAEACEAE American lotusphaea odorata Ait. NTTTXyf T)TT A "C A OT? A "P White waterlilyphaea tuberosa Paine TVTVTVjfmJ A T? A /^T? A T?INYiyLrHAliACbAhj White waterlilyphoides aquaticum O-Jalt.) Ktze. O T? "KTT* TAMA^^TPAT?
GhjiNi lAiNAChiAb Floatingheartmda regalis L. Ub jyiUJNUAL JcjAL Royal fernalia alismoides Pers. HYDRUCHAR TiACJiAEicum hemitomon Schultes /-1 73 Aim T'NTD A T?GRAMiJNEAE Maidencane, Paille fine
icum repens L. r'TD AAA TATt? A X? Dog tooth grass , Chen-denticum virgatum L. Feather grass
icum sp. GRAMINEAEpalum dissectum L. GRAMINEAEpalum viginatum Swartz. GRAMINEAEloxerus vermicularis (L.) R. Br. A*Kyr A T7 A Ain^TT A <^T? A T?AMAEAwiHACEAE Salt alligatorweedagmites communis Trin, /-I r) ATWf T ATT? A T7 Roseau
^
chea camphorata (L.) D. C. COMPOS ITAE Camphorweedchea foetida (L.) D. C. COMPOS ITAE Stinking fleabaneygonum sp. POLYGONACEAE Smartweedtederia cordata L. PONTEDERIACEAE Pickerelweedamogeton nodosus Poir. ^Ob lERACEAE Long leaf pondweedamogeton pusillus L. ZOSTERACEAE Slender pondweedpia maritima L. ZOSTERACEAE Widgeongrassciolepsis striata (L.) Nash GRAMINEAE Bagscaleittaria falcata Pursh ALISMATACEAE Bulltongueittaria latifolia Willd. ALISMATACEAE Wapatoittaria platyphylla (Engelm.)
J. G. Sm. ALISMATACEAE Delta duck potatoittaria sp. ALISMATACEAEicornia bigelovii Torr. CHENOPODlACEAE Glassworticornia virginica L. CHENOPODlACEAE Glasswortix nigra Marsh. SALICACEAE Black willowrurus cernuus L. SAURURACEAE Lizzard's tailrpus americanus Pers. CYPERACEAE Freshwater three-squarerpus californicus (C. A. Meyer)
Br i 1 1 on PVOTTTJ A PT? A PU I ir EiIvAtjliAlli Hardstem bulrush, Bullwhiprpus olneyi Gray CYPERACEAE Three-cornered grassrpus robustus Pursh CYPERACEAE Leafy three-squarerpus validus Vahl CYPERACEAE Soft stem bulrushbania exaltata (Raf.) Cory LEGUMINOSAE
(Continued)
69

Table 31. (Continued)
Scientific Name Family Common Name
Sesuvium portulascastrum L.
Setaria glauca (L.) Beauv.Setaria magna Griseb.Solidago sp.
Spartina alterniflora Loisel.Spartina cynosuroides (L.) RothSpartina patens (Ait.) Muhl.
Spartina spartineae (Trin.) Merr.Spirodela polyrhiza (L.) SchleidSuaeda linearis (Ell.) Moq
.
Taraxacum officinale WeberTaxodium distichum (L.) RichardTypha spp.
Utricularia cornuta Michx.Utricularia subulata L.
Vallisneria americana Michx.Vigna repens (L.) KuntzeWoodwardia virginica (L.) Sm.
Zizaniopsis miliaceae (Michx.)Doll & Aschers
AIZOACEAEGRAMINEAEGRAMINEAECOMPOS ITAEGRAMINEAEGRAMINEAEGRAMINEAE
GRAMINEAELEMNACEAECHENOPODIACEAECOMPOS ITAEPINACEAETYPHACEAELENTIBULARIACEAELENTIBULARIACEAEHYDROCHARITACEAELEGUMINOSAEPOLYPODIACEAEGRAMINEAE
Marsh purslaneYellow foxtailGiant foxtailGoldenrodOystergrassHog caneMarshhay cordgrass,Wiregrass
DuckweedSea-bliteDandelionBaldcypressCattailHorned bladderwortZigzag bladderwortWildceleryDeer peaVirginia chain fernGiant cutgrass
Plant names are from the following sources:
(1)
(2)
(3)
(4)
Fernald (1950)Gleason (1968)Hitchcock (1950)Small (1933)
70
LITERATURE CITED
Allison. L. E., \V. B. Bollen. and C. D. Moodie. 1965. Total carbon.
lu C. A. Black (Ed.). Method of soil analysis, Part II. Agronomy9:1346-1366.
Brown. Clair A. 1936. The vegetation of the Indian mounds, middens
and marshes in Plaquemines and St. Bernard Parishes. Dept. of Con-
servation. La. Geol. Surv. Geological Bull. No. 8, p. 423-439.
Brupbacher, R. H., W. P. Bonner, and J. E. Sedberry, Jr. 1968. Analy-
tical methods and procedtnes used in the soil testing laboratory. La.
Agr. Exp. Sta. Bull. 632. 15 p.
Canfield, R. H. 1941. Application of the line intercept method in
sampling range vegetation. Jour. Forestry 39:388-394.
Chabreck, Robert H. 1968. The relation of cattle and cattle grazing
to marsh wildlife and plants in Louisiana. Proc. Annu. Conf. S. E.
Assoc. of Game and Fish Comm. 22:55-58.
. 1970. Marsh zones and vegetative types in the Lotiisiana Coastal
Marshes. Lhipubl. Ph.D. dissertation. La. State Univ., Baton
Rouge. 1 13 p.
. 1971. Ponds and lakes of the Louisiana Coastal Marshes andtheir value to fish and wildlife. Proc. Annu. Conf. S. E. Assoc. of
Game and Fish Comm. (In press.)
and Clark M. Hoffpauir. 1962. The use of weirs in coastal
marsh management in Louisiana. Proc. Annu. Conf. S. E. Assoc.
of Game and Fish Comm. 16:103-112.
, Ted Joanen, and A. W. Palmisano. 1968. Vegetative type mapof the Louisiana Coastal Marshes. La. Wild Life and Fisheries
Comm. New Orleans.
Chamberlain, J. L. 1957. An ecological study of a gulf coast
marsh. Rockefeller Refuge, Grand Chenier, Louisiana. Unpubl.Ph.D. dissertation, Univ. of Tenn., Knoxville. 160 p.
Coleman, James M. 1966. Recent coastal sedimentation: Central
Louisiana Coast. Coastal Studies Series No. 17, La. State Univ.
Press, Baton Rouge. 73 p.
Dachnowski-Stokes, A. P. 1940. Structural characteristics of peats andmucks. Soil Sci. 50:389-400.
Fernald, M. L. 1950. Gray's manual of botany. 8th ed. American BookCo., New York. 1632 p.
Gleason, H. A. 1968. Illustrated flora of the northeastern United
States and adjacent Canada. Hafner Publishing Co., New York. 3 vol.
Gunter, Gordon. 1967. Some relationships of estuaries to the fisheries
of the Gulf of Mexico, p. 621-638. In G. H. Lauff (Ed.), Estuaries.
Publ. No. 83. Amer. Assoc. for the Advancement of Sci., Washington,D.C.
Hitchcock, A. A. 1950. Manual of the grasses of the United States. U.S.
Dept. Agr. Misc. Publ. 200.1051 p.
71
Kniffen, F. B. 1968. Louisiana, its land and people. Louisiana State
Univ. Press, Baton Rouge. 196 p., illus.
Lytle, S. A. 1968. 7 he morphological characteristics and relief relation-
ships of representative soils in Louisiana. La. Agr. Exp. Sta. Bull.
631. 23 p.
and B. N. Driskell. 1954. Physical and chemical characteristics
of the peats, mucks and clays of the coastal marsh area of St. MaryParish, Louisiana. La. Agr. Exp. Sta. Bull. 484. 37 p.
Marmer, H. A. 1954. Tides and sea level in the Gulf of Mexico, p.
101-118. In: Gulf of Mexico, its origin, waters and marine life. U.S.
Fish and Wildlife Serv. Fishery Bull. 89.
Morgan, J. P. and P. B. Larimore. 1957. Changes in the Louisiana
shoreline. Trans. Gulf Coast Assoc. Geol. Soc, 7th Annu. Meeting,
New Orleans, p. 303-310.
Nichols, Lewis G. 1959. Geology of Rockefeller Wildlife Refuge andGame Reserve. La. Wild Life and Fisheries Comm., New Orleans.
28 p.
O'Neil, Ted. 1949. The muskrat in the Louisiana coastal marshes. La.
Wild Life and Fisheries Comm., New Orleans. 159 p.
Page, N. R. 1965. Procedures used by state soil-testing laboratories
in the southern region of the United States. Southern Cooperative
Series Bull. 102, South Carolina Agr. Exp. Sta., Clemson, S. C. 49 p.
Palmisano, A. W. 1970. Plant community-soil relationship in Louisiana
coastal marshes. Unpubl. Ph.D. dissertation, Louisiana State Univ.,
Baton Rouge. 98 p.
and Robert H. Chabreck. 1972. The relationship of plant com-
munities and soils of the Louisiana coastal marshes. Proc. of the
La. Assoc. of Agronomists. (In press.)
Penfound, W. T. and E. S. Hathaway. 1938. Plant communities in the
marshland of southeastern Louisiana. Ecol. Monogr. 8:1-56.
Richards, L. A. 1954. Diagnosis and improvement of saline andalkaline soils. U.S. Dept. Agr. Handbook 60. 196 p.
Russell, R. J. 1942. Flotant. Geogr. Rev. 32:74-98.
and H. V. Howe. 1935. Cheniers of southwestern Louis-
iana. Geogr. Rev. 25:449-461.
Sanders, Ralph. 1959. Climates of the states—Louisiana. U.S. WeatherBureau, Washington, D.C. 16 p.
Small, J. K. 1933. Manual of the southeastern flora. The Univ. of
North Carolina Press, Chapel Hill. 1554 p.
St. Amant, Lyle S. 1959. Louisiana wildlife inventory and managementplan. La. Wild Life and Fisheries Comm., New Orleans. 329 p.
U.S. Weather Bureau. 1959. Climatological data—Louisiana annual
summary. U.S. Dept. of Commerce, Washington, D.C, p. 141-149.
72
i