vedanta – black mountain mining (pty) ltd - erm€¦ · vedanta – black mountain mining (pty)...
TRANSCRIPT
Delivering sustainable solutions in a more competitive world
Vedanta – Black Mountain Mining (PTY) LTD GAMSBERG ZINC PROJECT ESIA Geochemical Assessment DRAFT REPORT April 2013 erm.com

Vedanta – Black Mountain Mining (PTY) LTD GAMSBERG ZINC PROJECT ESIA Geochemical Assessment DRAFT REPORT April 2013 Prepared by: Stewart Whyte
This report has been prepared by Environmental Resources Management the trading name of Environmental Resources Management Southern Africa (Pty) Limited, with all reasonable skill, care and diligence within the terms of the Contract with the client, incorporating our General Terms and Conditions of Business and taking account of the resources devoted to it by agreement with the client. We disclaim any responsibility to the client and others in respect of any matters outside the scope of the above. This report is confidential to the client and we accept no responsibility of whatsoever nature to third parties to whom this report, or any part thereof, is made known. Any such party relies on the report at their own risk.
For and on behalf of Environmental Resources Management Approved by: Stefan Muller
Signed: Position: Partner Date: 17 April 2013

DECLARATION OF CONSULTANTS INDEPENDENCE
The author of this report, STEWART WHYTE, does hereby declare that he is an independent consultant and has no business, financial, personal or other interest in the activity, application or appeal in respect of which he was appointed other than fair remuneration for work performed in connection with the activity, application or appeal. There are no circumstances that compromise the objectivity of the specialist performing such work. All opinions expressed in this report are his own.
STEWART WHYTE April 2013
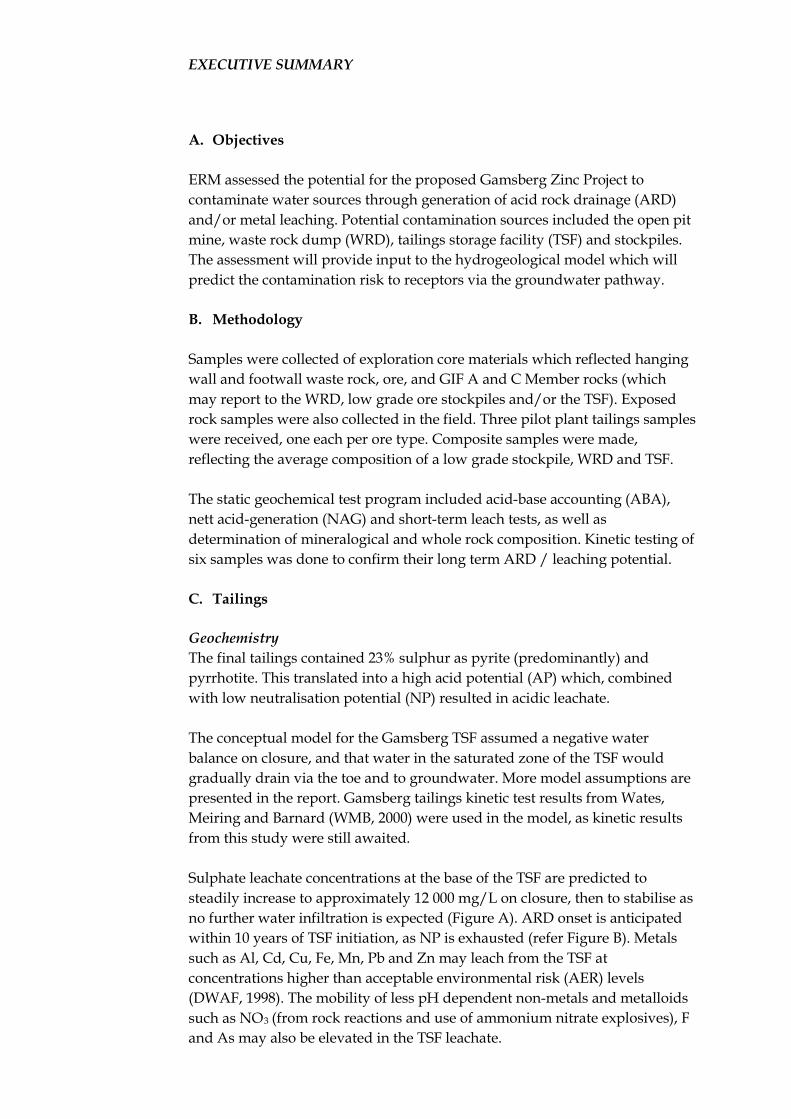
EXECUTIVE SUMMARY
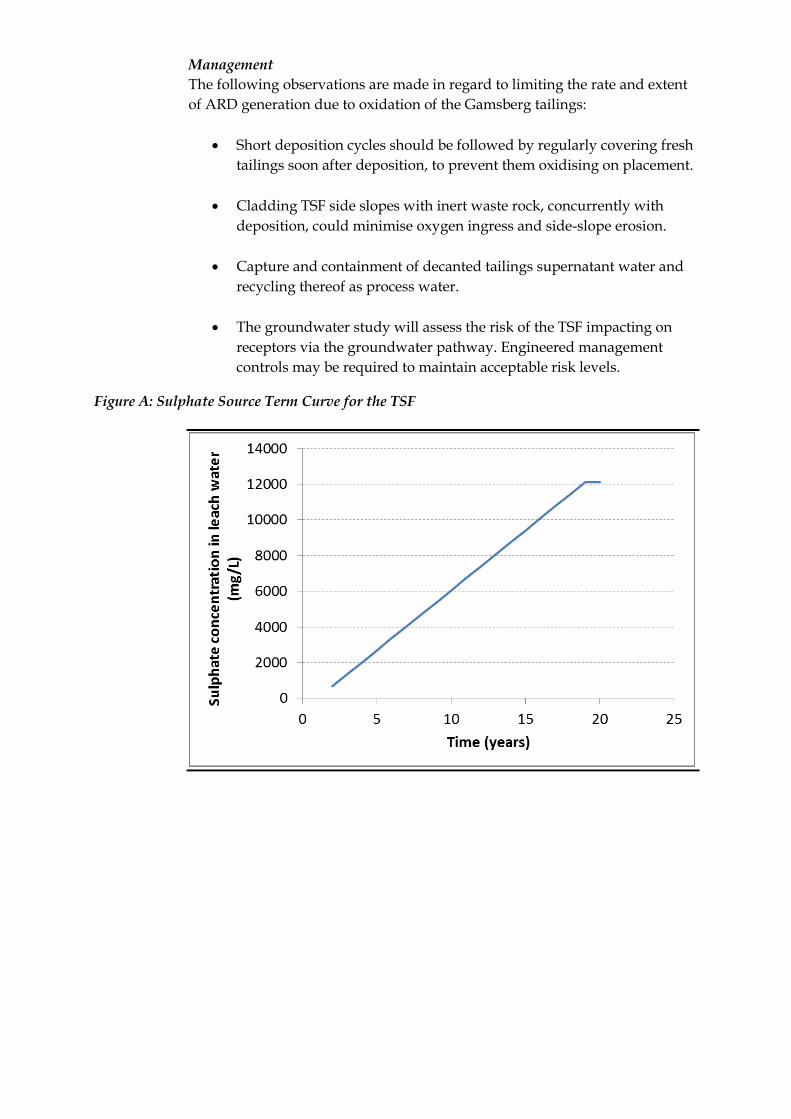
A. Objectives ERM assessed the potential for the proposed Gamsberg Zinc Project to contaminate water sources through generation of acid rock drainage (ARD) and/or metal leaching. Potential contamination sources included the open pit mine, waste rock dump (WRD), tailings storage facility (TSF) and stockpiles. The assessment will provide input to the hydrogeological model which will predict the contamination risk to receptors via the groundwater pathway. B. Methodology Samples were collected of exploration core materials which reflected hanging wall and footwall waste rock, ore, and GIF A and C Member rocks (which may report to the WRD, low grade ore stockpiles and/or the TSF). Exposed rock samples were also collected in the field. Three pilot plant tailings samples were received, one each per ore type. Composite samples were made, reflecting the average composition of a low grade stockpile, WRD and TSF. The static geochemical test program included acid-base accounting (ABA), nett acid-generation (NAG) and short-term leach tests, as well as determination of mineralogical and whole rock composition. Kinetic testing of six samples was done to confirm their long term ARD / leaching potential. C. Tailings Geochemistry The final tailings contained 23% sulphur as pyrite (predominantly) and pyrrhotite. This translated into a high acid potential (AP) which, combined with low neutralisation potential (NP) resulted in acidic leachate. The conceptual model for the Gamsberg TSF assumed a negative water balance on closure, and that water in the saturated zone of the TSF would gradually drain via the toe and to groundwater. More model assumptions are presented in the report. Gamsberg tailings kinetic test results from Wates, Meiring and Barnard (WMB, 2000) were used in the model, as kinetic results from this study were still awaited. Sulphate leachate concentrations at the base of the TSF are predicted to steadily increase to approximately 12 000 mg/L on closure, then to stabilise as no further water infiltration is expected (Figure A). ARD onset is anticipated within 10 years of TSF initiation, as NP is exhausted (refer Figure B). Metals such as Al, Cd, Cu, Fe, Mn, Pb and Zn may leach from the TSF at concentrations higher than acceptable environmental risk (AER) levels (DWAF, 1998). The mobility of less pH dependent non-metals and metalloids such as NO3 (from rock reactions and use of ammonium nitrate explosives), F and As may also be elevated in the TSF leachate.
Management The following observations are made in regard to limiting the rate and extent of ARD generation due to oxidation of the Gamsberg tailings:
• Short deposition cycles should be followed by regularly covering fresh tailings soon after deposition, to prevent them oxidising on placement.
• Cladding TSF side slopes with inert waste rock, concurrently with deposition, could minimise oxygen ingress and side-slope erosion.
• Capture and containment of decanted tailings supernatant water and recycling thereof as process water.
• The groundwater study will assess the risk of the TSF impacting on
receptors via the groundwater pathway. Engineered management controls may be required to maintain acceptable risk levels.
Figure A: Sulphate Source Term Curve for the TSF

Figure B: Consumption of NP, Production of Acidity and Change in pH for the TSF
D. Ore and waste rock Apportionment The fate of the various lithologies according to the mine plan is as follows:
• GIF B materials will be extracted as ore and exposed to oxidation in ore/concentrate stockpiles, the pit wall and carry-over to the TSF.
• GIF A and C materials are gangue, i.e. commercially worthless
material surrounding, or closely mixed with, the ore (GIF B). GIF A and C will be exposed to oxidation in the pit walls, WRD and carryover to the TSF. This material may also be stockpiled as low grade ore during life of mine (LOM), depending on economic factors.
• Koeris and Pella Quartzite rocks comprise overburden and would be exposed to oxidation in the pit slopes and WRD.
Geochemistry The sulphur and sulphide-sulphur content of GIF samples collected in this study compared reasonably well against a large database population. Table A shows screening results for ARD and metal leaching potential of ore and waste rock materials on exposure by mining. GIF rocks have significantly higher potential to generate ARD and metal leaching than Koeris or Pella Quartzite materials.

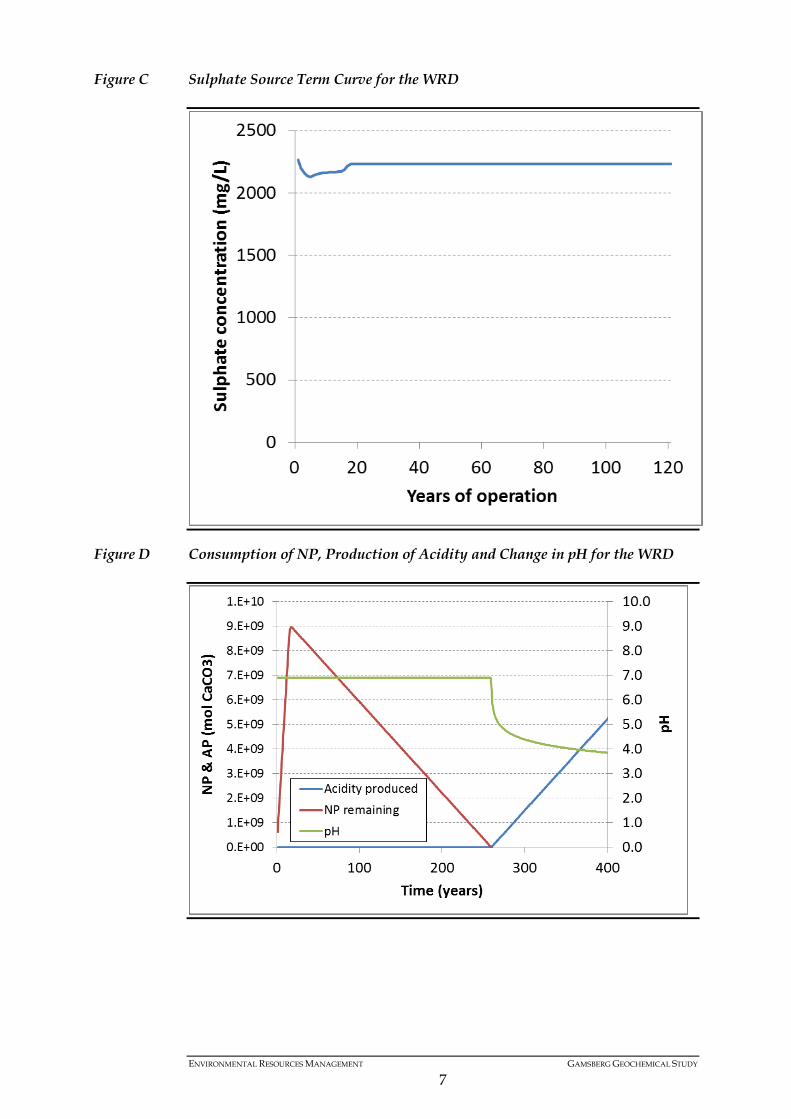
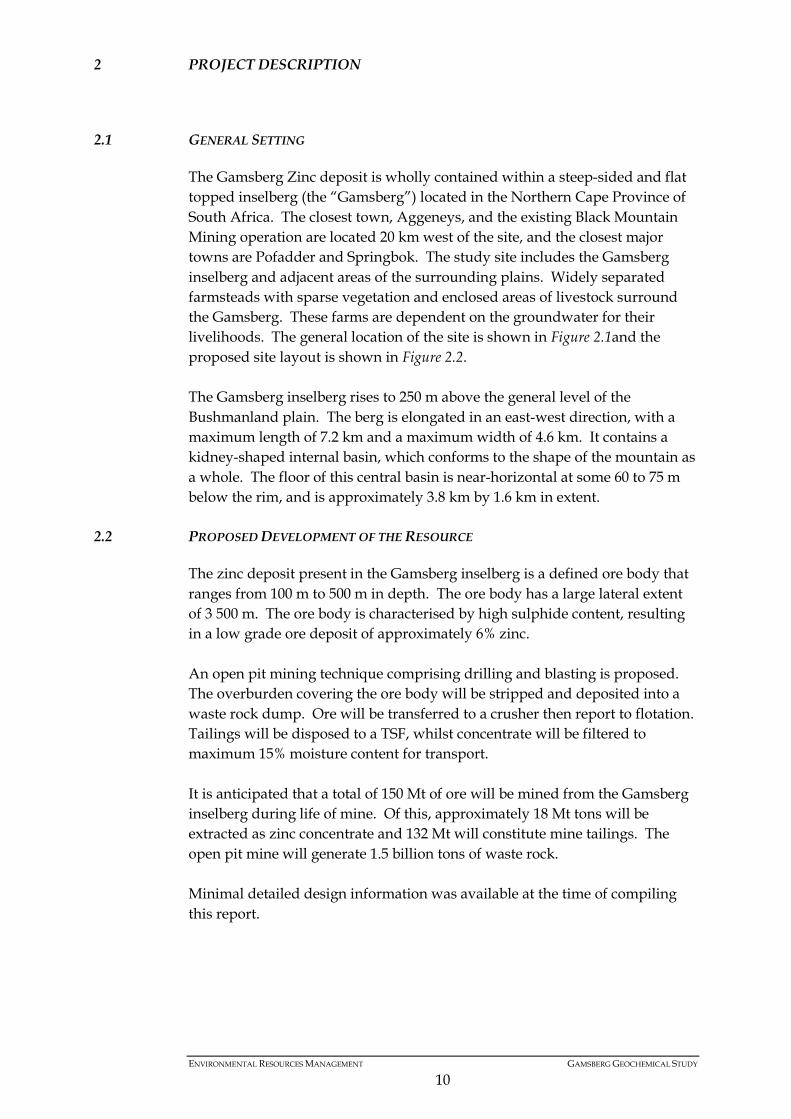
Modelling of WRD water quality Waste rock is to be end-tipped over the north side of the inselberg to develop a WRD of 270 ha area, 180 m height and 1.5 billion ton final capacity. Recharge to the upper surface of the WRD was estimated at 80% of the mean annual precipitation (MAP) of 150 mm/a, with 20% evaporating. It was assumed that 20% of MAP would infiltrate to underlying geology, whilst 60% of MAP would exit the WRD as toe seepage. Kinetic test results from a waste rock composite sample assessed by WMB (2000) provided input to the model, as kinetic results from this study were still awaited. Both sets of samples contained overburden rock types in the relative proportion that they are expected to occur in the WRD, as well as 8 to 9% of gangue (GIF A and C). Sulphate (Figure C) was expected to leach from the WRD at a relatively constant concentration of 2 000 to 2 500 mg/L throughout LOM and beyond, as WRD management will not change over time. The pH of WRD leachate (Figure D) is expected to remain near-neutral for almost 350 years, after which it may decrease to pH 4 or less, with increase in metal mobility. The likelihood and timing to ARD onset will depend on factors such as the proportion of GIF A and C material in the WRD, the distribution of coarse and fine material in the WRD, and oxygen availability. Note that non-metallic and metalloid contaminants such as NO3, F and As may remain mobile even at neutral pH. Management The ore/concentrate stockpiles represent potential sources of ARD and metal leaching. Each stockpile will however occupy a small footprint and this risk could be minimised by applying engineered controls to limit surface water and groundwater pathways. These controls may include bunding, interception channels, silt traps and clean/dirty water containment structures. Engineered controls and operational practices should also be in place to minimise wind entrainment or spillage to the environment of zinc concentrate during transport and handling, both on site and to the point of export. Pit design should incorporate engineered structures to minimise contact between side slope runoff and GIF materials (particularly within benches established in GIF ) – both in terms of the quantity of water in contact with these materials and the contact (reaction) time. The potential of the WRD to generate ARD is largely dependent on the relative proportion of GIF A and C. The project team should consider the feasibility of segregating GIF A & C gangue from non-acid generating overburden during mining and deposition. Overburden could be used to clad TSF side slopes and for decommissioning and closure rehabilitation. If stored separately the GIF gangue material would require engineered controls to reduce the risk of groundwater impact to acceptable levels, unless economic conditions favour the blending of this material into the concentrator with GIF B ore. WRD management will be discussed in the groundwater report, in relation to source and pathway controls.
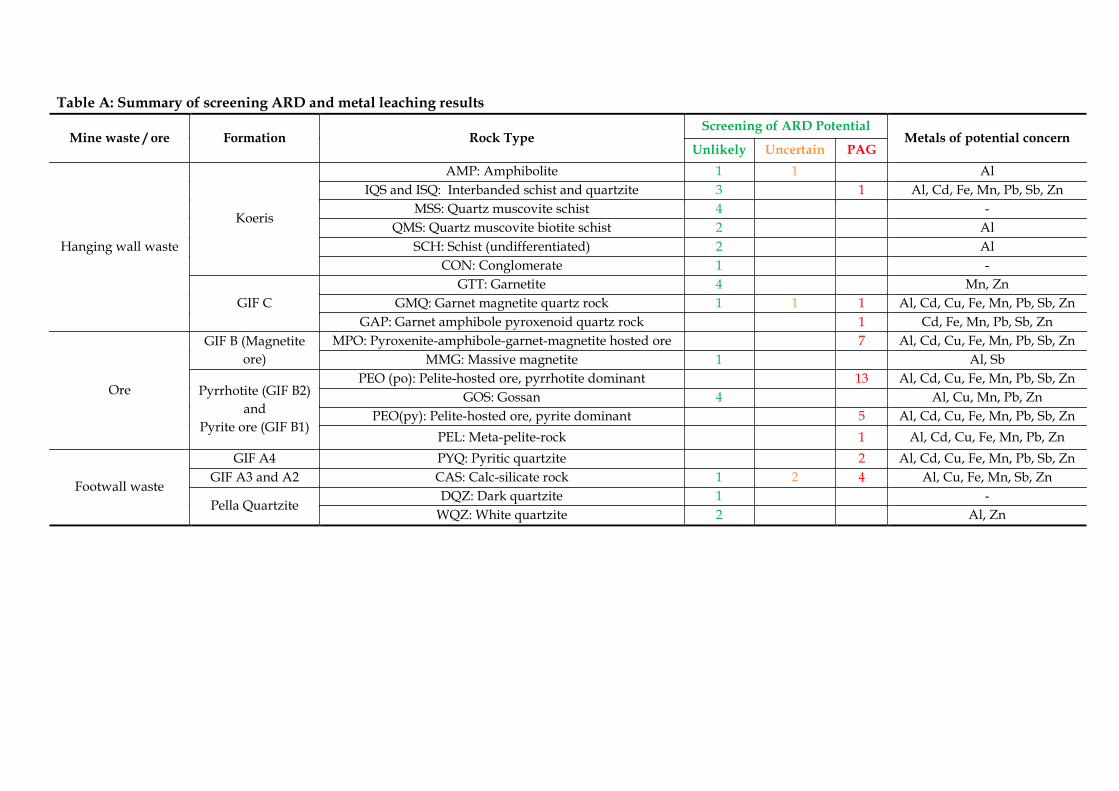
Table A: Summary of screening ARD and metal leaching results
Mine waste / ore Formation Rock Type Screening of ARD Potential
Metals of potential concern Unlikely Uncertain PAG
Hanging wall waste
Koeris
AMP: Amphibolite 1 1 Al IQS and ISQ: Interbanded schist and quartzite 3 1 Al, Cd, Fe, Mn, Pb, Sb, Zn
MSS: Quartz muscovite schist 4 - QMS: Quartz muscovite biotite schist 2 Al
SCH: Schist (undifferentiated) 2 Al CON: Conglomerate 1 -
GIF C GTT: Garnetite 4 Mn, Zn
GMQ: Garnet magnetite quartz rock 1 1 1 Al, Cd, Cu, Fe, Mn, Pb, Sb, Zn GAP: Garnet amphibole pyroxenoid quartz rock 1 Cd, Fe, Mn, Pb, Sb, Zn
Ore
GIF B (Magnetite ore)
MPO: Pyroxenite-amphibole-garnet-magnetite hosted ore 7 Al, Cd, Cu, Fe, Mn, Pb, Sb, Zn MMG: Massive magnetite 1 Al, Sb
Pyrrhotite (GIF B2) and
Pyrite ore (GIF B1)
PEO (po): Pelite-hosted ore, pyrrhotite dominant 13 Al, Cd, Cu, Fe, Mn, Pb, Sb, Zn GOS: Gossan 4 Al, Cu, Mn, Pb, Zn
PEO(py): Pelite-hosted ore, pyrite dominant 5 Al, Cd, Cu, Fe, Mn, Pb, Sb, Zn PEL: Meta-pelite-rock 1 Al, Cd, Cu, Fe, Mn, Pb, Zn
Footwall waste
GIF A4 PYQ: Pyritic quartzite 2 Al, Cd, Cu, Fe, Mn, Pb, Sb, Zn GIF A3 and A2 CAS: Calc-silicate rock 1 2 4 Al, Cu, Fe, Mn, Sb, Zn
Pella Quartzite DQZ: Dark quartzite 1 -
WQZ: White quartzite 2 Al, Zn
ENVIRONMENTAL RESOURCES MANAGEMENT GAMSBERG GEOCHEMICAL STUDY
7
Figure C Sulphate Source Term Curve for the WRD
Figure D Consumption of NP, Production of Acidity and Change in pH for the WRD

ENVIRONMENTAL RESOURCES MANAGEMENT GAMSBERG GEOCHEMICAL STUDY
8
1 TERMS OF REFERENCE
1.1 BACKGROUND
Black Mountain Mining (Pty) Ltd (herein referred to as Black Mountain), part of the global Vedanta mining group, intends to establish the new Gamsberg Zinc Project near the town of Aggeneys, Northern Cape Province. The Project is to produce 10 Mtpa of concentrate and is to consist of an open pit zinc mine in the Gamsberg inselberg, a concentrator plant and associated infrastructure. Black Mountain currently operates a lead, zinc, copper and silver mine located near the town of Aggeneys, based on an existing mining right. Black Mountain commissioned ERM to compile environmental and social impact assessments (ESIAs) for the construction and operation of the new Gamsberg zinc mine and associated infrastructure. This report documents a study that ERM conducted to assess the likelihood and significance of geochemical impact to water resources due to the proposed mining and beneficiation activities at Gamsberg. The results of this study will be presented in the project mining ESIA and will inform various specialist studies contributing to that ESIA (notably the groundwater study).
1.2 OBJECTIVES OF THIS STUDY
During the screening phase of the project mining ESIA, ERM identified that uncertainties existed in regards to the potential for the proposed mining and beneficiation activities/facilities at Gamsberg to contaminate water sources through generation of acid rock drainage (ARD) and/or metal leaching. These facilities include the open pit mine, waste rock dump (WRD), tailings storage facility (TSF), and stockpiles (ore and concentrate). This geochemical assessment aims to address the following questions regarding mine water quality impact and management at Gamsberg: 1. What operational and closure phase seepage volumes and qualities (or
“source-terms”) can be expected from the mine waste facilities? 2. Given the above source-terms, what will be the impact on the receiving
surface water and groundwater resources? 3. Should the above impact be unacceptable, what source or pathway
controls can be applied to keep the impact within acceptable risk levels? 4. What operational and closure assessment and monitoring is needed to
calibrate mine water quality predictions and manage water quality impacts?

ENVIRONMENTAL RESOURCES MANAGEMENT GAMSBERG GEOCHEMICAL STUDY
9
1.3 FRAMEWORK TO THIS STUDY
This study is based on the recommended approach to drainage chemistry predictions in British Columbia (Price et al., 1997), outlined in these steps: 1. Review and understand background information and key questions to be
addressed in the study. This includes identifying geological and waste units that will be exposed, disturbed or deposited by the mining activities.
2. Determine the form and extent of geological and waste units that will
occur in each mine component and develop a conceptual model of key geochemical and flow processes.
3. Develop a sampling and analytical strategy for obtaining and testing
representative samples of geological materials and mine wastes. 4. Conduct sampling of geological materials and mine wastes. 5. Conduct laboratory analysis of the samples, which may include
geochemical and geotechnical testing. 6. Interpret and report on the test-work results. If the analytical results from the initial six steps indicate a potential for any of the sampled materials to generate acid rock drainage and/or metal leaching, then the additional two steps may be required to be undertaken: 1. Predict time sensitive drainage chemistry for each mine facility as a
function of material property, climatic variation, water balance and geochemical process.
2. Develop source and pathway control measures to prevent, minimise or
mitigate water resource impacts to acceptable levels. This includes the development of performance monitoring programs during the various life cycle phases of the proposed mine.
ENVIRONMENTAL RESOURCES MANAGEMENT GAMSBERG GEOCHEMICAL STUDY
10
2 PROJECT DESCRIPTION
2.1 GENERAL SETTING
The Gamsberg Zinc deposit is wholly contained within a steep-sided and flat topped inselberg (the “Gamsberg”) located in the Northern Cape Province of South Africa. The closest town, Aggeneys, and the existing Black Mountain Mining operation are located 20 km west of the site, and the closest major towns are Pofadder and Springbok. The study site includes the Gamsberg inselberg and adjacent areas of the surrounding plains. Widely separated farmsteads with sparse vegetation and enclosed areas of livestock surround the Gamsberg. These farms are dependent on the groundwater for their livelihoods. The general location of the site is shown in Figure 2.1and the proposed site layout is shown in Figure 2.2. The Gamsberg inselberg rises to 250 m above the general level of the Bushmanland plain. The berg is elongated in an east-west direction, with a maximum length of 7.2 km and a maximum width of 4.6 km. It contains a kidney-shaped internal basin, which conforms to the shape of the mountain as a whole. The floor of this central basin is near-horizontal at some 60 to 75 m below the rim, and is approximately 3.8 km by 1.6 km in extent.
2.2 PROPOSED DEVELOPMENT OF THE RESOURCE
The zinc deposit present in the Gamsberg inselberg is a defined ore body that ranges from 100 m to 500 m in depth. The ore body has a large lateral extent of 3 500 m. The ore body is characterised by high sulphide content, resulting in a low grade ore deposit of approximately 6% zinc. An open pit mining technique comprising drilling and blasting is proposed. The overburden covering the ore body will be stripped and deposited into a waste rock dump. Ore will be transferred to a crusher then report to flotation. Tailings will be disposed to a TSF, whilst concentrate will be filtered to maximum 15% moisture content for transport. It is anticipated that a total of 150 Mt of ore will be mined from the Gamsberg inselberg during life of mine. Of this, approximately 18 Mt tons will be extracted as zinc concentrate and 132 Mt will constitute mine tailings. The open pit mine will generate 1.5 billion tons of waste rock. Minimal detailed design information was available at the time of compiling this report.

DRAFT COPY
Legend!. MainTown
!Ç Towns
hg Loop 10 Siding
!H Existing Aggeneys Sub-Station
Main Rivers
Rivers
Dams
Cadastral Boundaries
Gamsberg Project Area - Mineral Rights Area
Gamsberg Project Area - Mining License
Gamsberg Project Area - Surface Rights
Local Municipalities
District Municipalities
Area of Proposed Additional Housing
!H
!Ç
!Ç
!Ç
!Ç
!Ç
!Ç
!Ç
!Ç
!.
S O U T H A F R I C AS O U T H A F R I C A
N O R T H E R N C A P EN O R T H E R N C A P E
N A M I B I AN A M I B I A
NAMAKWA
PELLA
AGGENEYS
KHÂI-MA
KAI !GARIB
NAMA KHOI
Gifkop
Platkop
Witberg
Bakenskop
Spioenkop
Swartberg
Barietmyn
GAMSBERG
Oskoperskop
Namiesberge
Hoogoorberg
Hartbeesberg
Swartspitskop
Haramoepberge
Charles' Pass
T'Goob se Berg
Pella se Berge
Leeuklip se Kop
Houmoed se Berg
Naroes se Berge
Fronemanse Kop
Groot-Pellaberg
Aggenys se Berge
Sillimanite Mine
Poortjie se Koppe
Windhoek se Berge
Ou Samoep se Berge
Mattheusgat se Berge
Kaboep
Orange
Nam s
e Laagte
Goob se Laagte
Hart
be
es
Sam
oep
Kaboep
N14
POFADDER
19°45'0"E
19°45'0"E
19°40'0"E
19°40'0"E
19°35'0"E
19°35'0"E
19°30'0"E
19°30'0"E
19°25'0"E
19°25'0"E
19°20'0"E
19°20'0"E
19°15'0"E
19°15'0"E
19°10'0"E
19°10'0"E
19°5'0"E
19°5'0"E
19°0'0"E
19°0'0"E
18°55'0"E
18°55'0"E
18°50'0"E
18°50'0"E
18°45'0"E
18°45'0"E
18°40'0"E
18°40'0"E28
°55
'0"S
28
°55
'0"S
29
°0'0
"S
29
°0'0
"S
29
°5'0
"S
29
°5'0
"S
29
°10
'0"S
29
°10
'0"S
29
°15
'0"S
29
°15
'0"S
29
°20
'0"S
29
°20
'0"S
29
°25
'0"S
29
°25
'0"S
29
°30
'0"S
29
°30
'0"S
29
°35
'0"S
29
°35
'0"S
29
°40
'0"S
29
°40
'0"S
29
°45
'0"S
29
°45
'0"S
29
°50
'0"S
29
°50
'0"S
SIZE:
TITLE:
DATE: Apr 2013
DRAWN: LDT/AB
CHECKED: NB
APPROVED: SP
PROJECT: 0164903
SCALE: 1 : 400 000
DRAWING: REV:
A3
Figure 2.1:Location of Gamsberg Study Area
Location of Gamsberg Study Area.mxd 5
CLIENT:
ERM
Great Westerford Building240 Main RoadRondebosch, 7725Cape Town, SOUTH AFRICATel: +27 21 681 5400Fax +27 21 686 073
±0 5 10 15 20
Kilometres
SCALE:
T:\G
is P
roje
cts
\016
490
3_G
am
sberg
\Mapp
ing\M
XD
\Re
port
\Apri
l20
13\L
ocatio
n o
f G
am
sbe
rg S
tudy A
rea.m
xd
Projection: Geographic, Datum: WGS84Source: NGI - Chief Directorate National Geo-Spatial Information,SANBI, EnPATInset: ESRI Data and Maps
It is unlawful for any firm or individual to reproduce copyrighted maps, graphics or drawings, in whole or in part, without permission of the copyright owner, ERM Southern Africa (Pty) Ltd �
#*
NAMIBIA
BOTSWANA
NORTHERN CAPE
LIMPOPO
EASTERN CAPE
FREE STATE
WESTERN CAPE
NORTH WEST
MOZAMBIQUE
KWAZULU-NATAL
MPUMALANGA
LESOTHO
ZIMBABWE
GAUTENG
SWAZILAND
Study Area
hg
N A M I B I AN A M I B I A
S O U T H A F R I C AS O U T H A F R I C A
Sishen S
aldanha Rail L
ink
LOOP 10
SIYANDA
NAMAKWA
KAI !GARIB
KHÂI-MA
HANTAM
!KHEIS
//KHARA HAIS
KAMIESBERG
NAMA KHOI
KAREEBERGKAROO HOOGLAND
N14
N10
N14
KEIMOES
KAKAMAS
UPINGTON
KENHARDT
POFADDER
LOUISVALE
ONSEEPKANS

0 1 2 3 4
Kilometres
N14
KHÂI-MA RURAL
AGGENEYS
AGGENEYS
Truck Workshop
Waste Rock Dump
2Open Pit
Waste RockDump
1
Plant
Expolosive Magazine
Tailings Dam
N14
AGGENEYS
KHÂI-MA RURAL
KHÂI-MA RURAL
Camp
Return Water Dam
Conveyors
Primary Crusher
Electrical Switching
Yard
KHÂI-MA RURAL
Loop 10 Gravel Road
Pella
KHÂI-MA LOCAL MUNICIPALITY
19°6'0"E
19°6'0"E
19°0'30"E
19°0'30"E
18°55'0"E
18°55'0"E
29
°8'0
"S
29
°8'0
"S
29
°13
'30
"S
29
°13
'30
"S
SIZE:
TITLE:
DATE: Apr 2013
DRAWN: AB
CHECKED: MP
APPROVED: SHC
PROJECT: 0164903
DRAWING: REV:
A3
Figure 2.2:Updated General Layout Plan
Updated General Layout Plan.mxd 0
CLIENT:
±SCALE:
T:\G
is P
roje
cts
\0164
903_
Ga
msb
erg
\Map
pin
g\M
XD
\Repo
rt\A
pri
l201
3\U
pd
ate
d G
en
era
l L
ayout P
lan
.mxd
Projection: Transverse Mecator, CM19. Datum : WGS84
Source: Chief Directorate National Geo-Spatial Information. Black Mountain Mining (Pty) LTD
Inset Map: Esri Data & Maps
SCALE: 1 : 70 000
It is unlawful for any firm or individual to reproduce copyrighted maps, graphics or drawings, in whole or in part, without permission of the copyright owner, ERM Southern Africa (Pty) Ltd �
Legend
Non-Perennial River
Dry Water Course Centre Line
Dry Water Course Floodplain
Dam
Dry Pan
National Route (N14)
Main Road
Secondary Road
Other Road
Track/Footpath
Railway
Electrical cables
Haul Roads
Town Boundary
Cadastral Boundaries
Open Pit
Contractors Camp
Conveyor
Electrical Switching Yard
Explosive Magazine
Plant
Primary Crusher
Return Water Dam
Tailings Dam
Truck Workshop
Waste Rock Dump 1
Waste Rock Dump 2
Mineral Rights Area
Great Westerford Building240 Main RoadRondebosch, 7725Cape Town, SOUTH AFRICATel: +27 21 681 5400Fax +27 21 686 073
ERM

ENVIRONMENTAL RESOURCES MANAGEMENT GAMSBERG GEOCHEMICAL STUDY
13
2.3 GEOLOGY
The geology and mineralogy of the Gamsberg deposit has been investigated in numerous studies including those conducted by the O’okiep Copper Company (OCC: 1976, 1977 and 1982), Rozendaal (1974, 1975 and 1982), Gold Fields of South Africa Ltd (GFSA, 1993) and Anglo American plc (AA plc, June 2000). The latter report discussed differences in lithostratigraphic nomenclature between these studies and proposed a consolidation thereof, which has also been adopted by the Gamsberg project team. The following subsections are therefore informed primarily by the AA plc report.
2.3.1 Regional Geology
The Gamsberg zinc deposit is developed in a medium to high grade metamorphic volcano-sedimentary succession belonging to the Aggeneys Sub-Group of the Bushmanland Group. The Bushmanland Group is bordered to the east by the Hartbees River Thrust, to the north by the Groothoek Thrust and Wortel Belt, and it is overlain Karoo-age rocks to the south. Together these Groups occur within the Namaqualand Metamorphic Complex, which consists of Precambrian metamorphic rocks and intrusives formed or metamorphosed during the Namaqua Orogeny. The Bushmanland Group consists of basement granites (1 700 - 2 050 Ma), supra-crustal sequences of sedimentary and volcanic origin (1 200, 1 600, 1 900 Ma) and intrusive charnokite - granitic rocks (950, 1 030 - 1 060, 1 200 Ma).
2.3.2 Local Geology Figure 2.3 presents a stylised stratigraphic succession for the Project area, with specific detail of the Gamsberg North ore body that is targeted in this project. Table 2.1presents key characteristics of the various lithologies that would report as hanging wall, ore zone or footwall material. The succession at Gamsberg comprises of basal quartzo-feldspathic gneiss overlain progressively upwards by siliminite-bearing pelitic schist and metaquartzites of up to 450 m thickness; the Gams Iron Formation (GIF) of 0 to 80 m thickness; and Koeris Formation rocks consisting of quartz-muscovite schist, lenses of conglomerate and amphibolite to a thickness of 400 to 500 m. The latest phase of structural deformation of the local basin resulted in upturning and buckling, to produce a steep-limbed anticlinal structure on the north side of the inselberg
2.3.3 Geochemical Context of the Gamsberg Deposit
The Gamsberg stratigraphic sequence is believed to have been deposited as an accumulation of fine-grained siliceous and aluminous clastic sediments within a relatively large shallow basin. The connate water in the shallow basin showed a diverse range in pH, redox state and solution chemistry, which Rozendaal (1986) linked to the vertical and horizontal distribution of oxide,
ENVIRONMENTAL RESOURCES MANAGEMENT GAMSBERG GEOCHEMICAL STUDY
14
sulphide, sulphate and carbonate facies within the sequence. Anaerobic conditions were associated with the formation of metal sulphides, whereas oxidising conditions resulted in the conversion of sulphide to sulphate and the formation of metal oxides such as hematite (Fe2O3) and barite (BaSO4). Opencast mining of the Gamsberg deposit would disturb rocks from the Pella Quartzite, Gams Iron and Koeris Formations. Exposure of these rocks to oxygen could lead to oxidation of elements that currently occur in a reduced state which could, in turn, generate metal oxides, sulphate and acidity (H+). Where base or alkali minerals are present they may neutralise this acidity. If there is sufficient nett acidity to lower the pH of water in contact with the rock/mine waste material then metal leaching may occur, because metals are generally more soluble at low pH. The resultant acid rock drainage (ARD) could pose a threat to surface and groundwater resources in the area. Sulphide minerals are prevalent within rocks of the GIF, particularly within the B2 (pyrrhotite ore), B1 (pyrite ore) and A4 (pyritic quartzite) ore zones. By contrast, sulphides are generally absent from rocks of the Koeris and Pella Quartzite Formations. This suggests that weathering reactions would be predominantly kinetically driven for GIF lithologies, and equilibrium driven for Koeris and Pella Quartzite Formations. In kinetically driven systems the concentrations of chemical elements in surrounding water bodies are more dependent on the degree of contact between the mineral and the water body, and show greater variation over time, than within equilibrium driven systems. These following findings from a Gamsberg geochemical conducted by Wates, Meiring and Barnard (WMB, 2000) are consistent with the observations above: • Koeris Formation samples contained 0.2% or less sulphur. Amphibolite
and micaceous schist were both non acid producing and had a positive net neutralising potential (NNP) indicating some buffering capacity. WMB indicated an unlikelihood of saline drainage on exposure of Koeris materials, as dissolution of salts would be by slow equilibrium-driven weathering reactions.
• Pella quartzite samples were non acid-forming. The buffering capacity of
the quartzites was low (NP ≤ 2.7 kg CaCO3/t). The quartzites were chemically inert and would not produce saline drainage.
• GIF C samples were potentially acid-forming due to a high acid potential
(AP) and relatively low neutralisation potential (NP = 12 kg CaCO3/t). GIF A samples had a higher potential for acid generation than C Members due to their higher S and sulphide content (compared to predominantly oxide minerals in A Member rocks).
• Gossan samples were non acid-forming due to low sulphide content and
high NP (57 kg CaCO3/t).

ENVIRONMENTAL RESOURCES MANAGEMENT GAMSBERG GEOCHEMICAL STUDY
15
Figure 2.3 Stylised Stratigraphic Succession (after AA plc, June 2000)

ENVIRONMENTAL RESOURCES MANAGEMENT GAMSBERG GEOCHEMICAL STUDY
16
Table 2.1 Key characteristics of Gamsberg lithologies which would be disturbed by mining activities
Formation BIF Facies Lithostratigraphy Thickness (m) Description Ore / waste
Nousees Mafic Gneiss/Koeris
-
Amphibolite.
> 500
Amphibolite. Quartz veins in fractures.
Hanging wall waste.
Quartz-Muscovite Schist (plus conglomerate lenses).
Quartz-muscovite schist with interbedded micaceous quartzite and conglomerate (quartzite pebbles in quartz-muscovite matrix).
Gams Iron Formation (GIF)
Oxide BIF BIF (C Members). < 15
Similar silicate mineralogy to B Member, but magnetite and hematite present instead of sulphides. Often absent.
Magnetite ore (B). ± 8 Oxide iron formation containing quartz, orthopyroxene, clinopyroxene, grunerite, garnet, pyroxenoid and apatite.
Ore. Sulphide BIF
Pyrrhotite ore (B2). ± 15 Quartz, sillimanite, muscovite metapelite.
Pyrite ore (B1). ± 30 Quartz, sillimanite, muscovite, graphite metapelite.
Pyritic quartzite (A4). ± 5
Not economically mineralised. Upper pyritic quartzite and lower magnetite quartzite layers separated by marble / calc-silicate.
Footwall waste. -
Calc-silicate rock (A3 & A2).
± 20
Quartz, biotite, muscovite, sillimanite schist (A1).
30 - 90 Wortel/Pella Quartzite
Dark quartzite. Dark coloration is due to disseminated magnetite and hematite concentrated along quartz grain boundaries.
Schist. Thin irregular marker horizon. Interbedded with dark layers of micaceous quartzite.
White quartzite. > 200 Exposed as near-vertical exterior cliffs & flat tops of inselberg.
ENVIRONMENTAL RESOURCES MANAGEMENT GAMSBERG GEOCHEMICAL STUDY
17
3 METHODOLOGY
This section describes collection, handling and laboratory analysis of the study samples, as well the methods that were used to interpret the results and to assess quality assurance and control (QA/QC).
3.1 SAMPLE COLLECTION AND HANDLING
3.1.1 Ore and Waste Rock
ERM developed preliminary site conceptual models for the open pit mine and waste rock dump systems based on our review of the available project information, which included prior ESIA specialist studies and the Gamsberg exploration database maintained by Black Mountain Mine. The conceptual models then guided the selection of overburden and ore samples that would reasonably represent the range in material properties both spatially and with depth within the proposed pit area. ERM then collected the relevant samples from borehole cores drilled between November 2008 and June 2012. Existing geological profile logs were used in naming the individual material samples, and a Black Mountain geologist was at hand to assist ERM with sample verification and cutting of the core samples. A small number of grab samples of rock (amphibole, quartz-muscovite-schist, silicified and spongy gossan, and white quartzite) were also collected from on top of the inselberg, to represent weathered materials exposed at surface. All of the samples were couriered to Waterlab Laboratory in Pretoria, under cover of a chain of custody form, for geochemical testing and analysis. Prior to ABA and NAG testing the samples were crushed to 75% passing 9.5 mm, pulverised to 85% passing 75 µm, and then the final pulps were composited and homogenised. Chemical analysis was performed on the pulps. Short-term leach testing was performed on another sub-sample which was crushed to 9.5 mm in accordance with ASTM Method D3987-06: Standard Test Method for Shake Extraction of Solid Waste with Water. Table 3.1 lists the number of samples collected of various rock types that will be disturbed by the proposed mining operations at Gamsberg. Appendix A shows detailed sample information, including the borehole and depth range from within which each sample was collected.

ENVIRONMENTAL RESOURCES MANAGEMENT GAMSBERG GEOCHEMICAL STUDY
18
Table 3.1 Summary of Gamsberg Ore and Waste Rock Core Samples
Formation Lithostratigraphy Rock Type Samples Ore / waste
Nousees Mafic Gneiss/Koeris
Amphibolite AMP: Amphibolite. 2
Hanging wall waste.
Quartz-Muscovite Schist, including conglomerate lenses.
IQS and ISQ: Interbanded schist and quartzite. 3 PEG: Pegmatite. 1 MSS: Quartz muscovite schist. 4 QMS: Quartz muscovite biotite schist. 2 SCH: Schist (undifferentiated). 2 CON: Conglomerate. 1
Gams Iron Formation (GIF)
BIF (C Members).
GTT: Garnetite. 4 GMQ: Garnet magnetite quartz rock. 3 AMQ: Amphibole magnetite quartz rock. 1 GAP: Garnet amphibole pyroxenoid quartz rock. 1
Magnetite ore (B). MPO: Pyroxenite-amphibole-garnet-magnetite hosted ore. 7
Ore.
MMG: Massive magnetite. 1
Pyrrhotite (B2) and Pyrite (B1) Ore.
PEO (po): Pelite-hosted ore, pyrrhotite dominant. 13 GOS: Gossan. 4 PEO(py): Pelite-hosted ore, pyrite dominant. 5 PEL: Meta-pelite-rock. 1
Pyritic quartzite (A4). PYQ: Pyritic quartzite. 2
Footwall waste. Calc-silicate rock (A3 & A2). CAS: Calc-silicate rock. 7
Wortel/Pella Quartzite
Dark quartzite. DQZ: Dark quartzite. 1 Schist. IQS and ISQ: Interbanded schist and quartzite. 1 White quartzite. WQZ: White quartzite. 2
Namies Schist Quartz, biotite, muscovite, sillimanite schist.
QMS: Quartz muscovite biotite schist. Sampled in Koeris Basal rock (unaffected). SCH: Schist (undifferentiated).
Haramoep Gneiss Gneiss. BGN: Biotite gneiss. 1
ENVIRONMENTAL RESOURCES MANAGEMENT GAMSBERG GEOCHEMICAL STUDY
19
3.1.2 Tailings
Metallurgical testwork was conducted by Mintek on pyrite, pyrrhotite and magnetite bulk ore samples to produce a rougher tailings sample per ore type. The tailings samples were provided moist (but with no excess supernatant water) to ERM for geochemical testing in late February 2013. The three tailings samples were submitted to Waterlab for static geochemical testing. A composite tailings sample was generated from the above three tailings based on the relative proportion of each ore type in the Gamsberg resource. Black Mountain Mine confirmed the pyrite : pyrrhotite : magnetite ore ratio as approximately 78% : 17% : 5%. This sample was then prepared for static and kinetic geochemical testing and analysis.
3.2 ANALYTICAL TEST METHODS
3.2.1 Sample Mineralogy
The samples were analysed with a PANalytical Empyrean diffractometer with PIXcel detector and fixed slits with Fe filtered Co-Kα radiation. X’Pert Highscore Plus software was used to identify phases, the relative weight % of which were estimated using the Rietveld method (Autoquan program).
3.2.2 Elemental composition
The sample elemental composition data captured in the exploration database maintained by Black Mountain was based on the following analytical methods documented by ALS Chemex laboratory: • Pb and Zn by method ME- OG62: Ore Grade Elements by Four Acid
Digestion Using Conventional ICP- AES Analysis; • Total sulphur by method S-IR08 S: Total sulfur by Leco furnace and Infrared
Spectroscopy and sulphide-sulphur by Leco furnace using method S-IR07; • Total carbon by method C-IR07 and inorganic carbon by method C-
GAS05: HCl leach and Leco-gasometric finish; and • All other constituents were determined by method ME-MS61: Ultra-trace
level method using ICP-MS and ICP-AES. The elemental composition of the samples collected in this study was determined by aqua regia digestion and analysis by ICP-OES.
3.2.3 Sulphur Speciation
Pyrolysis of the samples was conducted at 550°C according to the Prediction Manual For Drainage Chemistry from Sulphidic Geological Materials: MEND Report 1.20.1. Total sulphur was determined by LECO.
ENVIRONMENTAL RESOURCES MANAGEMENT GAMSBERG GEOCHEMICAL STUDY
20
3.2.4 Acid base Accounting (ABA)
ABA is used to predict the potential for geologic materials and mining wastes to generate acid rock drainage (ARD) at some point in time if exposed to oxygen and water. ABA testing was performed on the rock samples using the Modified Sobek Method (EPA-600), to predict their acid neutralising potential (NP) and acid generation potential (AP). The analyses included paste pH determinations, total sulphur determinations, fizz tests and acid-base titrations. Bulk NP, AP, Net NP (calculated as NP – AP) and Net Potential Ratio (NPR, calculated as NP/AP) were then calculated for each sample.
3.2.5 Net acid Generation (NAG) Test
The NAG test is generally used in association with the ABA test to classify the acid-generation potential of a sample. The NAG test involves the addition of 250 mL of 15% hydrogen peroxide to the sample to rapidly oxidize sulphide minerals. Upon completion, the NAG pH was measured and the reaction pulp was titrated to pH 4.5 and to pH 7.0 with a standardised sodium hydroxide solution. The NAG test was also used to generate a peroxide extraction, as part of the static leach testing.
3.2.6 Static Leach Testing
Static leach testing is used to determine the potential mobility of trace metals in the rock under specific conditions. Two static leach tests were conducted: • The Distilled Water Leaching Procedure is used to assess the short-term
metal and salt release of the material under neutral pH conditions. The method involves adding 1 000 ml of distilled water to a 250 g crushed rock sample (1:4 solid : liquid ratio) and rotating it in a rotary extraction device for 18 ± 2 hours. The analysis of soluble constituents includes all the major parameters as well as trace elements; and
• The peroxide extraction test is used to assess metal and salt release from
the rock under strongly oxidizing conditions. Peroxide is a strong oxidant which accelerates the oxidation of sulphide minerals, and releases acidity and trace elements present in the sulphides.
3.2.7 Kinetic Geochemical Testing
Selected material samples collected in this study were submitted for kinetic geochemical testing by way of humidity cell, per American Society for Testing and Materials standard ASTM D5744-96 (ASTM, 2000). The humidity cell is an accelerated test designed to assess the likely long term geochemical behaviour of a material. This includes determination of the availability of neutralisation potential, rates of sulphide oxidation/acid generation and neutralisation depletion, calculation of the timing to onset of ARD and prediction of future water quality. Humidity cells typically run for a period of 20 weeks or longer.
ENVIRONMENTAL RESOURCES MANAGEMENT GAMSBERG GEOCHEMICAL STUDY
21
3.3 DATA INTERPRETATION METHODS
3.3.1 Ionic Charge Balances
Ion charge balances were calculated for solutions as an indication of quality assurance/quality control (QA/QC). A fundamental property of aqueous solutions is that they are electrically neutral, so the equivalents of cations should balance that of the anions. Charge balance error was calculated (considering major anions and cations) using the following equation:
Charge balance errors ≤ 15 % are considered acceptable for most samples.
3.3.2 Duplicate Samples / Analyses Duplicate ABA and NAG testing was conducted on sets of duplicate Gamsberg ore/waste samples using the same analytical method. The relative standard deviation (RSD) was then calculated as the quotient of the standard deviation of an array and the average value of that same array, expressed as a percentage. A lower percentage indicates a lower variability in the data set, whereas a higher percentage indicates the data set is more varied. Note that the comparative results represent a measure of analytical precision (or repeatability) rather than analytical accuracy (or reproducibility). Deviations in analytical accuracy or precision may be introduced through bias (non-random or directed effects caused by factors unrelated to the independent variable) or error (random variability) during the sampling, sample handling, analytical and/or data capture steps.
3.3.3 Assessment of Sample Representivity
ERM reviewed an Excel database of geological information for rock samples collected in exploration programs run by companies that had historically considered developing the Gamsberg deposit. The database included mineralogical and elemental composition of a large number of rock samples retrieved from exploration drill holes. The database was useful in selecting specific rock materials (from existing drill cores) for sampling in this study, specifically where sulphide abundance and mineralogy had been recorded. The database was additionally useful in assessing the representivity (in terms of geochemical characteristics) of the samples assessed in this study relative to the larger sample population. Confirmation of this representivity would increase confidence in the results of this study and reduce the requirement for collecting and testing larger numbers of samples per material.

ENVIRONMENTAL RESOURCES MANAGEMENT GAMSBERG GEOCHEMICAL STUDY
22
3.3.4 Assessment of Acid Generation Potential
Various criteria can be used to screen the potential for a material to generate ARD. Several of these criteria are defined below. Screening criterion 1: NPR Screening criteria presented in the MEND (2009) guidance report classify the ARD potential of a material sample based on its NPR using the Modified Sobek ABA analytical method. These criteria are as follows: • NPR < 1 : Potentially acid-generating; • 1 < NPR < 2 : Uncertain potential for acid-generation; and • NPR > 2 : Non acid-generating. Screening criterion 2: NPR and Sulphide-Sulphur Sorgaroli and Lawrence (1997) define a sample as being potentially acid generating when NPR < 1 and sulphide-sulphur > 0.3 %. Screening criterion 3: NNP Usher et al. (2003) recognise the following ARD screening criteria: • NNP < -20 kg CaCO3/t : Potentially acid generating; • -20 kg CaCO3/t < NNP < +20 kg CaCO3/t : Uncertainty regarding acid
generation potential; and • NNP > +20 kg CaCO3/t : Potential acid neutralising. Screening criterion 4: NAG pH Criteria for the NAG test procedure (AMIRA, 2002) specify that a test solution pH below 4.5 indicates the sample has inadequate available NP to prevent it from becoming net acid generating. The NAG results differ from the ABA test in that the former involves simultaneous reaction of all acid generating and neutralising components in the sample under conditions of total oxidation.
3.3.5 Leachate Concentrations versus AER Levels
Trace element concentrations in leachates – obtained using distilled water and hydrogen peroxide as extractants - were compared against Acceptable Environmental Risk (AER) values listed in the “Minimum Requirements for the handling, classification and disposal of hazardous waste” published by the South African Department of Water Affairs (DWAF, 1998). The AER for a particular constituent represents the concentration of that constituent at which a substance would cause a mortality incidence of one in three hundred thousand in an aquatic environment and is defined in the guideline as the level at which the substance will have little adverse effect on the environment.

ENVIRONMENTAL RESOURCES MANAGEMENT GAMSBERG GEOCHEMICAL STUDY
23
4 GAMSBERG TAILINGS GEOCHEMISTRY
Three rougher tailings samples, one each representing tailings from magnetite (Mag RO tails), pyrrhotite (Po RO tails) and pyrite (Py RO ore) ore packages, were received from Mintek in late February 2013. From these samples ERM also generated a final tailings composite sample, at a ratio of 5% Mag RO tails: 17% Po RO tails: 78% Py RO tails as provided by AMEC tailings engineers. Project scheduling did not allow for completion of all laboratory testwork on these samples by the time that this report was due. The results that were available from this current study were therefore supplemented by kinetic testwork data that was generated and described previously by WMB (2000) and SRK (2010) for historical Gamsberg pilot plant tailings samples.
4.1 TAILINGS COMPOSITION
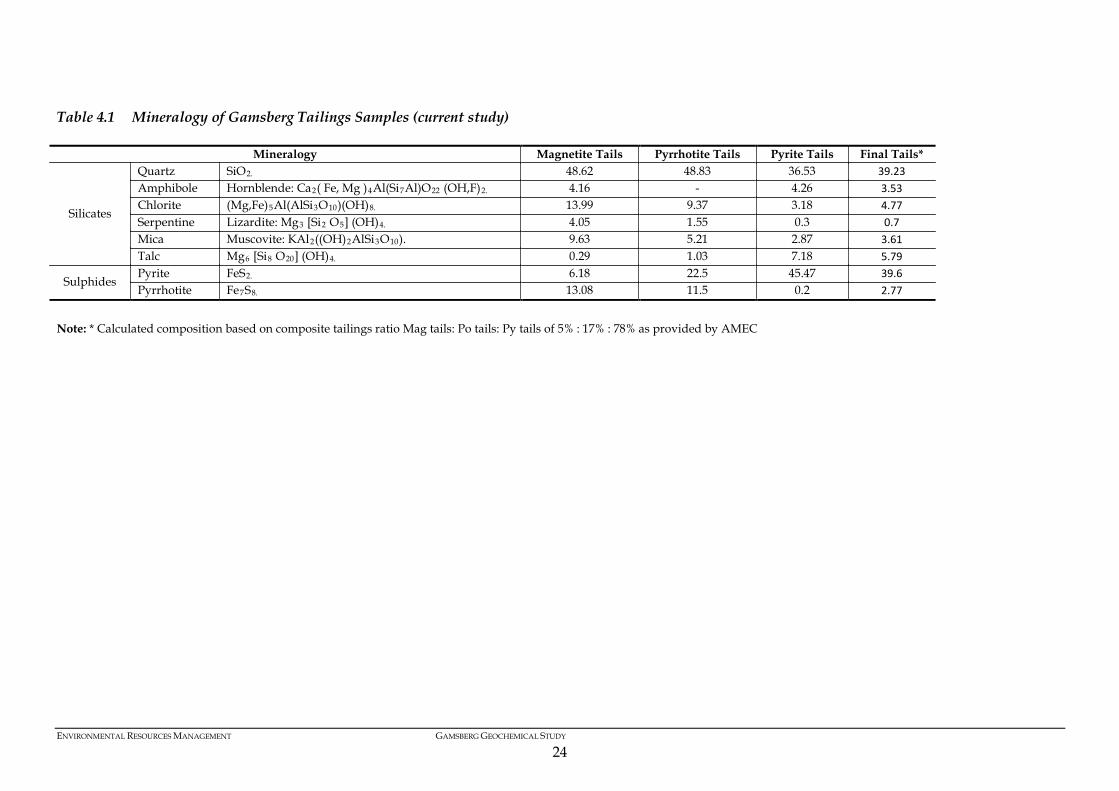
Table 4.1 shows the mineralogical composition of the three rougher ore tailings samples as well as the calculated mineralogical composition of the final tailings based on project ore ratios. No tailings mineralogy data was available from the WMB 2000 study for comparison. Each of the ore tailings samples contained only silicate and sulphide minerals within the detection limits of the XRD technique. Quartz occurred in substantial quantities in each of the ore tailings samples, whilst less prevalent silicates included chlorite, mica (muscovite), serpentine (lizardite), talc and amphibole (hornblende). The ore tailings samples contained significant quantities of pyrite and pyrrhotite, particularly within the pyrite ore tailings where pyrite was most prevalent. The final Gamsberg tailings sample contained over 42% of iron sulphides, most of which was pyrite. Pyrite and pyrrhotite may undergo oxidation on exposure, to generate SO4 and acidity. Table 4.2 shows elemental concentrations (in order of decreasing abundance in the final tailings sample) in each of the four tailings solid samples assessed in this current study. Concentrations in the final tailings sample were calculated based on likely ore ratios provided by AMEC. The occurrence of 39.6% pyrite and 2.8% pyrrhotite in the final tailings sample (refer Table 4.1) would equate to 20.1% Fe and 22.3% S were these two elements to occur exclusively as these two minerals. The concentrations of Fe and S in the final tailings solid sample closely approximate these values (at 23.4% and 22.8% respectively), suggesting that only minor quantities of Fe occur in hornblende and chlorite rather than in these Fe-sulphide minerals.
ENVIRONMENTAL RESOURCES MANAGEMENT GAMSBERG GEOCHEMICAL STUDY
24
Table 4.1 Mineralogy of Gamsberg Tailings Samples (current study)
Mineralogy Magnetite Tails Pyrrhotite Tails Pyrite Tails Final Tails*
Silicates
Quartz SiO2. 48.62 48.83 36.53 39.23 Amphibole Hornblende: Ca2( Fe, Mg )4Al(Si7Al)O22 (OH,F)2. 4.16 - 4.26 3.53 Chlorite (Mg,Fe)5Al(AlSi3O10)(OH)8. 13.99 9.37 3.18 4.77 Serpentine Lizardite: Mg3 [Si2 O5] (OH)4. 4.05 1.55 0.3 0.7 Mica Muscovite: KAl2((OH)2AlSi3O10). 9.63 5.21 2.87 3.61 Talc Mg6 [Si8 O20] (OH)4. 0.29 1.03 7.18 5.79
Sulphides Pyrite FeS2. 6.18 22.5 45.47 39.6 Pyrrhotite Fe7S8. 13.08 11.5 0.2 2.77
Note: * Calculated composition based on composite tailings ratio Mag tails: Po tails: Py tails of 5% : 17% : 78% as provided by AMEC

ENVIRONMENTAL RESOURCES MANAGEMENT GAMSBERG GEOCHEMICAL STUDY
25
The solid concentration of Si in the tailings samples appears to be largely underestimated in relation to the relative abundance of silicate minerals detected in the samples by XRD. This likely relates to certain silicates not having dissolved in the aqua regia digest and/or the analyst having not calibrated the ICP-OES technique to account for the largely siliceous matrix. The occurrence of significant quantities of Al, Ca, Mg and K corresponds with the occurrence of the silicate minerals detected in the tailings samples by XRD. Additional metals which occurred in relative abundance in the final tailings included Mn, Pb As, Cr, Cu, Ni and Co. These metals were also enriched within the tailings samples assessed by WMB in 2000 and SRK in 2010.
Table 4.2 Elemental Composition of Gamsberg Pilot Tailings Samples, Listed in Decreasing Order of Abundance in the Final Tailings
Element Units Mag tails Po tails Py tails Final tails* Fe mg/kg 165 200 249 400 234 800 233 802 S mg/kg 84 800 188 800 245 800 228 040
Al mg/kg 3 800 9 000 6 400 6 712 Ca mg/kg 17 600 4 600 2 600 3 690 Mn mg/kg 13 200 3 600 2 400 3 144 Mg mg/kg 1 600 2 600 1 200 1 458 Pb mg/kg 551 428 1 188 1 027 K mg/kg 340 880 820 806
Na mg/kg 400 600 600 590 As mg/kg 206 266 527 466 P mg/kg 3 800 886 145 454
Si** mg/kg 320 160 260 246 Cr mg/kg 202 159 167 167 Cu mg/kg 73 91 147 134 Ni mg/kg 134 132 115 119 Co mg/kg 23 68 63 62 Mo mg/kg 3 13 16 15 Zr mg/kg 3 10 12 11 Ti mg/kg 141 7 3 10 Sr mg/kg 16 20 6 9 V mg/kg 16 9 6 7
Note: * Calculated concentrations based on composite ore tailings ratios provided by AMEC ** Si concentrations are likely underestimated as described in the text
4.2 ACID GENERATION POTENTIAL
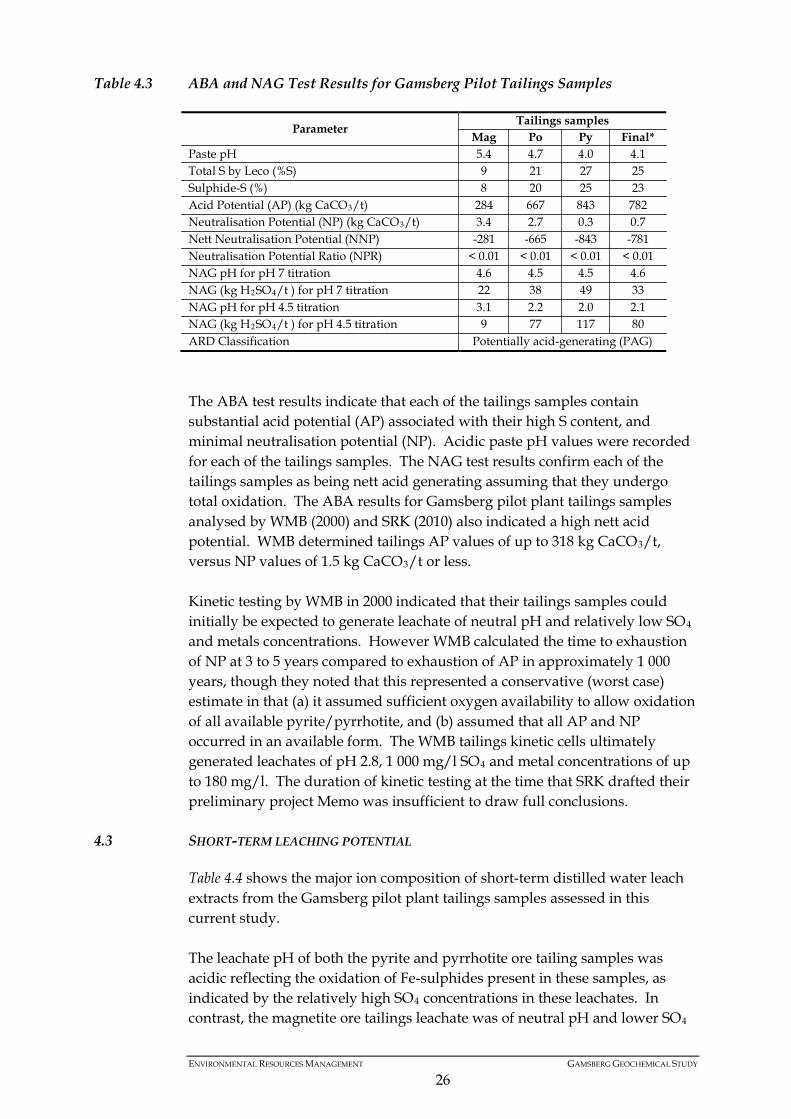
Table 4.3presents ABA and NAG test results for the Gamsberg tailings samples assessed in this study. The results confirm that sulphur present in the samples occurs almost exclusively as sulphide.
ENVIRONMENTAL RESOURCES MANAGEMENT GAMSBERG GEOCHEMICAL STUDY
26
Table 4.3 ABA and NAG Test Results for Gamsberg Pilot Tailings Samples
Parameter Tailings samples
Mag Po Py Final* Paste pH 5.4 4.7 4.0 4.1 Total S by Leco (%S) 9 21 27 25 Sulphide-S (%) 8 20 25 23 Acid Potential (AP) (kg CaCO3/t) 284 667 843 782 Neutralisation Potential (NP) (kg CaCO3/t) 3.4 2.7 0.3 0.7 Nett Neutralisation Potential (NNP) -281 -665 -843 -781 Neutralisation Potential Ratio (NPR) < 0.01 < 0.01 < 0.01 < 0.01 NAG pH for pH 7 titration 4.6 4.5 4.5 4.6 NAG (kg H2SO4/t ) for pH 7 titration 22 38 49 33 NAG pH for pH 4.5 titration 3.1 2.2 2.0 2.1 NAG (kg H2SO4/t ) for pH 4.5 titration 9 77 117 80 ARD Classification Potentially acid-generating (PAG) The ABA test results indicate that each of the tailings samples contain substantial acid potential (AP) associated with their high S content, and minimal neutralisation potential (NP). Acidic paste pH values were recorded for each of the tailings samples. The NAG test results confirm each of the tailings samples as being nett acid generating assuming that they undergo total oxidation. The ABA results for Gamsberg pilot plant tailings samples analysed by WMB (2000) and SRK (2010) also indicated a high nett acid potential. WMB determined tailings AP values of up to 318 kg CaCO3/t, versus NP values of 1.5 kg CaCO3/t or less. Kinetic testing by WMB in 2000 indicated that their tailings samples could initially be expected to generate leachate of neutral pH and relatively low SO4 and metals concentrations. However WMB calculated the time to exhaustion of NP at 3 to 5 years compared to exhaustion of AP in approximately 1 000 years, though they noted that this represented a conservative (worst case) estimate in that (a) it assumed sufficient oxygen availability to allow oxidation of all available pyrite/pyrrhotite, and (b) assumed that all AP and NP occurred in an available form. The WMB tailings kinetic cells ultimately generated leachates of pH 2.8, 1 000 mg/l SO4 and metal concentrations of up to 180 mg/l. The duration of kinetic testing at the time that SRK drafted their preliminary project Memo was insufficient to draw full conclusions.
4.3 SHORT-TERM LEACHING POTENTIAL
Table 4.4 shows the major ion composition of short-term distilled water leach extracts from the Gamsberg pilot plant tailings samples assessed in this current study. The leachate pH of both the pyrite and pyrrhotite ore tailing samples was acidic reflecting the oxidation of Fe-sulphides present in these samples, as indicated by the relatively high SO4 concentrations in these leachates. In contrast, the magnetite ore tailings leachate was of neutral pH and lower SO4

ENVIRONMENTAL RESOURCES MANAGEMENT GAMSBERG GEOCHEMICAL STUDY
27
content reflecting the oxide facies of the GIF ore package. The alkalinity content in leachates from each the ore tailings samples was low. The leachate results from the final tailings sample approximate those of the pyrrhotite and particularly pyrite ore tailings samples which contribute greatest towards the final tailings composition both in terms of bulk mass and sulphide content.
Table 4.4 Major ion Concentrations in Distilled Water Leachates from Gamsberg Tailings
Parameter Units Tailings samples
Mag ore Po ore Py ore Final pH - 6.8 4.5 3.9 3.9 EC mS/m 72 169 145 142
TDS mg/l 570 1 666 1 406 1370
Alkalinity mg CaCO3/l 12 < 5 < 5 < 5
Cl mg/l 43 85 < 5 <5
SO4 mg/l 296 830 757 778
NO3 as N mg N/l < 0.2 < 0.2 < 0.2 < 0.2 o-PO4 as P mg P/l < 0.2 < 0.2 < 0.2 < 0.2
F mg/l 0.7 0.4 < 0.2 < 0.2
Table 4.5 shows the metal concentrations which exceeded Acceptable Environmental Risk (AER) levels in distilled water leachates and/or hydrogen peroxide extracts from one or more of the tailings samples assessed in this current study. These metals included Al, Cd, Cu, Fe, Mn, Pb, Sb and Zn. Under leaching conditions similar to these two respective laboratory tests, these metals could be expected to mobilise from the Gamsberg tailings at concentrations that would cause mortality incidence of 1: 300 000 in an aquatic environment. The AER levels are defined as the thresholds above which these metals will begin to exert an adverse effect on the environment (DWAF, 1998). It is important to note that the composition of a short-term leach test sample may reflect the proportion of a constituent in the solid sample and/or tailings matrix water which is readily soluble and would be mobilised in a ‘first-flush’ scenario. Kinetic leach testing would provide a more accurate reflection of the longer-term leaching behaviour of the tailings material.

ENVIRONMENTAL RESOURCES MANAGEMENT GAMSBERG GEOCHEMICAL STUDY
28
Table 4.5 Metal Leachate Concentrations (distilled water, peroxide) which Exceeded AER Levels in one or more Tailings Sample
Metal AER value Leach type Tailings samples Mag ore Po ore Py ore Final
Al (mg/l) 0.39 Distilled water. 1 3 2.5 Peroxide. 19 45 32
Cd (mg/l) 0.031 Distilled water. 0.1 0.2 0.1 Peroxide. 1.0 1.1 2.6
Cu (mg/l) 0.1 Distilled water. 8 3.1 Peroxide. 0.1
Fe (mg/l) 9 Distilled water. 50 12 76 Peroxide. 0.4 0.5 0.7
Mn (mg/l) 0.3 Distilled water. 48 23 13 15 Peroxide. 826 1 247 1 1 74
Pb (mg/l) 0.1 Distilled water. 0.1 3.3 1 Peroxide. 66 18 12
Sb (mg/l) 0.07 Distilled water. Peroxide. 2.8 2.1 5.9
Zn (mg/l) 0.7 Distilled water. 6 13 31 1 Peroxide. 13 11 25
4.4 SAMPLE REPRESENTIVITY
Comparison of static test data received to date for tailings samples assessed in this study against tailings samples assessed by WMB (2000) indicates similarity in geochemical characteristics. Both sets of samples showed similar relative elemental abundances in the tailings solid and leach extracts, as well as the potential to generate nett acidity under the laboratory conditions of the ABA test. It is provisionally assumed that the long-term geochemical behaviour of the WMB tailings (established through their kinetic test program) will approximate that of the tailings samples from the current study.
4.5 CALCULATION OF TSF SOURCE-TERMS
It is proposed to develop the Gamsberg TSF approximately 2 km north of the Gamsberg inselberg, along the northern boundary of the N14. The TSF is to be developed to a maximum height of 70 m on a 280 ha (2.8 km2) footprint, and will have a final capacity of approximately 132 Mt. The conceptual model developed for geochemical modelling of the Gamsberg TSF is illustrated in Table 4.1. Conceptual site models describe sources of constituents of primary concern, the mechanisms of their release, the pathways for their transport and the potential for human and ecological exposure to these parameters. Note that the conceptual model is preliminary only, in that TSF engineering design specifications were only conceptual / provisional at the time of compiling this report. The TSF model will need refinement in the detailed design phase, and indeed throughout life of mine.
ENVIRONMENTAL RESOURCES MANAGEMENT GAMSBERG GEOCHEMICAL STUDY
29
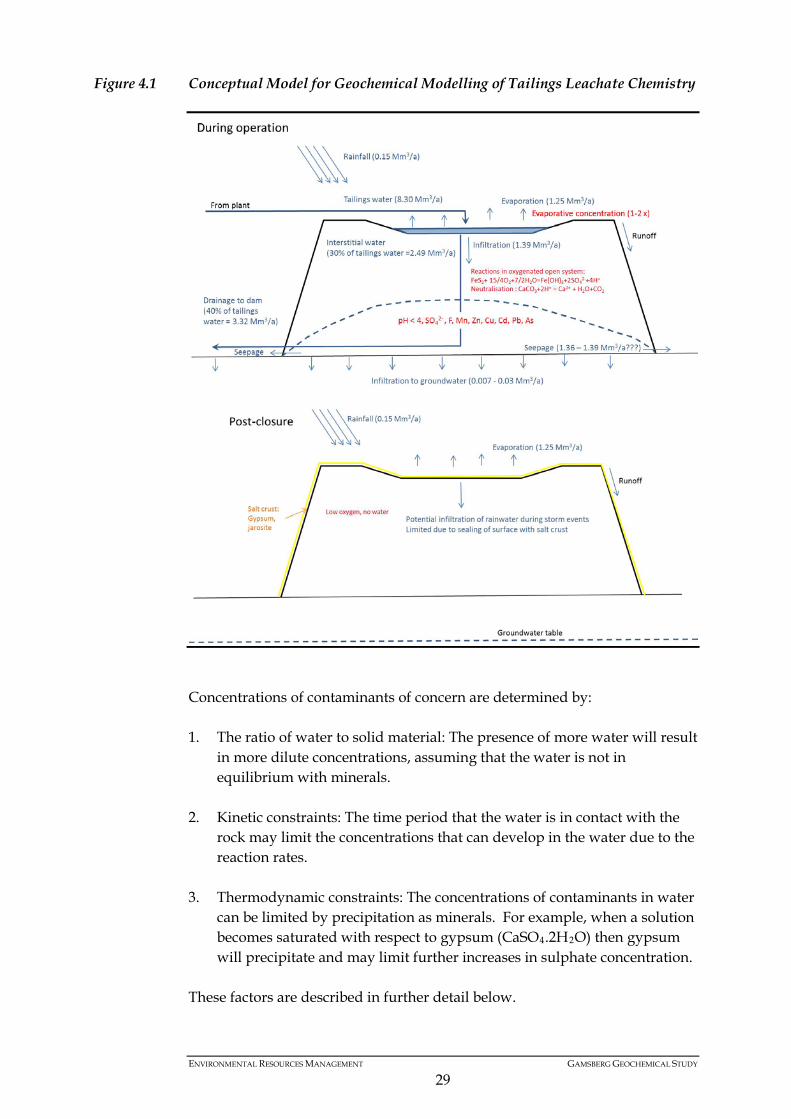
Figure 4.1 Conceptual Model for Geochemical Modelling of Tailings Leachate Chemistry
Concentrations of contaminants of concern are determined by: 1. The ratio of water to solid material: The presence of more water will result
in more dilute concentrations, assuming that the water is not in equilibrium with minerals.
2. Kinetic constraints: The time period that the water is in contact with the
rock may limit the concentrations that can develop in the water due to the reaction rates.
3. Thermodynamic constraints: The concentrations of contaminants in water
can be limited by precipitation as minerals. For example, when a solution becomes saturated with respect to gypsum (CaSO4.2H2O) then gypsum will precipitate and may limit further increases in sulphate concentration.
These factors are described in further detail below.

ENVIRONMENTAL RESOURCES MANAGEMENT GAMSBERG GEOCHEMICAL STUDY
30
Ratio of Water to Solid Material In order to estimate the volume of water likely to interact with the tailings, a simple water balance was constructed using information provided by Ciaran Molloy (AMEC) as well as climate data for the region. The assumptions used in the TSF water balance are given in Table 4.6. The volume of infiltration was calculated assuming that infiltration is the difference between inputs (i.e. direct rainfall recharge to the TSF surface area, and water added via tailings deposition) and outputs (i.e. drainage to the return water/evaporation dam, and evaporation). Rainfall recharge was calculated as average annual rainfall multiplied by the surface area of the TSF. Evaporative loss was calculated as the evaporation rate multiplied by the surface area of the TSF pond, which was assumed to occupy 30% of the upper surface area of the TSF. In the geochemical model, the total amount of water in contact with the tailings (i.e. water trapped in interstices plus water flowing through the tailings) is used to determine concentrations. In the absence of a detailed deposition plan it was assumed that the tonnage of tailings per annum would grow linearly but that the upper surface area would remain constant (i.e. the tailings will grow vertically but not laterally with time). The current conceptual model assumes that on closure, the tailings water source stops and the water balance becomes negative so that no further leaching of water through oxidised tailings is expected. The water remaining in the saturated zone of the TSF will gradually drain via the toe-drainage system and to the regional groundwater. This water is expected to have a composition equivalent to that modelled for the final year of operation, with elevated sulphate, low pH and elevated metal concentrations.
Table 4.6 Input Parameters for Calculation of Infiltration in the Gamsberg TSF System
Input parameter Value Units Source Footprint surface area. 2.8 x 10⁶ m2 Site engineers (AMEC). Height. 70 m Site engineers (AMEC). Mass. 1.55 x 10⁸ t Pers. Comm. Ciaran Molloy (AMEC). Rainfall. 0.0962 m/a Based on Aggeneys long term average
2000-2012. Evaporation. 2.65 m/a From WR (2005). Volume of process water deposited on tailings.
8.19 x 10⁶ m3/a Pers. Comm. Ciaran Molloy (AMEC).
Size of pond (percentage of final upper surface area).
30 ≈471 000
% m2
Pers. Comm. Ciaran Molloy (AMEC).
Recovery of process water into RWD.
40 % Pers. Comm. Ciaran Molloy (AMEC).
Maximum height of water table. 23 m abgl Pers. Comm. Ciaran Molloy (AMEC).
ENVIRONMENTAL RESOURCES MANAGEMENT GAMSBERG GEOCHEMICAL STUDY
31
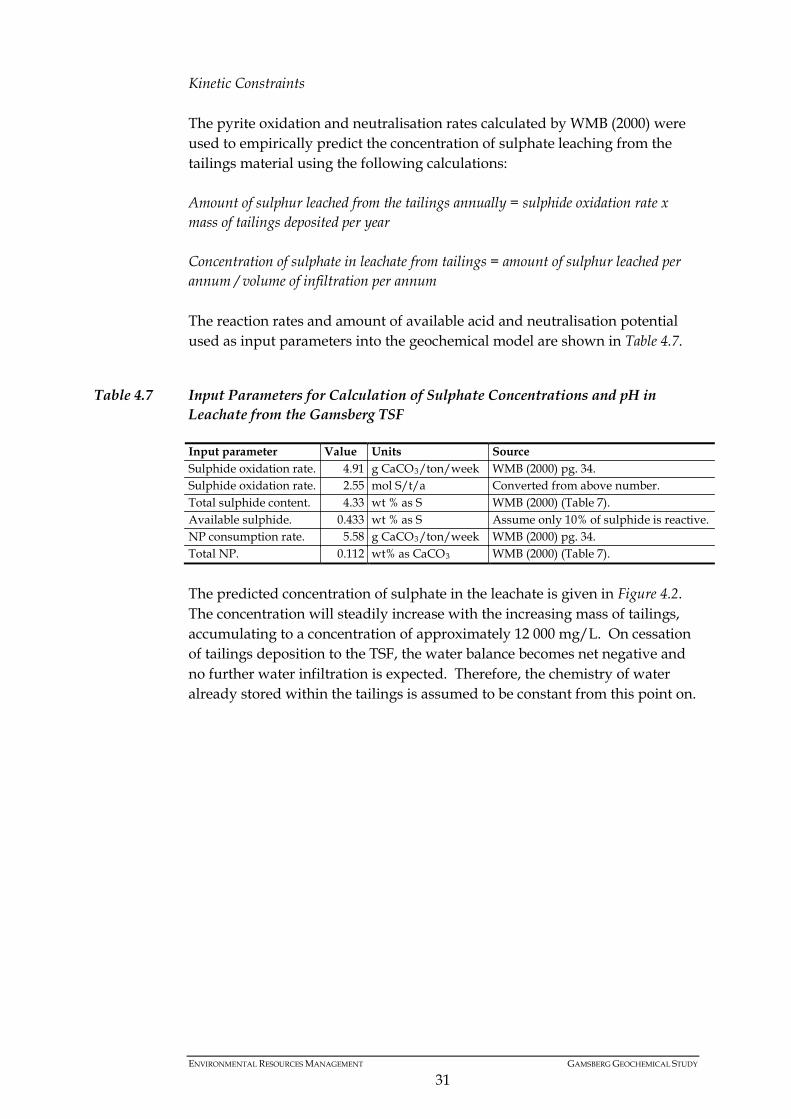
Kinetic Constraints The pyrite oxidation and neutralisation rates calculated by WMB (2000) were used to empirically predict the concentration of sulphate leaching from the tailings material using the following calculations: Amount of sulphur leached from the tailings annually = sulphide oxidation rate x mass of tailings deposited per year Concentration of sulphate in leachate from tailings = amount of sulphur leached per annum / volume of infiltration per annum The reaction rates and amount of available acid and neutralisation potential used as input parameters into the geochemical model are shown in Table 4.7.
Table 4.7 Input Parameters for Calculation of Sulphate Concentrations and pH in Leachate from the Gamsberg TSF
Input parameter Value Units Source Sulphide oxidation rate. 4.91 g CaCO3/ton/week WMB (2000) pg. 34. Sulphide oxidation rate. 2.55 mol S/t/a Converted from above number. Total sulphide content. 4.33 wt % as S WMB (2000) (Table 7). Available sulphide. 0.433 wt % as S Assume only 10% of sulphide is reactive. NP consumption rate. 5.58 g CaCO3/ton/week WMB (2000) pg. 34. Total NP. 0.112 wt% as CaCO3 WMB (2000) (Table 7).
The predicted concentration of sulphate in the leachate is given in Figure 4.2. The concentration will steadily increase with the increasing mass of tailings, accumulating to a concentration of approximately 12 000 mg/L. On cessation of tailings deposition to the TSF, the water balance becomes net negative and no further water infiltration is expected. Therefore, the chemistry of water already stored within the tailings is assumed to be constant from this point on.

ENVIRONMENTAL RESOURCES MANAGEMENT GAMSBERG GEOCHEMICAL STUDY
32
Figure 4.2 TSF Sulphate Source Term Curve for the LOM
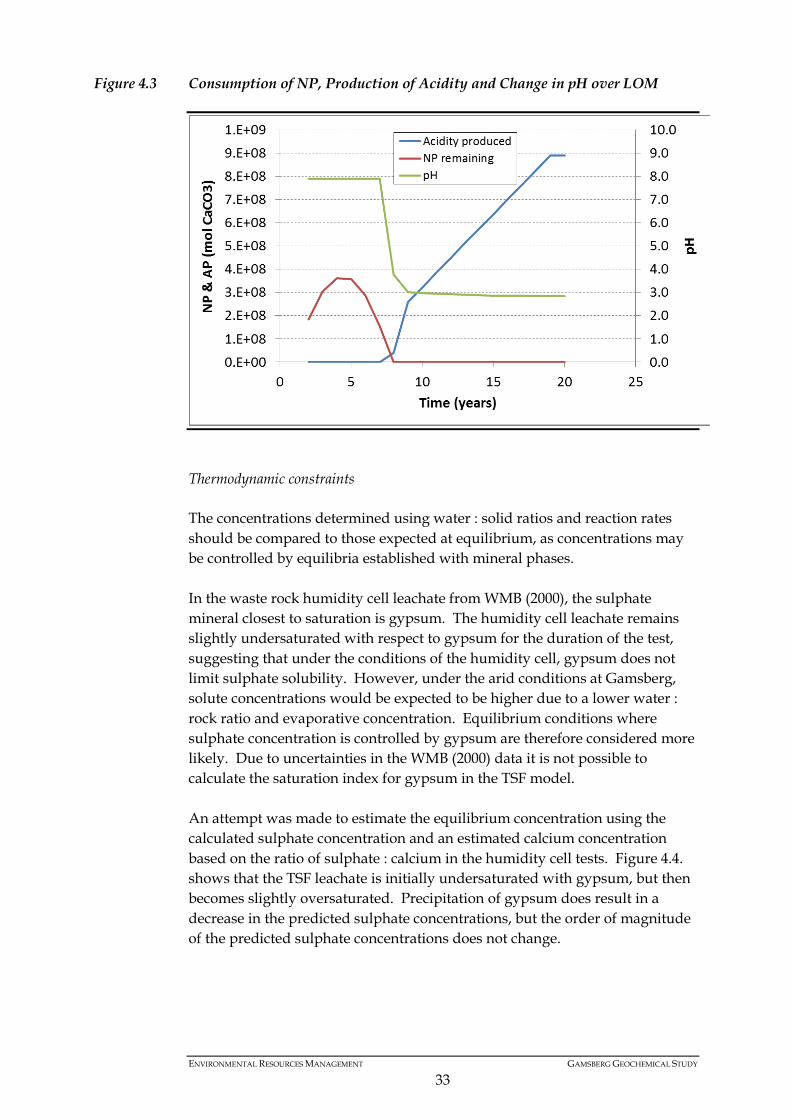
In order to determine the potential for development of low pH conditions, the production of acid was compared to the consumption of neutralisation potential (NP) on an annual basis. The rate of consumption of NP was determined from the WMB humidity cell tests. The amount of NP consumed per annum was subtracted from the total amount of NP available in the tailings material per annum. The tailings were assumed to become acid-generating at the point where the amount of NP consumed exceeded the NP available. The net acidity was calculated as the difference between the amount of NP required and the amount available. This was converted to a concentration of hydrogen ions, which was then converted to a pH. The predicted change in pH with time at the TSF is illustrated in Figure 4.3. At the low pH predicted to onset within 10 years of TSF initiation, metals such as Mn, Zn, Cu, Cd and Pb may become mobile. Non-metals and metalloids, including NO3, F and As were also detected in the humidity cell tests and may be mobile throughout the life of the TSF i.e. they are less pH dependent.
ENVIRONMENTAL RESOURCES MANAGEMENT GAMSBERG GEOCHEMICAL STUDY
33
Figure 4.3 Consumption of NP, Production of Acidity and Change in pH over LOM
Thermodynamic constraints The concentrations determined using water : solid ratios and reaction rates should be compared to those expected at equilibrium, as concentrations may be controlled by equilibria established with mineral phases. In the waste rock humidity cell leachate from WMB (2000), the sulphate mineral closest to saturation is gypsum. The humidity cell leachate remains slightly undersaturated with respect to gypsum for the duration of the test, suggesting that under the conditions of the humidity cell, gypsum does not limit sulphate solubility. However, under the arid conditions at Gamsberg, solute concentrations would be expected to be higher due to a lower water : rock ratio and evaporative concentration. Equilibrium conditions where sulphate concentration is controlled by gypsum are therefore considered more likely. Due to uncertainties in the WMB (2000) data it is not possible to calculate the saturation index for gypsum in the TSF model. An attempt was made to estimate the equilibrium concentration using the calculated sulphate concentration and an estimated calcium concentration based on the ratio of sulphate : calcium in the humidity cell tests. Figure 4.4. shows that the TSF leachate is initially undersaturated with gypsum, but then becomes slightly oversaturated. Precipitation of gypsum does result in a decrease in the predicted sulphate concentrations, but the order of magnitude of the predicted sulphate concentrations does not change.

ENVIRONMENTAL RESOURCES MANAGEMENT GAMSBERG GEOCHEMICAL STUDY
34
Figure 4.4 Equilibrium Sulphate Concentrations Compared to Concentrations Determined using Kinetic Data and Water:Solid Ratios
Modelling Limitations The following assumptions and limitations are noted in respect to the modelling of geochemical source terms above: • A geochemical model is a simplification of a complicated system to enable
prediction of behaviour of contaminants of concern. Models represent the modeller’s interpretation of the conceptual model, and are inexact and non-unique. While every effort is made to develop realistic source terms, it must be remembered that the source terms give an order of magnitude indication of the expected concentrations and should not be assumed to be exact. A model is an investment that can be improved over time by incorporation of site data as and when this becomes available, and can become a valuable aid to prediction of post-closure costs.
• The model for the Gamsberg TSF considers annual averages for rainfall
and evaporation. It does not account for low frequency flood episodes which may dissolve salts accumulated in the tailings and flush them to groundwater, resulting in a pulse of poor quality water to the aquifer.
• The sulphide oxidation and NP consumption rates will be verified on
receipt of results for humidity cell tests currently underway on pilot plant samples assessed in this current study. The rates currently used are extracted directly from the WMB (2000) report, and some discrepancies were noted between the reported rates, and rates calculated by ERM using the WMB data.

ENVIRONMENTAL RESOURCES MANAGEMENT GAMSBERG GEOCHEMICAL STUDY
35
• An empirical model uses the rates for oxidation and consumption of
neutralisation potential measured using humidity cell tests. These rates encompass a set of reactions occurring in the humidity cells, and may not be specific to one mineral. A deterministic model would use a laboratory determined reaction rate which is specific to one mineral, and not reflective of field conditions.
4.6 TSF MANAGEMENT IMPLICATIONS
This current geochemical study has identified the proposed Gamsberg TSF as a likely contamination source and provided geochemical source-term (chemical mass load) inputs for use as input to the groundwater model. The groundwater model will be used to calculate the risk of receptor exposure to contaminants via the groundwater pathway. It is appropriate to identify controls to manage or mitigate contamination risks only once source-pathway-receptor linkages are adequately understood. TSF management recommendations will therefore be made in the groundwater specialist report rather than this current study. The following general observations are however made in regard to limiting the rate and extent of ARD generation associated with oxidation of the tailings:
• Short deposition cycles should be followed by regularly covering fresh tailings soon after deposition, to prevent them drying out and oxidising on placement. Cladding the TSF side slopes with inert waste rock, concurrently with deposition, could help to minimise both oxygen ingress and side-slope erosion.
• Liming of the tailings in the flotation circuit prior to deposition would temporarily increase the tailings water pH to alkaline levels but would not prevent the formation of ARD or metal-rich leachate. Excessive amounts of neutralising material would be needed to offset acidity (approximately 0.7 tons of limestone per ton of concentrate) and the likelihood exists that it would dissolve and be flushed from the TSF prior to reaction with acidity. Furthermore, excessive liming of the tailings at this rate would represent an excessive reagent cost, would substantially increase the size of the TSF footprint and would result in wider environmental impacts associated with the extraction and transport of limestone from elsewhere.
• The tailings sample from this study contained 22% sulphur, almost all as sulphide. The option of adding an iron sulphide removal flotation circuit to the concentrator configuration was considered. The additional flotation circuit would generate two tailings streams, namely one stream consisting of 45% of current tailings volume at 40% sulphide, and another containing 55% of current tailings volume at 2% sulphide. Both tailings streams would be potentially acid-generating

ENVIRONMENTAL RESOURCES MANAGEMENT GAMSBERG GEOCHEMICAL STUDY
36
(and severely so in the case of the former stream) and would require management and containment of seepage water. The option of adding an iron removal flotation circuit therefore represented significant additional cost to the project at no clear environmental benefit.
• The Gamsberg tailings clearly have potential to generate nett acidity and elevated concentrations of SO4 and various metals within a relatively short timeframe (possibly 10 years) after placement. The groundwater study will assess the risk for these potential contaminants to reach and impact on (current and possible future) receptors via the groundwater pathway during the operation and closure phases of the TSF. In the event that this risk is unacceptably high then management controls would be required to reduce this risk to acceptable levels. This may include several of the controls listed above (and/or others) and possibly the installation of an engineered liner containment system on the TSF basal footprint. The groundwater specialist report will further discuss management controls to reduce groundwater impact from Gamsberg TSF.
4.7 ON-GOING TESTWORK
Kinetic test results for the final tailings sample were incomplete at the time of compiling this report. The humidity cell is to run for a minimum of 20 weeks, until June 2013, although earlier preliminary interpretation of results may be possible if it is observed that conditions of chemical equilibrium are approached. Depending on the similarity of the above results to the WMB kinetic test results (on which the geochemical modelling in this current study were based) it may be necessary to recalculate the geochemical source-terms as well as the groundwater model for the Gamsberg TSF system, in order to re-assess groundwater contamination risk to receptors. This is outside of ERM’s current scope of work.
ENVIRONMENTAL RESOURCES MANAGEMENT GAMSBERG GEOCHEMICAL STUDY
37
5 GAMS IRON FORMATION (GIF) GEOCHEMISTRY
This section presents geochemical results received for GIF samples collected in this study, as well as kinetic test results for GIF samples collected and analysed by WMB in 2000. GIF B Member materials comprise the target ore package. Proportions of GIF A and C Member rocks may report to the waste rock dump and/or to low grade ore stockpiles (and therefore also to the mine tailings) depending on the prevailing mining plan. It was therefore decided to present the GIF results independently of those for Pella and Koeris Formation waste rocks.
5.1 SAMPLE COMPOSITION
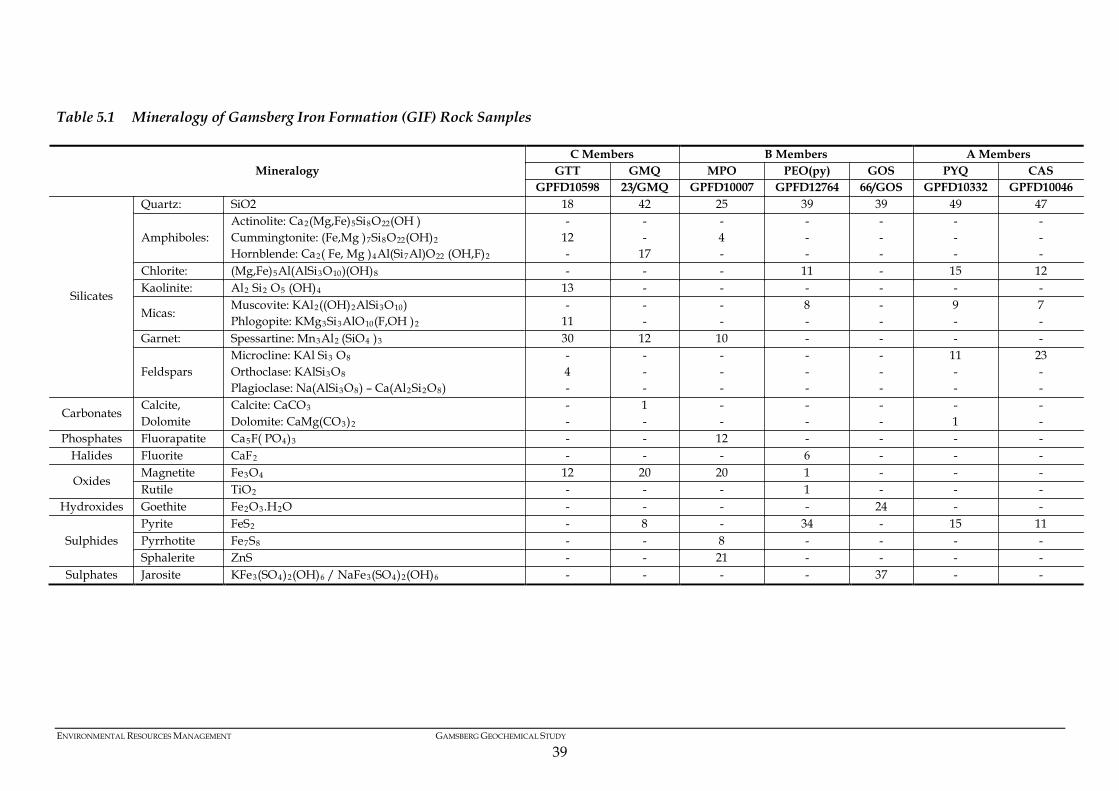
Table 5.1 shows the mineralogical composition of selected GIF samples collected and analysed in this current study. Quartz is the dominant mineral in each rock type except for garnetite (GTT) in which garnet (spessartine) is dominant. Additional silicate minerals within the GIF include feldspars and chlorite (both primarily in A Member rocks), amphibole group minerals (predominantly in C Member rocks), mica group minerals and kaolinite. Sulphides are relatively prevalent in pyritic quartzite (PYQ) then increase sharply in quantity within the pyrite and pyrrhotite ore zones. Previous ore characterisation studies have indicated that pyrite forms the bulk of the sulphide in the lower stratigraphic units of the GIF Formation (i.e. in the pyritic quartzite and the pyrite ore zone) then gradually decreases in abundance towards the top of the pyrrhotite ore zone. The distribution of pyrrhotite is the inverse that of pyrite. Gamsberg ore studies conducted by the O’kiep Copper Company (OCC) indicated that sphalerite increases systematically in abundance from the base of the pyrite ore zone to the top of the pyrrhotite zone, with the highest concentration invariably occurring at the base of the magnetite zone. The results presented in Table 7.1 are generally consistent with these trends. As could be expected, magnetite was abundant in the magnetite ore zone as well as in C Member rocks. This is consistent with the presence of an oxide facies overlying a sulphide facies within the GIF Formation. The contact between the sulphide ore and oxide ore is sharp or gradational over relatively short vertical distances of less than five metres (Anglo American plc, 2000). The gossan/sulphide interface occurs as a thin transitional zone (3 to 4 m thick) at an approximately constant elevation of 1 015 mamsl throughout the Gamsberg basin. Two types of gossan are present, a massive jaspilitic variety and a cellular spongy variety. Mineralogically the gossan consists of

ENVIRONMENTAL RESOURCES MANAGEMENT GAMSBERG GEOCHEMICAL STUDY
38
secondary limonite, goethitic and hematitic jasper as well as kaolinised feldspar, garnet, silicified amphibole, ferruginous micas and major quartz with accessory rutile, tourmaline and sillimanite. Table 5.2 presents the elemental composition of selected samples of GIF rock types in relation to the average crustal abundance of elements in the earth’s crust (Smith and Huyck, 1999). Solid concentrations that exceeded the average crustal value by a factor of 5 times or more are highlighted in bold red italics, whilst some elements that routinely occurred at concentrations less than 5x average crustal abundance in all samples are not shown in Table 5.2. Elements that were enriched in all / nearly all of the samples relative to their average crustal abundance included Pb, Zn, As, Cd and Mn. Certain GIF rock samples were also relatively enriched in Ag, Be, Bi, Fe (in GIF B and C Members), and U (in GIF C Member rocks and MPO magnetite ore). The following explanations are provided for the occurrence of various elements in the Gamsberg GIF, based on the results from this current study as well as from previous Gamsberg ore testwork programmes:
• Pb is likely associated with the presence of galena in course-grained healed fractures. Ag also commonly occurs within the galena lattice. Galena was not specifically detected in the XRD analysis of any of the GIF samples in this study as it may occur in quantities below detection.
• Cd is known to substitute for Zn in sphalerite, and Cu has been previously observed as fine exsolution blebs within massive sphalerite.
• As is likely to occur as arsenopyrite within the pyrite lattice or (to a lesser extent) to associate with sphalerite. Venter (1989) reported average As concentrations of 243 ppm within the Gamsberg ore. The arsenic is expected to report to the tailings.
• The distribution of Ca within the ore is probably related to fracture abundance and associated alteration.
• Mg distribution in the ore is probably related to silicates (especially amphibole and mica minerals), trace quantities of dolomite (in pyritic quartzite PYQ) and to chlorite associated with fractures.
• The trend in total S content is almost parallel to that of pyrite in that S increases upwards through the stratigraphy to a maximum (approximately 32%) in the pyrite zone, whereafter it decreases systematically towards the top of the pyrrhotite zone and base of the magnetite zone. The C Member rocks contain low quantities of total S.
The concentration of an element in the solid phase represents the total amount of that element which could potentially mobilise into solution.
ENVIRONMENTAL RESOURCES MANAGEMENT GAMSBERG GEOCHEMICAL STUDY
39
Table 5.1 Mineralogy of Gamsberg Iron Formation (GIF) Rock Samples
Mineralogy C Members B Members A Members
GTT GMQ MPO PEO(py) GOS PYQ CAS GPFD10598 23/GMQ GPFD10007 GPFD12764 66/GOS GPFD10332 GPFD10046
Silicates
Quartz: SiO2 18 42 25 39 39 49 47
Amphiboles: Actinolite: Ca2(Mg,Fe)5Si8O22(OH ) Cummingtonite: (Fe,Mg )7Si8O22(OH)2 Hornblende: Ca2( Fe, Mg )4Al(Si7Al)O22 (OH,F)2
- 12 -
- -
17
- 4 -
- - -
- - -
- - -
- - -
Chlorite: (Mg,Fe)5Al(AlSi3O10)(OH)8 - - - 11 - 15 12 Kaolinite: Al2 Si2 O5 (OH)4 13 - - - - - -
Micas: Muscovite: KAl2((OH)2AlSi3O10) Phlogopite: KMg3Si3AlO10(F,OH )2
- 11
- -
- -
8 -
- -
9 -
7 -
Garnet: Spessartine: Mn3Al2 (SiO4 )3 30 12 10 - - - -
Feldspars Microcline: KAl Si3 O8 Orthoclase: KAlSi3O8 Plagioclase: Na(AlSi3O8) – Ca(Al2Si2O8)
- 4 -
- - -
- - -
- - -
- - -
11 - -
23 - -
Carbonates Calcite, Dolomite
Calcite: CaCO3 Dolomite: CaMg(CO3)2
- -
1 -
- -
- -
- -
- 1
- -
Phosphates Fluorapatite Ca5F( PO4)3 - - 12 - - - - Halides Fluorite CaF2 - - - 6 - - -
Oxides Magnetite Fe3O4 12 20 20 1 - - - Rutile TiO2 - - - 1 - - -
Hydroxides Goethite Fe2O3.H2O - - - - 24 - -
Sulphides Pyrite FeS2 - 8 - 34 - 15 11 Pyrrhotite Fe7S8 - - 8 - - - - Sphalerite ZnS - - 21 - - - -
Sulphates Jarosite KFe3(SO4)2(OH)6 / NaFe3(SO4)2(OH)6 - - - - 37 - -

ENVIRONMENTAL RESOURCES MANAGEMENT GAMSBERG GEOCHEMICAL STUDY
40
Table 5.2 Elemental Composition of Gamsberg Iron Formation (GIF) Rock Samples
Elements which occurred at levels ≥ 5x their average crustal abundance appear in red bold font.
GIF Members
Parameter Pb S Ca Fe K Mg Na Al Ti Zn Ag As Be Bi Cd Mn P U
Units % % % % % % % % % % mg/kg mg/kg mg/kg mg/kg mg/kg mg/kg mg/kg mg/kg
Crustal abundance 0.0016 N/A 3 5 2.6 2.1 2.4 8 0.5 0.007 0.07 2 3 0.2 0.18 900 N/A 3
C Members
GTT
GPFD09999 0.07 0.03 5.0 21 0.01 0.8 0.05 1 0.1 0.5 0 94 3 8 8 98 300 2 450 40
GPFD10374 0.09 0.03 8.0 20 0.12 1.2 0.02 2 0.1 0.4 1 31 2 0.2 6 78 400 2 370 1
GPFD10598 0.03 0.05 3.1 11 0.53 0.6 0.05 4 0.3 0.2 0.3 189 2 6 4 >100 000 1 780 5
GPFD14454/8 0.03 0.2 2.6 10 0.55 0.7 0.05 5 0.3 0.3 0.3 51 3 5 5 >100 000 1 380 10
GMQ 09/GMQ 0.03 0.02 9.3 17 0.01 1.8 0.09 2 0.1 0.5 0.1 107 2 0.1 10 >100 000 2 250 2
23/GMQ 0.16 5 0.8 22 0.05 1.0 0.01 2 0.1 2.0 1 157 7 0.1 35 41 400 1 110 2
AMQ GPFD14452 0.08 0.4 0.6 26 0.04 0.5 0.005 2 0.1 0.9 0.3 25 7 7 12 81 700 1 340 10
GAP GPFD10003 0.37 3 0.8 27 0.01 0.7 0.005 2 0.1 3.3 1 358 5 4 61 51 800 1 400 20
B Members
MPO
09/MPO 0.16 6 0.9 26 0.01 0.8 0.01 2 0.1 2.2 1 356 8 0.04 42 42 200 1 400 1
GPFD10007 0.26 10 1.5 24 0.01 0.5 0.01 2 0.1 9.3 0.3 271 45 6 81 48 200 480 20
GPFD10127 0.16 6 0.9 26 0.01 0.8 0.01 2 0.1 2.2 1 356 8 0.04 42 42 200 1 400 1
GPFD10308 0.54 11 3.1 19 0.03 0.4 0.005 2 0.1 10.9 4 425 52 7 135 41 700 8 340 5
GPFD10379 0.89 14 2.3 15 0.04 0.5 0.01 2 0.1 12.4 4 372 52 0.2 147 44 300 2 750 1
GPFD10605 1.71 4 0.7 23 0.01 0.6 0.005 1 0.1 2.0 3 749 7 10 34 41 100 1 600 5
GPFD14448 1.25 14 2.1 18 0.01 0.2 0.005 2 0.1 13.5 4 232 68 5 151 54 800 4 450 5
MMG GPFD10601 0.001 0.3 0.8 27 0.07 0.4 0.01 1 0.1 0.4 0.3 243 19 1 3 35 400 2 500 5
PEO po
52/PEO 0.20 23 0.2 26 1.20 0.4 0 3 0.00 7.1 4 130 3 1 148 7 700 3 640 5
GPFD10017 0.14 17 0.5 19 1.45 0.5 0.02 4 0.1 8.1 2 73 12 1 147 9 450 <10 5
GPFD10032 0.22 22 0.2 17 1.42 0.5 0.005 3 0.1 8.0 3 380 3 4 115 5 390 870 5
GPFD10133 0.19 24 0.7 20 0.94 0.4 0.01 3 0.1 12.1 4 157 26 0.1 231 12 500 <10 2
GPFD10149 0.07 30 0.1 23 1.06 0.4 0.01 3 0.0 4.9 2 393 2 0.3 61 3 950 <10 2
GPFD10312 1.12 17 0.8 15 1.00 0.5 0.01 3 0.1 10.7 12 130 20 7 213 10 750 3 590 5
GPFD10325 0.15 28 0.2 22 1.17 0.4 0.01 3 0.1 4.8 3 454 3 8 63 4 050 500 5
GPFD10383 1.53 18 0.2 21 1.36 0.4 0.01 4 0.0 6.1 20 422 3 1 96 6 780 <10 3
GPFD10387 0.91 28 0.2 23 1.01 0.3 0.01 3 0.0 6.4 8 303 3 2 113 5 080 <10 2
GPFD10609 0.08 20 0.3 22 1.13 0.4 0.01 3 0.1 8.0 2 150 16 6 148 8 780 <10 5
GPFD10623 0.07 27 0.1 20 1.10 0.3 0.01 2 0.0 4.5 2 437 2 6 33 3 600 <10 5
GPFD13602 0.55 19 0.0 15 0.07 0.0 0.02 0.2 0.1 0.9 4 308 0 1 17 511 <10 5
GPFD14424/5 0.22 26 0.2 20 0.58 0.1 0.005 3 0.0 8.4 2 283 4 3 118 9 070 <10 5
GOS 66/GOS 0.11 1 0.0 30 0.33 0.0 0.03 0.3 0.2 0.1 11 465 1 1 1 184 160 5
PEO py
GPFD12764 0.04 28 0.4 23 1.28 0.4 0.01 3 0.1 2.8 3 433 2 1 19 3 750 940 5
GPFD13618 0.16 27 0.0 16 1.35 0.4 0.06 3 0.1 6.8 1 241 3 1 92 3 550 <10 5
GPFD14202 0.73 32 0.0 22 0.67 0.0 0.005 3 0.0 6.9 4 314 2 4 106 342 <10 5

ENVIRONMENTAL RESOURCES MANAGEMENT GAMSBERG GEOCHEMICAL STUDY
41
GIF Members
Parameter Pb S Ca Fe K Mg Na Al Ti Zn Ag As Be Bi Cd Mn P U
Units % % % % % % % % % % mg/kg mg/kg mg/kg mg/kg mg/kg mg/kg mg/kg mg/kg
Crustal abundance 0.0016 N/A 3 5 2.6 2.1 2.4 8 0.5 0.007 0.07 2 3 0.2 0.18 900 N/A 3
GPFD14238 2.25 31 0.1 24 0.90 0.2 0.005 2 0.0 6.2 13 423 2 5 90 4 080 510 5
GPFD14411 0.16 30 0.1 28 0.26 0.1 0.005 3 0.0 6.1 1 288 5 1 106 2 420 <10 5
PEL GPFD10155 0.30 9 0.2 12 1.50 0.9 0 5 0.2 0.7 4 142 3 1 10 9 920 320 4
A Members
PYQ GPFD10332 0.26 11 0.4 12 2.57 0.8 0.1 6 0.1 0.6 4 562 5 1 3 4 370 730 5
GPFD10628 0.07 8 0.7 10 2.47 0.7 0.02 5 0.2 0.3 3 103 3 1 5 8 240 610 5
CAS
09/CAS 0.12 1 3.8 6 1.52 0.9 0.03 5 0.3 0.5 2 535 2 2 1 22 800 620 3
GPFD10046 0.09 6 4.0 6 2.34 1.0 0.05 5 0.4 0.1 2 90 3 1 3 50 300 1 200 10
GPFD10394 0.06 5 9.7 7 0.01 0.9 0.01 6 0.2 0.1 2 62 51 2 3 >100 000 1 020 2
GPFD10630 0.08 0.2 4.5 6 1.53 0.9 0.05 5 0.4 0.1 0.3 110 2 2 1 22 000 1 160 5
GPFD12771 0.04 4 2.0 5 3.24 0.8 0.06 6 0.2 0.1 0.3 30 3 1 3 9 790 910 5
GPFD13664 0.07 6 2.8 10 2.15 1.4 0.04 7 0.3 1.3 2 213 15 5 15 12 000 190 5
GPFD14516 0.01 4 3.3 5 2.51 1.3 0.01 6 0.4 0.1 0.3 80 3 1 1 50 700 1 490 5

ENVIRONMENTAL RESOURCES MANAGEMENT GAMSBERG MINE ESIA & EMP
42
5.2 SAMPLE REPRESENTIVITY
Figure 5.1 and Figure 5.2 show box-and-whisker plots which compare, the total sulphur and sulphide-sulphur contents of GIF samples tested in this study against the same for GIF samples captured in the exploration database maintained by Black Mountain Mine. The total sulphur and sulphide-sulphur content of samples collected in the current study generally fell within the interquartile range of the larger exploration database sample population. It is therefore reasonable to assume that the acid generation potential of the majority of samples collected in this study reasonably reflects the variation in the acid potential of the individual rock materials spatially and with depth within the open pit footprint.
5.3 ACID GENERATION POTENTIAL
Table 5.3 presents results from ABA and NAG testing of GIF A, B and C Member rock samples tested in this current study. The NAG results differ from those of the ABA test in that the NAG test involves simultaneous reaction of all acid generating and acid neutralising components in the sample under conditions of total oxidation. The final column in Table 5.3 provides an assessment of the likely potential of each material sample to generate ARD considering the ARD screening criteria described in Section 3.3.4. Figure 5.3 and Figure 5.4 show the NP versus AP of individual samples of GIF B and GIF A and C Member samples respectively, based on their sulphide-sulphur content (i.e. the Modified Sobek ABA method). Samples with NPR > 2 are considered non acid-generating, those with an NPR of 1 to 2 are considered to have an uncertain acid-generation potential, and an NPR < 1 suggests the sample will be potentially acid-generating (MEND, 2009). Figure 5.3 indicates that, on the basis of NPR, the GIF B lithologies which would likely generate nett acidity on oxidation through exposure include pyroxenite-amphibole-garnet-magnetite hosted ore (MPO), pelite-hosted ore with either pyrite or pyrrhotite dominant (PEOpy, PEOpo) and meta-pelite rock (PEL). Neither massive magnetite (MMG) nor gossan (GOS) would likely generate nett acidity because the former occurs as an iron oxide, whilst the XRD results shows that sulphides originally present in gossan parent material have weathered to sulphate (jarosite) or hydroxide (goethite). Figure 5.4 shows that, on the basis of NPR, samples of pyritic quartzite (PYQ), garnet-magnetite-quartz (GMQ) and garnet-amphibole-pyroxenoid quartz (GAP) could be expected to generate nett acidity on exposure through mining. Garnetite (GTT) is unlikely to generate ARD on exposure, whilst the potential for garnet-magnetite quartz (GMQ) to generate nett acidity is related to the sulphide content of the individual sample. Guidance from the various screening criteria indicates that GIF materials that show a likelihood of generating ARD include GAP, MPO, PEOpo, PEOpy, PEL and PYQ. GMQ and CAS samples show variable potential to generate

ENVIRONMENTAL RESOURCES MANAGEMENT GAMSBERG MINE ESIA & EMP
43
nett acidity based on variation in their content of metal sulphide and neutralising minerals. GTT, MMG and GOS are each associated with negligible ARD potential due to low sulphide content and (in the case of GTT and MMG) some excess NP. On the basis of the various ARD screening criteria it is identified. It is important to note that a limitation of the ABA and NAG tests is the fact that they do not take account of mineral reaction kinetics or site-specific environment conditions. They are thus purely indicative of the potential for a system to generate acidity and the potential for neutralising minerals to offset any generated acidity. A kinetic test program provides an assessment of the long-term ARD and metal leaching behavior of the materials based on reaction kinetics as simulated under laboratory conditions.
5.4 METAL / SALT LEACHING POTENTIAL
Figure 5.5 shows the pH and sulphate concentration of distilled water and peroxide leachate solutions derived from GIF A, B and C Member samples respectively. Many of the leachate samples had acidic pH values and elevated sulphate concentrations. Table 5.4 shows the concentrations of metal constituents that exceeded Acceptable Environmental Risk (AER) levels in distilled water leachates and/or hydrogen peroxide extracts from one or more of the GIF samples. This includes a composite sample consisting of GIF A and C Member rocks at a 1:1 weight ratio, reflecting the likely composition of hanging wall and footwall GIF that could feasibly report to a low grade ore stockpile and/or the waste rock dump. Metals which exceeded AER values in one or more leachate / extract included Al, Cd, Cu, Fe, Mn, Pb, Sb and Zn. Under leaching conditions similar to these two respective laboratory tests, the mobilisation of these metals into solution could result in adverse effect on the aquatic environment (DWAF, 1998).

ENVIRONMENTAL RESOURCES MANAGEMENT GAMSBERG MINE ESIA & EMP
44
Figure 5.1 Total Sulphur and Sulphide-sulphur Content in GIF A and C Member Samples: Current Study versus Exploration Database
Note: X-axis labels show the rock type, the source of information (ERM samples versus exploration database) and the number of samples represented. Blue and pink boxes represent 25% and 75% interquartile ranges about the median (centre line). Whiskers represent 1.5x the interquartile range. Crosses show minimum (purple) and maximum (red) outliers. Green dots indicate values when only a single sample was analysed per material.
a) Total Sulphur
b) Sulphide-Sulphur
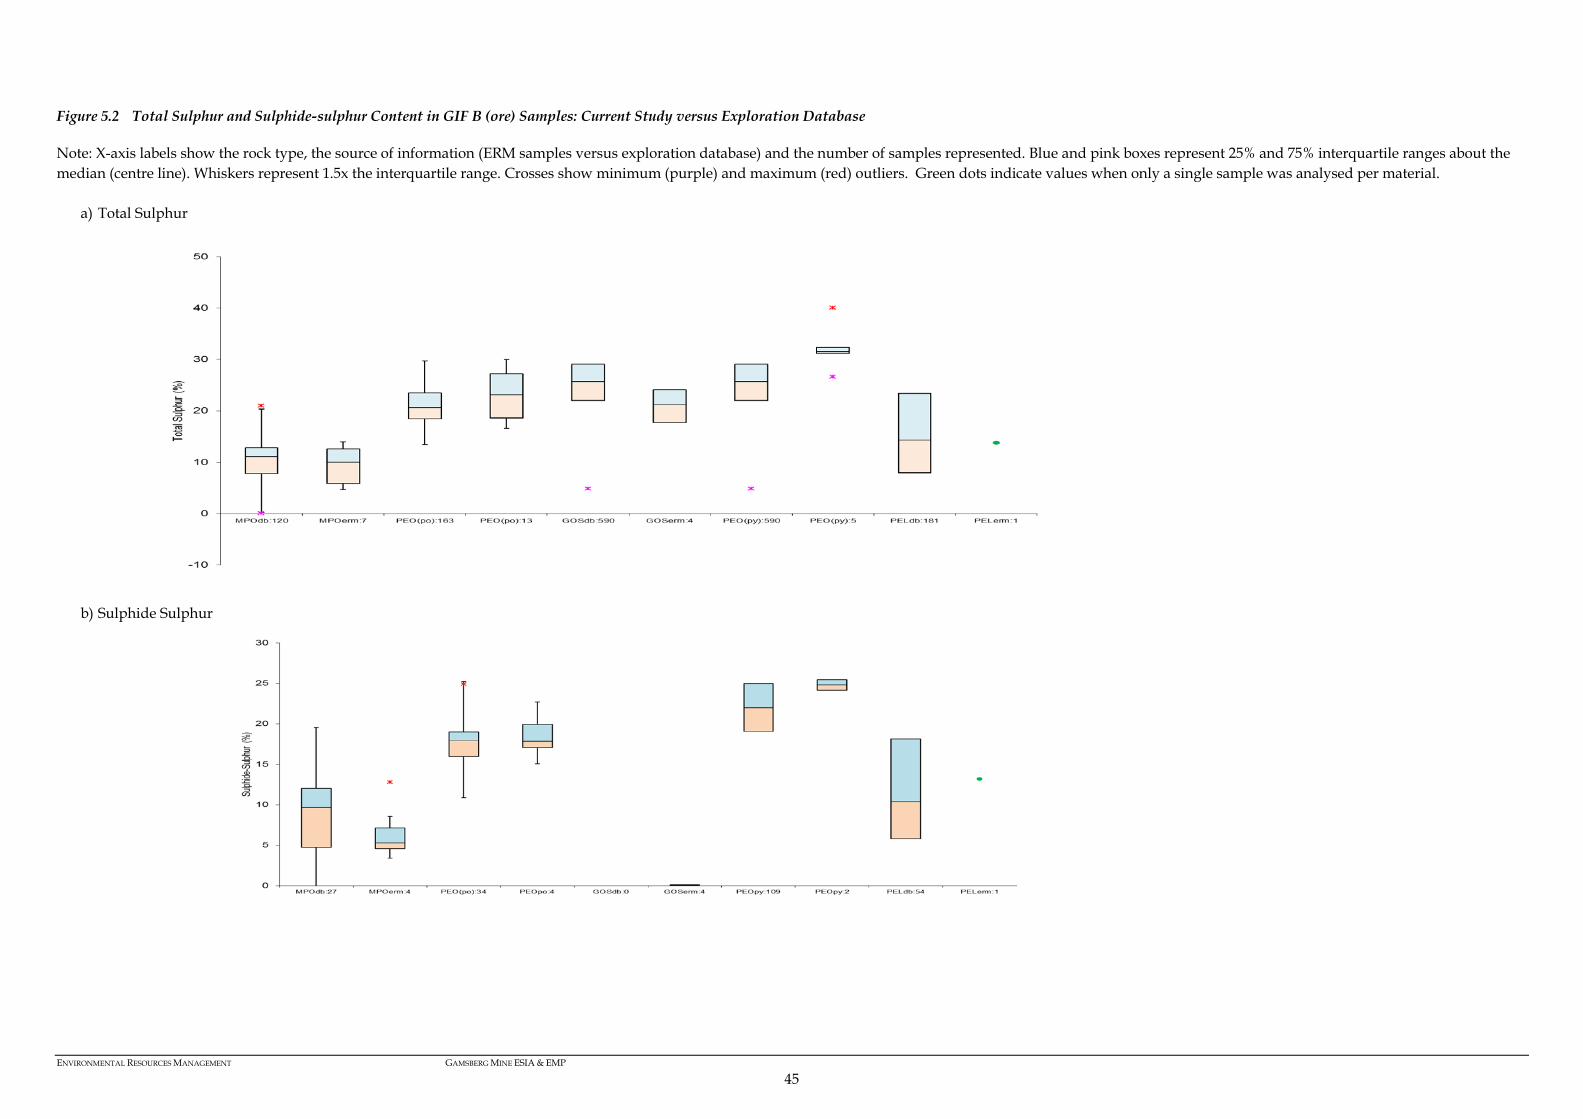
ENVIRONMENTAL RESOURCES MANAGEMENT GAMSBERG MINE ESIA & EMP
45
Figure 5.2 Total Sulphur and Sulphide-sulphur Content in GIF B (ore) Samples: Current Study versus Exploration Database
Note: X-axis labels show the rock type, the source of information (ERM samples versus exploration database) and the number of samples represented. Blue and pink boxes represent 25% and 75% interquartile ranges about the median (centre line). Whiskers represent 1.5x the interquartile range. Crosses show minimum (purple) and maximum (red) outliers. Green dots indicate values when only a single sample was analysed per material.
a) Total Sulphur
b) Sulphide Sulphur
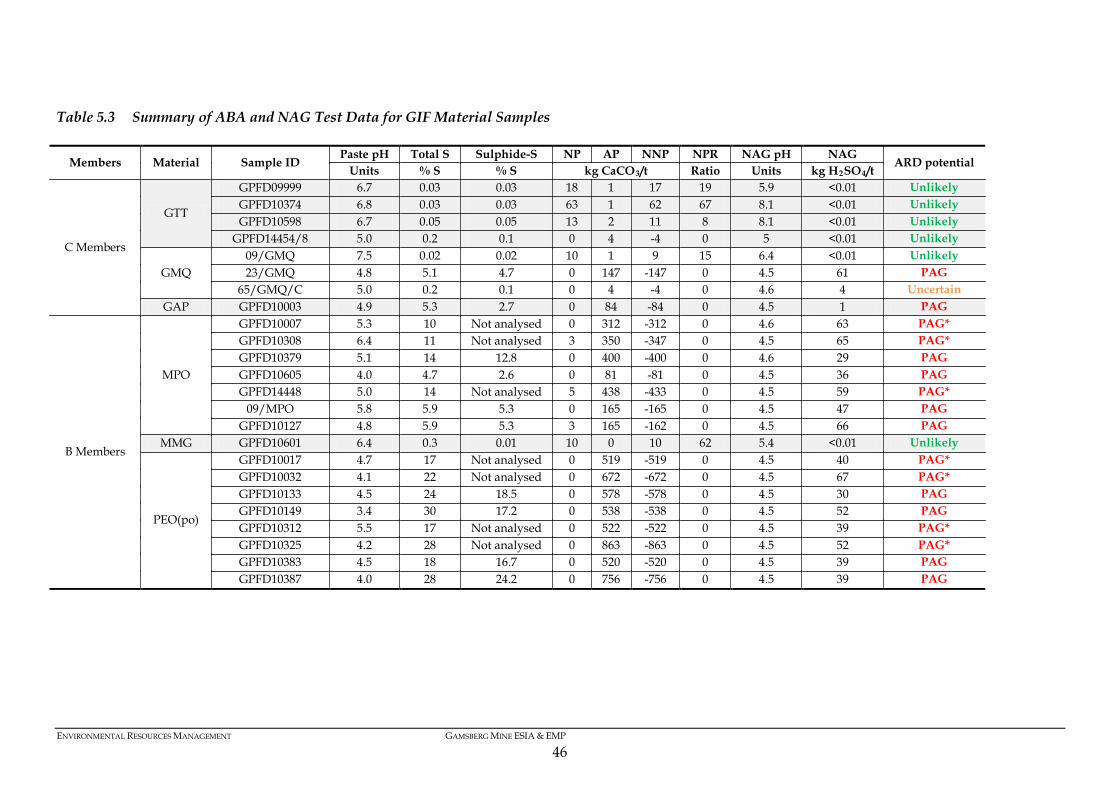
ENVIRONMENTAL RESOURCES MANAGEMENT GAMSBERG MINE ESIA & EMP
46
Table 5.3 Summary of ABA and NAG Test Data for GIF Material Samples
Members Material Sample ID Paste pH Total S Sulphide-S NP AP NNP NPR NAG pH NAG
ARD potential Units % S % S kg CaCO3/t Ratio Units kg H2SO4/t
C Members
GTT
GPFD09999 6.7 0.03 0.03 18 1 17 19 5.9 <0.01 Unlikely GPFD10374 6.8 0.03 0.03 63 1 62 67 8.1 <0.01 Unlikely GPFD10598 6.7 0.05 0.05 13 2 11 8 8.1 <0.01 Unlikely
GPFD14454/8 5.0 0.2 0.1 0 4 -4 0 5 <0.01 Unlikely
GMQ 09/GMQ 7.5 0.02 0.02 10 1 9 15 6.4 <0.01 Unlikely 23/GMQ 4.8 5.1 4.7 0 147 -147 0 4.5 61 PAG
65/GMQ/C 5.0 0.2 0.1 0 4 -4 0 4.6 4 Uncertain GAP GPFD10003 4.9 5.3 2.7 0 84 -84 0 4.5 1 PAG
B Members
MPO
GPFD10007 5.3 10 Not analysed 0 312 -312 0 4.6 63 PAG* GPFD10308 6.4 11 Not analysed 3 350 -347 0 4.5 65 PAG* GPFD10379 5.1 14 12.8 0 400 -400 0 4.6 29 PAG GPFD10605 4.0 4.7 2.6 0 81 -81 0 4.5 36 PAG GPFD14448 5.0 14 Not analysed 5 438 -433 0 4.5 59 PAG*
09/MPO 5.8 5.9 5.3 0 165 -165 0 4.5 47 PAG GPFD10127 4.8 5.9 5.3 3 165 -162 0 4.5 66 PAG
MMG GPFD10601 6.4 0.3 0.01 10 0 10 62 5.4 <0.01 Unlikely
PEO(po)
GPFD10017 4.7 17 Not analysed 0 519 -519 0 4.5 40 PAG* GPFD10032 4.1 22 Not analysed 0 672 -672 0 4.5 67 PAG* GPFD10133 4.5 24 18.5 0 578 -578 0 4.5 30 PAG GPFD10149 3.4 30 17.2 0 538 -538 0 4.5 52 PAG GPFD10312 5.5 17 Not analysed 0 522 -522 0 4.5 39 PAG* GPFD10325 4.2 28 Not analysed 0 863 -863 0 4.5 52 PAG* GPFD10383 4.5 18 16.7 0 520 -520 0 4.5 39 PAG GPFD10387 4.0 28 24.2 0 756 -756 0 4.5 39 PAG
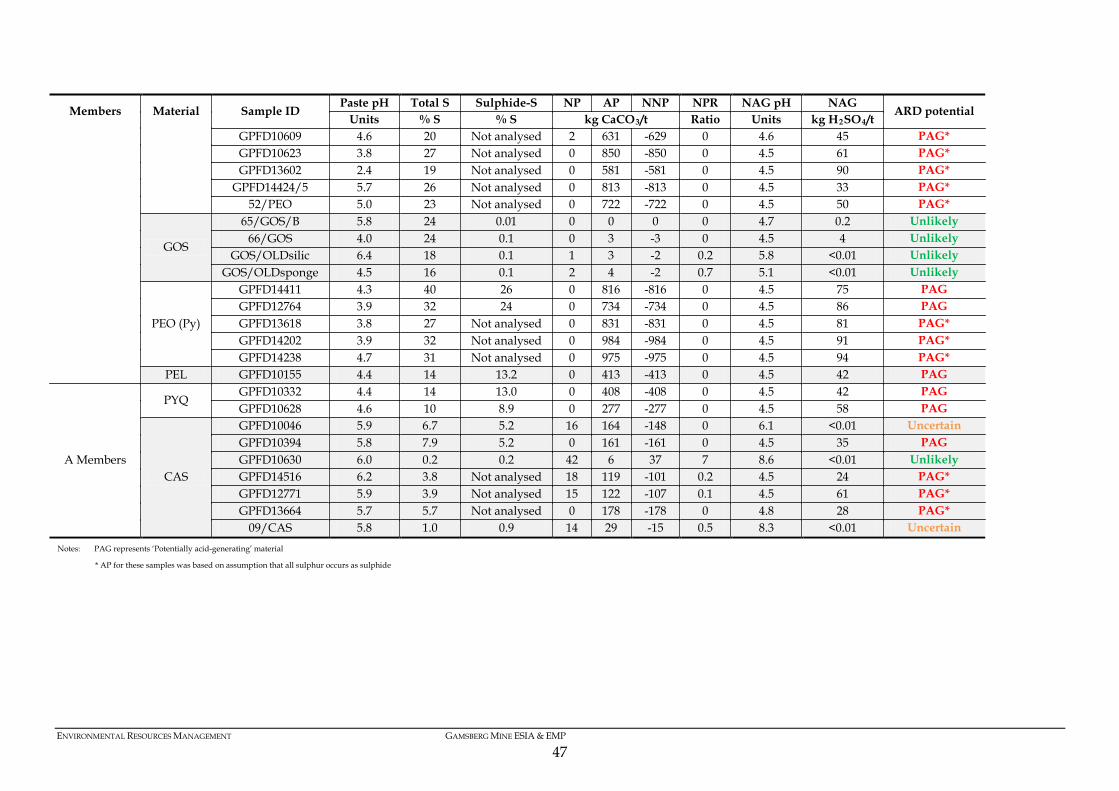
ENVIRONMENTAL RESOURCES MANAGEMENT GAMSBERG MINE ESIA & EMP
47
Members Material Sample ID Paste pH Total S Sulphide-S NP AP NNP NPR NAG pH NAG
ARD potential Units % S % S kg CaCO3/t Ratio Units kg H2SO4/t
GPFD10609 4.6 20 Not analysed 2 631 -629 0 4.6 45 PAG* GPFD10623 3.8 27 Not analysed 0 850 -850 0 4.5 61 PAG* GPFD13602 2.4 19 Not analysed 0 581 -581 0 4.5 90 PAG*
GPFD14424/5 5.7 26 Not analysed 0 813 -813 0 4.5 33 PAG* 52/PEO 5.0 23 Not analysed 0 722 -722 0 4.5 50 PAG*
GOS
65/GOS/B 5.8 24 0.01 0 0 0 0 4.7 0.2 Unlikely 66/GOS 4.0 24 0.1 0 3 -3 0 4.5 4 Unlikely
GOS/OLDsilic 6.4 18 0.1 1 3 -2 0.2 5.8 <0.01 Unlikely GOS/OLDsponge 4.5 16 0.1 2 4 -2 0.7 5.1 <0.01 Unlikely
PEO (Py)
GPFD14411 4.3 40 26 0 816 -816 0 4.5 75 PAG GPFD12764 3.9 32 24 0 734 -734 0 4.5 86 PAG GPFD13618 3.8 27 Not analysed 0 831 -831 0 4.5 81 PAG* GPFD14202 3.9 32 Not analysed 0 984 -984 0 4.5 91 PAG* GPFD14238 4.7 31 Not analysed 0 975 -975 0 4.5 94 PAG*
PEL GPFD10155 4.4 14 13.2 0 413 -413 0 4.5 42 PAG
A Members
PYQ GPFD10332 4.4 14 13.0 0 408 -408 0 4.5 42 PAG GPFD10628 4.6 10 8.9 0 277 -277 0 4.5 58 PAG
CAS
GPFD10046 5.9 6.7 5.2 16 164 -148 0 6.1 <0.01 Uncertain GPFD10394 5.8 7.9 5.2 0 161 -161 0 4.5 35 PAG GPFD10630 6.0 0.2 0.2 42 6 37 7 8.6 <0.01 Unlikely GPFD14516 6.2 3.8 Not analysed 18 119 -101 0.2 4.5 24 PAG* GPFD12771 5.9 3.9 Not analysed 15 122 -107 0.1 4.5 61 PAG* GPFD13664 5.7 5.7 Not analysed 0 178 -178 0 4.8 28 PAG*
09/CAS 5.8 1.0 0.9 14 29 -15 0.5 8.3 <0.01 Uncertain Notes: PAG represents ‘Potentially acid-generating’ material
* AP for these samples was based on assumption that all sulphur occurs as sulphide
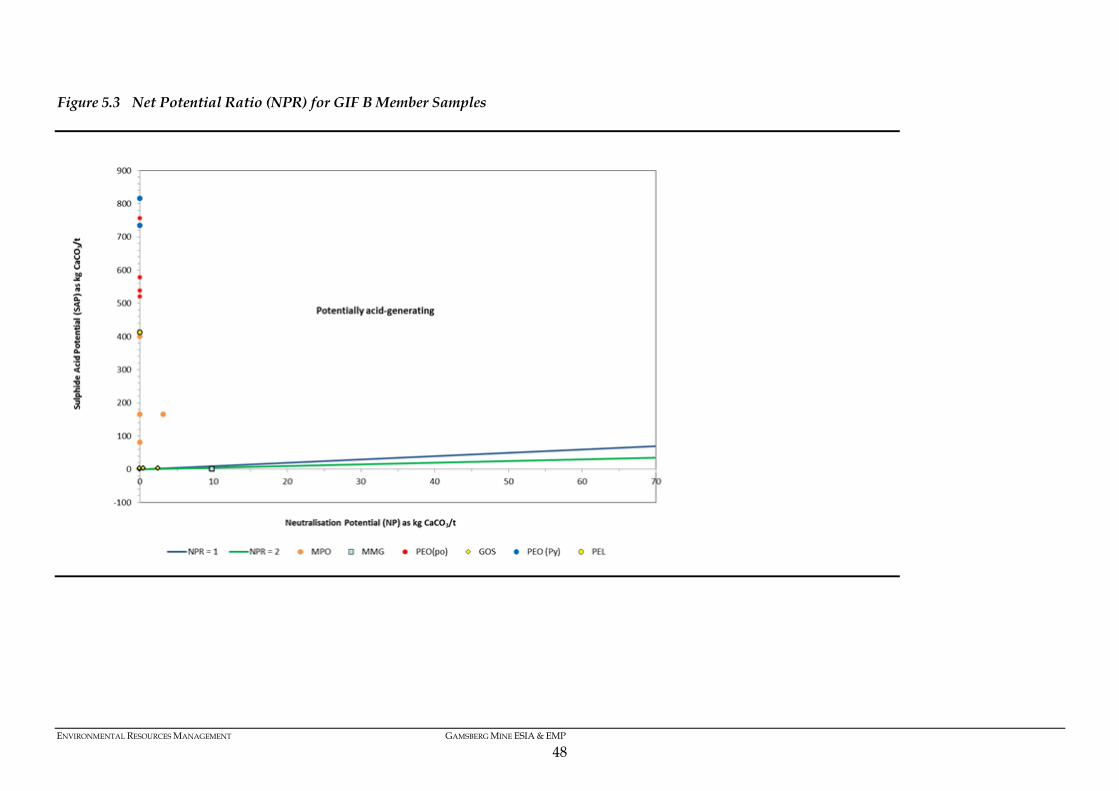
ENVIRONMENTAL RESOURCES MANAGEMENT GAMSBERG MINE ESIA & EMP
48
Figure 5.3 Net Potential Ratio (NPR) for GIF B Member Samples

ENVIRONMENTAL RESOURCES MANAGEMENT GAMSBERG MINE ESIA & EMP
49
Figure 5.4 Net Potential Ratio (NPR) for GIF A and C Member Samples
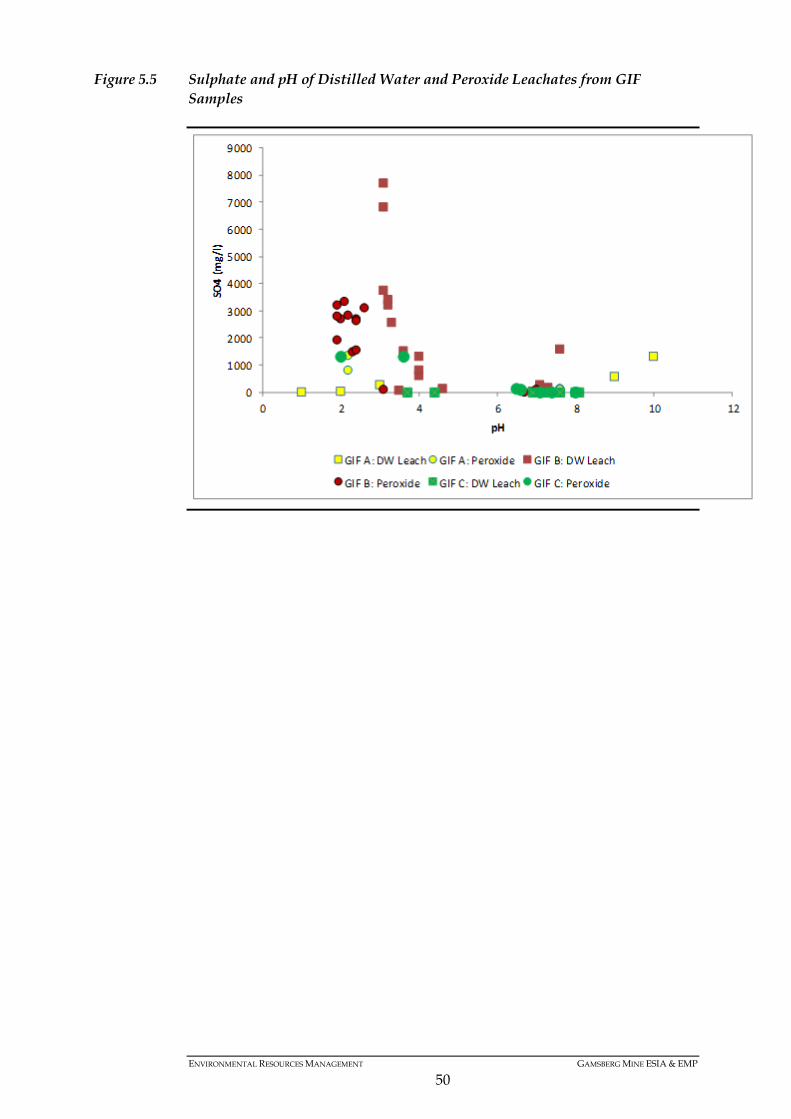
ENVIRONMENTAL RESOURCES MANAGEMENT GAMSBERG MINE ESIA & EMP
50
Figure 5.5 Sulphate and pH of Distilled Water and Peroxide Leachates from GIF Samples
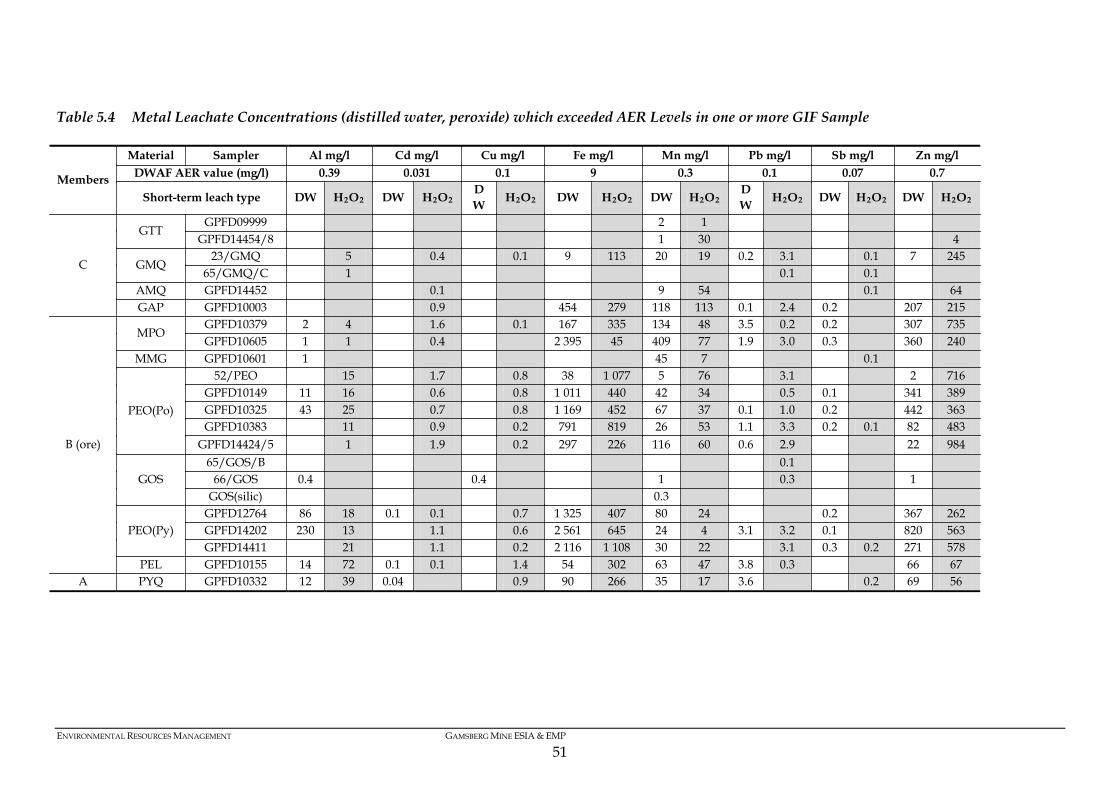
ENVIRONMENTAL RESOURCES MANAGEMENT GAMSBERG MINE ESIA & EMP
51
Table 5.4 Metal Leachate Concentrations (distilled water, peroxide) which exceeded AER Levels in one or more GIF Sample
Members
Material Sampler Al mg/l Cd mg/l Cu mg/l Fe mg/l Mn mg/l Pb mg/l Sb mg/l Zn mg/l DWAF AER value (mg/l) 0.39 0.031 0.1 9 0.3 0.1 0.07 0.7
Short-term leach type DW H2O2 DW H2O2 DW H2O2 DW H2O2 DW H2O2
DW H2O2 DW H2O2 DW H2O2
C
GTT GPFD09999
2 1
GPFD14454/8
1 30
4
GMQ 23/GMQ
5
0.4
0.1 9 113 20 19 0.2 3.1
0.1 7 245
65/GMQ/C
1
0.1
0.1
AMQ GPFD14452
0.1
9 54
0.1
64 GAP GPFD10003
0.9
454 279 118 113 0.1 2.4 0.2
207 215
B (ore)
MPO GPFD10379 2 4
1.6
0.1 167 335 134 48 3.5 0.2 0.2
307 735
GPFD10605 1 1
0.4
2 395 45 409 77 1.9 3.0 0.3
360 240 MMG GPFD10601 1
45 7
0.1
PEO(Po)
52/PEO
15
1.7
0.8 38 1 077 5 76
3.1
2 716 GPFD10149 11 16
0.6
0.8 1 011 440 42 34
0.5 0.1
341 389
GPFD10325 43 25
0.7
0.8 1 169 452 67 37 0.1 1.0 0.2
442 363 GPFD10383
11
0.9
0.2 791 819 26 53 1.1 3.3 0.2 0.1 82 483
GPFD14424/5
1
1.9
0.2 297 226 116 60 0.6 2.9
22 984
GOS 65/GOS/B
0.1
66/GOS 0.4
0.4
1
0.3
1
GOS(silic)
0.3
PEO(Py) GPFD12764 86 18 0.1 0.1
0.7 1 325 407 80 24
0.2
367 262
GPFD14202 230 13
1.1
0.6 2 561 645 24 4 3.1 3.2 0.1
820 563 GPFD14411
21
1.1
0.2 2 116 1 108 30 22
3.1 0.3 0.2 271 578
PEL GPFD10155 14 72 0.1 0.1
1.4 54 302 63 47 3.8 0.3
66 67 A PYQ GPFD10332 12 39 0.04
0.9 90 266 35 17 3.6
0.2 69 56
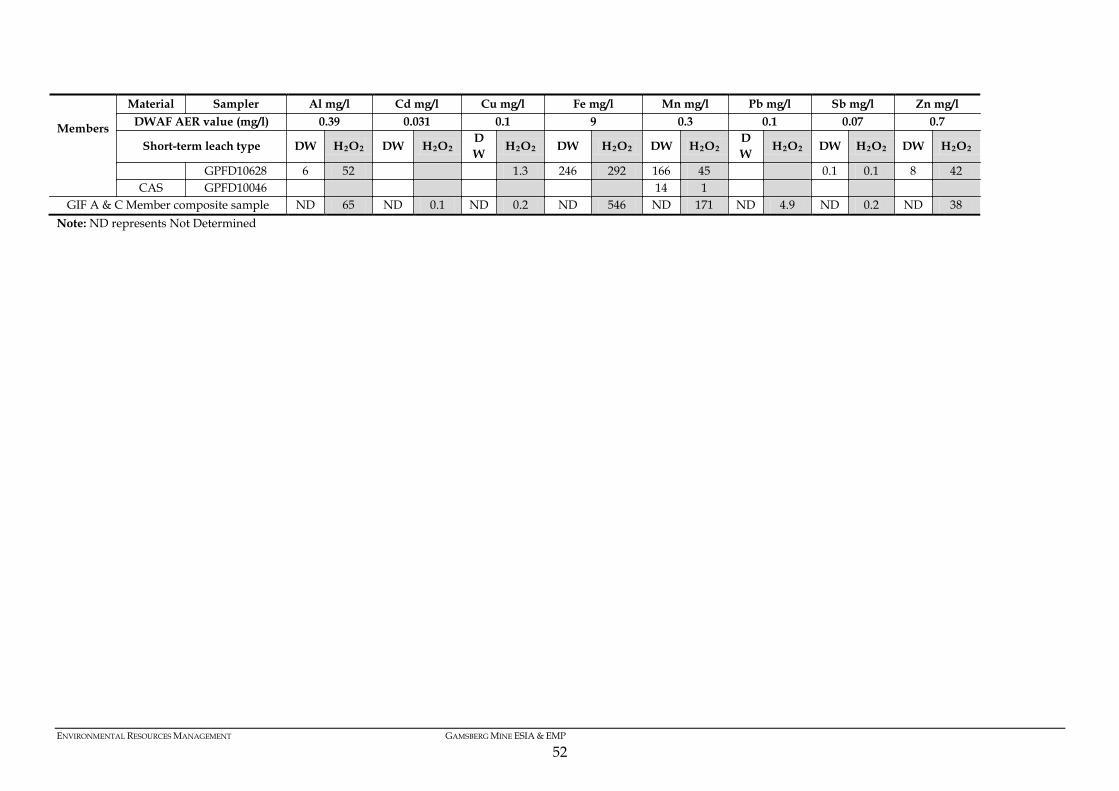
ENVIRONMENTAL RESOURCES MANAGEMENT GAMSBERG MINE ESIA & EMP
52
Members
Material Sampler Al mg/l Cd mg/l Cu mg/l Fe mg/l Mn mg/l Pb mg/l Sb mg/l Zn mg/l DWAF AER value (mg/l) 0.39 0.031 0.1 9 0.3 0.1 0.07 0.7
Short-term leach type DW H2O2 DW H2O2 DW H2O2 DW H2O2 DW H2O2
DW H2O2 DW H2O2 DW H2O2
GPFD10628 6 52
1.3 246 292 166 45
0.1 0.1 8 42 CAS GPFD10046
14 1
GIF A & C Member composite sample ND 65 ND 0.1 ND 0.2 ND 546 ND 171 ND 4.9 ND 0.2 ND 38
Note: ND represents Not Determined

ENVIRONMENTAL RESOURCES MANAGEMENT GAMSBERG MINE ESIA & EMP
53
5.5 KINETIC TEST RESULTS
Due to ESIA scheduling constraints, the static and kinetic test results for the composite sample of GIF A and C Member rocks (at an A:C Member ratio of 1:1) were not sufficiently advanced to add meaningfully to this report. The results of the kinetic test program for the GIF A&C Member composite sample assessed by WMB in 2000 (also at a 1:1 ratio of A:C) are discussed below ABA testing of the WMB composite GIF sample had indicated it had a high acid potential, at a nett AP of 216 kg CaCO3/t. Kinetic testing of the GIF composite sample indicated the pyrite/pyrrhotite oxidation rate would slightly exceed the neutralisation consumption rate. WMB calculated that leachate from the GIF assemblage on exposure would remain buffered at pH 4.5 for approximately 2 000 years (although this appears to have been a calculation error tenfold higher than the actual value i.e. approximately 200 years appears correct). Average SO4 concentrations of 80 mg/l were recorded during the kinetic test and metal concentrations were generally low (< 1mg/l).
5.6 MANAGEMENT OF GIF MATERIALS
The proposed mining activities would disturb and expose GIF to possible chemical reactions as described below.
5.6.1 GIF B Member Materials
GIF B Members comprise the ore package and would report to these facilities: • An in-pit stockpile for ore prior to primary crushing (1 ha footprint,
maximum height of 4 m); • One stockpile each of high grade, low grade and blended ore prior to
milling. Each of the three stockpiles would occupy a 1ha footprint within the plant area and reach a maximum height of 20 m;
• A zinc concentrate stockpile within the plant area. The stockpile would
hold 7 days of final production, occupy a footprint of 0.25 ha at maximum 12 m height, and would be stored under cover of roof; and
• GIF B Member rocks will be exposed to oxidation within the side slopes of
the open pit during the operational and closure phases. Blast fractures may also be present within GIF Formation lithologies which would allow for increased contact of these lithologies with oxygen and water, as well as increased contact time for reactions to occur.
The Gamsberg ore stockpiles represent potential sources of ARD and metal leaching if exposed to water flow pathways. Each of the stockpiles will however be of relatively small footprint and the risk of contamination to surface water and groundwater from these sources could be effectively
ENVIRONMENTAL RESOURCES MANAGEMENT GAMSBERG MINE ESIA & EMP
54
achieved through appropriate engineering design such as bunding, interception channels, silt traps and clean/dirty water containment structures. Engineered controls and operational practices should be in place to ensure that wind entrainment or spillage to the environment of zinc concentrate is minimised during transport and handling of the ore and final concentrate (both on the Gamsberg site and to the point of export to buyers). Pit design should incorporate engineered structures to minimise contact between side slope runoff and GIF A, B and C materials (particularly within benches established in the GIF) – both in terms of the quantity of water in contact with these lithologies and contact (reaction) time.
5.6.2 GIF A and C Member Materials
GIF A and C Member rocks may report to the following facilities in varying proportions depending on mine planning factors such as grade control, mineral recovery efficiencies and metal pricing:
• A proportion of the total mined volume of GIF A and C Member rocks would likely report to the waste rock dump. The management implications of GIF A and C Member rocks being present in the WRD are discussed in the waste rock section of this report.
• A proportion of GIF A and C Member rocks would likely report to ore stockpiles as gangue due to material separation inefficiencies during mining. GIF A and C material may also potentially be viewed as low grade ore during various periods of the operational phase. In either instance, the material would be processed through the concentrator plant and daylight in the TSF. Source control measures for ore and concentrate stockpiles were discussed in the previous subsection.
• GIF A and C Member rocks would be exposed to oxidation in the side walls of the open pit during operational and closure. Source control measures for pit side slopes were discussed in the previous subsection.
5.7 ON-GOING TESTWORK
At the time of writing this report kinetic testwork was ongoing on GIF samples, including one sample each of calc-silicate rock (CAS), pelite-hosted ore with pyrite dominant (PEOpy), pyroxenite-amphibole-garnet-magnetite hosted ore (MPO) and the GIF A&C Member composite sample. In the static test program these material samples had showed likely/uncertain potential to generate nett acidity and metal-rich leachate on exposure through mining. The humidity cells will run for a minimum of 20 weeks and are due for completion in June 2013, although preliminary interpretation of results may be possible before then if the cells approach chemical equilibrium.
ENVIRONMENTAL RESOURCES MANAGEMENT GAMSBERG MINE ESIA & EMP
55
6 WASTE ROCK GEOCHEMISTRY
6.1 SAMPLE COMPOSITION
Table 6.1 shows the mineralogical composition of selected samples of Koeris and Pella Quartzite materials that would represent hanging wall and footwall waste rock materials respectively. Amphibolite (AMP) comprised of silicate minerals only, of which 70% was amphibole minerals and 26% plagioclase feldspar. Quartz-muscovite-schist (MSS) was also composed purely of silicate minerals, whilst quartz-muscovite-biotite-schist (QMS) showed a similar composition to MSS but also contained 8% hematite. The sample of interbanded schist and quartzite (IQS) contained 2% pyrite, which could oxidise on exposure through mining activities. The Pella Quartzites comprised almost exclusively of quartz, with only minor muscovite (in white quartzite) and trace iron (white and dark quartzite).
6.2 ACID GENERATION POTENTIAL
Table 6.2 indicates that the majority of Koeris and Pella Quartzite samples would not be expected to generate nett acidity due to their low sulphide content. One sample of interbanded quartzite and schist (IQS) showed potential to generate nett acidity, whilst one sample of amphibole (AMP) showed an uncertain potential in this regard. The Koeris and Pella Quartzite waste rock materials show minimal neutralisation potential and therefore minimal potential to buffer acidity that might be generated by GIF A and C materials present within the WRD. ABA test results described by WMB (2000) indicated the Gamsberg waste rock composite sample that they generated would be nett acid-producing due to the sulphide content of the included C Member rocks. By contrast, their kinetic test results indicated that the sample generated a neutral (pH 6) leach with low SO4 (5 to 15 mg/l) and metal content, due to the rate of neutralisation exceeding that of oxidation. WMB characterised the sample as being essentially non acid-generating, but warned that this could be sensitive to the relative proportion of C Member rocks included in the WRD. Static and kinetic test results for the composite waste rock sample generated in this current study were pending at the time of compiling this report.

ENVIRONMENTAL RESOURCES MANAGEMENT GAMSBERG MINE ESIA & EMP
56
Table 6.1 Mineralogical Composition of Koeris and Pella Quartzite Waste Rock Materials
Mineralogy Koeris Formation (Hanging Wall) Pella Quartzite (Footwall)
AMP IQS MSS QMS DQZ WQZ 10/AMP GPFD14255 10/MSS GPFD10371 28/DQZ 28/WQZ
Silicates
Quartz SiO2 - 93 49 43 99.8 98.1 Talc Mg3(Si2O5)2(OH )2 1 - - 0.3 - -
Amphiboles Actinolite: Ca2(Mg,Fe)5Si8O22(OH )
Cummingtonite: (Fe,Mg )7Si8O22(OH)2 67 3
- - - - -
Chlorite (Mg,Fe)5Al(AlSi3O10)(OH)8 3 - 7 7 - - Kaolinite Al2 Si2 O5 (OH)4 - 2 - - - -
Micas Muscovite: KAl2((OH)2AlSi3O10) - 3 24 16 - 1.7
Feldspars Microcline: KAl Si3 O8
Plagioclase: Na(AlSi3O8) – Ca(Al2Si2O8) -
26 -
20 -
26 -
- -
Iron Iron alpha Fe - - - - 0.2 0.2 Oxides Hematite Fe2O3 - - - 7.7 - -
Sulphides Pyrite FeS2 - 2 - - - -

ENVIRONMENTAL RESOURCES MANAGEMENT GAMSBERG MINE ESIA & EMP
57
Table 6.2 ABA and NAG Test Results for Gamsberg Waste Rock Samples
Formation Material Sample ID Paste pH Total Sulphur Sulphide-S NP AP* Net NP NPR NAG pH NAG (pH 4.5)
ARD potential Units % S % S kg CaCO3/t Ratio Units kg H2SO4/t
Koeris
AMP 10/AMP 5.9 1 0.5 0 16 -16 0 4.5 2 Uncertainty
AMP/OLD 6.4 0.005 0.005 6 0.2 5.8 41 4.9 <0.01 Unlikely
IQS/ISQ
GPFD14255 4.4 1.5 1 1 41 -40 0.02 4.5 36 PAG 10/ISQ 6.3 0.005 0.005 0 0 0 0 4.6 3 Unlikely 28/IQS 6.3 0.005 0.005 0 0 0 0 4.5 0.4 Unlikely 52/ISQ 6 0.04 0.04 0 1 -1 0 5.7 <0.01 Unlikely
MSS
10/MSS 5.6 0.03 0.03 0 1 -1 0 4.6 2 Unlikely 24/MSS 8.2 0.005 0.005 0 0 0 0 4.6 1 Unlikely 66/MSS 6 0.005 0.005 0 0 0 0 5.8 <0.01 Unlikely
MSS/OLD 6.5 0.01 0.01 5 0 5 17 5.3 <0.01 Unlikely
QMS GPFD10371 6.4 0.4 0.1 3 4 -2 0.6 6.1 <0.01 Unlikely
66/QMS 6.2 0.005 0.005 0 0 0 0 4.6 <0.01 Unlikely
SCH 24/SCH 6.1 0.01 0.01 0 0 0 0 4.5 2 Unlikely 52/SCH 6.4 0.03 0.03 0 1 -1 0 4.7 0.2 Unlikely
CON 24/CON 5.8 0.005 0.005 0 0.2 -0.2 0 4.7 4 Unlikely GIF Refer Section 5
Pella Quartzite DQZ 28/DQZ 6.2 0.005 0.005 0 0.2 -0.2 0 4.5 3 Unlikely
WQZ 28/WQZ 5.6 0.005 0.005 0 0 0 0 4.6 1 Unlikely
WQZ/OLD 6.2 0.01 0.01 4 0 4 14 4.9 <0.01 Unlikely WRD composite
sample Data to be received shortly

ENVIRONMENTAL RESOURCES MANAGEMENT GAMSBERG MINE ESIA & EMP
58
6.3 SHORT-TERM LEACHING BEHAVIOUR
Table 6.3 shows concentrations of metal constituents that exceeded Acceptable Environmental Risk (AER) levels in distilled water leachates and/or hydrogen peroxide extracts from one or more of the Koeris or Pella Quartzite samples. Metals which exceeded AER values in these materials were the same as for tailings and GIF materials (namely Al, Cd, Cu, Fe, Mn, Pb and Zn) but generally leached at substantially lower concentrations than from these materials. Most of the metal exceedences were associated with interbanded schist and quartzite (IQS/ISQ) and with pegamatite (PEG). Note that Cd and Cu only mobilised from these materials at environmentally significant concentrations in the peroxide extracts, indicating that this would only occur under intense oxidation of the materials.

ENVIRONMENTAL RESOURCES MANAGEMENT GAMSBERG MINE ESIA & EMP
59
6.3 Metal Leachate Concentrations (distilled water, peroxide) which Exceeded AER Levels in one or more Koeris / Pella Quartzite Sample
Sample Borehole Material Al mg/l Cd mg/l Cu mg/l Fe mg/l Mn mg/l Pb mg/l Zn mg/l DWAF AER value (mg/l) 0.39 0.031 0.1 9 0.3 0.1 0.7
Short-term leach type
DW
Perox
DW
Perox
DW
Perox
DW
Perox
DW
Perox
DW
Perox
DW
Perox
AMP/OLD - AMP weathered 2 3
52/ISQ GPFD052 IQS
1
GPFD14255 GPFD066 3 0.1 271 15 8 1 0.2 14 33
GPFD13662 GPFD065 PEG 3 37 0.8 33 91 37 14 0.6 5 5
GPFD10371 GPFD023 QMS 1
24/SCH GPFD024 SCH
1
52/SCH GPFD052 0.4
28/WQZ GPFD028 WQZ
1
WQZ/OLD - 5 6

ENVIRONMENTAL RESOURCES MANAGEMENT GAMSBERG MINE ESIA & EMP
60
6.4 CALCULATION OF WRD SOURCE-TERMS
Waste rock is to be end-tipped over the northern side of the inselberg to develop a WRD against the slope of the inselberg. The WRD will have a footprint of 270 ha (2.7 km2), a height of 180 m, an overall slope angle of 45 degrees and a final capacity of 1.5 billion tons. The conceptual model used to generate the geochemical model for the WRD is shown in Figure 6.1.
Figure 6.1 Conceptual Model for Geochemical Modelling of Waste Rock Leachate Chemistry
As indicated in the TSF section of this report, the concentrations of contaminants of concern are determined by the ratio of water : solid material, kinetic constraints and thermodynamic constraints. These factors are described below in relation to assumptions made for the geochemical model of the Gamsberg WRD. Ratio of Water to Solid Material In order to estimate the volume of water likely to interact with the WRD, a simple water balance was constructed using the same assumptions as the hydrogeological model. Due to the high porosity and permeability expected in the WRD, it is assumed that most rainfall (80% of mean annual precipitation or MAP) falling on the surface of the WRD will infiltrate into the WRD, with 20% evaporating. Of this infiltration, 20% is expected to infiltrate from the WRD into the underlying geology. The remainder of the water (60%) is assumed to seep from the toe of the WRD, or to be retained within the WRD

ENVIRONMENTAL RESOURCES MANAGEMENT GAMSBERG MINE ESIA & EMP
61
(10%). The MAP assumed for the WRD is 150 mm/a, higher than that assumed for the TSF, as the WRD is located adjacent to the Gamsberg inselberg, which has higher annual rainfall. The volume of infiltration was calculated assuming that infiltration is the difference between inputs (i.e. rainfall on the waste rock dump surface, which was estimated using WRD height and footprint) and outputs (i.e. evaporation). The assumptions used in this water balance are given in Table 6.4. The upper surface area of the WRD is assumed to increase in proportion to the tonnage of rock deposited. The conceptual model is applicable for the LOM and beyond as no changes to the system are expected post-closure.
Table 6.4 Input Parameters for Calculation of Infiltration at the Gamsberg WRD
Input parameter Value Units Source Footprint surface area 2.7 x 10⁶ m2 Site engineers (AMEC) Upper surface area 4.94 x 10⁶ m2 Calculated assuming wedge with height
180 m, angle of repose 45° Height 180 m Site engineers (AMEC) Mass 1.89 x 10⁹ t Sum of waste on yearly production
schedule Rainfall 0.15 m/a Based on Aggeneys long term average
(2000-2012) adjusted for higher rainfall on the inselberg based on relative rainfall rates recorded over one season
Evaporation 0.015 m/a Assume 20% of MAP Infiltration to WRD 0.14 m/a Assume 80% of MAP Infiltration to groundwater 0.03 m/a Assume 20% of WRD infiltration water Seepage from toe 0.09 m/a Assume 60% of WRD infiltration water Water retained within WRD 0.015 m/a Assume 10% of WRD infiltration water
Kinetic Constraints The secondary pyrite oxidation and neutralisation rates calculated by WMB (2000) were used to empirically predict the concentration of sulphate leaching from the WRD using the following calculations: Amount of sulphur leached from the WRD annually = sulphide oxidation rate x mass of WRD deposited per year Concentration of sulphate in leachate from WRD = amount of sulphur leached per annum / volume of infiltration per annum The reaction rates and amount of available acid and neutralisation potential used as input parameters into the geochemical model are shown in Table 6.5. The overburden sample analysed by WMB (2000) consisted of a specific mix of geological units at Gamsberg that would report to the WRD. The proportion

ENVIRONMENTAL RESOURCES MANAGEMENT GAMSBERG MINE ESIA & EMP
62
of each rock type in the composite sample was based on its average ratio in 10 cross-sections across the proposed pit area. This included: micaceous schist (23.0%), amphibole (27.4%); white quartzite (36.4%), dark quartzite (4.6%); and a 1:1 mix of GIF A and C Member rocks (8.6%).
Table 6.5 Input Parameters for Calculation of Sulphate Concentrations and pH in Leachate at the Gamsberg TSF
Input parameter Value Units Source Sulphide oxidation rate. 0.086 g CaCO3/ton/week WMB (2000) pg. 40. Sulphide oxidation rate. 0.045 mol S/t/a Converted from above number. Total sulphide content. 0.45 wt % as S WMB (2000) (Table 7). NP consumption rate. 0.38 g CaCO3/ton/week WMB (2000) pg. 40. Total NP. 0.494 wt% as CaCO3 WMB (2000) (Table 7). Percentage of waste rock considered to be reactive.
10 % Based on assumption that 10% will occur as fines.
The predicted concentration of sulphate in the leachate from the WRD is given in Figure 6.2. The concentration of sulphate remains relatively steady at a concentration of between 2000 and 2500 mg/L. No changes are noted post mining as there are no changes to the management of the WRD, and it will remain an ongoing source.
Figure 6.2 Sulphate Source Term Curve for the WRD

ENVIRONMENTAL RESOURCES MANAGEMENT GAMSBERG MINE ESIA & EMP
63
In order to determine the potential for development of low pH conditions, the production of acid was compared to the consumption of neutralisation potential (NP) on an annual basis. The rate of consumption of NP was determined from humidity cell tests. The predicted change in pH with time at the WRD facility is illustrated in Figure 6.3. The pH is expected to remain near-neutral (similar to background pH for the inselberg) for almost 350 years, after which it may decrease to a pH less than 4, with concurrent increases in metal mobility. While the humidity cell data predict a reduction in pH after 350 years, this change will be dependent on a number of factors for example, the percentage of GIF A and C material in the waste rock, distribution of coarse and fine material within the WRD and their relative exposure to oxygen etc.
Figure 6.3 Consumption of NP, Production of Acidity and Change in pH for the WRD
Although the waste rock is not initially predicted to have a low pH leachate, non-metallic and metalloid contaminants, including nitrate and fluoride could be mobile. Additional humidity cell testing currently underway will assist with predicting the likely chemistry of these contaminants. Thermodynamic Constraints The concentrations determined using water : solid ratios and reaction rates should be compared to concentrations expected at equilibrium, as concentrations may be controlled by the equilibrium with mineral phases. In the humidity cell leachate from WMB (2000), the sulphate minerals that are closest to saturation are alunite (KAl3(SO4)2(OH)6) and K-jarosite (KFe3(SO4)2(OH)6). The leachate is saturated with respect to both of these minerals where there is humidity cell data for K, Al and Fe. Unfortunately

ENVIRONMENTAL RESOURCES MANAGEMENT GAMSBERG MINE ESIA & EMP
64
there is insufficient data for these three elements in the WMB (2000) dataset to predict their likely behaviour in the WRD. In the absence of these data, an attempt was made to estimate the equilibrium concentration using the calculated sulphate concentration and an estimated calcium concentration based on the ratio of sulphate : calcium in the humidity cell tests. Figure 6.4 indicates that the WRD leachate is saturated with gypsum for the duration of the geochemical model. Precipitation of gypsum does result in a decrease in the predicted sulphate concentrations, to about half that predicted by kinetic methods. However, it must be noted that gypsum may not be the mineral controlling sulphate solubility, therefore these results are indicative only.
Figure 6.4 Equilibrium Sulphate Concentrations Compared to Concentrations Determined using Kinetic Data and Water : Solid Ratios
Modelling Limitations The modelling limitations that were listed in regards to the TSF system are also relevant to modelling of the WRD system.
6.5 MANAGEMENT OF WASTE ROCK
The relative proportion of GIF A and C material deposited with waste rock WRD will be the key factor which determines the potential for the WRD to generate ARD and/or metal leaching. The project mining team should assess the feasibility of segregating GIF A & C gangue material from overburden material during mining. If effective segregation of these materials can be

ENVIRONMENTAL RESOURCES MANAGEMENT GAMSBERG MINE ESIA & EMP
65
achieved then the possibility exists of storing these two materials in separate disposal facilities. It should be noted, however, that whilst this will result in a decrease in ARD and metal leaching potential associated with the WRD, the risk of groundwater contamination from the GIF A & C dump may be at levels that would require higher specification engineered controls to be put in place than would otherwise be the case for the combined WRD facility. Management controls for the WRD will be discussed in the groundwater specialist report once source-pathway-receptor impacts are more comprehensively understood.
6.6 ON-GOING TESTWORK
Two samples of waste rock (in addition to GIF samples discussed previously) were submitted for humidity cell testing, being a quartz-muscovite-biotite schist (QMS) sample and a composite waste rock sample reflecting the likely composition of the WRD (including 8.6% GIF A and C). The two humidity cells will run for at least 20 weeks and were insufficiently advanced at the time of writing to include in this report (WMB 2000 kinetic results for a similar waste rock composite sample were therefore used for source-term calculations in this current study instead.)

ENVIRONMENTAL RESOURCES MANAGEMENT GAMSBERG MINE ESIA & EMP
66
7 QUALITY ASSURANCE / QUALITY CONTROL
7.1 CHARGE BALANCING
Charge balance errors were calculated for the distilled water leachate and hydrogen peroxide extract solutions. The distilled water leachate solutions generally showed charge imbalance of 15% or less, indicating that the analysis is of acceptable quality. The hydrogen peroxide extracts often showed charge imbalances greater than 15% which is common for these analyses.
7.2 DUPLICATE ANALYSES
Duplicate analyses conducted on 8 to 10 % of the sample population indicated that the relative standard deviation (%RSD) was consistently less than 10%, which is generally considered to denote acceptable precision.
ENVIRONMENTAL RESOURCES MANAGEMENT GAMSBERG MINE ESIA & EMP
67
8 IMPLICATIONS OF SUGGESTED CHANGES TO LAYOUT
Based on recent discussions with the Applicant and design engineers, the following changes to the project layout have been suggested after the completion of this study: • Relocation of the explosives magazine area from the top of the inselberg
to an area located between the N14 and inselberg. This relocation was requested by the Specialist Team due to possible impact of the original layout on three watercourses on the inselberg; and
• Increase in the WRD footprint from to 270 hectares to 490 hectares to accommodate a reduction in slope angle from 45o to 35o. This design refinement was in response to DMR design requirements for a WRD.
The suggested changes to the explosives magazine will not affect the outcomes of this study. The suggested changes to the WRD geometry may affect the magnitude of the Source-Terms calculated in this study in that: • The water:solid ratio within the WRD would be affected which could in
turn affect the opportunity for reaction and mobility of constituents of concern; and
• Recharge of MAP to the WRD would increase in response to an increase in the surface area of the WRD. This would introduce a dilution effect on dissolved concentrations.
Although the proposed alteration in WRD geometry may affect the seepage concentrations of constituents from the WRD, the magnitude of these changes - when considered in combination with the results of the hydrogeological study - is unlikely to affect the impact ratings or proposed mitigation measures proposed in this current study.
ENVIRONMENTAL RESOURCES MANAGEMENT GAMSBERG MINE ESIA & EMP
68
9 CONCLUSIONS AND RECOMMENDATIONS
This assessment has shown that the Gamsberg TSF is expected to generate ARD within a short period of operation (perhaps within 10 years) because of the high sulphide and low neutralisation content of the tailings. Without engineering controls in place, the TSF would seep low pH, saline, metal laden water to groundwater on decommissioning of the TSF. The groundwater report will assess the rate and extent of groundwater plume development. Preliminary TSF management recommendations were identified based only on geochemical characterisation of tailings as a contamination source. The recommendations included following short deposition cycles, cladding TSF side slopes concurrently with deposition, and engineered controls to capture and contain TSF drainage. Liming of the tailings will achieve acceptable pH values on tailings deposition but will not prevent ARD from generating shortly thereafter. The groundwater report will propose management recommendations after assessing likely significance of impact of the tailings on receptors via groundwater pathways. The potential for the WRD to generate nett acidity will be largely dependent on the relative proportion of GIF A and C materials. Assuming 8 to 9% of GIF A and C and recharge of 60 % of total MAP to groundwater, then the TSF should remain near-neutral for a considerable period (perhaps 350 years) before ARD conditions develop. Sulphate is expected to leach from the WRD at approximately 2 000 mg/L throughout LOM and beyond. Management controls for the WRD will be discussed in the groundwater specialist report once source-pathway-receptor impacts are more comprehensively understood. The pit design should aim to minimise contact between side slope runoff and GIF (particularly within benches established in GIF) – both in terms of the quantity of water contacting with GIF and contact (reaction) time. Ore and concentrate stockpiles are potential sources of ARD and metal leaching but occupy small footprints and could be effectively managed with engineered controls such as bunding, interception channels, silt traps and clean/dirty water containment. Engineered controls and operational practices could minimise wind entrainment or spillage of zinc concentrate during transport and handling, both on site and to the point of export. The findings of this study are based on various assumptions that were made in the conceptual models for the individual facilities. To increase the level of confidence in these predictions it will be necessary to validate these assumptions as additional information becomes available. This should be done throughout LOM by optimising the conceptual model to incorporate revised design specifications, operational procedures and environmental monitoring data. The establishment of on-site geochemical kinetic test programmes is also advised to simulate actual site conditions.
ENVIRONMENTAL RESOURCES MANAGEMENT GAMSBERG MINE ESIA & EMP
69
10 REFERENCES
AMIRA International Ltd., 2002. ARD Test Handbook – Prediction and Kinetic Control of Acid Mine Drainage. Environmental Geochemistry International Pty. Ltd. and Ian Wark Institute, University of South Australia. Anglo American plc, June 2000. Gamsberg Zinc Mine Bankable Feasibility Study: Section 2 – Geology. Department of Water Affairs and Forestry (DWAF), 1998. Minimum Requirements for the Handling, Classification and Disposal of Hazardous Waste. Second Edition, 1998. GoldFields South Africa (GFSA), 1993. Gamsberg Zinc Project, Report No. 1 – Geology. GFSA internal report. Mine Environment Neutral Drainage (MEND), 2009. Prediction Manual for Drainage Chemistry from Sulphidic Geologic Materials, Report No 1.20.1, CANMET – Mining and Mineral Sciences Laboratories, Smithers, British Columbia, Canada, December 2009. O’okiep Copper Company (OCC), 1976. Preliminary Feasibility Study: Gamsberg Zinc Project. OCC and Newmont internal report. O’okiep Copper Company (OCC), 1977. Update to the 1976 Gamsberg Feasibility Study. OCC internal report. O’okiep Copper Company (OCC), 1982. Geophysical Prospecting in the Okiep Copper District. OCC internal report. Plumlee G.S., and Logsdon, M.J. (eds.). 1999. The Environmental Geochemistry of Mineral Deposits - Part A: Processes, techniques, and health issues. Society of Economic Geologists, Reviews in Economic Geology. Price, W.A., 1997. Draft guidelines and recommended methods for the prediction of metal leaching and acid rock drainage at mine sites in British Columbia. British Columbia Ministry of Employment and Investment, Energy and Minerals Division, Smithers, BC. Rozendaal, A. 1974. The Geology of the Gamsberg Zinc Deposit on the Farm Gams (Portion 1), Namaqualand. OCC internal report. Rozendaal, A. 1975. The Geology of Gamsberg, Namaqualand, South Africa. MSc Thesis, University of Stellenbosch. Rozendaal, A. 1982. The Gamsberg Zinc Deposit. OCC internal report.

ENVIRONMENTAL RESOURCES MANAGEMENT GAMSBERG MINE ESIA & EMP
70
Smith, K.S., and Huyck, H.L.O., 1999. An overview of the abundance, relative mobility, bioavailability, and human toxicity of metals, Chapter 2, in Plumlee, G.S., and Logsdon, M.J., eds., The environmental geochemistry of mineral deposits, Part A: Processes, techniques, and health issues, Reviews in Economic Geology, Vol. 6A: p. 29-70. Sorgaroli, B.A. and Lawrence, R.W. 1997. Waste Rock characterisation at Dublin Gulch: A case study. Proceedings of Fourth International Conference on Acid Rock Drainage. Vancouver, BC. SRK, 9 February 2010. Memo: Geochemical characterisation of tailings sample. Attention Ms T Steele (of Anglo American plc). Usher, B.H., Cruywagen L.M., de Necker E. and Hodgson F.D.I. (2003) Acid-Base: Accounting, Techniques and Evaluation (ABATE): Recommended Methods for Conducting and Interpreting Analytical Geochemical Assessments at Opencast Collieries in South Africa. University of the Free State, South Africa. Venter, 1989. Results of a resampling programme of diamond drill core at Gamsberg. GFSA internal report. Wates, Meiring and Barnard (WMB), January 2000. Gamsberg Zinc Project Impact Assessment. Geochemical Characterisation of Waste Material and Implications for Project Activities. WMB Report 4082/2018/2/E.

CONTENTS
DECLARATION OF CONSULTANTS INDEPENDENCE 1
EXECUTIVE SUMMARY 2
1 TERMS OF REFERENCE 8
1.1 BACKGROUND 8 1.2 OBJECTIVES OF THIS STUDY 8 1.3 FRAMEWORK TO THIS STUDY 9
2 PROJECT DESCRIPTION 10
2.1 GENERAL SETTING 10 2.2 PROPOSED DEVELOPMENT OF THE RESOURCE 10 2.3 GEOLOGY 13 2.3.1 Regional Geology 13 2.3.3 Geochemical Context of the Gamsberg Deposit 13
3 METHODOLOGY 17
3.1 SAMPLE COLLECTION AND HANDLING 17 3.1.1 Ore and Waste Rock 17 3.1.2 Tailings 19 3.2 ANALYTICAL TEST METHODS 19 3.2.1 Sample Mineralogy 19 3.2.2 Elemental composition 19 3.2.3 Sulphur Speciation 19 3.2.4 Acid base Accounting (ABA) 20 3.2.5 Net acid Generation (NAG) Test 20 3.2.6 Static Leach Testing 20 3.2.7 Kinetic Geochemical Testing 20 3.3 DATA INTERPRETATION METHODS 21 3.3.1 Ionic Charge Balances 21 3.3.2 Duplicate Samples / Analyses 21 3.3.3 Assessment of Sample Representivity 21 3.3.4 Assessment of Acid Generation Potential 22 3.3.5 Leachate Concentrations versus AER Levels 22
4 GAMSBERG TAILINGS GEOCHEMISTRY 23
4.1 TAILINGS COMPOSITION 23 4.2 ACID GENERATION POTENTIAL 25 4.3 SHORT-TERM LEACHING POTENTIAL 26 4.4 SAMPLE REPRESENTIVITY 28 4.5 CALCULATION OF TSF SOURCE-TERMS 28 4.6 TSF MANAGEMENT IMPLICATIONS 35 4.7 ON-GOING TESTWORK 36
5 GAMS IRON FORMATION (GIF) GEOCHEMISTRY 37
5.1 SAMPLE COMPOSITION 37 5.2 SAMPLE REPRESENTIVITY 42 5.3 ACID GENERATION POTENTIAL 42 5.4 METAL / SALT LEACHING POTENTIAL 43 5.5 KINETIC TEST RESULTS 53 5.6 MANAGEMENT OF GIF MATERIALS 53 5.6.1 GIF B Member Materials 53 5.6.2 GIF A and C Member Materials 54 5.7 ON-GOING TESTWORK 54
6 WASTE ROCK GEOCHEMISTRY 55
6.1 SAMPLE COMPOSITION 55 6.2 ACID GENERATION POTENTIAL 55 6.3 SHORT-TERM LEACHING BEHAVIOUR 58 6.4 CALCULATION OF WRD SOURCE-TERMS 60 6.5 MANAGEMENT OF WASTE ROCK 64 6.6 ON-GOING TESTWORK 65
7 QUALITY ASSURANCE / QUALITY CONTROL 66
7.1 CHARGE BALANCING 66 7.2 DUPLICATE ANALYSES 66
8 IMPLICATIONS OF SUGGESTED CHANGES TO LAYOUT 67
9 CONCLUSIONS AND RECOMMENDATIONS 68

10 REFERENCES 69
Annex A
Details of Samples Collected in the Study

ENVIRONMENTAL RESOURCES MANAGEMENT
A1
Formation Lithostratigraphy Rock Type Sample Names Borehole ID Sample depth (m) Ore / waste
Nousees Mafic Gneiss/Koeris
Amphibolite AMP: Amphibolite. 10/AMP AMP/old
GPFD010 Field sample
18 – 19 Surface
Hanging wall waste
Quartz-Muscovite Schist (plus conglomerate lenses).
IQS and ISQ: Interbanded schist and quartzite. 10 ISQ 28/IQS 52/ISQ
GPFD010 GPFD028 GPFD052
108.9 – 110.9 140.8 – 141.6 114.9 – 145.9
PEG: Pegmatite. GPFD13662 GPFD065 209.4 – 211.4
MSS: Quartz muscovite schist.
10/MSS 24/MSS 66/MSS MSS/old
GPFD010 GPFD024 GPFD066
Field sample
96.1 – 97.0 26.1 - 27.1 15.9 – 16.9
Surface
QMS: Quartz muscovite biotite schist. 66/QMS
GPFD10371 GPFD066 GPFD023
98.2 – 99.7
SCH: Schist (undifferentiated). 24/SCH 52/SCH
GPFD024 GPFD052
117.2 – 118.2 142.5 – 143.5
CON: Conglomerate. 24/CON GPFD024 33.8 – 34.8
Gams Iron Formation (GIF)
BIF (C Members).
GTT: Garnetite.
GPFD0999 GPFD10374 GPFD10598
GPFD14454/8
GPFD002 GPFD023 GPFD024 GPFD028
119.2 - 121.2 103.7 - 105.7 121.1 - 123.1
GMQ: Garnet magnetite quartz rock. 09/GMQ 23/GMQ
65/GMQ/C
GPFD009 GPFD023 GPFD065
112.6 - 113.6 109.0 - 109.9 25.1 - 26.1
AMQ: Amphibole magnetite quartz rock. GPFD14452 GPFD028 342.1 - 343.3 GAP: Garnet amphibole pyroxenoid quartz rock. GPFD10003 GPFD002 126.0 - 128.0
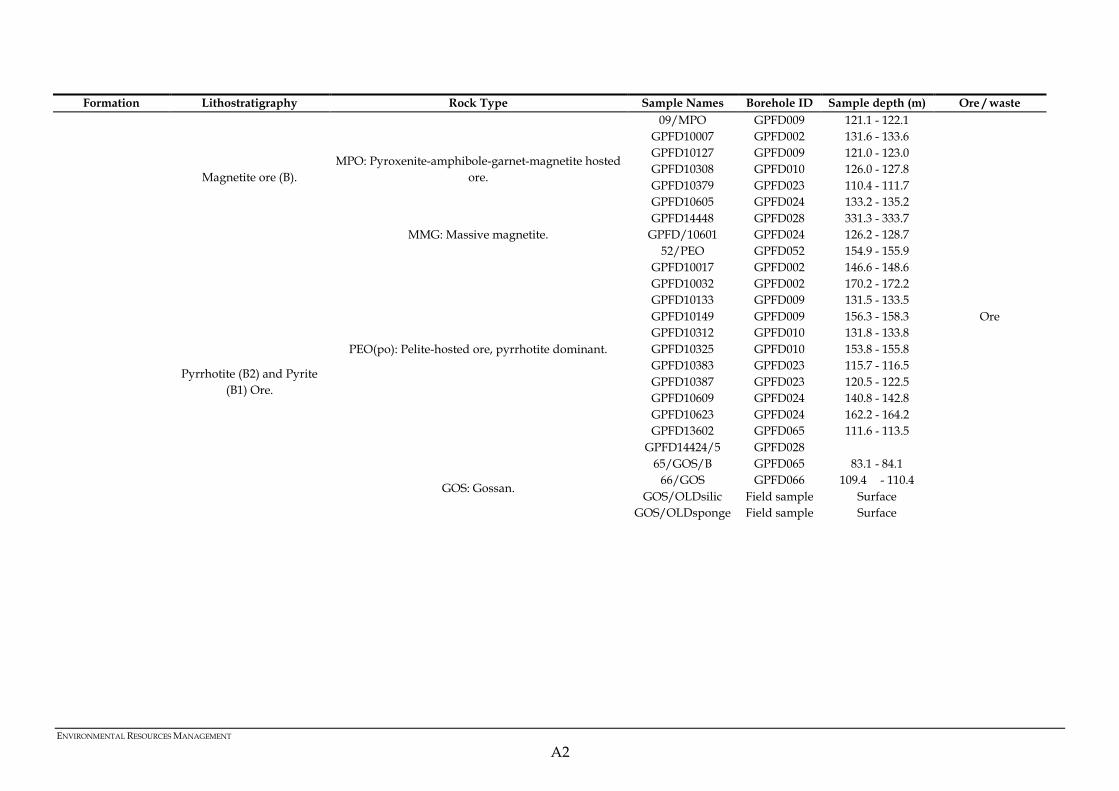
ENVIRONMENTAL RESOURCES MANAGEMENT
A2
Formation Lithostratigraphy Rock Type Sample Names Borehole ID Sample depth (m) Ore / waste
Magnetite ore (B). MPO: Pyroxenite-amphibole-garnet-magnetite hosted
ore.
09/MPO GPFD10007 GPFD10127 GPFD10308 GPFD10379 GPFD10605 GPFD14448
GPFD009 GPFD002 GPFD009 GPFD010 GPFD023 GPFD024 GPFD028
121.1 - 122.1 131.6 - 133.6 121.0 - 123.0 126.0 - 127.8 110.4 - 111.7 133.2 - 135.2 331.3 - 333.7
Ore
MMG: Massive magnetite. GPFD/10601 GPFD024 126.2 - 128.7
Pyrrhotite (B2) and Pyrite (B1) Ore.
PEO(po): Pelite-hosted ore, pyrrhotite dominant.
52/PEO GPFD10017 GPFD10032 GPFD10133 GPFD10149 GPFD10312 GPFD10325 GPFD10383 GPFD10387 GPFD10609 GPFD10623 GPFD13602
GPFD14424/5
GPFD052 GPFD002 GPFD002 GPFD009 GPFD009 GPFD010 GPFD010 GPFD023 GPFD023 GPFD024 GPFD024 GPFD065 GPFD028
154.9 - 155.9 146.6 - 148.6 170.2 - 172.2 131.5 - 133.5 156.3 - 158.3 131.8 - 133.8 153.8 - 155.8 115.7 - 116.5 120.5 - 122.5 140.8 - 142.8 162.2 - 164.2 111.6 - 113.5
GOS: Gossan.
65/GOS/B 66/GOS
GOS/OLDsilic GOS/OLDsponge
GPFD065 GPFD066
Field sample Field sample
83.1 - 84.1 109.4 - 110.4
Surface Surface

ENVIRONMENTAL RESOURCES MANAGEMENT
A3
Formation Lithostratigraphy Rock Type Sample Names Borehole ID Sample depth (m) Ore / waste
PEO(py): Pelite-hosted ore, pyrite dominant.
GPFD12764 GPFD13618 GPFD14202 GPFD14238 GPFD14411
GPFD052 GPFD065 GPFD066 GPFD066 GPFD028
181.9 - 183.9 137.0 - 139.0 132.1 - 134.1 190.9 - 192.9 266.6 - 268.6
PEL: Meta-pelite-rock. GPFD10155 GPFD009 163.6 - 165.6
Pyritic quartzite (A4). PYQ: Pyritic quartzite. GPFD10332 GPFD10628
GPFD010 GPFD024
162.4 - 164.4 167.4 - 168.2
Footwall waste. Calc-silicate rock (A3 & A2). CAS: Calc-silicate rock.
09/CAS GPFD10046 GPFD10394 GPFD10630 GPFD122771 GPFD13664 GPFD14516
GPFD009 GPFD002 GPFD023 GPFD024 GPFD052 GPFD065 GPFD028
169.1 - 170.1 194.1 - 196.5 128.7 - 130.7 170.2 - 172.2 191.4 - 193.4 213.7 - 215.2 487.3 - 492.3
Wortel/Pella Quartzite
Dark quartzite. DQZ: Dark quartzite. 28/DQZ GPFD028 200.3 - 201.3 Schist. IQS and ISQ: Interbanded schist and quartzite. GPFD14255 GPFD066 216.6 – 218.6
White quartzite. WQZ: White quartzite. 28/WQZ WQZ/old
GPFD028 Field sample
60.5 - 61.5 Surface
Namies Schist Quartz, biotite, muscovite,
sillimanite schist. QMS: Quartz muscovite biotite schist.
Underlying Formations.
SCH: Schist (undifferentiated). Haramoep Gneiss Gneiss. BGN: Biotite gneiss. GPFD14456 GPFD028 350.2 – 355.2