vattenfall capital markets day 2009 capital markets day 2009 presentation by: Øystein løseth...
TRANSCRIPT

Vattenfall Capital Markets Day 2009
Presentation by:
Øystein LøsethSenior Executive Vice PresidentHead of Business Group Benelux
Amsterdam, 23 September 2009

Vattenfall Capital Markets Day, 23 September 20092© Vattenfall AB
Contents
• The Benelux Energy Market
• Overview Business Group Benelux

Vattenfall Capital Markets Day, 23 September 20093© Vattenfall AB
Key elements Benelux market
• Well connected to existing Vattenfall markets
• Great CO2 reduction and renewables opportunities
• Emerging as a biomass hub
• Benelux power production capacity needs renewal
• Strengthening its role as a hub for European gas

Vattenfall Capital Markets Day, 23 September 20094© Vattenfall AB
Electricity demand, 2008 (TWh)Electricity generation, 2008 (TWh)
89
France
Belgium
Netherlands
81
495 549
123 103
Source: Eurelectric
Supply and demand fundamental, electricity

Vattenfall Capital Markets Day, 23 September 20095© Vattenfall AB
• Large increase of capacity until 2015 results in sufficient remaining capacity• However, if announced projects are not executed, security of supply is easily in danger,
especially in Belgium• Depending on e.g., execution of nuclear phase out in Belgium (today 55% of the
generation), longer term reserves decline
FRNL B
0
2
4
6
8
10
2009 2010 2013 2015 20200
2
4
6
8
10
2009 2010 2013 2015 20200
4
8
12
16
2009 2010 2013 2015 2020
Remaining capacity*Security level
GW GW GW GW GWGW
Note: *Remaining capacity is defined as Net generation capacity – unavailable capacity – consumptionSource: UCTE
Generation capacity situation Benelux

Vattenfall Capital Markets Day, 23 September 20096© Vattenfall AB
Benelux electricity market: highly interconnected, as well as strongly connected to neighbouring markets
Sources: Datamonitor 2009, Elia, UCTE, ENTSO-E, EnergieNed, Tennet
Current capacity:• NL <> BE: 2200 MW• NL <> GE: 3900 MW• NL <> NO: 700 MW• BE > FR: 1100 MW• FR > BE: 2700 MW• GE > LUX: 980 MW
Planned capacity additions:• NL-UK: 1320 MW (2011)• NL-DK: 600 – 700 MW (2016)• FR-BE: 500 MW (2010)• DE-NL: tbd (2013)• LUX-BE: tbd (2012)• BE-GE: tbd
Interconnectivity of BG Benelux core markets: In 2008, the NL exported 8,1 TWh to Belgium. 3 TWh were exported from Belgium to the Netherlands (total 2008 NL production107 TWh).

Vattenfall Capital Markets Day, 23 September 20097© Vattenfall AB
The Benelux market in general, and the Belgian market in particular, is well connected to the French market…
Source: www.elia.be, System and Market overview 2008
Price convergence with energy exchanges in neighboring countries
In 2008, the price on the Belpex day-ahead market was the same as on the power exchange in the Netherlands and France in 69.1 % of the time. In other words, the markets were coupled at the time. For 15.4 % of the time, Belgium was only coupled with France, and for 14.7 % of the time only with the Netherlands. Only for 0.8% of the time was Belgium not coupled to one of its neighbors.
Vattenfall Capital Markets Day, 23 September 20098© Vattenfall AB
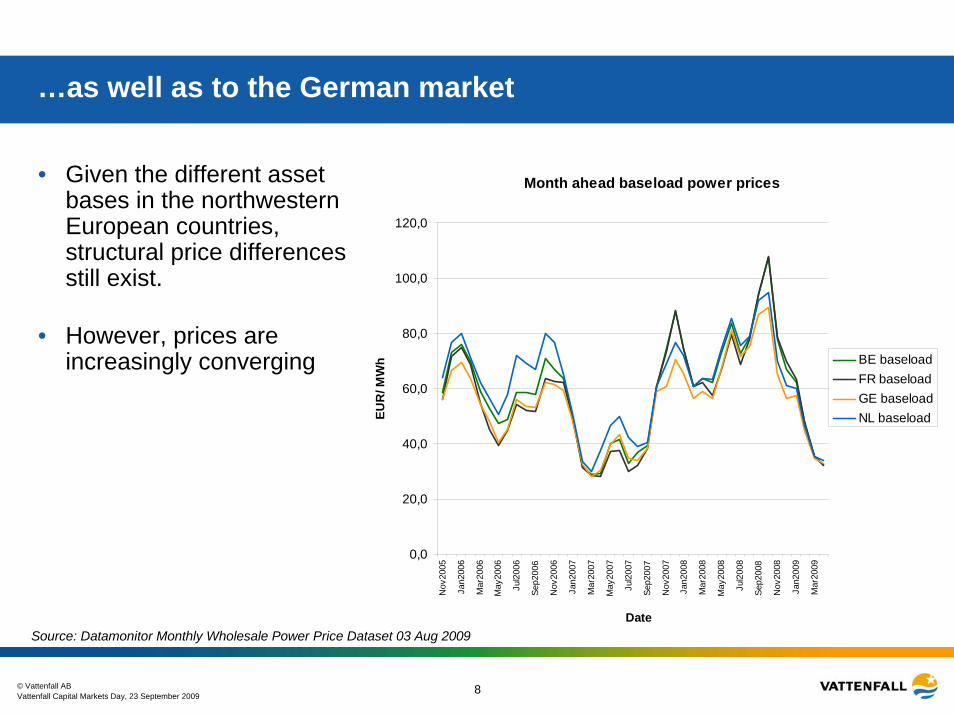
…as well as to the German market
Month ahead baseload power prices
0,0
20,0
40,0
60,0
80,0
100,0
120,0
Nov
2005
Jan2
006
Mar
2006
May
2006
Jul2
006
Sep2
006
Nov
2006
Jan2
007
Mar
2007
May
2007
Jul2
007
Sep2
007
Nov
2007
Jan2
008
Mar
2008
May
2008
Jul2
008
Sep2
008
Nov
2008
Jan2
009
Mar
2009
Date
EUR
/ MW
h BE baseloadFR baseloadGE baseloadNL baseload
Source: Datamonitor Monthly Wholesale Power Price Dataset 03 Aug 2009
• Given the different asset bases in the northwestern European countries, structural price differences still exist.
• However, prices are increasingly converging

Vattenfall Capital Markets Day, 23 September 20099© Vattenfall AB
Supply and demand fundamentals – Gas
Gas demand, 2008 (bcm)Gas production, 2008 (bcm)
18
France
Belgium
Netherlands0
47
2
3568
Source: eurogas, all data 2008 and BP Statistical Review of World Energy June 2009

Vattenfall Capital Markets Day, 23 September 200910© Vattenfall AB
North West Europe will increase its dependency on gas imports
Source: * BP Statistical Review of World Energy June 2009
** Wood Mackenzie 2009 and CERA 2008
• The Netherlands is experiencing a decrease of production • The policy of the Dutch government is designed to guarantee the long term
availability of sufficient gas and to promote diversification of gas supply• France and Belgium already depend on imports. Both countries enjoy a well
diversified sourcing portfolio (LNG, Netherlands, Norway, etc)
Natural gas proven reserves in the NL (Trillion cubic meters)
0,0
0,5
1,0
1,5
2,0
1980
1982
1984
1986
1988
1990
1992
1994
1996
1998
2000
2002
2004
2006
2008
Increase of annual imports to North-West Europe in 2020 compared to 2005**
Norway33%
Russia18%
NL16%
Algeria15%
Germany5% Others
6%Nigeria7%
Norway7%
NL79%
Germany5%
Russia5%Others
4%
Total: 86 bcm
Total: 49 bcm
Norway38%
UK8%
NL38%
Qatar13%
Others3%
Total: 21 bcm
12 bcm
8 bcm
25 bcm
Increase of annual imports

Vattenfall Capital Markets Day, 23 September 200911© Vattenfall AB
11
As a “gas country”, the Netherlands has an important role in distributing gas flows across Europe
Central role in European gas market
SOURCE: Global Insight
Gas storage
Projected LNG terminal
Gas flows
Trading hub
TTF
ZEE
NBP
VHP
Interconnection capacityGas fields
BBL
IUK
NorpipeNordstream
PEG
36% of total energy use in NL is gas, equal to 39 bcm per year1
26% of total energy use in NWE is gas, equal to 300 bcm per year1
Continued Groningen gas export to Belgium, France, and GermanyNew transit role of mainly Russian gas to UKDevelopment of LNG position to domestic and surrounding markets (e.g., Germany)Strong flexibility position due to high quality gas fields for storage and production swing of Groningen field
1) 2008 figures; relatively low because of drop in gas demand due to financial crisis and high temperatures

Vattenfall Capital Markets Day, 23 September 200912© Vattenfall AB
Regulatory trends/issues in BG Benelux
Focus on removing market barriers to stimulate new entrantsImplementation new G & E law and third packageCongestion managementNo new nuclear plants, replacement has not been ruled outFurther regulation heat supply
14% final energy consumption from renewable energy sources in 2020, translated in a ~30% renewable electricity targetSavings today 1% per year, must reach 2% in 2011-2020Aiming to save 500 PJ
Emissions
Renewables/ energy saving
NLB
Increasing Public Service ObligationAvailability of future cross-border gas capacity remains uncertainFirm exit capacity for gas supplyDebate around the nuclear phase out lawDevelopment Energy Clearing House in 2012
13% final energy consumption from renewable energy sources in 2020Regional system of green and CHP certificates to promote use and development of renewable production
FR
Focus on changing tariffs for certain segments to reflect market price (Champseur report)Work to introduce an “Eco tax”Second and third rounds to attribute new licence to operate to be built nuclear plantsFree up of hydro concessions
Further support on renewables production through subsidiesSystem for white labels to stimulate energy savings
Further attention on NOx and SO2emissionsImplementation IPCC and EU-ETSDevelopments around CCSCO2 reduction of 20%
Current key trends
Stricter legislation within the context of climate policy (CO2, RES)

Vattenfall Capital Markets Day, 23 September 200913© Vattenfall AB
NV Nuon Energy: Inclusion in the Vattenfall Group
Nuon Belgium CCC* VAS*Nuon
GermanyRetail
Netherlands
ET&WExploration &
Production Sales
BD&P
Board Nuon Energy(CEO & CFO)
Supply to B2B and B2C customers in the NL
Supply to B2B and B2C customers in Germany
Supply to B2B and B2C customers in Belgium
Customer Care Centre for the Dutch supply activities
Value Added Services
HistoricalShareholders
Grid Company
BG Pan Europe
Vattenfall Energy Trading
Wind activities
Held for sale
Staff*
Power, Heat & Services
Vattenfall

Vattenfall Capital Markets Day, 23 September 200914© Vattenfall AB
Business GroupCentral Europe
Mining & Generation
Transmission
Sales Germany
Distribution Germany
Heat Germany
Sales Poland
Distribution Poland
Heat Poland
Chief Executive Officer
Board of Directors
Group Shared Service
Business GroupNordic
Generation
Distribution
Services
Heat
Sales
Group Functions
Shared Service Centres
Wind
Nuclear
Engineering
Trading
Business Group
Benelux
Power, Heat & Services
Exploration & Production
Sales
Business Group
Pan Europe
Overview Business Group Benelux
Vattenfall Capital Markets Day, 23 September 200915© Vattenfall AB
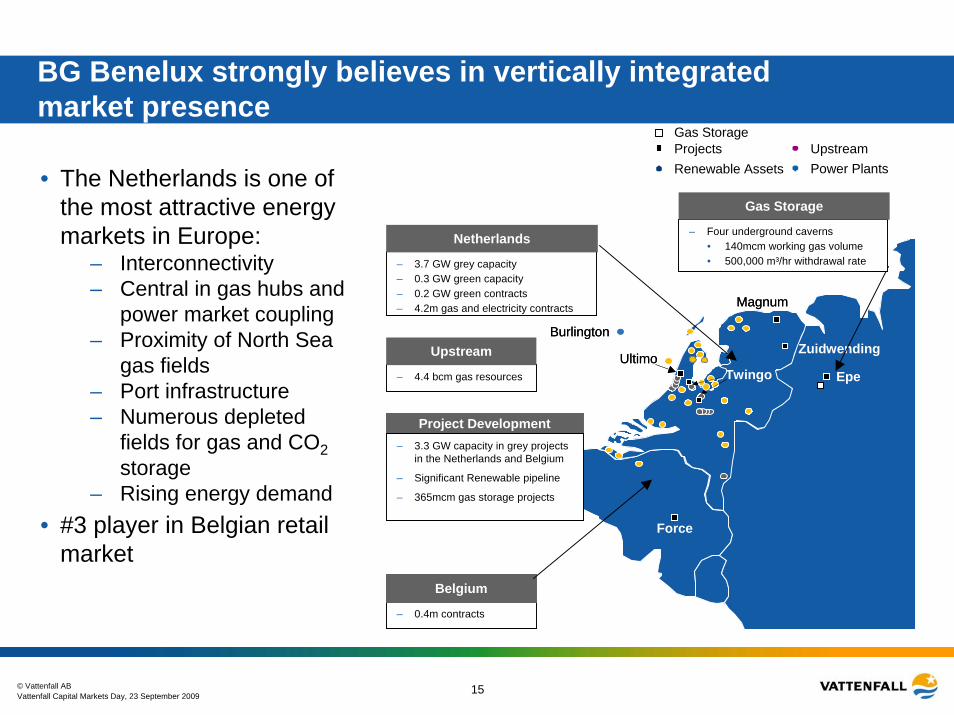
BG Benelux strongly believes in vertically integrated market presence
• The Netherlands is one of the most attractive energy markets in Europe:
– Interconnectivity– Central in gas hubs and
power market coupling– Proximity of North Sea
gas fields– Port infrastructure – Numerous depleted
fields for gas and CO2storage
– Rising energy demand• #3 player in Belgian retail
market
?
Griesheim
Magnum
Epe
Twingo
Burlington
Force
UltimoEpe
Zuidwending
Magnum
Burlington
Ultimo
– 0.4m contracts
Belgium
– 4.4 bcm gas resources
Upstream
– 3.7 GW grey capacity– 0.3 GW green capacity– 0.2 GW green contracts– 4.2m gas and electricity contracts
Netherlands – Four underground caverns• 140mcm working gas volume• 500,000 m³/hr withdrawal rate
Gas Storage
Renewable Assets Power PlantsUpstreamProjects
Gas Storage
Project Development– 3.3 GW capacity in grey projects
in the Netherlands and Belgium
– Significant Renewable pipeline
– 365mcm gas storage projects

Vattenfall Capital Markets Day, 23 September 200916© Vattenfall AB
Leading energy player in the Netherlands…
NL Generation by InstalledCapacity1
Electrabel 22%
Essent21%
Nuon19%
E.ON Benelux9%
Intergen4%
Others 25%
Total: 22.1 GW
NL Retail Electricity Supply by Number of Customers1
NL Retail Gas Supply by Number of Customers1
Essent26%
Eneco27%
Oxxio 3%
Others 14%
Total: 7.6m
Nuon30%
Total: 6.8m
Essent25%
Eneco22%
Oxxio6%
Others 19%
Nuon28%
The #1 player in retail electricity and gas supply in the Netherlands
The #3 player in power generation in the NetherlandsBG Benelux Fuel Mix
production 2008
* Wind activities are managed by BG Pan EuropeGeneration
Coal 22%
Natural gas CHP
10%Natural Gas power plants
28%
Blast furnace gas
20%
Wind
9%
Other
> 1%

Vattenfall Capital Markets Day, 23 September 200917© Vattenfall AB
Back-up

Vattenfall Capital Markets Day, 23 September 200918© Vattenfall AB
0
20
40
60
80
100
120
140
1990 1995 2000 2005 2010 2015 2020Year
Pow
er c
onsu
mpt
ion
(TW
h)
Forecasted demandActual demand
Electricity demand : stable growth expected in the Netherlands, slowing growth expected in Belgium
• Stable growth in demand is expected in the Netherlands, slowing growth in Belgium
• Long term impact of current economic downturn on the one side, and development of mass-demand technologies such as heat pumps and electrical transport is unclear
* http://www.entsoe.eu/_library/news/UCTE_SAF-2009-2020_Report.pdf** Source: Datamonitor 2009
0
20
40
60
80
100
120
1990 1995 2000 2005 2010 2015 2020
Pow
er c
onsu
mpt
ion
(TW
h)
Forecasted demand Actual demand
B
**
0
0,5
1
1,5
2
2,5
2009-2010 2010-2015 2015-2020
FR BE NL
Annual average change in electricity demand in % * NL

Vattenfall Capital Markets Day, 23 September 200919© Vattenfall AB
Gas: increased demand expected in all countries
Source: Datamonitor 2009
• Demand to small and retail customers is expected to slightly decrease in the NL due to increasing efficiency in energy consumption. However demand for industries and power stations is continuing to rise
• In Belgium, demand is expected to grow for all segments. The main growth area is the gas used by power stations due to new developments
0
0,5
1
1,5
2
2,5
3
2009 2010-2015
FR BE NL
Annual average increase in gas demand in %
0
10
20
30
40
50
60
1990
1992
1994
1996
1998
2000
2002
2004
2006
2008
2010
2012
2014
Year
Annu
al g
as c
onsu
mpt
ion
(bcm
)
NL
02468
101214161820
1990
1992
1994
1996
1998
2000
2002
2004
2006
2008
2010
2012
2014
Year
Annu
al g
as c
onsu
mpt
ion
(bcm
)
B

Vattenfall Capital Markets Day, 23 September 200920© Vattenfall AB
High level view on renewables in BG Benelux core countries
Netherlands
Strive to meet renewables targets in the NL (based on EU target) by
Belgium
Invest to meet renewables obligations in Belgium, since the costs of non-compliance are too high and the penalty system is expected to remain in place and good incentive
Investing in onshore wind generation ASAP*Developing offshore wind opportunitiesDeveloping biomass cofiring opportunitiesHaving a large enough funnel of options to meet any reasonable target, mostly investing post 2012 but preparing today
* Wind activities are managed by BG Pan Europe

Vattenfall Capital Markets Day, 23 September 200921© Vattenfall AB
Security of supply / shortage in Dutch generation in combination with an ageing asset base
0
500
1000
1500
2000
2500
3000
3500
4000
2008 2009 2010 2011 2012 2013 2014
Evolution BG Benelux generation portfolio without replacement*MW
Note: * based on large scale generation units
** based on current estimates volumes BP sales 2010-2012
16500
17000
17500
18000
18500
19000
19500
20000
20500
21000
2009 2010 2011 2012
Evolution Sales portfolio in the NL**
Some plants in BG Benelux‘ portfolio are expected to be decommissioned during the Business planning period while sales volumes are expected to grow driven by the B2B segment
BG Benelux‘ strategy is to have a balanced position between supply and generation and to maintain its market share in generation, therefore replacement of current generation is planned
GWh