vashon-maury island 2006 water resources data report
TRANSCRIPT

Vashon-Maury Island 2006 Water Resources
Data Report Part of the Water Resources Evaluation Project
April 2007
Alternate Formats Available 206-296-7380 TTY Relay: 711

Vashon-Maury Island 2006 Water Resources Data Report Part of the Water Resources Evaluation Project
Submitted by: Eric W. Ferguson King County Water and Land Resources Division Department of Natural Resources and Parks
Department of Natural Resources and ParksWater and Land Resources Division201 S Jackson St. Ste 600Seattle, WA 98104(206) 296-6519

VMI 2006 Water Resources Data Report
King County i April 2007
Citation King County. 2007. Vashon-Maury Island 2006 Water Resources Data Report. Prepared by
Eric W. Ferguson, Water and Land Resources Division. Seattle, Washington.

VMI 2006 Water Resources Data Report
King County ii April 2007
Table of Contents Executive Summary ....................................................................................................................... vi
1.0. Introduction......................................................................................................................... 1
1.1 Overview......................................................................................................................... 1
1.2 2006 Monitoring Activities............................................................................................. 2
2.0. Precipitation ........................................................................................................................ 4
2.1 Precipitation sites ............................................................................................................ 4
3.0. Surface Water Monitoring .................................................................................................. 5
3.1 Stream gauging sites ....................................................................................................... 5
3.2 Stream water quality sites ............................................................................................... 5
4.0. Groundwater Monitoring .................................................................................................... 6
4.1 Water Level Monitoring ................................................................................................. 6
4.1.1 Volunteer sites ........................................................................................................ 6
4.1.2 Water quality sites................................................................................................... 6
4.1.3 Water level survey .................................................................................................. 6
4.1.4 Monitoring wells..................................................................................................... 6
4.2 Water Quality Monitoring............................................................................................... 7
5.0. Discussion........................................................................................................................... 8
5.1 Gauging Activities .......................................................................................................... 8
5.1.1 Precipitation sites .................................................................................................... 8
5.1.2 Stream sites ............................................................................................................. 8
5.2 Groundwater Activities................................................................................................... 9
5.2.1 Volunteer Sites........................................................................................................ 9
5.2.2 Water level survey .................................................................................................. 9

VMI 2006 Water Resources Data Report
King County iii April 2007
5.2.3 Dedicated monitoring wells .................................................................................. 10
5.2.4 Water quality monitoring...................................................................................... 10
6.0. References......................................................................................................................... 11
Figures Figure 1. Locations of all gauging (precipitation, continuous stream, and crest/staff) activities on
Vashon-Maury Island............................................................................................................ 12
Figure 2 (a-b). Accumulated daily totals of precipitation for all sites on Vashon-Maury Island.13
Figure 3. Hydrograph of daily total stream flows (median, maximum and minimum) and the range of values of the maximum and minimum for the Judd Creek site, gauge site id# 28A................................................................................................................................................ 14
Figure 4. Hydrograph of daily total stream flows (median, maximum and minimum) for the Judd Creek site, gauge site id# 28A. ............................................................................................. 14
Figure 5. Hydrograph of daily total stream flows (median, maximum and minimum) and the range of values of the maximum and minimum for the Shingle Mill Creek site, gauge site id# 43A.................................................................................................................................. 15
Figure 6. Hydrograph of daily total stream flows (median, maximum and minimum) for the Shingle Mill Creek site, gauge site id# 43A. ........................................................................ 15
Figure 7. Hydrograph of daily total stream flows (median, maximum and minimum) for the Tahlequah Creek site, gauge site id# 65A. ........................................................................... 16
Figure 8. Hydrograph of daily total stream flows (median, maximum and minimum) for the Fisher Creek site, gauge site id# 65B.................................................................................... 16
Figure 9. Hydrograph of daily total stream flows (median, maximum and minimum) for the Green Valley Creek site, gauge site id# 65C. ....................................................................... 17
Figure 10. The groundwater monitoring sites on Vashon-Maury Island..................................... 18
Figure 11. Hydrograph of water level (depth to water) measurements of the volunteer sites on VMI in 2006.......................................................................................................................... 19
Figure 12. Depth to water (DTW) measurements in feet below land surface for the volunteer monitoring sites since 2001. ................................................................................................. 20

VMI 2006 Water Resources Data Report
King County iv April 2007
Figure 13. Water Table Elevations for site VAS_w-60, North Vashon, based on continuous levelogger water level data and manual depth to water measurements. ............................... 21
Figure 14. Water Table Elevations for site VAS_w-61, Valley Center Park-n-Ride 2” well, based on continuous levelogger water level data and manual depth to water measurements................................................................................................................................................ 21
Figure 15. Water Table Elevations for site VAS_w-63, Redding Beach Rd, based on continuous levelogger water level data and manual depth to water measurements. ............................... 22
Figure 16. Water Table Elevations for site VAS_w-64, Wax Orchard Rd @ Vashon Hwy, based on continuous levelogger water level data and manual depth to water measurements. ....... 23
Figure 17. Water Table Elevations for site VAS_w-65, Valley Center Park-n-Ride 6” well based on continuous levelogger water level data and manual depth to water measurements. ....... 23
Figure 18. Precipitation contours based on data collected on Vashon-Maury Island (VMI). ..... 24
Figure 19. Water Table contour map of the Qva aquifer for May/June 2006. ............................ 25
Tables Table 1. List of Precipitation Gauge Sites on Vashon-Maury Island. ......................................... 26
Table 2. Difference in rainfall totals for October, November and December for 2005 to 2006.. 26
Table 3. An annual summary of flow data for all continuous stream gauge sites on Vashon-Maury Island. ........................................................................................................................ 27
Table 4. List of parameters sampled as part of the surface water water quality monitoring started in November 2006................................................................................................................. 27
Table 5. Volunteer Water Level sites and depth to water measurement data for 2006. .............. 28
Table 6. Water level measurements for water quality sites on Vashon-Maury Island for 2006.. 28
Table 7. Water level data from the locations used in the 2006 Island-wide water level survey.. 29
Table 8. Water level measurements at the dedicated groundwater monitoring wells on VMI.... 31
Table 9. Environmental Indicators – Arsenic, Chloride, and Nitrate-Nitrate – sampling results at the 19 long-term monitoring sites. ........................................................................................ 33
Table 10. Arsenic Speciation results for selected location on Vashon-Maury Island. ................ 33

VMI 2006 Water Resources Data Report
King County v April 2007
Table 11. Rainfall Summary for Water Year: 2006..................................................................... 34
Table 12. Comparison of Total Stream Flow by water year (WY) for all continuous stream gauge sites on Vashon-Maury Island.................................................................................... 34
Table 13. The relative change of the annual average (in feet) from the baseline of the depth to water measurements done in 2003 to 2006 for the five long-term water level sites. ........... 35
Appendices Appendix A Precipitation Data ………………………….……………………………………..36
Appendix B Water Quality Data ……………………………………….………………………47

VMI 2006 Water Resources Data Report
King County vi April 2007
EXECUTIVE SUMMARY King County Water and Land Resource Division (WLRD) has been monitoring precipitation, stream gauging and groundwater on Vashon-Maury Island (VMI) for a number of years in an effort to better describe the water budget and overall water quality. This report summarizes the monitoring activities completed in 2006 for the Water Resource Evaluation (WRE) Project.
The number of precipitation sites has increased from two to five. A variation of 11 inches was observed across the island and four out of the five sites recorded more rainfall than Sea-Tac airport, the area reference. Site 28Y, West Judd Creek (at the transfer station), recorded the most rainfall at 46.8 inches per water year (October 1 to September 30). The East Maury Island site, 36V, recorded the least amount of rainfall at 35.8 inches per water year. The Sea-Tac annual total precipitation for the 2006 water year was 39.5 inches which is ~7% above the annual average of 37.2 inches (based on historic data 1971-2000). The wet fall season of 2006 was recorded at all sites. The rainfall totals for October-December 2006 ranged from 18.2 to 33.9 inches. Typically these months have rainfall totals from 13 to 19 inches. A new precipitation map has been created based on the data collected on VMI. This new map of rainfall contours changes the shape of the previous vertical banding. The range of precipitation also changed from 45 to 35 inches/year to 49 to 36 inches/year.
Stream gauging activities continued on VMI in 2006. The totals (Qt) from water year 2006 increased from the previous year for all sites. The totals from WY2005 were the second lowest in the recorded history of each site. The increase observed in this water year data coincides with increases in the precipitation data.
In the fall of 2006, stream quality sampling started at seven sites. A short-term (14 month) assessment of the water quality of Shingle Mill, Christian, Tahlequah, Fisher, Judd, Mileta, and Gorsuch Creeks began in November 2006. The two sampling events in 2006 are insufficient to describe the water quality of the streams on VMI. The parameters of interest are a short list of conventionals, nutrients, and microbiology. This list of parameters is comparable to other stream sampling done in King County.
In 2006, groundwater water level monitoring activities were expanded across the island by continued support of the volunteers who monitor their own well water levels, added additional volunteers, conducted an Island-wide survey, and installation of continuous monitoring devices in our dedicated monitoring wells. A new map of groundwater elevation within the Vashon Advance Outwash (Qva) aquifer is presented based on the average of these water level measurements.
The volunteers have been monitoring their wells monthly since 2001 and this allows for assessment of trends for selected areas on VMI. A baseline has been established by averaging all measurements taken between 2001 and 2002. The data for two sites, GWL_w-06 & GWL_w-09, show increasing depth to water between 2003 to 2006. Site GWL_w-01 has increased depth to water measurements when compared to the baseline, yet the trend from 2003 to 2006 is with smaller increases (closer to the baseline) each year. The other two sites show a varying difference from year to year. Two new sites have been added to this network.

VMI 2006 Water Resources Data Report
King County vii April 2007
A large water level survey on VMI was conducted in May/June to better define groundwater flow in the major island aquifers. A total of 29 locations were measured in this Island-wide survey.
Continuous recording water level devices (Levelogger®) were installed in the dedicated monitoring wells in 2006. Manual water level measurements were recorded at these locations throughout the year to help calibrate the water table measurements.
The groundwater water quality sampling, completed in June, included the Environmental Indicators of Arsenic, Chloride, and Nitrate + Nitrite at the 19 long-term monitoring locations. These sites have been monitored by King County WLRD since 2001. Overall, the water quality of the groundwater on VMI is very good. The concentrations of these parameters were similar to the results in the previous 7 rounds of sampling.
Additional parameters were analyzed in 2006 as part of a 3-year rotation of special sampling. The focus of this sampling was speciation of dissolved Arsenic. The dissolved Arsenic in groundwater typically is in 2 different states: As(III) – Arsenite – H3AsO3 or As(V) – Arsenate – H2AsO4 . Only six sites were sampled for this special testing and they were chosen based on their average Arsenic concentration being above the reporting limit of 0.0025 mg/L or 2.5 µg/L. Five of six sites have As(III) as the majority of the dissolved Arsenic.
The precipitation, stream gauging and groundwater monitoring activities of the WRE project will continue in 2007. The data collected will be presented in a similar report and on the King County web pages.

VMI 2006 Water Resources Data Report
King County 1 April 2007
1.0. INTRODUCTION The Water Resource Evaluation Project is intended to cover monitoring, modeling, and data management activities within Vashon-Maury Island (VMI) for seven years (2004-2010). As part of this work, an annual data report of monitoring activities is summarized in this report. The structure of the report is as follows: Section 1.0 – Introduction and Overview; Section 2.0 – Precipitation; Section 3.0 – Surface Water Monitoring; Section 4.0 – Groundwater Monitoring; Section 5. 0 – Discussion.
1.1 Overview Vashon-Maury Island is an island that lies in the Puget Lowland encompassing about 36 square miles. All drinking water sources on the island (springs, surface water, and groundwater) are supplied by precipitation. Groundwater is the portion of precipitation that soaks into the ground and gets stored in underground geological water systems called aquifers. Every groundwater system is unique and dependent upon external factors such as the rate of precipitation, the interaction of groundwater with the streams and other surface water bodies, and the rate of evapotranspiration. These external factors all contribute to the overall water budget. Understanding the water budget for VMI and changes occur in response to human activities and climate changes is important in determining the amount of drinking water that can be used on a sustained basis.
A long-term plan that describes and evaluates the different components of the VMI water budget is being implemented to address needs and concerns identified by residents of VMI and King County staff. Much interest has been expressed over the years in the sustainability of the water supply on the island, although to date there has not been a comprehensive study to address many major water supply issues.
The work plan of the Water Resources Evaluation Project is designed to provide a scientific evaluation of the water supply issues (both water quantity and quality related) on VMI. The work plan can be found at: http://dnr.metrokc.gov/wlr/WQ/vashon-island/pdf/Vashon-Maury-Island-plan.pdf. The work plan for the VMI Water Resources Evaluation has four main objectives:
1. To monitor Vashon-Maury Island groundwater and surface water quantity and quality to record and identify changes over time;
2. To build a comprehensive groundwater flow model that evaluates groundwater and surface water quantity and quality under various climate change and land-use scenarios;
3. To satisfy the goals of the countywide data management work plan for the Vashon-Maury Island region; and
4. To coordinate activities with the Vashon-Maury Island Groundwater Protection and Land Use Committees, the WRIA 15 watershed planning unit, and the citizens of Vashon Maury Island.

VMI 2006 Water Resources Data Report
King County 2 April 2007
To satisfy the objectives of this project, the work is being done in four major areas. The first three areas, monitoring, modeling, and data management are closely interrelated and must be responsive to each other to satisfy the first three objectives of this work plan. The last area, project communication, addresses the fourth and final objective.
1.2 2006 Monitoring Activities Groundwater, surface water, and precipitation are being monitored in an effort to better describe the VMI water budget and overall water quality. Monitoring efforts on VMI will serve three purposes (1) to identify changes and trends in groundwater and surface water quantity and quality, (2) to provide necessary data for model development and calibration, and (3) to have an early warning system on the impacts of pollution sources and groundwater extraction. This monitoring will be conducted by a combination of King County (KC) staff, volunteers, and consultant contracts. Data collected in previous years have been presented in several different formats. The precipitation and stream-flow gauging data have been available via request and web site: http://dnr.metrokc.gov/wlr/waterres/hydrology/GaugeSelect.aspx. The groundwater data collected in previous years was presented in a report summarizing all of King County’s groundwater monitoring, (King County, 2005) and is available at the website: http://dnr.metrokc.gov/wlr/wq/groundwater-sampling-plans.htm. The following sections give brief descriptions of the data and outline the major monitoring tasks.
Precipitation
A combination of volunteers on VMI and KC Staff recorded precipitation values. KC Staff installed continuous precipitation gages at selected gage locations, see section 2.1. Volunteers will be used to supplement this data. King County will provide the equipment for the volunteers and King County staff will train the volunteers on the proper protocol. Locations have been based on availability of volunteers and modeling requirements.
Stream-flow gauging
Stream gauging continued on the creeks of Vashon-Mary Island in 2006. Judd Creek and Shingle Mill Creek have been monitored as part of the existing KC Department of Natural Resources and Parks stream-gauge network. Three additional streams have been added into the continuous stream-gage network, see section 3.1.
Stream water quality collection
Seven streams are being sampled for a selected set of water quality parameters. The work is a short term (~14 months) project to assess the water quality. Additional information and location provided in section 3.2.
Water level survey
An extensive water level survey on VMI was conducted to better define groundwater flow in the major island aquifers, see section 4.1. The water level measurements were taken at all the wells within a short period of time (around 1 week) so that the hydraulic heads in the aquifer are

VMI 2006 Water Resources Data Report
King County 3 April 2007
measured under the same hydrologic conditions. Groundwater contour maps for the major aquifers on VMI will be generated with the results of survey.
Water-level measurements in dedicated monitoring wells
Dedicated groundwater-monitoring wells were drilled and installed throughout VMI. The locations of these wells were determined on the need for additional data at these locations. The Phase I groundwater model helped to determine where data gaps existed.
During drilling, soil samples were collected and a boring log describing subsurface soils completed. After installation and development, these wells will be equipped with automatic water level recorders or data loggers that monitor water level fluctuations on a continuous basis, see section 4.1.4. Water-level measurements will be downloaded from the data loggers twice per year by KC staff.
Groundwater quality sample collection
This task involves collecting groundwater samples from our long-term well locations. These sites are currently 20 public supply/private wells that have been sampled since 2001, see section 4.2. The current water quality program has a set of environmental indicators, Arsenic; Chloride; and Nitrate + Nitrite, that are sampled annually at all sites. At selected sites, the type of arsenic present was determined or “speciated,” see section 4.2, for all results.

VMI 2006 Water Resources Data Report
King County 4 April 2007
2.0. PRECIPITATION This type of gauging activity on Vashon-Maury Island (VMI) was expanded in 2005 as part of the Water Resources Evaluation Project. This increased effort is needed to help establish a baseline of conditions as well highlight the variety of conditions across the island.
2.1 Precipitation sites Five sites are currently being monitored for precipitation across VMI. The locations of the gauging sites are shown in Figure 1 and listed in Table 1. The data from Sea-Tac airport is also included in Table 1 as an area reference.
The data presented in Table 1 is summarized as total precipitation (inches per year). The annual total can be calculated in two different ways, Water Year (WY) – October 1st to September 30th or Calendar Year (CY) – January 1st to December 31st. Accumulated daily totals of precipitation for both ways of calculating annual totals are presented in Figure 2.
Site 28Y, West Judd Creek, had the maximum amount of rain 46.8 in/yr for the Water year, Table 1, Figure 2 and Appendix A. Site 43U, North Vashon, has the most rain for the calendar year at 59.2 in/yr. Site 36V, East Maury Island, had the least amount of rain fall for the Water Year and the Calendar Year with totals of 35.8 and 40.1 in/yr, respectively.
The Water Year and Calendar Year totals are different due to the significant rain fall that occurred in the fall 2006. The total amount of rainfall for these 3 months (October, November and December) ranged from 18.2 to 33.9 inches, Table 2. These amounts translate into 50 to 70% of the annual average rainfall for the year.

VMI 2006 Water Resources Data Report
King County 5 April 2007
3.0. SURFACE WATER MONITORING
3.1 Stream gauging sites Two creeks on VMI, Judd Creek and Shingle Mill Creek, are monitored as part of the existing KC DNRP stream-gage network. Three additional streams were added into the continuous stream-gage network in 2004 and early 2005. All gauging locations are shown in Figure 1 and the continuous gauging sites are listed in Table 3.
A comparison of total stream flow, Qt, measured in the water year (Oct-Sep) versus calendar year (Jan-Dec) shows a difference of ~30 percent for the only site (Shingle Mill Creek) that had a complete record, Table 3. The total flow measured in the calendar year was greater due to the increased precipitation during October-December 2006. The other 4 sites had equipment difficulties that did not allow for flow measurements after late November 2006. The gauging site at Green Valley had the gauging site washed out several times during the year which yield many “estimated” flow periods.
The median, maximum and minimum flows recorded were similar independent of the 12-month time period, WY vs. CY. Table 3 contains these flow measurements that were the maximum or the minimum. The hydrographs (total daily flow versus time) for all the continuous sites are presented in Figures 3-9.
3.2 Stream water quality sites Surface water quality is one area of the overall water resources of Vashon-Maury Island that has not been monitored. Very little data has been collected to assess the status of the quality of the stream water on the island with the exception of source water locations (Beall and Ellis Creeks). In late 2006, water quality sampling started at 7 stream locations across Vashon-Maury Island, see Figure 1. A short-term (14 month) assessment of the water quality of Shingle Mill, Christian, Tahlequah, Fisher, Judd, Mileta, and Gorsuch Creeks began in November 2006. The parameters of interest are a short list of conventionals, nutrients and microbiology, see Table 4. This list of parameters is comparable to other stream sampling done in King County.

VMI 2006 Water Resources Data Report
King County 6 April 2007
4.0. GROUNDWATER MONITORING A major part of the Water Resources Evaluation (WRE) project focuses on the groundwater on Vashon-Maury Island (VMI). This project is expanding the water level and water quality monitoring across the island to better understand the local variations.
4.1 Water Level Monitoring In 2006, the WRE project continued the water level monitoring by supporting the volunteers who monitor their own well water levels, adding new volunteers, conducted an Island-wide survey, and installing continuous recording devices in our dedicated monitoring wells.
4.1.1 Volunteer sites The volunteer sites are five individuals that have monitored water levels in their own wells since 2001. Two new sites started in 2006. The measurements are typically taken once a month and reported to KC staff via e-mail. These locations are shown in Figure 10. The data are presented in Table 5 and shown in Figure 11. Two of the sites, GWL_w-01 and GWL_w-06, have very small fluctuations in the measurements during the year with changes in the range of tenths of a foot, Figure 11 and Table 5. The other five sites show a typical hydrograph with smaller depth to water measurements in late spring and greater measurements in late summer/early fall, Figure 11 and Table 5.
4.1.2 Water quality sites Nine sites of the 19 sites that are sampled for water quality have availability for water levels to be taken. These locations are identified with a unique symbol in Figure 10. During the water quality sampling event in June, water level measurements were taken, Table 6. These sites were also included in the Island-wide water level survey conducted in the fall, see next section.
4.1.3 Water level survey A water level survey on VMI continued in the May/June. A total of 29 locations were measured. The data are presented in Table 7.
4.1.4 Monitoring wells Six monitoring wells were drilled and installed in the fall of 2005, October–December. Water level measurements were taken at numerous times for these sites. Continuous water levels (Levelogger®) were installed in these locations in 2006. The locations of these monitoring wells are shown in Figure 10 and the depth to water data are presented in Table 8. The continuous data from each site are shown in Figure 13–17 with the exception of VAS_w-62 which is “dry”.

VMI 2006 Water Resources Data Report
King County 7 April 2007
4.2 Water Quality Monitoring The water quality sampling, done in June, included the Environmental Indicators of Arsenic, Chloride, and Nitrate + Nitrite at the 19 long-term monitoring locations, see Figure 10. These sites have been monitored by King County WLRD since 2001. The results of these parameters are presented in able 9 and Appendix A. Overall, the water quality of the groundwater on VMI is very good. The concentrations of these parameters were similar to the results in the previous 7 rounds of sampling, able 9.
This year additional testing as part of a 3-year rotation of additional sampling was focused on Arsenic speciation. The dissolved Arsenic in groundwater typically is in 2 different states: As(III) – Arsenite – H3AsO3 or As(V) – Arsenate – H2AsO4 . Only six sites with 2 replicates were sampled for this special testing, see the “red triangles” on Figure 10. These sites were chosen based on their average Arsenic concentration being above the reporting limit of 0.0025 mg/L or 2.5 µg/L, able 9. The King County Environmental Lab subcontracted with Brooks Rand to do the analyses. All sites had detected Arsenic concentrations and five of six sites have As(III) as the majority of the dissolved Arsenic, see Table 10.

VMI 2006 Water Resources Data Report
King County 8 April 2007
5.0. DISCUSSION This section of the report summarizes the data and provides a brief rationale of reasons why the activities are important to this project. If additional data was available, this section includes discussion of further interpretation.
5.1 Gauging Activities
5.1.1 Precipitation sites As mentioned in Section 2.1, there is a measurable difference in precipitation across the island with the least amount of rainfall being on Maury Island, Table 1, Table 2, 11 and Appendix A. The Water Year and Calendar Year totals are different due to the significant rain fall that occurred in the fall of 2006. The total amount of rainfall for these 3 months (October, November, and December) ranged from 18.2 to 33.9 inches, Table 2. These amounts translate into 50 to 70% of the annual average rainfall for the year. The Sea-Tac data also show a similar increase in rainfall amounts for this time period, Table 1.
The site, 36V – East Maury Island, is the driest portion of the island. Table 11 highlights the difference on the total precipitation by month for each site. The Sea-Tac data is less than all the Vashon-Maury Island sites except for 36V – East Maury Island highlighting the need to have numerous local sites to record the local variation.
The precipitation data collected to date allowed for a new precipitation map to be drawn for Vashon-Maury Island, Figure 18. This new mapping of rainfall contours changes the shape of the previous vertical banding. The range of precipitation also changed from 45 to 35 inches/year to 49 to 36 inches/year, Figure 18.
Rationale: Precipitation values are needed on a microclimatic scale to estimate recharge to the aquifer. It is necessary for a more realistic model input. Precipitation data also aid in the interpretation of water level changes in the monitoring wells.
5.1.2 Stream sites The gauging activities on VMI have been expanded as part of the WRE project. More sites are being monitored on a continuous basis. This increased monitoring is not without some difficulty. The site at Green Valley Creek has had the weir and gauging site altered by several large storms. The daily total stream flows from 01Sep2005 to 31Dec2006 for the five continuous gauge sites are presented in Figures 4, 6-9. These datasets show increased stream flow during the wet season October–May. The record precipitation during the fall of 2006 yielded equally high flows in nearly all the streams, Figures 4, 6–9.
A comparison of total stream flow data (Qt) for previous water years was done for all sites. Two sites; 28A – Judd Creek and 43A – Shingle Mill Creek have longer datasets and the totals (Qt) from water year 2006 are within the middle of the range of values recorded for each of these sites, Table 12. The other three sites, 65A – Tahlequah Creek, 65B – Fisher Creek and 65C –

VMI 2006 Water Resources Data Report
King County 9 April 2007
Green Valley Creek showed an increase of about 50% from the previous years data, Table 12. This is in part due to the fact that WY2005 was a dry year
Rationale: Other types of hydrologic information are a necessary part of any groundwater monitoring/modeling program. The stream-gage stations help describes the interaction of surface water and groundwater on VMI. It is important to understand how the groundwater levels are related to stream flows since many endangered and threatened species rely on stream flows for survival. Stream discharges are useful in examining the interaction between groundwater and surface water.
5.2 Groundwater Activities
5.2.1 Volunteer sites The volunteer sites have been monitoring their wells monthly since 2001 and this allows for assessment of trends for selected areas on Vashon-Maury Island. A baseline has been established by averaging all of measurements taken between 2001 and 2002. The number of water level measurements taken varies from 11 to 21 for this 24 month period. Establishing a baseline allows for a simple comparison of measurements to this number. Some limitations are present using this technique, such as the limited number of measurements used to establish the baseline number for a few sites. Another concern is the seasonal variation may not be accurately being measured, depending on when the baseline measurements were taken. Despite these limitations, the baseline does show trends when comparing the annual average of measurements taken, Table 13.
Table 13 shows the relative change of the annual average from the baseline in the depth to water measurements taken in 2003 through 2006. Two sites, GWL_w-06 & GWL_w-09, show a trend of increasing depth to water with time from 2003 to 2006. Site GWL_w-01 has increased depth to water measurements when compared to the baseline, yet the trend from 2003 to 2006 is with the increases becoming smaller (closer to the baseline) each year. The other two sites show a varying difference from year to year. Another way to visualize the data is to show the monthly depth to water (DTW) measurements versus time, Figure 12. This figure has three separate graphs of the volunteer sites with increasing depth to water on the left and the same annual time periods across the top. The purpose of this figure is to highlight the seasonal variation recorded at some sites as well as to display the steady increase of the DTW measurements for other sites.
5.2.2 Water level survey The Island-wide water level survey is a project activity to get islanders to participate in ongoing data collection. The greater number of locations involved allow for better control of determining and assessing the island-wide water table contours. The survey done in 2006 was done at 29 locations in May and June. A map of the water table elevations within the Qva (Main) aquifer are presented in Figure 19.
Rationale: This survey effort is necessary to contour the water levels in the major aquifers on VMI. This type of data also gives a better understanding about the patterns of groundwater flow, which is crucial to the development and assessment of an accurate groundwater model.

VMI 2006 Water Resources Data Report
King County 10 April 2007
5.2.3 Dedicated monitoring wells The dedicated monitoring wells were installed October through December 2005. A well data report was completed in 2006 and can be found on the web at: http://dnr.metrokc.gov/wlr/wq/WRE-welldata-report05.htm.
Water level measurements were taken throughout the year at these locations, Table 8. Continuous water level recorders (Levelogger®) were installed in each well throughout the year. The data from each type of water level reading are presented in Figures 13-17. This data presented yielded results that are not easily explained as seen in the atypical hygrographs of VAS_w-60 – Vashon Highway @145th Pl and VAS_w-64 – Wax Orchard Rd @ Vashon Hwy, Figure 13 and Figure 16, respectively. Both of these hydrographs yielded dramatic increases (~15+ feet) in the water table elevations for reasons currently unknown. Continued monitoring and research is being done to determine the cause of these observed features.
Rationale: To accurately monitor groundwater levels, you need dedicated monitoring wells that are unaffected by pumping. The installation of continuous water-level measurements allows for characterization of the magnitude, frequency, and cause of water-level fluctuations. Long-term water-level measurements serve as the primary data required for calibration and testing of groundwater models. Fluctuations in water levels will be used to calibrate and assess the Phase II (surface-groundwater) model. They are also required to assess the effects of climate variability and to monitor the effects of regional aquifer development.
5.2.4 Water quality monitoring The analytes that will be sampled over the course of this study have been grouped into three separate classes: environmental indicator, baseline, and special sampling. This year was another special sampling of selected sites and the focus was on Arsenic speciation, see section 4.2, Table 10 and Appendix A for complete results.
The environmental indicators of Arsenic, Chloride and Nitrate + Nitrite, were sampled at all sites with similar results as previous results, able 9. This year additional testing as part of a 3-year rotation of additional sampling was focused on Arsenic speciation. The dissolved Arsenic in groundwater typically is in 2 different states: As(III) – Arsenite – H3AsO3 or As(V) – Arsenate – H2AsO4 . Only six sites with 2 replicates were sampled for this special testing, see Figure 10. These sites were chosen based on their average Arsenic concentration being above the reporting limit of 0.0025 mg/L or 2.5 µg/L, able 9. All sites had detected Arsenic concentrations and five of six sites have As(III) as the majority of the dissolved Arsenic, see Table 10. It is important for islanders to determine which type of arsenic is present in their water prior to selecting a water treatment device. Those individuals with Arsenate (pentavalent arsenic) can select either reverse osmosis or distillation. Individuals with Arsenite (trivalent arsenic) can select distillation, or consider adding chlorine to their water to convert the trivalent arsenic to pentavalent arsenic.
Rationale: The three main reasons to implement routine monitoring of groundwater quality on VMI are to: (1) establish the natural baseline quality of the system to detect future changes; (2) have an early warning system on the impacts of pollution sources; and (3) identify trends in groundwater quality caused by natural events, the impact of diffuse pollution, and changes in the hydrologic regime.

VMI 2006 Water Resources Data Report
King County 11 April 2007
6.0. REFERENCES King County. 2004. Vashon-Maury Island Water Resources Evaluation Project – Work plan.
Prepared by Stephanie Brown, Water and Land Resources Division. Seattle, Washington.
King County. 2005. “Ambient Groundwater Monitoring -- 2001-2004 Results.” Prepared by Anchor Environmental and King County Dept of Natural Resources and Parks, Water and Land Resources Division. Seattle, Washington.
King County. 2006. Vashon-Maury Island 2005 Water Resources Data Report. Prepared by Eric W. Ferguson, Water and Land Resources Division. Seattle, Washington.

Vash
on
Hw
y S
W
Vash
on
Hw
y SW
Be a
ll R
d
SW
SW Cove Rd
SW Bank Rd
SW Cemetery Rd
SW 220th St
SW 240th St
107t
h A
ve S
W O
ld M
ill R
d S
W
Wax
Orc
har
d R
d
Vashon H
wy
SW
Doc
kton
Rd
SW
SW Point Robinson Rd
Qua
rter
mas
ter
Har
bo
r
Puget Sound
VASHON-MAURYISLAND
April 2007
0 1/2 1 Mile
N
The information included on this map has been compiled from a variety of sources and is subject to change without notice. King County makes no representations or warranties, express or implied, as to accuracy, completeness, timeliness, or rights to the use of such information. King County shall not be liable for any general, special, indirect, incidental, or consequential damages including, but not limited to, lost revenues or lost profits resulting from the use or misuse of the information contained on this map. Any sale of this map or information on this map is prohibited except by written permission of King County.
Map produced by King County DNRP WLR GIS and Visual Communications & Web UnitFile name: 0704vmiGWmaps.ai wgab Data Sources: King County Datasets
65C
65A
65B
28A
43A
VA23
VA12A
VA37
VA41A
VA42A
VA45A
VA65A
65U
36V
36U
28Y
43U
GAUGING ACTIVITIESFigure 1
Stream Gauge
Active Precipitation Gauge
Stream Water Quality Site
Basin Boundary
Stream
12
VMI 2006 Water Resources Data Report

VMI 2006 Water Resources Data Report
King County 13 April 2007
0
5
10
15
20
25
30
35
40
45
50
1-Oct 31-Dec 1-Apr 1-Jul 30-Sep2006 Water Year (Oct-Sep)
Prec
ipita
tion
tota
l (in
/yr)
28Y - West Judd Creek 36U - Maury Island 36V - East Maury Island43U - North Vashon 65U - South Vashon
2a. Accumulated daily totals of precipitation (inches/year) for the 2006 Water Year (October to September)
0
10
20
30
40
50
60
1-Jan 2-Apr 2-Jul 1-Oct 31-Dec2006 Calendar Year (Jan-Dec)
Prec
ipita
tion
tota
l (in
/yr)
28Y - West Judd Creek 36U - Maury Island 36V - East Maury Island43U - North Vashon 65U - South Vashon
2b. Accumulated daily totals of precipitation (inches/year) for the 2006 Calendar Year (January to December)
Figure 2 (a-b). Accumulated daily totals of precipitation for all sites on Vashon-Maury Island. Figure 2a displays the data on a Water Year (October to September) time scale while Figure 2b displays the data on a Calendar Year (January to December) time scale.

VMI 2006 Water Resources Data Report
King County 14 April 2007
0
50
100
150
200
10/1/05 1/1/06 4/1/06 7/1/06 10/1/06Date
Q (c
fs)
28a_mean 28a_max 28a_min Max_Q_range Min_Q_range
Figure 3. Hydrograph of daily total stream flows (median, maximum and minimum) and the range of values of the maximum and minimum for the Judd Creek site, gauge site id# 28A. The time period shown is for the water year (01Oct05 to 30Sep06).
0
50
100
150
200
10/1/2005 12/31/2005 4/1/2006 7/1/2006 10/1/2006 12/31/2006
Date
Q (c
fs)
28A_mean 28A_max 28A_min
Figure 4. Hydrograph of daily total stream flows (median, maximum and minimum) for the Judd Creek site, gauge site id# 28A. The time period shown is from 01Oct2005 to 31Dec2006. NOTE: data was not collected after 22Nov06 due equipment problems.

VMI 2006 Water Resources Data Report
King County 15 April 2007
0
50
100
150
200
250
300
10/1/05 1/1/06 4/1/06 7/1/06 10/1/06
date
Q (c
fs)
43A_mean 43A_max 43A_min Max_Q_range Min_Q_range
Figure 5. Hydrograph of daily total stream flows (median, maximum and minimum) and the range of values of the maximum and minimum for the Shingle Mill Creek site, gauge site id# 43A. The time period shown is for the water year (01Oct05 to 30Sep06).
0
50
100
150
200
250
10/1/2005 12/31/2005 4/1/2006 7/1/2006 10/1/2006 12/31/2006
Date
Q (c
fs)
43A_mean 43A_max 43A_min
Figure 6. Hydrograph of daily total stream flows (median, maximum and minimum) for the Shingle Mill Creek site, gauge site id# 43A. The time period shown is from 01Oct2005 to 31Dec2006.

VMI 2006 Water Resources Data Report
King County 16 April 2007
0
5
10
15
20
25
30
10/1/2005 12/31/2005 4/1/2006 7/1/2006 10/1/2006 12/31/2006
Date
Q (c
fs)
65A_mean 65A_max 65A_min
Figure 7. Hydrograph of daily total stream flows (median, maximum and minimum) for the Tahlequah Creek site, gauge site id# 65A. The time period shown is from 01Oct05 to 31Dec06.
0
5
10
15
20
25
30
10/1/2005 12/31/2005 4/1/2006 7/1/2006 10/1/2006 12/31/2006
Date
Q (c
fs)
65B_mean 65B_max 65B_min
Figure 8. Hydrograph of daily total stream flows (median, maximum and minimum) for the Fisher Creek site, gauge site id# 65B. The time period shown is from 01Oct05 to 31Dec06.

VMI 2006 Water Resources Data Report
King County 17 April 2007
0
1
2
3
4
5
6
10/1/05 12/31/05 4/1/06 7/1/06 10/1/06 12/31/06
Date
Q (c
fs)
65C_mean 65C_max 65C_min
Figure 9. Hydrograph of daily total stream flows (median, maximum and minimum) for the Green Valley Creek site, gauge site id# 65C. The time period shown is from 01Oct05 to 31Dec06. NOTE: data was not collected during many periods of record during this time period due to equipment problems.

Vash
on
Hw
y S
W
Vash
on
Hw
y SW
Be a
ll R
d
SW
SW Cove Rd
SW Bank Rd
SW Cemetery Rd
SW 220th St
SW 240th St
107t
h A
ve S
W O
ld M
ill R
d S
W
Wax
Orc
har
d R
d
Vashon H
wy
SW
Doc
kton
Rd
SW
SW Point Robinson Rd
Qua
rter
mas
ter
Har
bo
r
Puget Sound
VASHON-MAURYISLAND
April 2007
0 1/2 1 Mile
N
The information included on this map has been compiled from a variety of sources and is subject to change without notice. King County makes no representations or warranties, express or implied, as to accuracy, completeness, timeliness, or rights to the use of such information. King County shall not be liable for any general, special, indirect, incidental, or consequential damages including, but not limited to, lost revenues or lost profits resulting from the use or misuse of the information contained on this map. Any sale of this map or information on this map is prohibited except by written permission of King County.
Map produced by King County DNRP WLR GIS and Visual Communications & Web UnitFile name: 0704vmiGWmaps.ai wgab Data Sources: King County Datasets
VAS_W-64
VAS_W-63
VAS_W-62
VAS_W-61
VAS_W-65
VAS_W-60
S-03
W-21
W-20
W-19
W-17
W-15W-14
W-13
W-12
W-11
W-08
W-07
GWL_w-32GWL_w-33
W-06
W-04
W-03
W-16a
W-10a
W-09a
W-02a
VAS_w-55
GWL_w-31
GWL_w-30
GWL_w-29
GWL_w-27GWL_w-26
GWL_w-15
GWL_w-19
GWL_w-04
GWL_w-09
GWL_w-13
GWL_w-06
GWL_w-02
GROUNDWATER MONITORINGWater Quality Site
Water Quality Site (Arsenic)
King County Monitoring Well
Water Level Survey Site
Basin Boundary
Stream
Figure 10
18
VMI 2006 Water Resources Data Report

VMI 2006 Water Resources Data Report
King County 19 April 2007
100
120
140
160
180
200
220
240
1/1/06
1/31/0
6
3/2/06
4/2/06
5/2/06
6/2/06
7/2/06
8/2/06
9/1/06
10/1/
06
11/1/
06
12/1/
06
date
DTW
(ft)
GWL_w-02 GWL_w-01 GWL_w-13 GWL_w-06 GWL_w-09
Figure 11. Hydrograph of water level (depth to water) measurements of the volunteer sites on VMI in 2006.

VMI 2006 Water Resources Data Report
King County 20 April 2007
100
105
110
115
120
1/1/01
1/1/02
1/1/03
1/1/04
1/1/05
1/1/06
1/1/07
DTW
(ft)
GWL_w-02 GWL_w-01
135
140
145
150
155
160
165
1/1/01
1/1/02
1/1/03
1/1/04
1/1/05
1/1/06
1/1/07
DTW
(ft)
GWL_w-13
GWL_w-06
200
205
210
215
220
1/1/01
1/1/02
1/1/03
1/1/04
1/1/05
1/1/06
1/1/07
date
DTW
(ft)
GWL_w-09
Figure 12. Depth to water (DTW) measurements in feet below land surface for the volunteer monitoring sites since 2001.

VMI 2006 Water Resources Data Report
King County 21 April 2007
175
180
185
190
195
200
205
210
215
220
225
1-Oct-05 31-Dec-05 1-Apr-06 1-Jul-06 1-Oct-06 31-Dec-06
Date
WL
Elev
(ft)
VAS_w-60 VAS_w-60_WL
Figure 13. Water Table Elevations for site VAS_w-60, North Vashon, based on continuous Levelogger water level data and manual depth to water measurements. Levelogger data collection started 06Nov2006. Depth to water measurements are presented as points for the dates measured, Table 8.
235
237
239
241
243
245
1-Oct-05 31-Dec-05 1-Apr-06 1-Jul-06 1-Oct-06 31-Dec-06
Date
WL
Elev
(ft)
VAS_W-61 VAS_w-61_WL
Figure 14. Water Table Elevations for site VAS_w-61, Valley Center Park-n-Ride 2” well, based on continuous Levelogger water level data and manual depth to water measurements. Levelogger data collection started 15Feb2006. Depth to water measurements are presented as points for the dates measured, Table 8.

VMI 2006 Water Resources Data Report
King County 22 April 2007
Note VAS_W-62 does not have data presented due to the lack of water in the screen zone.
175
177
179
181
183
185
1-Oct-05 31-Dec-05 1-Apr-06 1-Jul-06 1-Oct-06 31-Dec-06
Date
WL_
elev
(ft)
VAS_w-63 VAS_w-63_WL
Figure 15. Water Table Elevations for site VAS_w-63, Redding Beach Rd, based on continuous Levelogger water level data and manual depth to water measurements. Levelogger data collection started 04May2006. Depth to water measurements are presented as points for the dates measured, Table 8.

VMI 2006 Water Resources Data Report
King County 23 April 2007
216
218
220
222
224
226
228
230
232
234
236
1-Oct-05 31-Dec-05 1-Apr-06 1-Jul-06 1-Oct-06 31-Dec-06
Date
WL_
elev
(ft)
VAS_w-64 VAS_w-64_WL
Figure 16. Water Table Elevations for site VAS_w-64, Wax Orchard Rd @ Vashon Hwy, based on continuous Levelogger water level data and manual depth to water measurements. Levelogger data collection started 06Nov2006. Depth to water measurements are presented as points for the dates measured, Table 8.
235
237
239
241
243
245
1-Oct-05 31-Dec-05 1-Apr-06 1-Jul-06 1-Oct-06 31-Dec-06
Date
WL_
elev
(ft)
VAS_w-65 VAS_w-65_WL
Figure 17. Water Table Elevations for site VAS_w-65, Valley Center Park-n-Ride 6” well based on continuous Levelogger water level data and manual depth to water measurements. Levelogger data collection started 15Feb2006. Depth to water measurements are presented as points for the dates measured, Table 8.

Vash
on
Hw
y S
W
Vash
on
Hw
y SW
Be a
ll R
d
SW
SW Cove Rd
SW Bank Rd
SW Cemetery Rd
SW 220th St
SW 240th St
107t
h A
ve S
W O
ld M
ill R
d S
W
Wax
Orc
har
d R
d
Vashon H
wy
SW
Doc
kton
Rd
SW
SW Point Robinson Rd
Qua
rter
mas
ter
Har
bo
r
Puget Sound
VASHON-MAURYISLAND
April 2007
0 1/2 1 Mile
N
The information included on this map has been compiled from a variety of sources and is subject to change without notice. King County makes no representations or warranties, express or implied, as to accuracy, completeness, timeliness, or rights to the use of such information. King County shall not be liable for any general, special, indirect, incidental, or consequential damages including, but not limited to, lost revenues or lost profits resulting from the use or misuse of the information contained on this map. Any sale of this map or information on this map is prohibited except by written permission of King County.
Map produced by King County DNRP WLR GIS and Visual Communications & Web UnitFile name: 0704vmiGWmaps.ai wgab Data Sources: King County Datasets
65U
36V
36U
28Y
43U
36
37
38
39
40
41
42
43
44
45
46
47
4849
Precipitation ContoursFigure 18
Precipitation Contours
Precipitation (in inches per year)
Active Precipitation Gauge
39
24
VMI 2006 Water Resources Data Report

Vash
on
Hw
y S
W
Be a
ll R
d
SW
SW Cove Rd
SW Bank Rd
SW Cemetery Rd
SW 240th St
107t
h A
ve S
W
Wax
Orc
har
d R
d
SW Point
Robinson Rd
150
150
150
200
200
250
250
150
150
8060
193.8
267.4
179.5198.1183.7
276.9
301.1 261.1
240.5
87.3310.4
246.8
262.7
265.8252.9 212.5
219.3
221.8
81.6
53.1 63.7
84.6
210.0
230.1
227.7
240.4
76.0
24.7
0.0
51.626.9
131.8
53.5
163.3
160.4
180.1
62.4
19.9
59.5
18.6
59.2
61.2
34.8
31.4
33.2
171.2
Qua
rter
mas
ter H
arbor
Puget Sound VASHON-MAURY
ISLAND
April 2007
0 1/2 1 Mile
N
The information included on this map has been compiled from a variety of sources and is subject to change without notice. King County makes no representations or warranties, express or implied, as to accuracy, completeness, timeliness, or rights to the use of such information. King County shall not be liable for any general, special, indirect, incidental, or consequential damages including, but not limited to, lost revenues or lost profits resulting from the use or misuse of the information contained on this map. Any sale of this map or information on this map is prohibited except by written permission of King County.
Map produced by King County DNRP WLR GIS and Visual Communications & Web UnitFile name: 0704vmiGWwtrTABLE.ai wgab
Data Sources: King County Datasets
Figure 19 Groundwater Elevations in Vashon Advance Outwash Aquifer
Vashon Advance Outwash (Qva)
Water Table Contour and Level (feet above MSL)
Qvr (Higher unit) Sites
Qva Sites
Qpf (Lower units) Sites
150
25
VMI 2006 Water Resources Data Report

VMI 2006 Water Resources Data Report
King County 26 April 2007
Table 1. List of Precipitation Gauge Sites on Vashon-Maury Island.
Total Precipitation (inches/yr)Gauge
Id Gauge Name Date Started Water Year
Oct05-Sep06 Calendar Year
Jan-Dec06
28Y West Judd Creek (Transfer Station) Oct-5-04 46.8 56.5
36U Maury Island (KIRO) Oct-5-04 43.7 51.9
36V East Maury Island (marine park) Mar-25-05 35.8 40.1
43U North Vashon (Heights Water District Office) Sep-20-99 44.1 59.2
65U South Vashon (Tahlequah Ferry Landing) Nov-5-04 45.9 54.3
Sea-Tac Sea-Tac airport (area reference) 1971^ 39.5 48.4
“^” = refers to the year that precipitation annual averages started – the annual average for Sea-Tac is 37.2 measured 1971-2000.
Table 2. Difference in rainfall totals for October, November and December for 2005 to 2006.
Total Precipitation (inches) Oct-Nov-Dec Gauge
Id Gauge Name
2005 2006
Difference 2005-2006
28Y West Judd Creek (Transfer Station) 19.1 28.8 9.7
36U Maury Island (KIRO) 18.0 26.2 8.2
36V East Maury Island (marine park) 13.9 18.2 4.3
43U North Vashon (Heights Water District Office) 18.8 33.9 15.1
65U South Vashon (Tahlequah Ferry Landing) 18.9 27.3 8.3
Sea-Tac Sea-Tac airport (area reference) 15.4 24.5 9.1

VMI 2006 Water Resources Data Report
King County 27 April 2007
Table 3. An annual summary of flow data for all continuous stream gauge sites on Vashon-Maury Island.
Gauge Id Gauge Name Date Started
Qt WY (cfs)
Qt CY (cfs)
Qmedian (cfs)
Qmax (cfs)
Qmin (cfs)
28A Judd Creek Jul-16-99 2232.1 2188.5* 2.6* 185.5* 1.0*
43A Shingle Mill Creek Jul-9-98 1660.6 2173.6 2.3 216.7 1.3
65A Tahlequah Creek May-1-04 334.3 436.5 0.4 26.4 0.2
65B Fisher Creek May-1-04 612.7 732.9 0.9 27.5 0.4
65C Green Valley Creek Mar-25-05 196.7* 191.2* 0.5* 4.8* 0.2*
Qt = Total flow for measured time period of water year (WY) or calendar year (CY).
Qmedian = Median flow recorded for a given site.
Qmax = Maximum flow recorded for a given site.
Qmin = Minimum flow recorded for a given site.
(cfs) = cubic feet per second; the unit of measurement for stream flow.
“*” = refers to sites that have incomplete data record for the time period measured.
Table 4. List of parameters sampled as part of the surface water water quality monitoring started in November 2006.
Parameters Total Alkalinity
Total Suspended Solids
Turbidity
Total Nitrogen
Ammonia Nitrogen
Nitrite + Nitrate Nitrogen
Total Phosphorus
Orthophosphate Phosphorus
Escherichia coli
Fecal Coliform
pH, Field
Sample Temperature, Field
Dissolved Oxygen, Field
Conductivity, Field

VMI 2006 Water Resources Data Report
King County 28 April 2007
Table 5. Volunteer Water Level sites and depth to water measurement data for 2006.
GWL_w-01 GWL_w-02 GWL_w-06 GWL_w-09 GWL_w-13 GWL_w-32 GWL_w-33
Month depth to water (feet)
Jan 116.0 108.8 163.2 208.1 not meas -- --
Feb 115.5 not meas 162.9 206.0 138.0 -- 69.0
Mar 115.4 110.2 163.2 205.7 137.9 -- 68.7
Apr 115.5 107.2 162.8 206.1 137.4 -- 68.5
May 115.4 not meas 162.8 not meas 137.7 -- 68.3
Jun 115.5 108.2 162.7 208.5 139.2 133.4 69.2
Jul 115.4 112.8 162.9 212.6 140.4 137.3 70.4
Aug 115.3 111.7 163.1 217.2 142.6 135.5 71.8
Sep 115.4 114.8 163.0 217.6 141.6 133.6 71.1
Oct 115.5 112.4 162.9 215.4 141.5 133.6 71.0
Nov 115.6 107.2 not meas 210.6 138.9 133.4 71.3
Dec not meas 106.9 not meas 207.8 138.0 not meas 70.7
not meas = Water level not measured that month.
-- = No measurement due to location not part of the volunteer network
Table 6. Water level measurements for water quality sites on Vashon-Maury Island for 2006.
Site id Measurement date Depth to water (feet)
w-02a 06/13/2006 115.5
w-06 06/12/2006 144.3
w-10a 06/14/2006 82.81
w-16a 06/12/2006 19.7
w-17 06/12/2006 169.3
w-20 06/12/2006 86.8
w-21 06/13/2006 115.5

VMI 2006 Water Resources Data Report
King County 29 April 2007
Table 7. Water level data from the locations used in the 2006 Island-wide water level survey.
Map id Measurement Date
Depth to water (feet) Location type
GWL_w-13 05/03/06 137.70 vol
GWL_w-06 05/04/06 162.80 vol
GWL_w-31 05/04/06 109.11 vol
GWL_w-19 05/04/06 63.44 vol
GWL_w-29 05/04/06 179.89 vol
VAS_w-16a 05/04/06 16.80 wq
VAS_w-17 05/04/06 168.80 wq
GWL_w-04 05/04/06 107.20 wl-vol
VAS_w-60 05/04/06 223.24 mw
VAS_w-61 05/04/06 84.22 mw
VAS_w-62 05/04/06 246.55 mw
VAS_w-63 05/04/06 109.34 mw
VAS_w-64 05/04/06 160.80 mw
VAS_w-65 05/04/06 84.41 mw
GWL_w-33 05/10/06 68.60 wl-vol
VAS_w-21/GWL_w-01 05/17/06 115.40 wq/wl-vol
GWL_w-06 06/02/06 162.70 wl-vol
GWL_w-13 06/05/06 139.20 wl-vol
GWL_w-02 06/07/06 108.20 wl-vol
GWL_w-33 06/09/06 69.20 wl-vol
VAS_w-06 06/12/06 144.30 wq
VAS_w-16a 06/12/06 19.70 wq
VAS_w-17 06/12/06 169.30 wq

VMI 2006 Water Resources Data Report
King County 30 April 2007
Map id Measurement Date
Depth to water (feet) Location type
VAS_w-20 06/12/06 86.80 wq
VAS_w-21/GWL_w-01 06/12/06 115.50 wq/wl-vol
VAS_w-02a/GWL_w-25 06/13/06 115.50 wq/wl-vol
GWL_w-09 06/13/06 208.50 wl-vol
VAS_w-10a 06/14/06 82.81 wq
GWL_w-32 06/14/06 133.40 wl-vol
Vol = Volunteer Water Level location
Wq = Water quality sampling site where water levels are measured.
Wl-vol = New location for water level measurements
Mw = Monitoring well location.

VMI 2006 Water Resources Data Report
King County 31 April 2007
Table 8. Water level measurements at the dedicated groundwater monitoring wells on VMI.
WELL ID Site Name Date Measured Depth to water (feet)
2/15/2006 220.39
3/30/2006 221.74
5/4/2006 223.24
9/26/2006 221.28
11/6/206 216.50
VAS_W-60 Vashon Hwy SW, near 145th Pl
12/19/2006 221.80
1/10/2006 84.31
2/15/2006 84.00
3/30/2006 84.48
5/4/2006 84.22
9/26/2006 84.49
VAS_W-61 Valley Center Park-n-Ride 2" well
11/6/2006 84.47
3/30/2006 (dry)
5/4/2006 (dry)
6/12/2006 (dry)
9/26/2006 (dry)
VAS_W-62 Maury Island - 63rd Ave SW
11/8/2006 (dry)
1/10/2006 109.11
3/30/2006 109.63
5/4/2006 109.34
9/26/2006 110.40
VAS_W-63 SW Redding Beach Rd
11/8/2006 110.18

VMI 2006 Water Resources Data Report
King County 32 April 2007
WELL ID Site Name Date Measured Depth to water (feet)
1/10/2006 160.21
3/30/2006 160.75
5/4/2006 160.80
9/26/2006 161.29
VAS_W-64 Wax Orchard Rd @ Vashon Hwy
11/8/2006 161.36
1/10/2006 84.55
2/15/2006 84.22
3/30/2006 84.68
5/4/2006 84.41
9/26/2006 84.69
VAS_W-65 Valley Center Park-n-Ride 6" well
11/6/2006 84.67
NOTE: Water levels taken within VAS_W-62 are below the screen, so these measurements are reported as “dry”.

VMI 2006 Water Resources Data Report
King County 33 April 2007
Table 9. Environmental Indicators – Arsenic, Chloride, and Nitrate-Nitrate – sampling results at the 19 long-term monitoring sites. Sampling occurred June 12th – 14th 2006.
June results Avg Conc. June results Avg Conc. June results Avg Conc.
VAS_s-03 0.0011 0.0019 5.89 6.16 3.00 2.04VAS_w-02a 0.0061 0.0075 4.29 3.63 2.17 0.96VAS_w-03 0.0008 0.0011 7.99 7.59 0.38 0.36
0.0182 4.05 0.020.0183 3.89 0.02
VAS_w-06 0.0009 0.0010 3.36 2.89 1.43 1.160.0120 2.98 0.020.0130 3.00 0.02
VAS_w-08 0.0020 0.0029 8.73 8.02 0.02 0.02VAS_w-09a 0.0048 0.0058 5.13 4.78 0.02 0.02VAS_w-10a 0.0019 0.0013 10.70 9.53 4.42 3.25VAS_w-11 0.0012 0.0015 5.32 4.92 0.02 0.02VAS_w-12 0.0054 0.0059 4.17 3.91 0.02 0.02VAS_w-13 0.0010 0.0011 9.79 8.48 2.44 1.78VAS_w-14 0.0014 0.0014 4.48 3.99 0.03 0.03VAS_w-15 0.0011 0.0014 4.92 4.51 0.02 0.02VAS_w-16a 0.0005 0.0005 3.83 3.53 4.27 4.95VAS_w-17 0.0005 0.0005 4.18 2.59 1.93 1.61VAS_w-19 0.0018 0.0019 3.01 2.82 0.47 0.65VAS_w-20 0.0005 0.0006 3.72 3.38 3.20 2.87VAS_w-21 0.0034 0.0040 3.98 3.58 0.02 0.02
VAS_w-04*
VAS_w-07* 0.023.620.0355
0.0185 4.03 0.02
Arsenic Chloride Nitrate + Nitrite
mg/L
Avg Conc. = Average Concentration of the previous sampling events (typically 8 results per location)
mg/L = milligrams per liter.
* = these locations had a sample replicate taken during this sampling event.
Table 10. Arsenic Speciation results for selected location on Vashon-Maury Island.
Site ID As (total) µg/L As(III) µg/L As(III) As(V) W-02a 6.1 0.03 <1% 99%
20.1 17.5 87% 13% W-04* -- 17.9 -- --
11.8 11.7 99% 1% W-07* 11.1 11.5 104% <1%
W-09a 5.0 4.5 89% 11% W-12 4.8 5.5 113% <1% W-21 1.7 0.92 55% 45%
µg/L = micrograms per liter.
* = these locations had a sample replicate taken during this sampling event
-- = Error in analysis and the concentration values were not determined
As(V) = This concentration is calculated from the equation: As(total) minus As(III) equals As(V).

VMI 2006 Water Resources Data Report
King County 34 April 2007
Table 11. Rainfall Summary for Water Year: 2006
Water Year Site Oct Nov Dec Jan Feb Mar Apr May Jun Jul Aug Sep YTD
Total
28Y 3.7 6.3 9.1 14.3 3.1 2.6 2.9 1.6 1.9 0.2 0.0 1.1 46.8
36U 3.2 6.6 8.2 13.6 2.8 2.3 2.8 1.6 1.7 0.1 0.0 1.0 43.7
36V 2.5 5.1 6.4 10.6 2.2 1.8 2.4 1.6 1.9 0.1 0.0 1.4 35.8
43U 3.6 6.2 9.1 13.3 3.0 2.4 2.5 1.4 1.6 0.1 0.1 0.9 44.1
65U 3.7 6.9 8.3 14.0 3.3 2.3 2.9 1.7 1.7 0.2 0.0 0.9 45.9
WY06
SeaTac 3.0 5.5 6.9 11.7 2.6 2.2 2.7 1.7 1.7 0.1 0.0 1.4 39.5 YTD Total = Year to date total of the daily total precipitation.
All units are inches per (time)
WY = Water Year – a 12 month period starting October 1st through September 30th; WY06 is from October 2005 through September 2006.
Table 12. Comparison of Total Stream Flow by water year (WY) for all continuous stream gauge sites on Vashon-Maury Island.
Qt (cfs)
28A Judd Creek
43A Shingle Mill
Creek
65A Tahlequah
Creek
65B Fisher Creek
65C Green Valley
Creek
wy99 -- 2786.6 -- -- -- wy00 2418.4 2067.6 -- -- -- wy01 1393.5 970.9 -- -- -- wy02 2504.3 1844.9 -- -- -- wy03 1775.8 1406.5 -- -- -- wy04 2160.0 1616.5 -- -- -- wy05 1456.6 1102.0 176.6 369.4 87.1* wy06 2232.1 1660.6 334.3 612.7 196.7*
Qt = Total flow for measured time period of water year (WY).
WY = Water Year – a 12 month period starting October 1st through September 30th. (cfs) = cubic feet per second; the unit of measurement for stream flow.
-- = No data for this site for this water year.
“*” = refers to sites that have incomplete data record for the time period measured.

VMI 2006 Water Resources Data Report
King County 35 April 2007
Table 13. The relative change of the annual average (in feet) from the baseline of the depth to water measurements done in 2003 to 2006 for the five long-term water level sites. The baseline for each site is the average of the measurements made in 2001-2002.
2001-2002 2003 2004 2005 2006 baseline count data count data count data count data count GWL_w-01 115.3 13 -0.5 8 -0.4 10 -0.3 9 -0.2 11 GWL_w-02 108.1 11 0.4 6 0.1 5 0.2 6 -1.9 10 GWL_w-06 161.6 21 -0.4 12 -0.7 12 -1.1 12 -1.3 10 GWL_w-09 206.2 18 -2.1 7 -2.0 10 -3.9 11 -4.3 11 GWL_w-13 140.2 19 -0.9 12 1.7 11 0.9 9 0.8 11

VMI 2006 Water Resources Data Report
King County 36 April 2007
Appendix A
Precipitation data

VMI 2006 Water Resources Data Report
28Y West Judd Creek2006 Water Year 01Oct to 30SepRainfall in inches
Data are provisional until end of yearDAY OCT NOV DEC JAN FEB MAR APR MAY JUN JUL AUG SEP
1 0.00 0.79 0.23 0.18 0.26 0.00 0.25 0.00 0.80 0.00 0.00 0.00 2 0.37 0.15 0.30 0.35 0.57 0.02 0.01 0.00 0.28 0.00 0.00 0.00 3 0.01 0.39 0.00 0.20 0.11 0.00 0.14 0.00 0.00 0.00 0.00 0.00 4 0.00 0.49 0.00 0.00 0.91 0.00 0.00 0.00 0.53 0.01 0.00 0.00 5 0.00 1.06 0.00 1.41 0.00 0.08 0.00 0.00 0.00 0.00 0.00 0.00 6 0.17 0.06 0.00 0.44 0.00 0.03 0.00 0.00 0.00 0.00 0.00 0.00 7 0.00 0.23 0.00 0.39 0.00 0.02 0.00 0.05 0.00 0.00 0.00 0.00 8 0.04 0.04 0.00 0.07 0.12 0.82 0.45 0.00 0.05 0.00 0.00 0.00 9 0.02 0.00 0.00 1.36 0.00 0.18 0.00 0.00 0.07 0.00 0.00 0.01 10 0.04 0.00 0.00 1.37 0.00 0.10 0.00 0.00 0.00 0.00 0.03 0.00 11 0.00 0.38 0.00 0.52 0.00 0.00 0.00 0.00 0.00 0.00 0.00 0.00 12 0.07 0.04 0.11 0.79 0.00 0.00 0.04 0.00 0.05 0.10 0.00 0.00 13 0.06 0.87 0.05 0.54 0.12 0.00 0.41 0.00 0.02 0.02 0.00 0.07 14 0.35 0.00 0.00 0.20 0.00 0.05 0.19 0.00 0.01 0.00 0.00 0.00 15 0.13 0.01 0.00 0.00 0.00 0.04 0.43 0.00 0.01 0.00 0.00 0.33 16 0.00 0.00 0.00 0.90 0.00 0.15 0.10 0.00 0.09 0.00 0.00 0.00 17 0.01 0.00 0.00 0.19 0.00 0.09 0.00 0.00 0.00 0.00 0.00 0.00 18 0.01 0.00 0.00 0.05 0.00 0.27 0.00 0.00 0.00 0.00 0.00 0.35 19 0.17 0.00 0.38 0.20 0.00 0.01 0.00 0.03 0.00 0.00 0.00 0.14 20 0.00 0.00 0.46 0.43 0.00 0.00 0.02 0.00 0.00 0.00 0.00 0.10 21 0.00 0.00 0.56 0.07 0.00 0.07 0.23 0.02 0.00 0.00 0.00 0.09 22 0.00 0.00 0.56 0.00 0.00 0.08 0.00 0.21 0.00 0.00 0.00 0.00 23 0.20 0.00 0.90 0.05 0.13 0.01 0.00 0.29 0.00 0.00 0.00 0.00 24 0.01 0.11 0.99 0.00 0.01 0.26 0.00 0.25 0.00 0.00 0.00 0.00 25 0.09 1.07 1.12 0.15 0.00 0.00 0.00 0.21 0.00 0.00 0.00 0.00 26 0.00 0.00 0.41 0.21 0.11 0.01 0.00 0.06 0.00 0.00 0.00 0.00 27 0.04 0.06 0.70 0.21 0.32 0.00 0.00 0.25 0.00 0.00 0.00 0.00 28 0.34 0.08 0.56 0.94 0.47 0.18 0.00 0.09 0.00 0.00 0.00 0.00 29 0.08 0.47 0.46 1.48 0.00 0.64 0.00 0.00 0.00 0.00 0.00 30 0.34 0.00 0.93 0.92 0.00 0.01 0.00 0.00 0.03 0.00 0.00 31 1.17 0.37 0.65 0.11 0.12 0.00 0.00
Total 3.72 6.30 9.09 14.27 3.13 2.58 2.92 1.58 1.91 0.16 0.03 1.09
Year To Date Total: 46.78 inches
s = snowe = estimated Precipitation is measured with a tipping bucket rain gauge. Ice and snow accumulations in the rain gage are not recorded until they melt.Precipitation from snow is not measured accurately
King County Water and Land Resources Division (206) 296-6519
Download streamflow and rainfall data from the Hydrologic Information Center at the King County Department of Natural Resources website:http://dnr.metrokc.gov/hydrodat
King County 37 April 2007

VMI 2006 Water Resources Data Report
36U Maury Island2006 Water Year 01Oct to 30SepRainfall in inches
Data are provisional until end of yearDAY OCT NOV DEC JAN FEB MAR APR MAY JUN JUL AUG SEP
1 0.00 0.93 0.27 0.11 0.18 0.00 0.26 0.00 0.78 0.00 0.00 0.00 2 0.39 0.14 0.22 0.37 0.58 0.01 0.02 0.00 0.14 0.00 0.00 0.00 3 0.00 0.29 0.03 0.20 0.08 0.00 0.20 0.00 0.00 0.00 0.00 0.00 4 0.00 0.48 0.00 0.02 0.61 0.00 0.01 0.00 0.51 0.00 0.00 0.00 5 0.00 1.01 0.00 1.37 0.00 0.07 0.00 0.00 0.00 0.00 0.00 0.00 6 0.18 0.06 0.00 0.26 0.00 0.08 0.00 0.00 0.00 0.00 0.00 0.00 7 0.06 0.13 0.00 0.33 0.00 0.02 0.00 0.02 0.00 0.00 0.00 0.00 8 0.05 0.04 0.00 0.06 0.16 0.59 0.37 0.00 0.01 0.00 0.00 0.00 9 0.00 0.00 0.00 1.38 0.00 0.17 0.01 0.00 0.05 0.00 0.00 0.02
10 0.04 0.01 0.00 1.28 0.00 0.14 0.00 0.00 0.00 0.00 0.00 0.00 11 0.08 0.54 0.00 0.86 0.00 0.00 0.00 0.00 0.00 0.00 0.00 0.00 12 0.06 0.04 0.10 0.73 0.00 0.00 0.07 0.00 0.06 0.08 0.00 0.00 13 0.07 1.12 0.03 0.59 0.19 0.00 0.43 0.00 0.07 0.03 0.00 0.02 14 0.32 0.00 0.01 0.07 0.00 0.01 0.23 0.00 0.02 0.00 0.00 0.03 15 0.09 0.01 0.00 0.00 0.00 0.09 0.32 0.00 0.00 0.00 0.00 0.11 16 0.00 0.00 0.00 0.88 0.00 0.11 0.11 0.00 0.04 0.00 0.00 0.00 17 0.01 0.00 0.00 0.08 0.00 0.10 0.00 0.00 0.00 0.00 0.00 0.00 18 0.02 0.00 0.00 0.09 0.00 0.26 0.00 0.00 0.00 0.00 0.00 0.39 19 0.08 0.00 0.28 0.17 0.00 0.00 0.00 0.06 0.00 0.00 0.00 0.13 20 0.00 0.00 0.37 0.47 0.00 0.00 0.02 0.01 0.00 0.00 0.00 0.13 21 0.00 0.00 0.47 0.09 0.00 0.06 0.21 0.02 0.00 0.00 0.00 0.12 22 0.00 0.00 0.37 0.00 0.00 0.04 0.00 0.23 0.00 0.00 0.00 0.00 23 0.15 0.00 0.92 0.01 0.10 0.01 0.00 0.23 0.00 0.00 0.00 0.00 24 0.00 0.07 0.80 0.00 0.00 0.27 0.00 0.33 0.00 0.00 0.00 0.00 25 0.05 1.05 0.99 0.10 0.00 0.01 0.00 0.11 0.00 0.00 0.00 0.00 26 0.00 0.00 0.35 0.19 0.09 0.01 0.00 0.19 0.00 0.00 0.00 0.00 27 0.04 0.10 0.59 0.16 0.27 0.00 0.00 0.14 0.00 0.00 0.00 0.00 28 0.20 0.07 0.55 0.94 0.52 0.15 0.00 0.11 0.00 0.00 0.00 0.00 29 0.09 0.47 0.37 1.53 0.00 0.50 0.00 0.00 0.00 0.02 0.00 30 0.33 0.01 0.97 0.74 0.00 0.01 0.00 0.00 0.00 0.00 0.01 31 0.88 0.50 0.47 0.07 0.14 0.00 0.00
Total 3.19 6.57 8.19 13.55 2.78 2.27 2.77 1.59 1.68 0.11 0.02 0.96
Year To Date Total: 43.68 inches
s = snowe = estimated Precipitation is measured with a tipping bucket rain gauge. Ice and snow accumulations in the rain gage are not recorded until they melt.Precipitation from snow is not measured accurately
King County Water and Land Resources Division (206) 296-6519
Download streamflow and rainfall data from the Hydrologic Information Center at the King County Department of Natural Resources website:http://dnr.metrokc.gov/hydrodat
King County 38 April 2007

VMI 2006 Water Resources Data Report
36V East Maury Island2006 Water Year 01Oct to 30SepRainfall in inches
Data are provisional until end of yearDAY OCT NOV DEC JAN FEB MAR APR MAY JUN JUL AUG SEP
1 0.00 0.79 0.27 0.06 0.10 0.00 0.22 0.00 0.94 0.00 0.00 0.00 2 0.35 0.09 0.22 0.33 0.44 0.00 0.01 0.00 0.17 0.00 0.00 0.00 3 0.00 0.15 0.03 0.18 0.08 0.00 0.12 0.00 0.00 0.00 0.00 0.00 4 0.00 0.37 0.00 0.00 0.34 0.00 0.01 0.00 0.52 0.01 0.00 0.00 5 0.00 0.62 0.00 1.21 0.00 0.03 0.00 0.00 0.00 0.00 0.00 0.00 6 0.20 0.01 0.00 0.28 0.00 0.03 0.00 0.01 0.00 0.00 0.00 0.00 7 0.01 0.14 0.00 0.29 0.00 0.04 0.00 0.01 0.00 0.00 0.00 0.00 8 0.04 0.03 0.00 0.02 0.14 0.28 0.36 0.00 0.02 0.00 0.00 0.00 9 0.00 0.00 0.00 1.04 0.00 0.11 0.00 0.00 0.01 0.00 0.00 0.02
10 0.02 0.00 0.00 0.98 0.00 0.20 0.00 0.00 0.00 0.00 0.00 0.00 11 0.00 0.32 0.00 0.55 0.00 0.00 0.00 0.00 0.00 0.00 0.00 0.00 12 0.03 0.01 0.06 0.56 0.00 0.00 0.03 0.00 0.07 0.02 0.00 0.00 13 0.04 0.83 0.05 0.54 0.19 0.00 0.29 0.00 0.05 0.03 0.00 0.01 14 0.25 0.00 0.00 0.15 0.00 0.03 0.20 0.00 0.00 0.01 0.00 0.32 15 0.07 0.00 0.00 0.00 0.00 0.03 0.14 0.00 0.00 0.00 0.00 0.26 16 0.00 0.00 0.00 0.63 0.00 0.07 0.06 0.00 0.08 0.00 0.00 0.01 17 0.00 0.00 0.00 0.03 0.00 0.08 0.00 0.00 0.00 0.00 0.00 0.00 18 0.00 0.00 0.00 0.04 0.00 0.26 0.00 0.00 0.00 0.00 0.00 0.42 19 0.08 0.00 0.17 0.08 0.00 0.00 0.00 0.08 0.00 0.00 0.00 0.13 20 0.00 0.00 0.35 0.28 0.00 0.00 0.01 0.00 0.00 0.00 0.00 0.10 21 0.00 0.00 0.36 0.09 0.00 0.03 0.34 0.02 0.00 0.00 0.00 0.13 22 0.00 0.00 0.32 0.00 0.00 0.02 0.00 0.26 0.00 0.00 0.00 0.00 23 0.08 0.00 0.85 0.00 0.06 0.01 0.00 0.20 0.00 0.00 0.00 0.00 24 0.00 0.02 0.58 0.00 0.00 0.31 0.00 0.23 0.00 0.00 0.00 0.00 25 0.02 1.05 0.77 0.05 0.00 0.01 0.00 0.21 0.00 0.00 0.00 0.00 26 0.00 0.00 0.33 0.07 0.05 0.03 0.00 0.10 0.00 0.00 0.00 0.00 27 0.03 0.10 0.39 0.18 0.30 0.00 0.00 0.20 0.00 0.00 0.00 0.00 28 0.16 0.07 0.38 0.82 0.52 0.14 0.00 0.15 0.00 0.00 0.00 0.00 29 0.07 0.47 0.20 1.12 0.00 0.63 0.00 0.00 0.00 0.00 0.00 30 0.21 0.01 0.79 0.65 0.00 0.00 0.00 0.00 0.00 0.00 0.00 31 0.85 0.23 0.32 0.07 0.10 0.00 0.00
Total 2.51 5.08 6.35 10.55 2.22 1.78 2.42 1.57 1.86 0.07 0.00 1.40
Year To Date Total: 35.81 inches
s = snowe = estimated Precipitation is measured with a tipping bucket rain gauge. Ice and snow accumulations in the rain gage are not recorded until they melt.Precipitation from snow is not measured accurately
King County Water and Land Resources Division (206) 296-6519
Download streamflow and rainfall data from the Hydrologic Information Center at the King County Department of Natural Resources website:http://dnr.metrokc.gov/hydrodat
King County 39 April 2007

VMI 2006 Water Resources Data Report
43U North Vashon2006 Water Year 01Oct to 30SepRainfall in inches
Data are provisional until end of yearDAY OCT NOV DEC JAN FEB MAR APR MAY JUN JUL AUG SEP
1 0.00 0.79 0.33 0.17 0.29 0.00 0.25 0.00 0.57 0.00 0.00 0.00 2 0.32 0.15 0.15 0.30 0.50 0.05 0.01 0.00 0.24 0.00 0.00 0.00 3 0.01 0.39 0.01 0.22 0.12 0.00 0.12 0.00 0.00 0.00 0.00 0.00 4 0.00 0.49 0.00 0.03 0.78 0.00 0.00 0.00 0.45 0.02 0.00 0.00 5 0.00 1.06 0.00 1.31 0.00 0.07 0.00 0.00 0.00 0.00 0.00 0.00 6 0.15 0.06 0.00 0.32 0.00 0.02 0.00 0.00 0.00 0.00 0.00 0.00 7 0.01 0.23 0.00 0.46 0.00 0.02 0.00 0.02 0.00 0.00 0.00 0.00 8 0.03 0.02 0.00 0.06 0.16 0.66 0.20 0.00 0.07 0.00 0.00 0.00 9 0.01 0.00 0.00 1.32 0.00 0.14 0.00 0.00 0.09 0.00 0.00 0.02
10 0.02 0.01 0.00 1.34 0.00 0.14 0.00 0.00 0.00 0.00 0.03 0.00 11 0.01 0.42 0.00 0.27 0.00 0.00 0.00 0.00 0.00 0.00 0.00 0.00 12 0.06 0.04 0.09 0.75 0.00 0.00 0.01 0.00 0.05 0.04 0.00 0.00 13 0.05 0.80 0.09 0.47 0.15 0.02 0.26 0.00 0.03 0.01 0.00 0.00 14 0.24 0.00 0.00 0.15 0.01 0.11 0.17 0.00 0.01 0.00 0.00 0.08 15 0.24 0.00 0.00 0.00 0.00 0.03 0.44 0.00 0.00 0.00 0.00 0.29 16 0.00 0.00 0.00 0.87 0.00 0.14 0.13 0.00 0.06 0.00 0.00 0.00 17 0.01 0.00 0.00 0.17 0.00 0.07 0.00 0.00 0.00 0.00 0.00 0.00 18 0.03 0.00 0.00 0.05 0.00 0.27 0.00 0.00 0.00 0.00 0.00 0.26 19 0.08 0.00 0.42 0.16 0.00 0.00 0.00 0.04 0.00 0.00 0.00 0.05 20 0.00 0.00 0.48 0.32 0.00 0.00 0.02 0.00 0.00 0.00 0.00 0.10 21 0.00 0.00 0.63 0.05 0.00 0.09 0.37 0.01 0.00 0.00 0.00 0.11 22 0.00 0.00 0.69 0.00 0.00 0.11 0.00 0.23 0.00 0.00 0.00 0.00 23 0.21 0.00 0.87 0.03 0.13 0.01 0.00 0.27 0.00 0.00 0.00 0.00 24 0.00 0.11 1.09 0.01 0.01 0.27 0.00 0.19 0.00 0.00 0.00 0.00 25 0.09 1.02 1.04 0.20 0.00 0.00 0.00 0.08 0.00 0.00 0.00 0.00 26 0.01 0.00 0.42 0.25 0.10 0.00 0.00 0.13 0.00 0.00 0.00 0.00 27 0.04 0.12 0.71 0.24 0.26 0.00 0.00 0.19 0.00 0.00 0.00 0.00 28 0.34 0.06 0.51 0.92 0.51 0.14 0.00 0.12 0.00 0.00 0.00 0.00 29 0.08 0.42 0.38 1.32 0.00 0.49 0.00 0.00 0.00 0.00 0.00 30 0.34 0.00 0.90 0.91 0.00 0.00 0.00 0.00 0.04 0.06 0.00 31 1.17 0.26 0.61 0.07 0.14 0.00 0.00
Total 3.55 6.19 9.07 13.28 3.02 2.43 2.47 1.42 1.57 0.11 0.09 0.91
Year To Date Total: 44.11 inches
s = snowe = estimated Precipitation is measured with a tipping bucket rain gauge. Ice and snow accumulations in the rain gage are not recorded until they melt.Precipitation from snow is not measured accurately
King County Water and Land Resources Division (206) 296-6519
Download streamflow and rainfall data from the Hydrologic Information Center at the King County Department of Natural Resources website:http://dnr.metrokc.gov/hydrodat
King County 40 April 2007
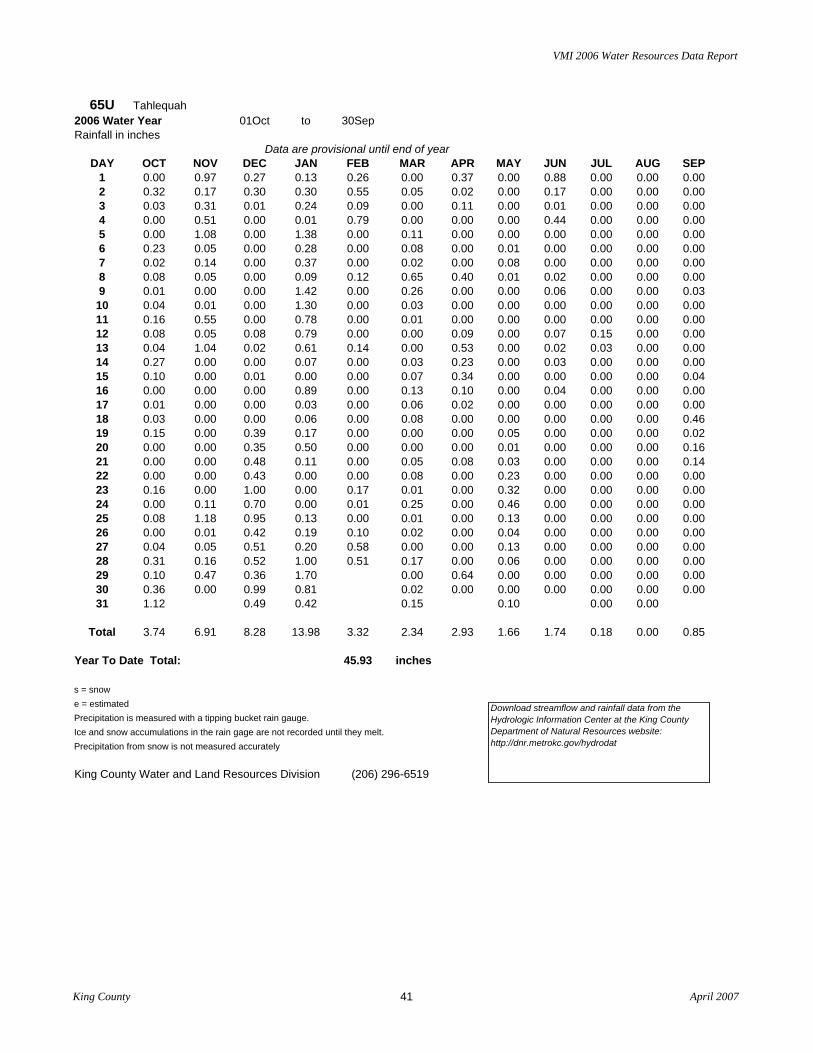
VMI 2006 Water Resources Data Report
65U Tahlequah2006 Water Year 01Oct to 30SepRainfall in inches
Data are provisional until end of yearDAY OCT NOV DEC JAN FEB MAR APR MAY JUN JUL AUG SEP
1 0.00 0.97 0.27 0.13 0.26 0.00 0.37 0.00 0.88 0.00 0.00 0.00 2 0.32 0.17 0.30 0.30 0.55 0.05 0.02 0.00 0.17 0.00 0.00 0.00 3 0.03 0.31 0.01 0.24 0.09 0.00 0.11 0.00 0.01 0.00 0.00 0.00 4 0.00 0.51 0.00 0.01 0.79 0.00 0.00 0.00 0.44 0.00 0.00 0.00 5 0.00 1.08 0.00 1.38 0.00 0.11 0.00 0.00 0.00 0.00 0.00 0.00 6 0.23 0.05 0.00 0.28 0.00 0.08 0.00 0.01 0.00 0.00 0.00 0.00 7 0.02 0.14 0.00 0.37 0.00 0.02 0.00 0.08 0.00 0.00 0.00 0.00 8 0.08 0.05 0.00 0.09 0.12 0.65 0.40 0.01 0.02 0.00 0.00 0.00 9 0.01 0.00 0.00 1.42 0.00 0.26 0.00 0.00 0.06 0.00 0.00 0.03 10 0.04 0.01 0.00 1.30 0.00 0.03 0.00 0.00 0.00 0.00 0.00 0.00 11 0.16 0.55 0.00 0.78 0.00 0.01 0.00 0.00 0.00 0.00 0.00 0.00 12 0.08 0.05 0.08 0.79 0.00 0.00 0.09 0.00 0.07 0.15 0.00 0.00 13 0.04 1.04 0.02 0.61 0.14 0.00 0.53 0.00 0.02 0.03 0.00 0.00 14 0.27 0.00 0.00 0.07 0.00 0.03 0.23 0.00 0.03 0.00 0.00 0.00 15 0.10 0.00 0.01 0.00 0.00 0.07 0.34 0.00 0.00 0.00 0.00 0.04 16 0.00 0.00 0.00 0.89 0.00 0.13 0.10 0.00 0.04 0.00 0.00 0.00 17 0.01 0.00 0.00 0.03 0.00 0.06 0.02 0.00 0.00 0.00 0.00 0.00 18 0.03 0.00 0.00 0.06 0.00 0.08 0.00 0.00 0.00 0.00 0.00 0.46 19 0.15 0.00 0.39 0.17 0.00 0.00 0.00 0.05 0.00 0.00 0.00 0.02 20 0.00 0.00 0.35 0.50 0.00 0.00 0.00 0.01 0.00 0.00 0.00 0.16 21 0.00 0.00 0.48 0.11 0.00 0.05 0.08 0.03 0.00 0.00 0.00 0.14 22 0.00 0.00 0.43 0.00 0.00 0.08 0.00 0.23 0.00 0.00 0.00 0.00 23 0.16 0.00 1.00 0.00 0.17 0.01 0.00 0.32 0.00 0.00 0.00 0.00 24 0.00 0.11 0.70 0.00 0.01 0.25 0.00 0.46 0.00 0.00 0.00 0.00 25 0.08 1.18 0.95 0.13 0.00 0.01 0.00 0.13 0.00 0.00 0.00 0.00 26 0.00 0.01 0.42 0.19 0.10 0.02 0.00 0.04 0.00 0.00 0.00 0.00 27 0.04 0.05 0.51 0.20 0.58 0.00 0.00 0.13 0.00 0.00 0.00 0.00 28 0.31 0.16 0.52 1.00 0.51 0.17 0.00 0.06 0.00 0.00 0.00 0.00 29 0.10 0.47 0.36 1.70 0.00 0.64 0.00 0.00 0.00 0.00 0.00 30 0.36 0.00 0.99 0.81 0.02 0.00 0.00 0.00 0.00 0.00 0.00 31 1.12 0.49 0.42 0.15 0.10 0.00 0.00
Total 3.74 6.91 8.28 13.98 3.32 2.34 2.93 1.66 1.74 0.18 0.00 0.85
Year To Date Total: 45.93 inches
s = snowe = estimated Precipitation is measured with a tipping bucket rain gauge. Ice and snow accumulations in the rain gage are not recorded until they melt.Precipitation from snow is not measured accurately
King County Water and Land Resources Division (206) 296-6519
Download streamflow and rainfall data from the Hydrologic Information Center at the King County Department of Natural Resources website:http://dnr.metrokc.gov/hydrodat
King County 41 April 2007

VMI 2006 Water Resources Data Report
28Y West Judd Creek2007 Water Year 01Oct to 31DecRainfall in inches
Data are provisional until end of yearDAY OCT NOV DEC JAN FEB MAR APR MAY JUN JUL AUG SEP
1 0.00 0.00 0.00 0.00 0.00 0.00 0.00 0.00 0.00 0.00 0.00 0.00 2 0.00 1.10 0.00 0.00 0.00 0.00 0.00 0.00 0.00 0.00 0.00 0.00 3 0.00 0.85 0.00 0.00 0.00 0.00 0.00 0.00 0.00 0.00 0.00 0.00 4 0.00 1.32 0.02 0.00 0.00 0.00 0.00 0.00 0.00 0.00 0.00 0.00 5 0.00 1.11 0.00 0.00 0.00 0.00 0.00 0.00 0.00 0.00 0.00 0.00 6 0.02 3.76 0.00 0.00 0.00 0.00 0.00 0.00 0.00 0.00 0.00 0.00 7 0.00 0.55 0.00 0.00 0.00 0.00 0.00 0.00 0.00 0.00 0.00 0.00 8 0.00 0.36 0.03 0.00 0.00 0.00 0.00 0.00 0.00 0.00 0.00 0.00 9 0.00 0.39 0.26 0.00 0.00 0.00 0.00 0.00 0.00 0.00 0.00 0.00 10 0.00 1.01 0.16 0.00 0.00 0.00 0.00 0.00 0.00 0.00 0.00 0.00 11 0.00 0.26 1.17 0.00 0.00 0.00 0.00 0.00 0.00 0.00 0.00 0.00 12 0.00 1.35 0.85 0.00 0.00 0.00 0.00 0.00 0.00 0.00 0.00 0.00 13 0.00 0.39 0.72 0.00 0.00 0.00 0.00 0.00 0.00 0.00 0.00 0.00 14 0.04 0.04 1.88 0.00 0.00 0.00 0.00 0.00 0.00 0.00 0.00 0.00 15 0.43 0.70 0.14 0.00 0.00 0.00 0.00 0.00 0.00 0.00 0.00 0.00 16 0.00 0.00 0.00 0.00 0.00 0.00 0.00 0.00 0.00 0.00 0.00 0.00 17 0.00 0.00 0.00 0.00 0.00 0.00 0.00 0.00 0.00 0.00 0.00 0.00 18 0.23 0.03 0.00 0.00 0.00 0.00 0.00 0.00 0.00 0.00 0.00 0.00 19 0.15 0.67 0.00 0.00 0.00 0.00 0.00 0.00 0.00 0.00 0.00 0.00 20 0.00 0.76 0.47 0.00 0.00 0.00 0.00 0.00 0.00 0.00 0.00 0.00 21 0.00 0.97 0.34 0.00 0.00 0.00 0.00 0.00 0.00 0.00 0.00 0.00 22 0.00 0.65 0.00 0.00 0.00 0.00 0.00 0.00 0.00 0.00 0.00 0.00 23 0.00 0.71 0.81 0.00 0.00 0.00 0.00 0.00 0.00 0.00 0.00 0.00 24 0.04 0.00 0.82 0.00 0.00 0.00 0.00 0.00 0.00 0.00 0.00 0.00 25 0.00 0.00 0.14 0.00 0.00 0.00 0.00 0.00 0.00 0.00 0.00 0.00 26 0.00 0.77 1.19 0.00 0.00 0.00 0.00 0.00 0.00 0.00 0.00 0.00 27 0.00 0.25 0.49 0.00 0.00 0.00 0.00 0.00 0.00 0.00 0.00 0.00 28 0.00 0.01 0.00 0.00 0.00 0.00 0.00 0.00 0.00 0.00 0.00 0.00 29 0.20 0.00 0.00 0.00 0.00 0.00 0.00 0.00 0.00 0.00 0.00 30 0.00 0.19 0.00 0.00 0.00 0.00 0.00 0.00 0.00 0.00 0.00 31 0.00 0.00 0.00 0.00 0.00 0.00 0.00
Total 1.11 18.20 9.49 0.00 0.00 0.00 0.00 0.00 0.00 0.00 0.00 0.00
Year To Date Total: 28.80 inches
s = snowe = estimated Precipitation is measured with a tipping bucket rain gauge. Ice and snow accumulations in the rain gage are not recorded until they melt.Precipitation from snow is not measured accurately
King County Water and Land Resources Division (206) 296-6519
Download streamflow and rainfall data from the Hydrologic Information Center at the King County Department of Natural Resources website:http://dnr.metrokc.gov/hydrodat
King County 42 April 2007

VMI 2006 Water Resources Data Report
36U Maury Island2007 Water Year 01Oct to 31DecRainfall in inches
Data are provisional until end of yearDAY OCT NOV DEC JAN FEB MAR APR MAY JUN JUL AUG SEP
1 0.00 0.00 0.01 0.00 0.00 0.00 0.00 0.00 0.00 0.00 0.00 0.00 2 0.00 1.04 0.00 0.00 0.00 0.00 0.00 0.00 0.00 0.00 0.00 0.00 3 0.00 0.70 0.00 0.00 0.00 0.00 0.00 0.00 0.00 0.00 0.00 0.00 4 0.00 1.88 0.04 0.00 0.00 0.00 0.00 0.00 0.00 0.00 0.00 0.00 5 0.00 0.85 0.00 0.00 0.00 0.00 0.00 0.00 0.00 0.00 0.00 0.00 6 0.06 3.23 0.00 0.00 0.00 0.00 0.00 0.00 0.00 0.00 0.00 0.00 7 0.00 0.55 0.00 0.00 0.00 0.00 0.00 0.00 0.00 0.00 0.00 0.00 8 0.00 0.27 0.03 0.00 0.00 0.00 0.00 0.00 0.00 0.00 0.00 0.00 9 0.00 0.36 0.24 0.00 0.00 0.00 0.00 0.00 0.00 0.00 0.00 0.00 10 0.00 0.78 0.21 0.00 0.00 0.00 0.00 0.00 0.00 0.00 0.00 0.00 11 0.00 0.11 0.94 0.00 0.00 0.00 0.00 0.00 0.00 0.00 0.00 0.00 12 0.00 1.17 0.36 0.00 0.00 0.00 0.00 0.00 0.00 0.00 0.00 0.00 13 0.00 0.33 0.45 0.00 0.00 0.00 0.00 0.00 0.00 0.00 0.00 0.00 14 0.04 0.05 1.70 0.00 0.00 0.00 0.00 0.00 0.00 0.00 0.00 0.00 15 0.56 0.41 0.05 0.00 0.00 0.00 0.00 0.00 0.00 0.00 0.00 0.00 16 0.01 0.00 0.00 0.00 0.00 0.00 0.00 0.00 0.00 0.00 0.00 0.00 17 0.00 0.01 0.00 0.00 0.00 0.00 0.00 0.00 0.00 0.00 0.00 0.00 18 0.23 0.02 0.00 0.00 0.00 0.00 0.00 0.00 0.00 0.00 0.00 0.00 19 0.16 0.53 0.01 0.00 0.00 0.00 0.00 0.00 0.00 0.00 0.00 0.00 20 0.01 0.54 0.37 0.00 0.00 0.00 0.00 0.00 0.00 0.00 0.00 0.00 21 0.00 0.65 0.52 0.00 0.00 0.00 0.00 0.00 0.00 0.00 0.00 0.00 22 0.00 0.55 0.00 0.00 0.00 0.00 0.00 0.00 0.00 0.00 0.00 0.00 23 0.00 0.82 0.86 0.00 0.00 0.00 0.00 0.00 0.00 0.00 0.00 0.00 24 0.02 0.03 0.86 0.00 0.00 0.00 0.00 0.00 0.00 0.00 0.00 0.00 25 0.00 0.00 0.08 0.00 0.00 0.00 0.00 0.00 0.00 0.00 0.00 0.00 26 0.00 0.84 1.39 0.00 0.00 0.00 0.00 0.00 0.00 0.00 0.00 0.00 27 0.00 0.08 0.56 0.00 0.00 0.00 0.00 0.00 0.00 0.00 0.00 0.00 28 0.00 0.00 0.01 0.00 0.00 0.00 0.00 0.00 0.00 0.00 0.00 0.00 29 0.13 0.12 0.00 0.00 0.00 0.00 0.00 0.00 0.00 0.00 0.00 30 0.00 0.32 0.01 0.00 0.00 0.00 0.00 0.00 0.00 0.00 0.00 31 0.01 0.00 0.00 0.00 0.00 0.00 0.00
Total 1.23 16.24 8.70 0.00 0.00 0.00 0.00 0.00 0.00 0.00 0.00 0.00
Year To Date Total: 26.17 inches
s = snowe = estimated Precipitation is measured with a tipping bucket rain gauge. Ice and snow accumulations in the rain gage are not recorded until they melt.Precipitation from snow is not measured accurately
King County Water and Land Resources Division (206) 296-6519
Download streamflow and rainfall data from the Hydrologic Information Center at the King County Department of Natural Resources website:http://dnr.metrokc.gov/hydrodat
King County 43 April 2007

VMI 2006 Water Resources Data Report
36V East Maury Island2007 Water Year 01Oct to 19DecRainfall in inches
Data are provisional until end of yearDAY OCT NOV DEC JAN FEB MAR APR MAY JUN JUL AUG SEP
1 0.00 0.00 0.00 0.00 0.00 0.00 0.00 0.00 0.00 0.00 0.00 0.00 2 0.00 0.95 0.00 0.00 0.00 0.00 0.00 0.00 0.00 0.00 0.00 0.00 3 0.00 0.67 0.00 0.00 0.00 0.00 0.00 0.00 0.00 0.00 0.00 0.00 4 0.00 1.20 0.03 0.00 0.00 0.00 0.00 0.00 0.00 0.00 0.00 0.00 5 0.00 0.82 0.00 0.00 0.00 0.00 0.00 0.00 0.00 0.00 0.00 0.00 6 0.02 3.43 0.00 0.00 0.00 0.00 0.00 0.00 0.00 0.00 0.00 0.00 7 0.00 0.58 0.00 0.00 0.00 0.00 0.00 0.00 0.00 0.00 0.00 0.00 8 0.00 0.19 0.01 0.00 0.00 0.00 0.00 0.00 0.00 0.00 0.00 0.00 9 0.00 0.52 0.16 0.00 0.00 0.00 0.00 0.00 0.00 0.00 0.00 0.00 10 0.00 0.65 0.18 0.00 0.00 0.00 0.00 0.00 0.00 0.00 0.00 0.00 11 0.00 0.09 0.78 0.00 0.00 0.00 0.00 0.00 0.00 0.00 0.00 0.00 12 0.00 1.07 0.32 0.00 0.00 0.00 0.00 0.00 0.00 0.00 0.00 0.00 13 0.00 0.29 0.38 0.00 0.00 0.00 0.00 0.00 0.00 0.00 0.00 0.00 14 0.02 0.02 1.44 0.00 0.00 0.00 0.00 0.00 0.00 0.00 0.00 0.00 15 0.52 0.27 0.04 0.00 0.00 0.00 0.00 0.00 0.00 0.00 0.00 0.00 16 0.01 0.00 0.00 0.00 0.00 0.00 0.00 0.00 0.00 0.00 0.00 0.00 17 0.00 0.00 0.00 0.00 0.00 0.00 0.00 0.00 0.00 0.00 0.00 0.00 18 0.17 0.01 0.00 0.00 0.00 0.00 0.00 0.00 0.00 0.00 0.00 0.00 19 0.22 0.40 0.01 0.00 0.00 0.00 0.00 0.00 0.00 0.00 0.00 0.00 20 0.00 0.43 0.00 0.00 0.00 0.00 0.00 0.00 0.00 0.00 0.00 0.00 21 0.00 0.54 0.00 0.00 0.00 0.00 0.00 0.00 0.00 0.00 0.00 0.00 22 0.00 0.34 0.00 0.00 0.00 0.00 0.00 0.00 0.00 0.00 0.00 0.00 23 0.00 0.50 0.00 0.00 0.00 0.00 0.00 0.00 0.00 0.00 0.00 0.00 24 0.01 0.03 0.00 0.00 0.00 0.00 0.00 0.00 0.00 0.00 0.00 0.00 25 0.00 0.00 0.00 0.00 0.00 0.00 0.00 0.00 0.00 0.00 0.00 0.00 26 0.00 0.60 0.00 0.00 0.00 0.00 0.00 0.00 0.00 0.00 0.00 0.00 27 0.00 0.00 0.00 0.00 0.00 0.00 0.00 0.00 0.00 0.00 0.00 0.00 28 0.00 0.00 0.00 0.00 0.00 0.00 0.00 0.00 0.00 0.00 0.00 0.00 29 0.02 0.14 0.00 0.00 0.00 0.00 0.00 0.00 0.00 0.00 0.00 30 0.00 0.13 0.00 0.00 0.00 0.00 0.00 0.00 0.00 0.00 0.00 31 0.00 0.00 0.00 0.00 0.00 0.00 0.00
Total 0.99 13.87 3.35 0.00 0.00 0.00 0.00 0.00 0.00 0.00 0.00 0.00
Year To Date Total: 18.21 inches
s = snowe = estimated Precipitation is measured with a tipping bucket rain gauge. Ice and snow accumulations in the rain gage are not recorded until they melt.Precipitation from snow is not measured accurately
King County Water and Land Resources Division (206) 296-6519
Download streamflow and rainfall data from the Hydrologic Information Center at the King County Department of Natural Resources website:http://dnr.metrokc.gov/hydrodat
King County 44 April 2007

VMI 2006 Water Resources Data Report
43U North Vashon2007 Water Year 01Oct to 31DecRainfall in inches
Data are provisional until end of yearDAY OCT NOV DEC JAN FEB MAR APR MAY JUN JUL AUG SEP
1 0.00 0.00 0.00 0.00 0.00 0.00 0.00 0.00 0.00 0.00 0.00 0.00 2 0.00 1.13 0.01 0.00 0.00 0.00 0.00 0.00 0.00 0.00 0.00 0.00 3 0.00 1.40 0.00 0.00 0.00 0.00 0.00 0.00 0.00 0.00 0.00 0.00 4 0.00 1.72 0.02 0.00 0.00 0.00 0.00 0.00 0.00 0.00 0.00 0.00 5 0.00 1.19 0.00 0.00 0.00 0.00 0.00 0.00 0.00 0.00 0.00 0.00 6 0.00 3.60 0.00 0.00 0.00 0.00 0.00 0.00 0.00 0.00 0.00 0.00 7 0.00 0.49 0.00 0.00 0.00 0.00 0.00 0.00 0.00 0.00 0.00 0.00 8 0.00 0.35 0.05 0.00 0.00 0.00 0.00 0.00 0.00 0.00 0.00 0.00 9 0.00 0.47 0.25 0.00 0.00 0.00 0.00 0.00 0.00 0.00 0.00 0.00 10 0.00 1.43 0.15 0.00 0.00 0.00 0.00 0.00 0.00 0.00 0.00 0.00 11 0.00 0.26 1.43 0.00 0.00 0.00 0.00 0.00 0.00 0.00 0.00 0.00 12 0.00 1.42 1.02 0.00 0.00 0.00 0.00 0.00 0.00 0.00 0.00 0.00 13 0.00 0.52 1.01 0.00 0.00 0.00 0.00 0.00 0.00 0.00 0.00 0.00 14 0.04 0.09 2.30 0.00 0.00 0.00 0.00 0.00 0.00 0.00 0.00 0.00 15 0.40 1.04 0.14 0.00 0.00 0.00 0.00 0.00 0.00 0.00 0.00 0.00 16 0.00 0.00 0.00 0.00 0.00 0.00 0.00 0.00 0.00 0.00 0.00 0.00 17 0.00 0.00 0.00 0.00 0.00 0.00 0.00 0.00 0.00 0.00 0.00 0.00 18 0.21 0.02 0.00 0.00 0.00 0.00 0.00 0.00 0.00 0.00 0.00 0.00 19 0.20 0.81 0.00 0.00 0.00 0.00 0.00 0.00 0.00 0.00 0.00 0.00 20 0.00 0.86 0.54 0.00 0.00 0.00 0.00 0.00 0.00 0.00 0.00 0.00 21 0.00 1.35 0.48 0.00 0.00 0.00 0.00 0.00 0.00 0.00 0.00 0.00 22 0.00 0.85 0.00 0.00 0.00 0.00 0.00 0.00 0.00 0.00 0.00 0.00 23 0.00 0.79 0.96 0.00 0.00 0.00 0.00 0.00 0.00 0.00 0.00 0.00 24 0.03 0.00 1.02 0.00 0.00 0.00 0.00 0.00 0.00 0.00 0.00 0.00 25 0.00 0.00 0.16 0.00 0.00 0.00 0.00 0.00 0.00 0.00 0.00 0.00 26 0.00 0.76 1.38 0.00 0.00 0.00 0.00 0.00 0.00 0.00 0.00 0.00 27 0.00 0.31 0.48 0.00 0.00 0.00 0.00 0.00 0.00 0.00 0.00 0.00 28 0.00 0.01 0.00 0.00 0.00 0.00 0.00 0.00 0.00 0.00 0.00 0.00 29 0.35 0.00 0.01 0.00 0.00 0.00 0.00 0.00 0.00 0.00 0.00 30 0.00 0.42 0.00 0.00 0.00 0.00 0.00 0.00 0.00 0.00 0.00 31 0.00 0.00 0.00 0.00 0.00 0.00 0.00
Total 1.23 21.29 11.41 0.00 0.00 0.00 0.00 0.00 0.00 0.00 0.00 0.00
Year To Date Total: 33.93 inches
s = snowe = estimated Precipitation is measured with a tipping bucket rain gauge. Ice and snow accumulations in the rain gage are not recorded until they melt.Precipitation from snow is not measured accurately
King County Water and Land Resources Division (206) 296-6519
Download streamflow and rainfall data from the Hydrologic Information Center at the King County Department of Natural Resources website:http://dnr.metrokc.gov/hydrodat
King County 45 April 2007

VMI 2006 Water Resources Data Report
65U Tahlequah2007 Water Year 01Oct to 17JanRainfall in inches
Data are provisional until end of yearDAY OCT NOV DEC JAN FEB MAR APR MAY JUN JUL AUG SEP
1 0.00 0.00 0.00 0.29 0.00 0.00 0.00 0.00 0.00 0.00 0.00 0.00 2 0.00 1.14 0.00 1.92 0.00 0.00 0.00 0.00 0.00 0.00 0.00 0.00 3 0.00 0.82 0.00 0.73 0.00 0.00 0.00 0.00 0.00 0.00 0.00 0.00 4 0.00 1.60 0.05 0.11 0.00 0.00 0.00 0.00 0.00 0.00 0.00 0.00 5 0.00 1.05 0.00 1.39 0.00 0.00 0.00 0.00 0.00 0.00 0.00 0.00 6 0.13 4.01 0.00 0.05 0.00 0.00 0.00 0.00 0.00 0.00 0.00 0.00 7 0.00 0.79 0.00 1.36 0.00 0.00 0.00 0.00 0.00 0.00 0.00 0.00 8 0.01 0.33 0.04 0.01 0.00 0.00 0.00 0.00 0.00 0.00 0.00 0.00 9 0.00 0.36 0.22 0.27 0.00 0.00 0.00 0.00 0.00 0.00 0.00 0.00
10 0.00 0.90 0.23 0.03 0.00 0.00 0.00 0.00 0.00 0.00 0.00 0.00 11 0.00 0.29 0.93 0.11 0.00 0.00 0.00 0.00 0.00 0.00 0.00 0.00 12 0.00 1.34 0.39 0.01 0.00 0.00 0.00 0.00 0.00 0.00 0.00 0.00 13 0.00 0.30 0.55 0.00 0.00 0.00 0.00 0.00 0.00 0.00 0.00 0.00 14 0.05 0.04 1.70 0.06 0.00 0.00 0.00 0.00 0.00 0.00 0.00 0.00 15 0.61 0.36 0.14 0.04 0.00 0.00 0.00 0.00 0.00 0.00 0.00 0.00 16 0.02 0.00 0.00 0.13 0.00 0.00 0.00 0.00 0.00 0.00 0.00 0.00 17 0.00 0.00 0.00 0.11 0.00 0.00 0.00 0.00 0.00 0.00 0.00 0.00 18 0.25 0.03 0.01 0.00 0.00 0.00 0.00 0.00 0.00 0.00 0.00 0.00 19 0.21 0.58 0.00 0.00 0.00 0.00 0.00 0.00 0.00 0.00 0.00 0.00 20 0.00 0.62 0.38 0.00 0.00 0.00 0.00 0.00 0.00 0.00 0.00 0.00 21 0.00 0.68 0.46 0.00 0.00 0.00 0.00 0.00 0.00 0.00 0.00 0.00 22 0.00 0.49 0.00 0.00 0.00 0.00 0.00 0.00 0.00 0.00 0.00 0.00 23 0.00 0.72 0.77 0.00 0.00 0.00 0.00 0.00 0.00 0.00 0.00 0.00 24 0.03 0.05 0.83 0.00 0.00 0.00 0.00 0.00 0.00 0.00 0.00 0.00 25 0.00 0.00 0.02 0.00 0.00 0.00 0.00 0.00 0.00 0.00 0.00 0.00 26 0.00 0.52 1.24 0.00 0.00 0.00 0.00 0.00 0.00 0.00 0.00 0.00 27 0.00 0.00 0.38 0.00 0.00 0.00 0.00 0.00 0.00 0.00 0.00 0.00 28 0.00 0.01 0.00 0.00 0.00 0.00 0.00 0.00 0.00 0.00 0.00 0.00 29 0.02 0.00 0.01 0.00 0.00 0.00 0.00 0.00 0.00 0.00 0.00 30 0.00 0.54 0.00 0.00 0.00 0.00 0.00 0.00 0.00 0.00 0.00 31 0.00 0.00 0.00 0.00 0.00 0.00 0.00
Total 1.33 17.57 8.35 6.62 0.00 0.00 0.00 0.00 0.00 0.00 0.00 0.00
Year To Date Total: 33.87 inches
s = snowe = estimated Precipitation is measured with a tipping bucket rain gauge. Ice and snow accumulations in the rain gage are not recorded until they melt.Precipitation from snow is not measured accurately
King County Water and Land Resources Division (206) 296-6519
Download streamflow and rainfall data from the Hydrologic Information Center at the King County Department of Natural Resources website:http://dnr.metrokc.gov/hydrodat
King County 46 April 2007

VMI 2006 Water Resources Data Report
King County 47 April 2007
Appendix B
Water Quality Data

Groundwater Sites VMI 2006 Water Resources Data Report
PROJECT: 421195DC Locator: VAS_W-11 Locator: VAS_W-14 Locator: VAS_W-19 Locator: VAS_W-17Descrip: W-11-DOCKTON Descrip: W-14-KRISHNAN Descrip: W-19-THORSEN Descrip: W-17-PERLAClient Loc: Client Loc: Client Loc: Client Loc:Sampled: Jun 14, 2006 Sampled: Jun 13, 2006 Sampled: Jun 15, 2006 Sampled: Jun 12, 2006Lab ID: L39368-1 Lab ID: L39368-2 Lab ID: L39368-3 Lab ID: L39368-4Matrix: GRND WTR Matrix: GRND WTR Matrix: GRND WTR Matrix: GRND WTR% Solids: % Solids: % Solids: % Solids:
Parameters Value Qual MDL RDL Units Value Qual MDL RDL Units Value Qual MDL RDL Units Value Qual MDL RDL Units-Wet Weight Basis -Wet Weight Basis -Wet Weight Basis -Wet Weight Basis
COMBINED LABSM=CV SM4110B (03-03-002-003)
Chloride 5.32 0.05 0.1 mg/L 4.48 0.05 0.1 mg/L 3.01 0.05 0.1 mg/L 4.18 0.05 0.1 mg/LM=CV SM4500-NO3-F (03-03-012-003)
Nitrite + Nitrate Nitrogen <MDL 0.02 0.04 mg/L 0.031 <RDL 0.02 0.04 mg/L 0.473 0.02 0.04 mg/L 1.93 0.02 0.04 mg/LM=CV SM4500-P-F (03-03-012-003)
Orthophosphate PhosphorusM=ES NONE
Sample FunctionM=MT EPA 200.8 (06-03-004&004A-001)
Antimony, Total, ICP-MS <MDL 0.5 2.5 ug/L <MDL 0.5 2.5 ug/L <MDL 0.5 2.5 ug/L <MDL 0.5 2.5 ug/LArsenic, Total, ICP-MS 1.2 <RDL 0.5 2.5 ug/L 1.4 <RDL 0.5 2.5 ug/L 1.8 <RDL 0.5 2.5 ug/L <MDL 0.5 2.5 ug/LBarium, Total, ICP-MS 13.5 0.2 1 ug/L 4.41 0.2 1 ug/L 5.63 0.2 1 ug/L 2.99 0.2 1 ug/LBeryllium, Total, ICP-MS <MDL 0.2 1 ug/L <MDL 0.2 1 ug/L <MDL 0.2 1 ug/L <MDL 0.2 1 ug/LCadmium, Total, ICP-MS <MDL 0.1 0.5 ug/L <MDL 0.1 0.5 ug/L <MDL 0.1 0.5 ug/L <MDL 0.1 0.5 ug/LCalcium, Total, ICP-MSChromium, Total, ICP-MS <MDL 0.4 2 ug/L 1.7 <RDL 0.4 2 ug/L <MDL 0.4 2 ug/L 1.1 <RDL 0.4 2 ug/LCobalt, Total, ICP-MS <MDL 0.2 1 ug/L <MDL 0.2 1 ug/L <MDL 0.2 1 ug/L <MDL 0.2 1 ug/LCopper, Total, ICP-MS 44 0.4 2 ug/L 1.3 <RDL 0.4 2 ug/L <MDL 0.4 2 ug/L 3.19 0.4 2 ug/LIron, Total, ICP-MS 483 20 100 ug/L 604 20 100 ug/L 329 20 100 ug/L 102 20 100 ug/LLead, Total, ICP-MS 0.71 <RDL 0.2 1 ug/L 1.12 0.2 1 ug/L <MDL 0.2 1 ug/L 1.02 0.2 1 ug/LMagnesium, Total, ICP-MS 10900 30 150 ug/L 9700 30 150 ug/L 9770 30 150 ug/L 7350 30 150 ug/LMolybdenum, Total, ICP-MS 0.91 <RDL 0.5 2.5 ug/L <MDL 0.5 2.5 ug/L <MDL 0.5 2.5 ug/L <MDL 0.5 2.5 ug/LNickel, Total, ICP-MS <MDL 0.3 1.5 ug/L <MDL 0.3 1.5 ug/L 0.78 <RDL 0.3 1.5 ug/L 1.3 <RDL 0.3 1.5 ug/LSelenium, Total, ICP-MS <MDL 1.5 7.5 ug/L <MDL 1.5 7.5 ug/L <MDL 1.5 7.5 ug/L <MDL 1.5 7.5 ug/LSilver, Total, ICP-MS <MDL 0.2 1 ug/L <MDL 0.2 1 ug/L <MDL 0.2 1 ug/L <MDL 0.2 1 ug/LSodium, Total, ICP-MS 9100 20 100 ug/L 6110 20 100 ug/L 4680 20 100 ug/L 6470 20 100 ug/LThallium, Total, ICP-MS <MDL 0.2 1 ug/L <MDL 0.2 1 ug/L <MDL 0.2 1 ug/L <MDL 0.2 1 ug/LVanadium, Total, ICP-MS <MDL 0.3 1.5 ug/L 3.28 0.3 1.5 ug/L 1.75 0.3 1.5 ug/L 1.5 <RDL 0.3 1.5 ug/LZinc, Total, ICP-MS 29.9 0.5 2.5 ug/L 165 0.5 2.5 ug/L 89.7 0.5 2.5 ug/L 9.87 0.5 2.5 ug/LM=MT SM2340B.ED19 (06-03-009-000)
Hardness, Calc
King County 48 April 2007

Groundwater Sites VMI 2006 Water Resources Data Report
PROJECT: 421195DC
Parameters
COMBINED LABSM=CV SM4110B (03-03-002-003)
ChlorideM=CV SM4500-NO3-F (03-03-012-003)
Nitrite + Nitrate NitrogenM=CV SM4500-P-F (03-03-012-003)
Orthophosphate PhosphorusM=ES NONE
Sample FunctionM=MT EPA 200.8 (06-03-004&004A-001)
Antimony, Total, ICP-MSArsenic, Total, ICP-MSBarium, Total, ICP-MSBeryllium, Total, ICP-MSCadmium, Total, ICP-MSCalcium, Total, ICP-MSChromium, Total, ICP-MSCobalt, Total, ICP-MSCopper, Total, ICP-MSIron, Total, ICP-MSLead, Total, ICP-MSMagnesium, Total, ICP-MSMolybdenum, Total, ICP-MSNickel, Total, ICP-MSSelenium, Total, ICP-MSSilver, Total, ICP-MSSodium, Total, ICP-MSThallium, Total, ICP-MSVanadium, Total, ICP-MSZinc, Total, ICP-MSM=MT SM2340B.ED19 (06-03-009-000)
Hardness, Calc
Locator: VAS_W-02A Locator: VAS_W-03 Locator: VAS_W-04 Locator: VAS_W-21Descrip: W-02A-HEIGHTS W #1 Descrip: W-03-GLEN ACRES Descrip: W-04-RODRIQUES Descrip: W-21-KUPERBERGClient Loc: Client Loc: Client Loc: Client Loc:Sampled: Jun 13, 2006 Sampled: Jun 12, 2006 Sampled: Jun 14, 2006 Sampled: Jun 13, 2006Lab ID: L39368-5 Lab ID: L39368-6 Lab ID: L39368-7 Lab ID: L39368-8Matrix: GRND WTR Matrix: GRND WTR Matrix: GRND WTR Matrix: GRND WTR% Solids: % Solids: % Solids: % Solids:
Value Qual MDL RDL Units Value Qual MDL RDL Units Value Qual MDL RDL Units Value Qual MDL RDL Units-Wet Weight Basis -Wet Weight Basis -Wet Weight Basis -Wet Weight Basis
4.29 0.05 0.1 mg/L 7.99 0.05 0.1 mg/L 3.89 0.05 0.1 mg/L 3.98 0.05 0.1 mg/L
2.17 0.02 0.04 mg/L 0.378 0.02 0.04 mg/L <MDL 0.02 0.04 mg/L <MDL 0.02 0.04 mg/L
0.104 0.002 0.005 mg/L 0.633 0.01 0.025 mg/L 0.0604 0.002 0.005 mg/L
AREP@L39368-20 none
<MDL 0.5 2.5 ug/L <MDL 0.5 2.5 ug/L <MDL 0.5 2.5 ug/L <MDL 0.5 2.5 ug/L6.06 0.5 2.5 ug/L 0.84 <RDL 0.5 2.5 ug/L 18.3 0.5 2.5 ug/L 3.38 0.5 2.5 ug/L4.04 0.2 1 ug/L 13.3 0.2 1 ug/L 23.9 0.2 1 ug/L 9.4 0.2 1 ug/L
<MDL 0.2 1 ug/L <MDL 0.2 1 ug/L <MDL 0.2 1 ug/L <MDL 0.2 1 ug/L<MDL 0.1 0.5 ug/L <MDL 0.1 0.5 ug/L <MDL 0.1 0.5 ug/L <MDL 0.1 0.5 ug/L
18400 50 250 ug/L 21100 50 250 ug/L 21700 50 250 ug/L1.5 <RDL 0.4 2 ug/L 0.79 <RDL 0.4 2 ug/L <MDL 0.4 2 ug/L <MDL 0.4 2 ug/L
<MDL 0.2 1 ug/L <MDL 0.2 1 ug/L <MDL 0.2 1 ug/L <MDL 0.2 1 ug/L1.2 <RDL 0.4 2 ug/L 0.5 <RDL 0.4 2 ug/L 1.1 <RDL 0.4 2 ug/L 0.92 <RDL 0.4 2 ug/L34 <RDL 20 100 ug/L <MDL 20 100 ug/L 99 <RDL 20 100 ug/L 315 20 100 ug/L
<MDL 0.2 1 ug/L <MDL 0.2 1 ug/L 0.2 <RDL 0.2 1 ug/L <MDL 0.2 1 ug/L11700 30 150 ug/L 21000 30 150 ug/L 7330 30 150 ug/L 9900 30 150 ug/L
0.63 <RDL 0.5 2.5 ug/L 6.79 0.5 2.5 ug/L 5.91 0.5 2.5 ug/L 0.52 <RDL 0.5 2.5 ug/L0.42 <RDL 0.3 1.5 ug/L <MDL 0.3 1.5 ug/L 0.64 <RDL 0.3 1.5 ug/L <MDL 0.3 1.5 ug/L
<MDL 1.5 7.5 ug/L <MDL 1.5 7.5 ug/L <MDL 1.5 7.5 ug/L <MDL 1.5 7.5 ug/L<MDL 0.2 1 ug/L <MDL 0.2 1 ug/L <MDL 0.2 1 ug/L <MDL 0.2 1 ug/L
6530 20 100 ug/L 7330 20 100 ug/L<MDL 0.2 1 ug/L <MDL 0.2 1 ug/L <MDL 0.2 1 ug/L <MDL 0.2 1 ug/L
3.11 0.3 1.5 ug/L 5.33 0.3 1.5 ug/L 0.37 <RDL 0.3 1.5 ug/L <MDL 0.3 1.5 ug/L3.66 0.5 2.5 ug/L 1.4 <RDL 0.5 2.5 ug/L 15.1 0.5 2.5 ug/L 0.82 <RDL 0.5 2.5 ug/L
94 0.2 1.25 mg CaCO3/L 82.9 0.2 1.25 mg CaCO3/L 95.1 0.2 1.25 mg CaCO3/L
King County 49 April 2007

Groundwater Sites VMI 2006 Water Resources Data Report
PROJECT: 421195DC
Parameters
COMBINED LABSM=CV SM4110B (03-03-002-003)
ChlorideM=CV SM4500-NO3-F (03-03-012-003)
Nitrite + Nitrate NitrogenM=CV SM4500-P-F (03-03-012-003)
Orthophosphate PhosphorusM=ES NONE
Sample FunctionM=MT EPA 200.8 (06-03-004&004A-001)
Antimony, Total, ICP-MSArsenic, Total, ICP-MSBarium, Total, ICP-MSBeryllium, Total, ICP-MSCadmium, Total, ICP-MSCalcium, Total, ICP-MSChromium, Total, ICP-MSCobalt, Total, ICP-MSCopper, Total, ICP-MSIron, Total, ICP-MSLead, Total, ICP-MSMagnesium, Total, ICP-MSMolybdenum, Total, ICP-MSNickel, Total, ICP-MSSelenium, Total, ICP-MSSilver, Total, ICP-MSSodium, Total, ICP-MSThallium, Total, ICP-MSVanadium, Total, ICP-MSZinc, Total, ICP-MSM=MT SM2340B.ED19 (06-03-009-000)
Hardness, Calc
Locator: VAS_S-03 Locator: VAS_W-07 Locator: VAS_W-08 Locator: VAS_W-10ADescrip: S-03-ATLAS WATER Descrip: W-07-TOOMEY/SORGE Descrip: W-08-KIRO/ENTERCOM Descrip: W-10A-GOLD BEACH WClient Loc: Client Loc: Client Loc: Client Loc:Sampled: Jun 15, 2006 Sampled: Jun 13, 2006 Sampled: Jun 13, 2006 Sampled: Jun 14, 2006Lab ID: L39368-9 Lab ID: L39368-10 Lab ID: L39368-11 Lab ID: L39368-12Matrix: GRND WTR Matrix: GRND WTR Matrix: GRND WTR Matrix: GRND WTR% Solids: % Solids: % Solids: % Solids:
Value Qual MDL RDL Units Value Qual MDL RDL Units Value Qual MDL RDL Units Value Qual MDL RDL Units-Wet Weight Basis -Wet Weight Basis -Wet Weight Basis -Wet Weight Basis
5.89 0.05 0.1 mg/L 3 0.05 0.1 mg/L 8.73 0.05 0.1 mg/L 10.7 0.05 0.1 mg/L
3 0.04 0.08 mg/L <MDL 0.02 0.04 mg/L <MDL 0.02 0.04 mg/L 4.42 0.1 0.2 mg/L
0.322 0.01 0.025 mg/L
AREP@L39368-21 none
<MDL 0.5 2.5 ug/L <MDL 0.5 2.5 ug/L <MDL 0.5 2.5 ug/L <MDL 0.5 2.5 ug/L1.1 <RDL 0.5 2.5 ug/L 13 0.5 2.5 ug/L 2 <RDL 0.5 2.5 ug/L 1.9 <RDL 0.5 2.5 ug/L
6.92 0.2 1 ug/L 15.2 0.2 1 ug/L 29.9 0.2 1 ug/L 5.85 0.2 1 ug/L<MDL 0.2 1 ug/L <MDL 0.2 1 ug/L <MDL 0.2 1 ug/L <MDL 0.2 1 ug/L
1.12 0.1 0.5 ug/L <MDL 0.1 0.5 ug/L <MDL 0.1 0.5 ug/L <MDL 0.1 0.5 ug/L22100 50 250 ug/L
1.6 <RDL 0.4 2 ug/L <MDL 0.4 2 ug/L <MDL 0.4 2 ug/L 6.64 0.4 2 ug/L<MDL 0.2 1 ug/L <MDL 0.2 1 ug/L <MDL 0.2 1 ug/L <MDL 0.2 1 ug/L
86.1 0.4 2 ug/L 0.95 <RDL 0.4 2 ug/L 0.88 <RDL 0.4 2 ug/L 1.7 <RDL 0.4 2 ug/L110 20 100 ug/L 84 <RDL 20 100 ug/L 344 20 100 ug/L 97 <RDL 20 100 ug/L1.3 0.2 1 ug/L <MDL 0.2 1 ug/L <MDL 0.2 1 ug/L <MDL 0.2 1 ug/L
13400 30 150 ug/L 9000 30 150 ug/L 20400 30 150 ug/L 13000 30 150 ug/L<MDL 0.5 2.5 ug/L 5.55 0.5 2.5 ug/L 9.38 0.5 2.5 ug/L <MDL 0.5 2.5 ug/L
2.66 0.3 1.5 ug/L <MDL 0.3 1.5 ug/L <MDL 0.3 1.5 ug/L 2.4 0.3 1.5 ug/L<MDL 1.5 7.5 ug/L <MDL 1.5 7.5 ug/L <MDL 1.5 7.5 ug/L <MDL 1.5 7.5 ug/L<MDL 0.2 1 ug/L <MDL 0.2 1 ug/L <MDL 0.2 1 ug/L <MDL 0.2 1 ug/L
6520 20 100 ug/L 22200 20 100 ug/L<MDL 0.2 1 ug/L <MDL 0.2 1 ug/L <MDL 0.2 1 ug/L <MDL 0.2 1 ug/L
5.16 0.3 1.5 ug/L <MDL 0.3 1.5 ug/L <MDL 0.3 1.5 ug/L 3.84 0.3 1.5 ug/L162 0.5 2.5 ug/L 6.5 0.5 2.5 ug/L 5.12 0.5 2.5 ug/L
92.3 0.2 1.25 mg CaCO3/L
King County 50 April 2007

Groundwater Sites VMI 2006 Water Resources Data Report
PROJECT: 421195DC
Parameters
COMBINED LABSM=CV SM4110B (03-03-002-003)
ChlorideM=CV SM4500-NO3-F (03-03-012-003)
Nitrite + Nitrate NitrogenM=CV SM4500-P-F (03-03-012-003)
Orthophosphate PhosphorusM=ES NONE
Sample FunctionM=MT EPA 200.8 (06-03-004&004A-001)
Antimony, Total, ICP-MSArsenic, Total, ICP-MSBarium, Total, ICP-MSBeryllium, Total, ICP-MSCadmium, Total, ICP-MSCalcium, Total, ICP-MSChromium, Total, ICP-MSCobalt, Total, ICP-MSCopper, Total, ICP-MSIron, Total, ICP-MSLead, Total, ICP-MSMagnesium, Total, ICP-MSMolybdenum, Total, ICP-MSNickel, Total, ICP-MSSelenium, Total, ICP-MSSilver, Total, ICP-MSSodium, Total, ICP-MSThallium, Total, ICP-MSVanadium, Total, ICP-MSZinc, Total, ICP-MSM=MT SM2340B.ED19 (06-03-009-000)
Hardness, Calc
Locator: VAS_W-09A Locator: VAS_W-12 Locator: VAS_W-15 Locator: VAS_W-16ADescrip: WHITE #1 Descrip: W-12-HOLLYMERE Descrip: W-15-ANDERSON Descrip: W-16A-BAKER/KLEMKAClient Loc: Client Loc: Client Loc: Client Loc:Sampled: Jun 14, 2006 Sampled: Jun 14, 2006 Sampled: Jun 13, 2006 Sampled: Jun 12, 2006Lab ID: L39368-13 Lab ID: L39368-14 Lab ID: L39368-15 Lab ID: L39368-16Matrix: GRND WTR Matrix: GRND WTR Matrix: GRND WTR Matrix: GRND WTR% Solids: % Solids: % Solids: % Solids:
Value Qual MDL RDL Units Value Qual MDL RDL Units Value Qual MDL RDL Units Value Qual MDL RDL Units-Wet Weight Basis -Wet Weight Basis -Wet Weight Basis -Wet Weight Basis
5.13 0.05 0.1 mg/L 4.17 0.05 0.1 mg/L 4.92 0.05 0.1 mg/L 3.83 0.05 0.1 mg/L
<MDL 0.02 0.04 mg/L <MDL 0.02 0.04 mg/L <MDL 0.02 0.04 mg/L 4.27 0.04 0.08 mg/L
0.0724 0.002 0.005 mg/L 0.17 0.002 0.005 mg/L
<MDL 0.5 2.5 ug/L <MDL 0.5 2.5 ug/L <MDL 0.5 2.5 ug/L <MDL 0.5 2.5 ug/L4.8 0.5 2.5 ug/L 5.37 0.5 2.5 ug/L 1.1 <RDL 0.5 2.5 ug/L <MDL 0.5 2.5 ug/L
9.95 0.2 1 ug/L 9.2 0.2 1 ug/L 1.27 0.2 1 ug/L 3.36 0.2 1 ug/L<MDL 0.2 1 ug/L <MDL 0.2 1 ug/L <MDL 0.2 1 ug/L <MDL 0.2 1 ug/L<MDL 0.1 0.5 ug/L <MDL 0.1 0.5 ug/L <MDL 0.1 0.5 ug/L <MDL 0.1 0.5 ug/L
17100 50 250 ug/L 25100 100 500 ug/L<MDL 0.4 2 ug/L <MDL 0.4 2 ug/L <MDL 0.4 2 ug/L 2.09 0.4 2 ug/L<MDL 0.2 1 ug/L <MDL 0.2 1 ug/L <MDL 0.2 1 ug/L <MDL 0.2 1 ug/L<MDL 0.4 2 ug/L 48.3 0.4 2 ug/L <MDL 0.4 2 ug/L 2.1 0.4 2 ug/L
851 20 100 ug/L 235 20 100 ug/L 132 20 100 ug/L 82 <RDL 20 100 ug/L<MDL 0.2 1 ug/L <MDL 0.2 1 ug/L <MDL 0.2 1 ug/L 0.35 <RDL 0.2 1 ug/L
11300 30 150 ug/L 7110 30 150 ug/L 8080 30 150 ug/L 6640 30 150 ug/L1 <RDL 0.5 2.5 ug/L 3.3 0.5 2.5 ug/L <MDL 0.5 2.5 ug/L <MDL 0.5 2.5 ug/L
<MDL 0.3 1.5 ug/L <MDL 0.3 1.5 ug/L <MDL 0.3 1.5 ug/L 0.5 <RDL 0.3 1.5 ug/L<MDL 1.5 7.5 ug/L <MDL 1.5 7.5 ug/L <MDL 1.5 7.5 ug/L <MDL 1.5 7.5 ug/L<MDL 0.2 1 ug/L <MDL 0.2 1 ug/L <MDL 0.2 1 ug/L <MDL 0.2 1 ug/L
7620 20 100 ug/L 5360 20 100 ug/L 5910 20 100 ug/L<MDL 0.2 1 ug/L <MDL 0.2 1 ug/L <MDL 0.2 1 ug/L <MDL 0.2 1 ug/L<MDL 0.3 1.5 ug/L <MDL 0.3 1.5 ug/L 0.83 <RDL 0.3 1.5 ug/L 3.45 0.3 1.5 ug/L
21.8 0.5 2.5 ug/L 15.3 0.5 2.5 ug/L 90.7 0.5 2.5 ug/L 12.6 0.5 2.5 ug/L
89.1 0.2 1.25 mg CaCO3/L 92 0.4 2.5 mg CaCO3/L
King County 51 April 2007

Groundwater Sites VMI 2006 Water Resources Data Report
PROJECT: 421195DC
Parameters
COMBINED LABSM=CV SM4110B (03-03-002-003)
ChlorideM=CV SM4500-NO3-F (03-03-012-003)
Nitrite + Nitrate NitrogenM=CV SM4500-P-F (03-03-012-003)
Orthophosphate PhosphorusM=ES NONE
Sample FunctionM=MT EPA 200.8 (06-03-004&004A-001)
Antimony, Total, ICP-MSArsenic, Total, ICP-MSBarium, Total, ICP-MSBeryllium, Total, ICP-MSCadmium, Total, ICP-MSCalcium, Total, ICP-MSChromium, Total, ICP-MSCobalt, Total, ICP-MSCopper, Total, ICP-MSIron, Total, ICP-MSLead, Total, ICP-MSMagnesium, Total, ICP-MSMolybdenum, Total, ICP-MSNickel, Total, ICP-MSSelenium, Total, ICP-MSSilver, Total, ICP-MSSodium, Total, ICP-MSThallium, Total, ICP-MSVanadium, Total, ICP-MSZinc, Total, ICP-MSM=MT SM2340B.ED19 (06-03-009-000)
Hardness, Calc
Locator: VAS_W-13 Locator: VAS_W-20 Locator: VAS_W-06 Locator: GROUNDDUPDescrip: W-13-MISTY ISLE FA Descrip: W-20-JOHNSON Descrip: W-06-PACKARD/HEADL Descrip: Groundwater DuplicClient Loc: Client Loc: Client Loc: Client Loc: field replicate collected at W-04Sampled: Jun 15, 2006 Sampled: Jun 12, 2006 Sampled: Jun 12, 2006 Sampled: Jun 14, 2006Lab ID: L39368-17 Lab ID: L39368-18 Lab ID: L39368-19 Lab ID: L39368-20Matrix: GRND WTR Matrix: GRND WTR Matrix: GRND WTR Matrix: GRND WTR% Solids: % Solids: % Solids: % Solids:
Value Qual MDL RDL Units Value Qual MDL RDL Units Value Qual MDL RDL Units Value Qual MDL RDL Units-Wet Weight Basis -Wet Weight Basis -Wet Weight Basis -Wet Weight Basis
9.79 0.1 0.2 mg/L 3.72 0.05 0.1 mg/L 3.36 0.05 0.1 mg/L 4.05 0.05 0.1 mg/L
2.44 0.02 0.04 mg/L 3.2 0.02 0.04 mg/L 1.43 0.02 0.04 mg/L <MDL 0.02 0.04 mg/L
0.648 0.01 0.025 mg/L
FREP@L39368-7 none
<MDL 0.5 2.5 ug/L <MDL 0.5 2.5 ug/L <MDL 0.5 2.5 ug/L <MDL 0.5 2.5 ug/L1 <RDL 0.5 2.5 ug/L 0.54 <RDL 0.5 2.5 ug/L 0.9 <RDL 0.5 2.5 ug/L 18.2 0.5 2.5 ug/L
5.1 0.2 1 ug/L 3.14 0.2 1 ug/L 2.2 0.2 1 ug/L 24 0.2 1 ug/L<MDL 0.2 1 ug/L <MDL 0.2 1 ug/L <MDL 0.2 1 ug/L <MDL 0.2 1 ug/L<MDL 0.1 0.5 ug/L <MDL 0.1 0.5 ug/L <MDL 0.1 0.5 ug/L <MDL 0.1 0.5 ug/L
21200 50 250 ug/L2.27 0.4 2 ug/L 3.02 0.4 2 ug/L 1.5 <RDL 0.4 2 ug/L <MDL 0.4 2 ug/L
<MDL 0.2 1 ug/L <MDL 0.2 1 ug/L <MDL 0.2 1 ug/L <MDL 0.2 1 ug/L2 <RDL 0.4 2 ug/L 3.71 0.4 2 ug/L 1.6 <RDL 0.4 2 ug/L 1.1 <RDL 0.4 2 ug/L
32 <RDL 20 100 ug/L 29 <RDL 20 100 ug/L 24 <RDL 20 100 ug/L 96 <RDL 20 100 ug/L0.2 <RDL 0.2 1 ug/L 0.25 <RDL 0.2 1 ug/L 0.31 <RDL 0.2 1 ug/L <MDL 0.2 1 ug/L
13800 30 150 ug/L 6340 30 150 ug/L 7780 30 150 ug/L 7350 30 150 ug/L<MDL 0.5 2.5 ug/L <MDL 0.5 2.5 ug/L <MDL 0.5 2.5 ug/L 5.85 0.5 2.5 ug/L
1 <RDL 0.3 1.5 ug/L <MDL 0.3 1.5 ug/L <MDL 0.3 1.5 ug/L 0.63 <RDL 0.3 1.5 ug/L<MDL 1.5 7.5 ug/L <MDL 1.5 7.5 ug/L <MDL 1.5 7.5 ug/L <MDL 1.5 7.5 ug/L<MDL 0.2 1 ug/L <MDL 0.2 1 ug/L <MDL 0.2 1 ug/L <MDL 0.2 1 ug/L
6200 20 100 ug/L 4800 20 100 ug/L 4750 20 100 ug/L<MDL 0.2 1 ug/L <MDL 0.2 1 ug/L <MDL 0.2 1 ug/L <MDL 0.2 1 ug/L
4.78 0.3 1.5 ug/L 2.47 0.3 1.5 ug/L 3.12 0.3 1.5 ug/L 0.37 <RDL 0.3 1.5 ug/L9.25 0.5 2.5 ug/L 48.7 0.5 2.5 ug/L 5.68 0.5 2.5 ug/L 12.1 0.5 2.5 ug/L
83.1 0.2 1.25 mg CaCO3/L
King County 52 April 2007

Groundwater Sites VMI 2006 Water Resources Data Report
PROJECT: 421195DC
Parameters
COMBINED LABSM=CV SM4110B (03-03-002-003)
ChlorideM=CV SM4500-NO3-F (03-03-012-003)
Nitrite + Nitrate NitrogenM=CV SM4500-P-F (03-03-012-003)
Orthophosphate PhosphorusM=ES NONE
Sample FunctionM=MT EPA 200.8 (06-03-004&004A-001)
Antimony, Total, ICP-MSArsenic, Total, ICP-MSBarium, Total, ICP-MSBeryllium, Total, ICP-MSCadmium, Total, ICP-MSCalcium, Total, ICP-MSChromium, Total, ICP-MSCobalt, Total, ICP-MSCopper, Total, ICP-MSIron, Total, ICP-MSLead, Total, ICP-MSMagnesium, Total, ICP-MSMolybdenum, Total, ICP-MSNickel, Total, ICP-MSSelenium, Total, ICP-MSSilver, Total, ICP-MSSodium, Total, ICP-MSThallium, Total, ICP-MSVanadium, Total, ICP-MSZinc, Total, ICP-MSM=MT SM2340B.ED19 (06-03-009-000)
Hardness, Calc
Locator: GROUNDDUPDescrip: Groundwater DuplicClient Loc: field replicate collected at W-07Sampled: Jun 13, 2006Lab ID: L39368-21Matrix: GRND WTR% Solids:
Value Qual MDL RDL Units-Wet Weight Basis
2.98 0.05 0.1 mg/L
<MDL 0.02 0.04 mg/L
0.309 0.01 0.025 mg/L
FREP@L39368-10 none
<MDL 0.5 2.5 ug/L12 0.5 2.5 ug/L
15.1 0.2 1 ug/L<MDL 0.2 1 ug/L<MDL 0.1 0.5 ug/L
22600 100 500 ug/L<MDL 0.4 2 ug/L<MDL 0.2 1 ug/L
0.85 <RDL 0.4 2 ug/L51 <RDL 20 100 ug/L
<MDL 0.2 1 ug/L9460 30 150 ug/L5.75 0.5 2.5 ug/L
<MDL 0.3 1.5 ug/L<MDL 1.5 7.5 ug/L<MDL 0.2 1 ug/L
21400 20 100 ug/L<MDL 0.2 1 ug/L<MDL 0.3 1.5 ug/L
82.7 0.5 2.5 ug/L
95.5 0.4 2.5 mg CaCO3/L
King County 53 April 2007

Special Sampling Sites VMI 2006 Water Resources Data Report
VAS_W-07 GROUNDDUP VAS_W-02A VAS_W-21 VAS_W-09A VAS_W-12 VAS_W-04 GROUNDDUPTOOMEY/SORGE collected at W-07 HEIGHTS #1 KUPERBERG WHITE #1 HOLLYMERE RODRIQUES collected at W-04
Jun 13, 2006 Jun 13, 2006 Jun 13, 2006 Jun 13, 2006 Jun 14, 2006 Jun 14, 2006 Jun 14, 2006 Jun 14, 2006L39368-10 L39368-21 L39368-5 L39368-8 L39368-13 L39368-14 L39368-7 L39368-20
KCEL MDL RDL UnitsArsenic, Total 13 12 As(total) 0.5 2.5 ug/L 6.06 3.38 4.8 5.37 18.3 18.2
Average Arsenic 24.1 -- 7.52 3.98 5.82 5.94 18.5 --
Brooks Rand MDL PQL UnitsArsenic, inorganic 11.8 11.1 As(In) 0.4 1 ug/L 5.24 1.66 5.03 4.86 20.1 2.64 EAs (III) 11.7 11.5 As(III) 0.2 0.5 ug/L 0.035 0.921 4.5 5.5 17.5 17.9As (V) calculated 0.4 0.4 5.2 0.74 0.53 0.04 2.66 --qualifier U U B U R
relative % As(III) 99% 104% As(In) 0.04 0.1 ug/L 1% 55% 89% 113% 87% --relative % As(V) 1% 0% 99% 45% 11% 1% 13% --
Other Parameters MDL RDL Unitshardness 92.3 95.5 Hard 0.4 2.5 mg/L 94.0 95.1 89.1 92.0 82.9 83.1Ortho-P 0.32 0.31 Ortho-P 0.01 0.025 mg/L 0.10 0.06 0.07 0.17 0.63 0.65pH (average) 8.32 8.32 pH-F 0.1 1.0 -- 7.36 7.90 7.60 8.19 8.28 8.28Dissolved Oxygen 4.0 -- DO-F 0.1 0.1 mg/L 3.9 2.7 0.8 2.3 2.4 --(average)
U: Appears in the "Q" (qualifier) column when the concentration of the parameter is below the lowest possible level that can be detected with the analysis method used.
King County 54 April 2007

Monthly Streams Sites VMI 2006 Water Resources Data Report
PROJECT: 421195DC Locator: VA12A Locator: VA23A Locator: VA37ADescrip: SHINGLEMILL CREEK Descrip: CHRISTENSEN CREEK Descrip: TAHLEQUAH CREEK UPClient Loc: Client Loc: Client Loc:Sampled: Nov 14, 2006 Sampled: Nov 14, 2006 Sampled: Nov 14, 2006Lab ID: L41073-1 Lab ID: L41073-2 Lab ID: L41073-3Matrix: FRESH WTR Matrix: FRESH WTR Matrix: FRESH WTR% Solids: % Solids: % Solids:
Parameters Value Qual MDL RDL Units Value Qual MDL RDL Units Value Qual MDL RDL Units-Wet Weight Basis -Wet Weight Basis -Wet Weight Basis
COMBINED LABSM=CV SM2130-B (03-01-011-003)
Turbidity 6.75 0.5 2 NTU 1.9 <RDL 0.5 2 NTU 3.2 0.5 2 NTUM=CV SM2320-B (03-03-001-003)
Total Alkalinity 23.5 1 10 mg CaCO3/L 33 1 10 mg CaCO3/L 23.1 1 10 mg CaCO3/LM=CV SM2540-D (03-01-009-002)
Total Suspended Solids 13.2 0.5 1 mg/L 4.8 0.5 1 mg/L 6.4 1 2 mg/LM=CV SM4500-N-C (03-03-013-002)
Total Nitrogen 2.22 0.05 0.1 mg/L 1.84 0.05 0.1 mg/L 2.87 0.05 0.1 mg/LM=CV SM4500-NH3-G (03-03-012-003)
Ammonia Nitrogen <MDL 0.01 0.02 mg/L <MDL 0.01 0.02 mg/L 0.012 <RDL 0.01 0.02 mg/LM=CV SM4500-NO3-F (03-03-012-003)
Nitrite + Nitrate Nitrogen 1.9 0.02 0.04 mg/L 1.69 0.02 0.04 mg/L 2.57 0.02 0.04 mg/LM=CV SM4500-P-B,FMOD(03-03-013-002)
Total Phosphorus 0.0432 0.005 0.01 mg/L 0.0383 0.005 0.01 mg/L 0.0331 0.005 0.01 mg/LM=CV SM4500-P-F (03-03-012-003)
Orthophosphate Phosphorus 0.0154 0.002 0.005 mg/L 0.0199 0.002 0.005 mg/L 0.00867 0.002 0.005 mg/LM=ES Hydrolab (02-01-005-002)
Conductivity, Field 88.6 0.5 10 umhos/cm 107 0.5 10 umhos/cm 105 0.5 10 umhos/cmDissolved Oxygen, Field 12 0.5 1 mg/L 11.1 0.5 1 mg/L 10.1 0.5 1 mg/LpH, Field 7.2 pH 7 pH 6.8 pHSample Temperature, Field 7 deg C 7.5 deg C 7.8 deg CM=ES NONE
Field Personnel DR none DR none DR noneSample Function S none S none S noneSample Start Time 860 hr 830 hr 650 hrSampling Method 11011, 60201, 80011 none 11011, 60201 none 11011, 60201, 80011 noneStaff Height 3.4 ft 4.1 ftStorm Or Non-Storm N none N none N noneM=MC METRO MC SOP 6.5.1
Escherichia coli 52 CFU/100ml 220 CFU/100ml 24 CFU/100mlM=MC SM-9222 D ed.17
Fecal Coliform 57 CFU/100ml 210 CFU/100ml 14 CFU/100ml
King County 55 April 2007

Monthly Streams Sites VMI 2006 Water Resources Data Report
PROJECT: 421195DC
Parameters
COMBINED LABSM=CV SM2130-B (03-01-011-003)
TurbidityM=CV SM2320-B (03-03-001-003)
Total AlkalinityM=CV SM2540-D (03-01-009-002)
Total Suspended SolidsM=CV SM4500-N-C (03-03-013-002)
Total NitrogenM=CV SM4500-NH3-G (03-03-012-003)
Ammonia NitrogenM=CV SM4500-NO3-F (03-03-012-003)
Nitrite + Nitrate NitrogenM=CV SM4500-P-B,FMOD(03-03-013-002)
Total PhosphorusM=CV SM4500-P-F (03-03-012-003)
Orthophosphate PhosphorusM=ES Hydrolab (02-01-005-002)
Conductivity, FieldDissolved Oxygen, FieldpH, FieldSample Temperature, FieldM=ES NONE
Field PersonnelSample FunctionSample Start TimeSampling MethodStaff HeightStorm Or Non-StormM=MC METRO MC SOP 6.5.1
Escherichia coliM=MC SM-9222 D ed.17
Fecal Coliform
Locator: VA41A Locator: VA42A Locator: VA45ADescrip: FISHER CREEK UPSTR Descrip: JUDD CREEK AT SW 2 Descrip: MILETA CREEK DOWNSClient Loc: Client Loc: Client Loc:Sampled: Nov 14, 2006 Sampled: Nov 14, 2006 Sampled: Nov 14, 2006Lab ID: L41073-4 Lab ID: L41073-5 Lab ID: L41073-6Matrix: FRESH WTR Matrix: FRESH WTR Matrix: FRESH WTR% Solids: % Solids: % Solids:
Value Qual MDL RDL Units Value Qual MDL RDL Units Value Qual MDL RDL Units-Wet Weight Basis -Wet Weight Basis -Wet Weight Basis
3.29 0.5 2 NTU 5.67 0.5 2 NTU 3.69 0.5 2 NTU
32.5 1 10 mg CaCO3/L 21.7 1 10 mg CaCO3/L 4.1 <RDL 1 10 mg CaCO3/L
8.8 0.5 1 mg/L 10 0.5 1 mg/L 3.03 0.5 1 mg/L
2.16 0.005 0.01 mg/L 2.06 0.005 0.01 mg/L 6.08 0.01 0.02 mg/L
<MDL 0.01 0.02 mg/L <MDL 0.01 0.02 mg/L <MDL 0.01 0.02 mg/L
1.81 0.02 0.04 mg/L 1.63 0.02 0.04 mg/L 4.85 0.1 0.2 mg/L
0.045 0.005 0.01 mg/L 0.0394 0.005 0.01 mg/L 0.0208 0.005 0.01 mg/L
0.0195 0.002 0.005 mg/L 0.0101 0.002 0.005 mg/L 0.0035 <RDL 0.002 0.005 mg/L
111 0.5 10 umhos/cm 84.1 0.5 10 umhos/cm 90.2 0.5 10 umhos/cm10.6 0.5 1 mg/L 11.2 0.5 1 mg/L 10.8 0.5 1 mg/L
7 pH 7.1 pH 6.4 pH7.4 deg C 7.2 deg C 8.9 deg C
DR none DR none DR noneS none S none S none
720 hr 740 hr 760 hr11011, 60201 none 11011, 60201, 80011 none 11011, 60201 noneno staff TA ft 1 ft no staff TA ftN none N none N none
56 CFU/100ml 140 CFU/100ml 110 CFU/100ml
57 CFU/100ml 160 CFU/100ml 95 CFU/100ml
King County 56 April 2007
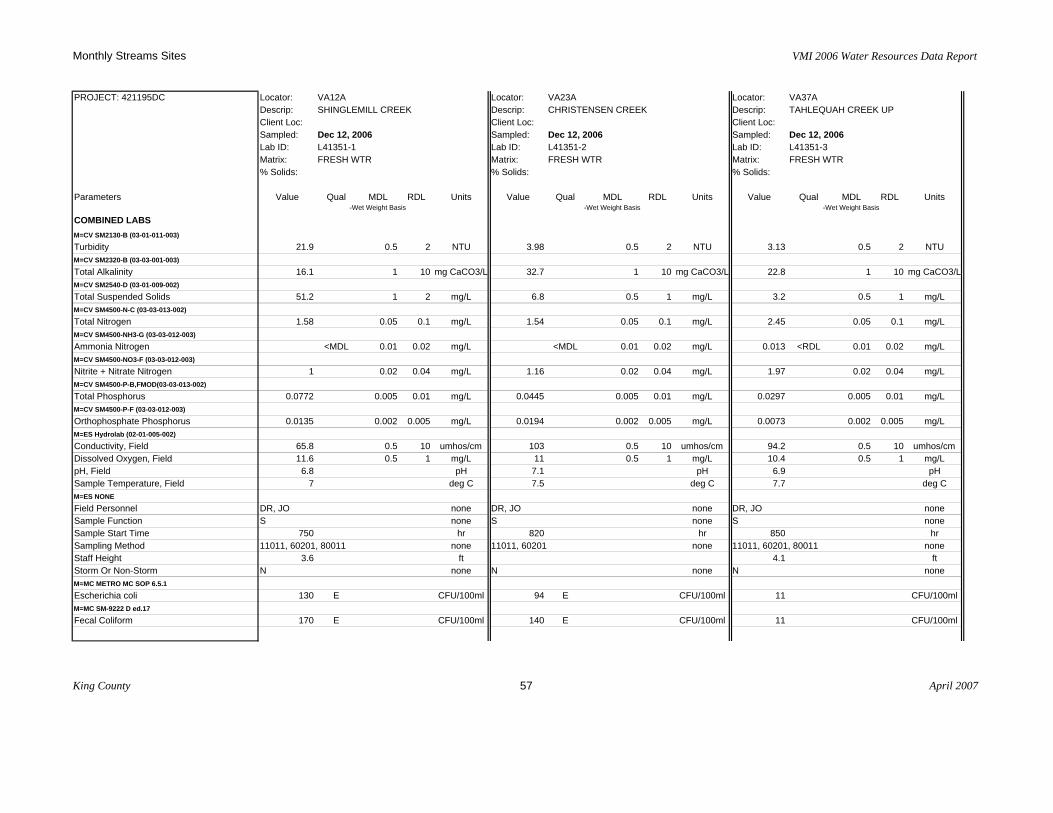
Monthly Streams Sites VMI 2006 Water Resources Data Report
PROJECT: 421195DC
Parameters
COMBINED LABSM=CV SM2130-B (03-01-011-003)
TurbidityM=CV SM2320-B (03-03-001-003)
Total AlkalinityM=CV SM2540-D (03-01-009-002)
Total Suspended SolidsM=CV SM4500-N-C (03-03-013-002)
Total NitrogenM=CV SM4500-NH3-G (03-03-012-003)
Ammonia NitrogenM=CV SM4500-NO3-F (03-03-012-003)
Nitrite + Nitrate NitrogenM=CV SM4500-P-B,FMOD(03-03-013-002)
Total PhosphorusM=CV SM4500-P-F (03-03-012-003)
Orthophosphate PhosphorusM=ES Hydrolab (02-01-005-002)
Conductivity, FieldDissolved Oxygen, FieldpH, FieldSample Temperature, FieldM=ES NONE
Field PersonnelSample FunctionSample Start TimeSampling MethodStaff HeightStorm Or Non-StormM=MC METRO MC SOP 6.5.1
Escherichia coliM=MC SM-9222 D ed.17
Fecal Coliform
Locator: VA12A Locator: VA23A Locator: VA37ADescrip: SHINGLEMILL CREEK Descrip: CHRISTENSEN CREEK Descrip: TAHLEQUAH CREEK UPClient Loc: Client Loc: Client Loc:Sampled: Dec 12, 2006 Sampled: Dec 12, 2006 Sampled: Dec 12, 2006Lab ID: L41351-1 Lab ID: L41351-2 Lab ID: L41351-3Matrix: FRESH WTR Matrix: FRESH WTR Matrix: FRESH WTR% Solids: % Solids: % Solids:
Value Qual MDL RDL Units Value Qual MDL RDL Units Value Qual MDL RDL Units-Wet Weight Basis -Wet Weight Basis -Wet Weight Basis
21.9 0.5 2 NTU 3.98 0.5 2 NTU 3.13 0.5 2 NTU
16.1 1 10 mg CaCO3/L 32.7 1 10 mg CaCO3/L 22.8 1 10 mg CaCO3/L
51.2 1 2 mg/L 6.8 0.5 1 mg/L 3.2 0.5 1 mg/L
1.58 0.05 0.1 mg/L 1.54 0.05 0.1 mg/L 2.45 0.05 0.1 mg/L
<MDL 0.01 0.02 mg/L <MDL 0.01 0.02 mg/L 0.013 <RDL 0.01 0.02 mg/L
1 0.02 0.04 mg/L 1.16 0.02 0.04 mg/L 1.97 0.02 0.04 mg/L
0.0772 0.005 0.01 mg/L 0.0445 0.005 0.01 mg/L 0.0297 0.005 0.01 mg/L
0.0135 0.002 0.005 mg/L 0.0194 0.002 0.005 mg/L 0.0073 0.002 0.005 mg/L
65.8 0.5 10 umhos/cm 103 0.5 10 umhos/cm 94.2 0.5 10 umhos/cm11.6 0.5 1 mg/L 11 0.5 1 mg/L 10.4 0.5 1 mg/L
6.8 pH 7.1 pH 6.9 pH7 deg C 7.5 deg C 7.7 deg C
DR, JO none DR, JO none DR, JO noneS none S none S none
750 hr 820 hr 850 hr11011, 60201, 80011 none 11011, 60201 none 11011, 60201, 80011 none
3.6 ft 4.1 ftN none N none N none
130 E CFU/100ml 94 E CFU/100ml 11 CFU/100ml
170 E CFU/100ml 140 E CFU/100ml 11 CFU/100ml
King County 57 April 2007

Monthly Streams Sites VMI 2006 Water Resources Data Report
PROJECT: 421195DC
Parameters
COMBINED LABSM=CV SM2130-B (03-01-011-003)
TurbidityM=CV SM2320-B (03-03-001-003)
Total AlkalinityM=CV SM2540-D (03-01-009-002)
Total Suspended SolidsM=CV SM4500-N-C (03-03-013-002)
Total NitrogenM=CV SM4500-NH3-G (03-03-012-003)
Ammonia NitrogenM=CV SM4500-NO3-F (03-03-012-003)
Nitrite + Nitrate NitrogenM=CV SM4500-P-B,FMOD(03-03-013-002)
Total PhosphorusM=CV SM4500-P-F (03-03-012-003)
Orthophosphate PhosphorusM=ES Hydrolab (02-01-005-002)
Conductivity, FieldDissolved Oxygen, FieldpH, FieldSample Temperature, FieldM=ES NONE
Field PersonnelSample FunctionSample Start TimeSampling MethodStaff HeightStorm Or Non-StormM=MC METRO MC SOP 6.5.1
Escherichia coliM=MC SM-9222 D ed.17
Fecal Coliform
Locator: VA41A Locator: VA42A Locator: VA45ADescrip: FISHER CREEK UPSTR Descrip: JUDD CREEK AT SW 2 Descrip: MILETA CREEK DOWNSClient Loc: Client Loc: Client Loc:Sampled: Dec 12, 2006 Sampled: Dec 12, 2006 Sampled: Dec 12, 2006Lab ID: L41351-4 Lab ID: L41351-5 Lab ID: L41351-6Matrix: FRESH WTR Matrix: FRESH WTR Matrix: FRESH WTR% Solids: % Solids: % Solids:
Value Qual MDL RDL Units Value Qual MDL RDL Units Value Qual MDL RDL Units-Wet Weight Basis -Wet Weight Basis -Wet Weight Basis
3.55 0.5 2 NTU 7.96 0.5 2 NTU 3.94 0.5 2 NTU
31.6 1 10 mg CaCO3/L 20.2 1 10 mg CaCO3/L 5 <RDL 1 10 mg CaCO3/L
13.9 0.5 1 mg/L 13.6 1 2 mg/L 1.5 0.5 1 mg/L
1.85 0.05 0.1 mg/L 1.48 0.05 0.1 mg/L 4.77 0.05 0.1 mg/L
<MDL 0.01 0.02 mg/L <MDL 0.01 0.02 mg/L <MDL 0.01 0.02 mg/L
1.4 0.02 0.04 mg/L 0.936 0.02 0.04 mg/L 4.4 0.04 0.08 mg/L
0.0472 0.005 0.01 mg/L 0.0433 0.005 0.01 mg/L 0.0149 0.005 0.01 mg/L
0.019 0.002 0.005 mg/L 0.00916 0.002 0.005 mg/L 0.0028 <RDL 0.002 0.005 mg/L
107 0.5 10 umhos/cm 73 0.5 10 umhos/cm 84.2 0.5 10 umhos/cm11.2 0.5 1 mg/L 11.7 0.5 1 mg/L 11.1 0.5 1 mg/L
7.1 pH 7.1 pH 6.3 pH7.6 deg C 6.9 deg C 7.7 deg C
DR, JO none DR, JO none DR, JO noneS none S none S none
900 hr 920 hr 960 hr11011, 60201 none 11011, 60201, 80011 none 11011, 60201 none
1.3 ftN none N none N none
76 CFU/100ml 170 E CFU/100ml 15 CFU/100ml
72 CFU/100ml 160 E CFU/100ml 14 CFU/100ml
King County 58 April 2007

Monthly Streams Sites VMI 2006 Water Resources Data Report
PROJECT: 421195DC
Parameters
COMBINED LABSM=CV SM2130-B (03-01-011-003)
TurbidityM=CV SM2320-B (03-03-001-003)
Total AlkalinityM=CV SM2540-D (03-01-009-002)
Total Suspended SolidsM=CV SM4500-N-C (03-03-013-002)
Total NitrogenM=CV SM4500-NH3-G (03-03-012-003)
Ammonia NitrogenM=CV SM4500-NO3-F (03-03-012-003)
Nitrite + Nitrate NitrogenM=CV SM4500-P-B,FMOD(03-03-013-002)
Total PhosphorusM=CV SM4500-P-F (03-03-012-003)
Orthophosphate PhosphorusM=ES Hydrolab (02-01-005-002)
Conductivity, FieldDissolved Oxygen, FieldpH, FieldSample Temperature, FieldM=ES NONE
Field PersonnelSample FunctionSample Start TimeSampling MethodStaff HeightStorm Or Non-StormM=MC METRO MC SOP 6.5.1
Escherichia coliM=MC SM-9222 D ed.17
Fecal Coliform
Locator: VA65A Locator: VA42ADescrip: GORSUCH CREEK NEAR Descrip: JUDD CREEK AT SW 2Client Loc: Client Loc:Sampled: Dec 12, 2006 Sampled: Dec 12, 2006Lab ID: L41351-7 Lab ID: L41351-8Matrix: FRESH WTR Matrix: FRESH WTR% Solids: % Solids:
Value Qual MDL RDL Units Value Qual MDL RDL Units-Wet Weight Basis -Wet Weight Basis
10.3 0.5 2 NTU 7.67 0.5 2 NTU
21.3 1 10 mg CaCO3/L 20 1 10 mg CaCO3/L
18.8 0.5 1 mg/L 15.5 0.5 1 mg/L
1.58 0.05 0.1 mg/L 1.44 0.05 0.1 mg/L
<MDL 0.01 0.02 mg/L <MDL 0.01 0.02 mg/L
1.16 0.02 0.04 mg/L 0.94 0.02 0.04 mg/L
0.0487 0.005 0.01 mg/L 0.0422 0.005 0.01 mg/L
0.0109 0.002 0.005 mg/L 0.00887 0.002 0.005 mg/L
82.9 0.5 10 umhos/cm 72.7 0.5 10 umhos/cm11.5 0.5 1 mg/L 11.7 0.5 1 mg/L
7 pH 7.1 pH7.3 deg C 6.9 deg C
DR, JO none DR, JO noneS none FREP@L41351-5 none
1000 hr 930 hr11011, 60201 none 11011, 60201 none
N none N none
99 E CFU/100ml 160 E CFU/100ml
71 CFU/100ml 190 E CFU/100ml
King County 59 April 2007