variation in yield and protein content of malting barley · variation in yield and protein content...
TRANSCRIPT

Variation in yield and protein content of malting barley
Methods to monitor and ways to control
Licentiate thesis
Faculty of Natural Resources and Agricultural Sciences
CG Pettersson
Swedish University of Agricultural Sciences (SLU) Department of Crop production Ecology (VPE)
Uppsala 2006

Variation in yield and protein content of malting barley Methods to monitor and ways to control Licentiate thesis, Faculty of Natural Resources and Agricultural Sciences CG Pettersson Report from the Department of Crop Production Ecology (VPE) • No. 1 Swedish University of Agricultural Sciences (SLU) Uppsala 2006 ISSN 1653-5375 ISBN 91-576-6896-5 Editor: Birgitta Båth

Abstract
Variation in yield and protein content of malting barley
Methods to monitor and ways to control CG Pettersson SLU, Department of Crop Production Ecology Box 7043 SE-750 07 UPPSALA Sweden Malting barley has to fulfil several quality demands to be fully accepted, and paid, by the malting industry. The cultivar has to be selected by the industry, the vitality of the lot has to be high, the husk has to be uninjured and the grain protein content has to be at the proper level and as even as possible. Flat protein levels are hard to achieve, as the grain protein over malting barley fields often vary 3% around the field mean. The urge for even protein makes this crop a natural object for precision agriculture research, but surprisingly little has been reported. In the present project, precision agriculture methods have been used to monitor grain yield and grain protein of Swedish malting barley. The goal of the project has been, for spring sown Swedish malting barley, to understand the reasons for and patterns of the variability in grain protein, and design a method for fertilisation with a potential to produce more even protein with the proper mean level. It seems possible to design such a fertiliser system, provided that a restrained amount of compound NPKS fertiliser is combi-drilled at sowing and that the second fertiliser application as calcium nitrate is distributed, at the latest, at the two node stage of the barley. The second application needs the control from a remote sensor using an appropriate vegetation index. The most commonly used vegetation indices did not correlate well with the grain yield, or with the grain protein level at such an early stage, possibly because of disturbing reflections from the soil. However, a set of recently developed indices for maize did correlate with the patterns of both grain yield and grain protein. To get the mean values between years and places right, the regression algorithms also needed a measure of thermal stress during grain filling. A thermal stress index was designed as a temperature sum during three weeks, and a threshold for the temperature sum was optimised to 20 °C.

Sammanfattning
Variation i skörd och proteinhalt i maltkorn
Metoder att upptäcka, sätt att styra CG Pettersson SLU, Institutionen för växtproduktionsekologi Box 7043 SE-750 07 UPPSALA Maltkorn måste uppfylla många kvalitetskrav för att bli fullt accepterat, och betalt, av maltindustrin. Sorten skall vara godkänd som maltkorn, partiets grobarhet skall vara hög, skalet skall vara oskadat, proteinhalten skall vara lagom hög och så jämn som möjligt. Jämn proteinhalt är svår att uppnå, inom ett fält varierar halten ofta så mycket som 3% runt medelvärdet. Behovet av jämn proteinhalt gör maltkorn till ett naturligt objekt för forskning inom precisionsodling, men förvånande lite har rapporterats. I detta projekt har teknik från precisionsodling använts för att upptäcka mönster i skörd och proteinhalt i svenskt maltkorn. Målet med projektet var att, för svenskt maltkorn, förstå orsakerna till och mönsterna i de varierande proteinhalterna, och att utforma ett gödslingssystem för jämnare proteinhalt utan att medelnivån höjs. Det förefaller möjligt att utforma ett sådant gödslingssystem, där en begränsad mängd kombisådd NPKS tillförs vid sådden och där en utjämnande gödsling med av kalksalpeter utförs senast vid grödans tvånodstadium. Den andra gödslingen behöver styras av en fjärranalysutrustning som läser av grödans status med hjälp av ett lämpligt vegetationsindex. De vanligaste tillgängliga indexen korrelerade inte bra med proteinhalt eller skörd när de användes så tidigt som vid tvånodsstadiet, förmodligen på grund av störning från markens reflexion. Istället korrelerade några nyligen utvecklade index för majs väl med mönsterna för både skörd och protein. För att få medelvärdena mellan fält och mellan år rätt, behövde regressionsalgoritmerna också ett värde på beståndets värmestress under kärnfyllnaden. Ett index för värmestress konstruerades som en värmesumma för tre veckor under kärnfyllnaden, den bästa bastemperaturen för värmesumman bestämdes till 20 °C.

Contents
Introduction, 7 The Problem, 7 Barley, 7
Barley grain quality for malt production, 8 Physiological processes determining grain protein content, 9 Precision agriculture and site-specific fertilisation, 10 Application of fertiliser, 11
Objectives, 12 Materials and methods, 12 Results and Discussion, 13 Conclusions, 14 Future work, 14 References, 14 Acknowledgements, 18

Appendix
Paper I - II The present thesis is based on the following papers, which will be referred to by their Roman numerals: I. Pettersson, C.G. & Frankow-Lindberg, B.E. 2006. Reappraisal of methods of application of nutrients at sowing on the yield, grain protein content and nitrogen economy of malting barley in Sweden, Manuscript in preparation for: Acta Agriculturae Scandinavica Section B.
II. Pettersson, C.G, Söderström, M. & Eckersten, H. 2006. Canopy reflectance, thermal stress, and soil electrical conductivity, as predictors for within-field variability in grain yield and grain protein of malting barley. Manuscript submitted to: Precision Agriculture..

7
Introduction
Background Malting is both an ancient and a very modern technique for changing the properties of barley grain. In the process, the grain is germinated for 4-5 days, and then dried to a form suitable for storage. Before the industrial era, all malting was done in a small scale, of some hundred kg in each batch, the wetted grain normally spread out on a floor and raked at least once a day. During the last two centuries, malting has become an industrial process, and during recent decades the size of the malting plants has grown dramatically. Because of this, the characteristics of the malting raw material, the barley grain, required have changed and become more demanding: appropriate mean levels of quality but also big lots with consistent quality. An important factor for high malting quality is simultaneous germination, a feature that can be affected by damage to the husk, uneven moisture content or uneven protein content. The structure of agriculture is also changing, to bigger units on, which results in bigger areas treated as unified fields. In this way the malting industry has difficulty in fine tuning the controlled environment for the germinating barley, whereas the farmer has difficulty in fine tuning the growing of the crop which results in uneven protein levels. This poses a challenge in site-specific fertilisation of malting barley, using methods from precision agriculture. The Problem Most of the causes of the very variable protein levels in malting barley are not known, or not quantified in sufficient detail to guide crop fertilisation. Permanent management zones are difficult to construct, and using canopy reflection data to guide an adjusting fertilisation faces two problems: In precision agriculture, wheat and maize have received most attention, this means that in applying canopy reflection based fertilisation methods to malting barley, there is little guidance from the literature. Moreover, as high grain protein is not allowed in malting barley for beer, the adjusting, possibly canopy reflectance controlled, fertilisation has to be performed early in the season, when reflectance directly from the soil still is a problem. Barley Barley (Hordeum vulgare L.) is the fourth cereal crop in the world, and the most adaptable: there are barley varieties suited to temperate, to sub arctic as well as to subtropical climatic conditions. To achieve good yields from spring-sown barley, the best environment is a temperate moist climate with a growing period of at least 90 days (Anon, 2006). Cultivated barley is normally divided into three subgroups; six-row (Hordeum vulgare), two-row (Hordeum distichum) and the seldom cultivated intermediate (Hordeum irregulare). The major use of barley is for animal feed, followed by human food consumption and malting. Both two-row and six-row barley are used
for malting and both autumn and spring sown barley are used, but the best malt quality for beer is produced from spring sown two-row varieties. Barley grain quality for malt production The farmer has to grow a recommended malting barley variety to ensure that his crop will be sold as malting barley. In addition to this, high germination rates, good grading, and an adequate amount of protein in the grain, are most important for the lot at the farm level. The acceptable protein range for European malting barley is 9.5-11.5 %. Too much protein lowers the extract yield, can give a beer that is not clear, and may slow down the start of germination; too little protein results in lower enzyme activity and slow growth of the yeast in the brewery. As simultaneous germination is a key factor in the malting industry, any factor causing variation in the rate of germination reduces the quality of the malt. For this reason, damage to
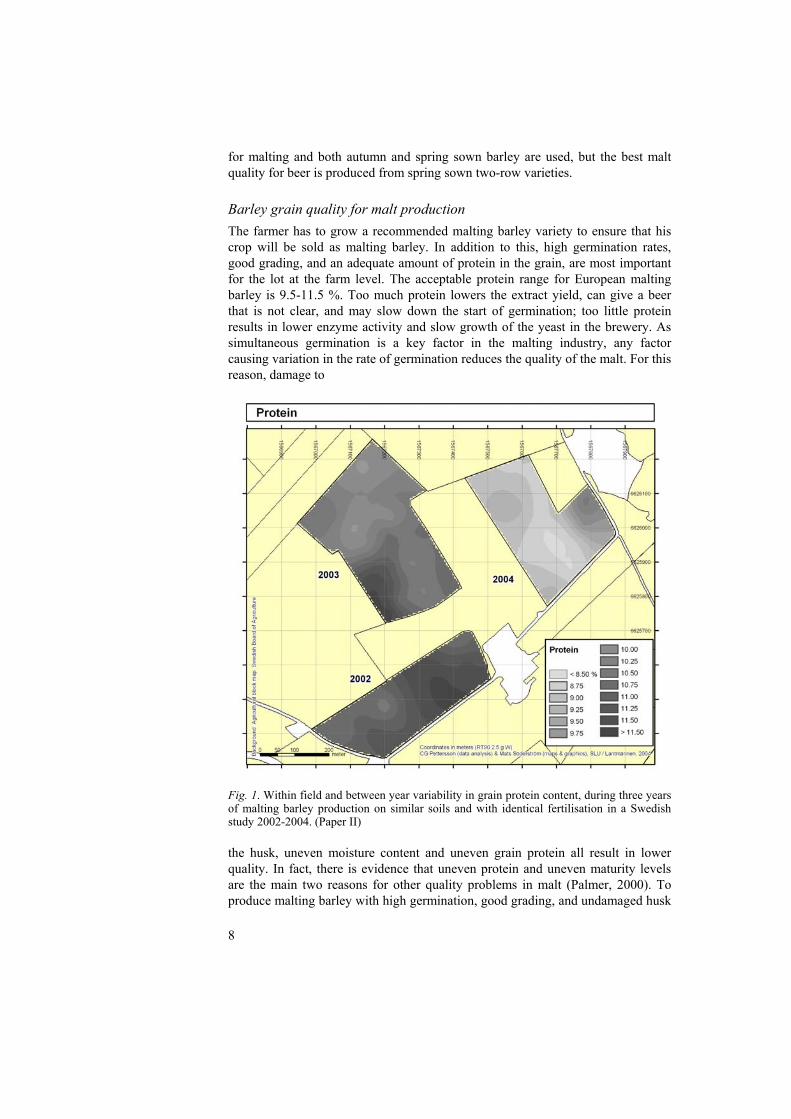
Fig. 1. Within field and between year variability in grain protein content, during three years of malting barley production on similar soils and with identical fertilisation in a Swedish study 2002-2004. (Paper II) the husk, uneven moisture content and uneven grain protein all result in lower quality. In fact, there is evidence that uneven protein and uneven maturity levels are the main two reasons for other quality problems in malt (Palmer, 2000). To produce malting barley with high germination, good grading, and undamaged husk
8

9
is possible using available knowledge, but achieving the proper protein level is difficult. All barley can be malted, but the quality of the malt depends to a large extent on the properties of the barley. To be used for malt, the grain has to be alive, and a great deal of malting barley is spoiled every year due to excessive temperatures during drying or inappropriate storage conditions, resulting in loss of vitality. The time malting barley can be stored without losing vitality depends on the combination of grain moisture content and the temperature in the silo, relationships established by Riis (1992) at Carlsberg Research Centre (http://www.crc.dk) (Table 1).
Table 1. The relation between grain moisture content, grain temperature and the maximum storage time with full vitality in malting barley, after Riis (1992)
Grain Grain moisture content temperature 10% 12% 14% 16% 18%
0 oC 16 years 6 years 2 years 1 year 190 days 4 oC 11 years 4 years 1.5 years 260 days 130 days 8 oC 7.5 years 2.5 years 1 year 170 days 89 days 12 oC 5 years 1.6 years 240 days 110 days 55 days 16 oC 3 years 1 year 150 days 65 days 35 days 20 oC 1.8 years 220 days 90 days 40 days 20 days 24 oC 1 year 130 days 55 days 25 days 12 days 28 oC 210 days 70 days 30 days 13 days 7 days The malting industry has changed dramatically during recent decades, from comparably small operations to huge companies running modern malting facilities with very little labour. With older, smaller, and more labour intense malting plants, the batch size was much smaller and the maltster could allow for most quality differences during the process. With the modern plant size such fine adjustments are impossible; instead, the buyers of malting barley need more homogenous barley to produce good malt. However, malting barley protein varies within the field; for example, Figure 1 shows the distribution of grain protein in malting barley grown on similar Swedish clay loam soils, with identical fertilisation, during three seasons, 2002-2004 (Paper II). The mean grain protein in 2002 was nearly ideal, at 10.8%, but the variation was 3% around the mean. The other two crops had a similar variability, but different means. Physiological processes determining grain protein content Malting barley growers all over the world are challenged by the difficulty in producing barley with appropriate protein levels. For example, in field experiments in England, the proportion of grain carbon that was translocated from stem storage during grain filling varied between 60% a hot and dry year and 15% under extremely favourable growing conditions during grain filling period (Austin, Morgan, Ford & Blackwell, 1980), resulting in large differences in yield. As the translocation of stem nitrogen is not as sensitive as the translocation of stem
10
carbon, stress from high temperature during grain filling can result in higher protein levels, at least for daily maximum temperatures above 30 °C (Tester et al. 1991; Savin & Nicolas, 1996). Other stresses, such as shading, could also result in higher protein contents than expected (Marinissen & Grashoff, 1994; Boonchoo, Fukai & Hetherington, 1998). The temperature most often cited is the meteorological standard air temperature at 1.8 m, but the crop reacts to the tissue temperature, which is determined by the energy balance of the crop. Low water availability increases the risk of high plant temperatures, and increases the protein level of the crop. Many researchers have found that water availability is a key factor for protein content in small grains, see for example: (Brooks, Jenner & Aspinall, 1982; MacNicol et al. 1993; de Ruiter, Stol & van Keulen, 1993; Hector, Fukai & Goyne, 1996; Dalal et al. 1997; Broner, Thompson & Dillon, 1997; Bertholdsson, 1998; Delin, 2005). Several mechanisms have been suggested for the reduced carbon loading in cereal grains when stressed by high temperatures or water shortage. In cereal growth models, such as AFRCWHEAT (Porter, 1993), elevated temperatures result mainly in a shorter grain filling period and thus a lower carbon yield. Other researchers have found that elevated temperatures at anthesis cause reductions in the number of starch cells in each grain, creating the possibility of a sink limitation to yield (May & Buttrose, 1958; Brooks et al., 1982; McDonald et al. 1991; Tester et al., 1991). High temperatures at anthesis might also reduce the capacity of UDPsucrose synthase (EC 2.4.1.13), which splits sucrose into glucose units during grain filling (MacLeod & Duffus, 1988). As carbon is transported in the plant mainly as sucrose, and starch formation starts with glucose, this could create a situation where glucose supply limited grain filling. However, the latter two mechanisms operate mainly at high thermal thresholds of 25-30 °C. Precision agriculture and site-specific fertilisation The development of accurate and reasonably priced equipment using global positioning systems (GPS) is what makes precision agriculture possible. The first GPS harvest loggers were mounted on combine harvesters in the early 1990s and became common during the late 1990s. The yield maps produced using these machines led to a general awareness that the yield and quality of crops vary dramatically across fields, and also motivated systematic research on these variations (Stafford, 1999). For a long time, the hope was that yield maps from harvesters would provide enough information to control site-specific fertilisation. It has been shown that working management zones can be constructed with yield maps as the main input, if massive amounts of good quality data exist (Blackmore, 2000), but with more realistic datasets it seems to be difficult (Joernsgaard & Halmoe, 2003). The reason for these difficulties have been debated, but it is possible that the assumption that a higher yield necessarily needs a higher level of fertilisation is incorrect. Site-specific fertilisation experiments have shown that knowing the yield level improves the economy of the fertilisation only marginally compared with using only remote sensor data (Link & Jasper, 2003). Another approach has been to use measured soil properties to create management zones. The combination of soil electrical conductivity (SEC) and soil topography has

11
been useful in maximising yield response to N fertilisation when the SEC mainly was measuring water (Delin, 2005). However, separate mean values of SEC, used as baselines, are needed for each field and the generality of the method can be questioned. Gradients in SEC within a field could represent gradients in soil organic matter, clay content, or salinity, and these three factors would be expected to have very different influences on the nitrogen cycle. In most cases, information from the actual field and crop seems to be required to generate more representative data on fertilisation need (Lark & Wheeler, 2003), and remote sensing observations can provide such data. Systematic remote sensing of crops started with the Landsat satellite programme, launched in 1972 (Short, 2006). Remote sensing equipments, measuring crop canopy reflectance, are still carried by satellites, but today individual fields and even field parts can be monitored in this way (Begiebing et al. 2005; Blondlot, Gate & Poilvé, 2005). Modern remote sensors have also moved very near the crop, equipments are often mounted on the vehicle that does the actual fertilisation, to control the fertilisation rate continuously (Reusch, Link & Lammel, 2002) (Scotford & Miller, 2005). The latest trend in sensors is to replace the classical passive sensors, which have problems caused by their dependence on incoming sunlight (Reusch, 2003), with active sensors that are equipped with their own light source (Reusch, 2005; Schwab et al. 2005). Application of fertiliser To make grain protein levels more even over space and time (Figure 1), the fertilisation rate must vary within fields and between years. In a two-step fertilisation regime, a restricted base fertilisation is given at sowing and then an adjusting application is made when the crop has established and showed its yield potential. The main problem with two-step fertilisation in the environment of central Sweden is the risk of inducing higher grain protein. To overcome this problem, the first fertilisation has to use the best available combination of fertiliser and application technique. The best machinery for fertilising Swedish malting barley is the combi-drill method (Huhtapalo, 1982; Pettersson & Frankow-Lindberg, 2006) (Paper I). Swedish field trials from the 1990s showed that grain protein levels were less dependent on the total N application when NPKS was combi-drilled than when pure N was. The trials also showed that the tillering of the barley was as good with an initial application of 60 kg N ha-1, as NPKS, as it was with 100 kg N ha-1 as pure N, thus building a stand that had high yield potential from a limited amount of fertiliser (Pettersson, 2006b). For the second application of nitrogen, calcium nitrate (Kalksalpeter, Ks, Yara) is the most rapidly available fertiliser and is the natural choice for this application. Applying Ks to barley without generating systematically higher protein levels is possible at GS32 (two nodes, Tottman & Broad, 1987) but not later (Anderson, 1990). A problem with the use of canopy reflectance for controlling fertiliser application to barley at GS32 is that most previous work has been done on winter wheat at later stages. In barley, the use of reflectance data from GS69 (end of anthesis) has

12
been shown to correlate well with grain protein, but data from earlier stages have been hard to apply (Börjesson & Söderström, 2003). To be useful in controlling variable fertilisation, usable reflectance data from GS32 are necessary. Objectives The objective of the present work was to understand and quantify the main causes of variation in grain yield and protein of Swedish malting barley; and to use this understanding in the development of methods for fertilisation of malting barley, actively adjusting the protein within fields as well as between regions and years. The specific aims was, to examine the relationships between observed canopy reflectance at early (GS32) and late (GS69) plant development stages on one hand, and yield and protein content of grains at harvest on the other. Special emphasis was put on study the interactions between canopy reflectance data and temperature stress during the grain filling of barley. Materials and methods
Two datasets were generated especially for this study: The larger originates from sixteen fertiliser field trials performed in the years 2001-2003. The treatments of the trials were designed to evaluate the possibility of using canopy reflectance at GS32 to control variable application of Ks at the same stage in two malting barley cultivars, Astoria (Secobra, France) and Wikingett (Svalöf-Weibulls, Sweden) (Table 2). The design was split-plot with the cultivars as the main-plots and the fertiliser treatments as the sub-plots. Table 2. Fertiliser treatments and mean results from sixteen field trials, with two malting barley cultivars in a three year study (Pettersson, 2006a)
N as combi-drilled NPKS
N as CaNO3at GS32
Total applied N
Grain yield at 15% m.c.
Grain protein
Grain N yield
kg N ha-1 kg N ha-1 kg N ha-1 kg ha-1 % d.m. kg ha-1 A 0 0 0 2389 10.0 33 B 70 0 70 4673 10.1 65 C 100 0 100 5274 10.7 77 D 130 0 130 5677 11.4 88 E 70 30 100 5410 10.9 81 F 70 60 130 5793 12.0 94 G 100 30 130 5822 11.7 93 H 100 60 160 5981 12.5 102

13
All plots were monitored using a, passive, hand-held Yara N-sensor (Reusch, Link & Lammel, 2002) at GS32 and GS69. Crop samples (0.25 m2) were cut within the fertilised plots, outside the net harvesting plots at GS77 (late milk). The plots were harvested with a plot-combine at GS92 (caryopsis hard), and samples were taken from all plots and analysed for moisture content, grain protein, and grading. (Pettersson, 2006a). The second dataset was generated from three production fields of the cultivar Astoria, in the years 2002-2004 (Fig. 1). This dataset has been used to evaluate the potential to picture the variations in grain yield and grain protein content within fields and between seasons from canopy reflectance, temperatures during grain filling and soil electrical conductivity. (Pettersson, Söderström & Frankow-Lindberg, 2005; Pettersson, Söderström & Eckersten, 2006) (Paper II).
Results and Discussion
The experimental results of Paper I (Pettersson & Frankow-Lindberg, 2006), suggest that combi-drilling (or mid-row banding) would be the preferred method of fertilising barley in a wider range of situations than those usually recommended. In the period during which the combi-drill has been used, starting around 1970, a guiding principle has been that it should be used where the amount of rainfall during crop establishment is a limiting factor for canopy development. This is the reason that use of the combi-drill dominates in the more dry eastern parts of Sweden but not in the more wet western parts. Paper I suggests that the guideline for what application method to prefer, should be, primarily, the abundance of base cations in the soil. Combi-drilling the fertiliser was superior to broadcasting on soils with high cation content, compared with soils with low levels. Canopy reflectance data at GS32 and GS69, soil electric conductivity, and temperature sums from the grain filling period, in combination, were correlated with grain yield and grain protein variability on one Swedish farm during three years (Paper II). The fertilisation was identical in the study but contrasting seasons resulted in considerable different outcomes. The within-field variability was similar in all years, but the mean grain yield and grain protein differed substantially (Figure 1). Field variation in canopy reflectance at GS32 was well correlated with most of the nitrogen and protein content patterns in all three fields. For details of vegetation indices (singular VI, plural VIs) and how to calculate them, refer to Paper II. The most commonly used VIs, such as NDVI and REIP (Reusch, 1997), correlated well with yield potential and grain nitrogen when the indices were sampled at GS69 but not when sampled at GS32. At the earlier stage, another group of VIs; OSAVI, TCARI and TCARI/OSAVI (TC/OS), showed the highest correlation, and TC/OS the highest of all (Haboudane et al. 2002). Mean protein concentration was mainly related to the thermal time during grain filling. In constructing the best index for these accumulated temperature sums, threshold temperatures between 17 and 31 °C were tested, giving an optimal

14
threshold of 20 °C. Soil electrical conductivity improved the protein regression only marginally, and did not affect the regression for grain yield. Conclusions The variation in grain protein concentration at harvest in malting barley fields could be described using remote sensing at GS32. The temperature during grain filling determined the mean grain protein concentration, and could be described by a heat sum with a base temperature of 20 °C. It seems possible to construct a system for variable two-step fertilisation of malting barley, which is not dependent on positioned information of the variation in of nitrogen mineralisation in the field. In such a system, the first fertilisation should be done uniformly as combi-drilled NPKS at a moderate level. An adjusting, remote sensor controlled, fertilisation should be performed at GS32 using an algorithm including the best-suited VI, which, in this case, was TC/OS. To use the remote sensor signals in the best way, an assumption of the level of heat stress the crop will be exposed to during grain filling has to be made. Future work Three observations for the index of heat sums during grain filling, in the dataset for Paper II should be compared with sixteen observations in the related field trial dataset. It is obvious that generally applicable linear equations for grain protein using heat sums, could possibly be extracted from the latter but not from the former dataset. It was not possible to use sowing date as an explaining variable in Paper II, but it worked very well in the preliminary analyses made with the larger dataset. It is accepted practical advice to Swedish farmers, that N fertilisation should be lower when the sowing is delayed – advice that is all too often forgotten. In this context, the use of sowing date would be to adjust the expected protein baseline when the, adjusting, remote sensor controlled fertilisation at GS32 is applied. In the larger dataset, it will also be possible to evaluate differences in heat stress sensitivity for different cultivars, to evaluate if the level of the starting fertilisation leads to the need for adjustments in the VI evaluation, and to estimate the role of crop water supply for the impact of temperature stress during grain filling. References
Anonymous. 2006. Barley. Encyclopædia Britannica. Encyclopædia Britannica Premium Service, http://www.britannica.com/eb/article-9013391; (accessed 10-Jan-2006)
Anderson, A. 1990. Fältmässig prövning av växtanalysmodell för kväve i höstvete och korn [Field evaluation of a plant analyse model in wnter wheat and barley (in Swedish)]. Examensarbete, MSci thesis, vol. 70, SLU, Institutionen för markvetenskap, avd. för växtnäringslära, Uppsala, Sweden.

15
Austin, R.B, Morgan, C.L, Ford, M.A. & Blackwell, R.D. 1980. Contributions to grain yield from pre-anthesis assimilation in tall and dwarf barley phenotypes in two contrasting seasons. Annals of Botany, 45, 309-319.
Begiebing, S, Bach, H, Waldmann, D. & Mauser, W. 2005. Analyses of spaceborne hyperspectral and directional CHRIS data to deliver crop status for precision agriculture. In: Precision Agriculture. Proceedings of the 5th European Conference on Precision Agriculture, Uppsala, Sweden. (Ed. J. Stafford). Wageningen Academic Publishers, Wageningen, The Netherlands, pp. 227-234.
Bertholdsson, N.O. 1998. Selection methods for malting barley consistently low in protein concentration. European Journal of Agronomy, 9(4)213-222.
Blackmore, S. 2000. The interpretation of trends from multiple yield maps. Computers and Electronics in Agriculture, 26, 37-51.
Blondlot, A, Gate, P. & Poilvé, H. 2005. Providing operational nitrogen recommendations to farmers using satellite imagery. In: Precision Agriculture. Proceedings of the 5th European Conference on Precision Agriculture, Uppsala, Sweden. (Ed. J. Stafford). Wageningen Academic Publishers, Wageningen, The Netherlands, pp. 345-352.
Boonchoo, S, Fukai, S. & Hetherington, S.E. 1998. Barley yield and grain protein concentration as affected by assimilate and nitrogen availability. Australian Journal of Agricultural Research, 49(4)695-706.
Börjesson, T. & Söderström, M. 2003. Prediction of protein content in cereals using canopy reflectance. In: Precision Agriculture. Proceedings of the 4th European Conference on Precision Agriculture. (Eds. J. Stafford & A. Werner). Wageningen Academic Publishers, Wageningen, pp. 89-94.
Broner, I, Thompson, K. & Dillon, M. 1997. Validation of a malting barley water and nutrient management expert system. Agricultural Water Management, 33(2-3)159-168.
Brooks, A, Jenner, C.F. & Aspinall, D. 1982. Effects of Water Deficit on Endosperm Starch Granules and on Grain Physiology of Wheat and Barley. Australian Journal of Plant Physiology, 9, 423-436.
Dalal, R.C, Strong, W.M, Weston, E.J, Cooper, J.E. & Thomas, G.A. 1997. Prediction of grain protein in wheat and barley in a subtropical environment from available water and nitrogen in Vertisols at sowing. Australian Journal of Experimental Agriculture, 37(3)351-357.
de Ruiter, J.M, Stol, W. & van Keulen, H. 1993. Simulation of yield and quality of malting barley. In: Proceedings. Annual Conference. Agronomy Society of New-Zealand, vol. 23, Agronomy Society of New-Zealand, pp. 11-19.
Delin, S. 2005. Site-specific nitrogen fertilization demand in relation to plant available soil nitrogen and water. Potential for prediction based on soil characteristics, Doctoral thesis 2005:6, SLU. Skara, Sweden, pp. 117.
Haboudane, D, Miller, J.R, Tremblay, N, Zarco-Tejada, P.J. & Dextraze, L. 2002. Integrated narrow-band vegetation indices for prediction of crop chlorophyll content for application to precision agriculture. Remote Sensing of Environment, 81, 416-426.
Hector, D.J, Fukai, S. & Goyne, P.J. 1996. Adapting a barley growth model to predict grain protein concentration for different water and nitrogen availabilities. In: Proceedings of the 8th Australian Agronomy Conference, Toowoomba, Queensland, Australia, 30 January-2 February 1996, pp. 297-300.
Huhtapalo, A. 1982. Scandinavian principles for fertilizer placement, utilization of fertilizer-N nitrogen. In: Proceedings of the 9th Conference of the International Soil Tillage Research Organization, ISTRO. Osijek Yugoslavia. ISTRO, Wageningen, pp. 669-674.
Joernsgaard, B. & Halmoe, S. 2003. Intra-field variation over crops and years. European Journal of Agronomy, 19, 23-33.
Lark, R.M. & Wheeler, H.C. 2003. Experimental and analythical methods for studying within-field variation of crop responses to inputs. In: Precision Agriculture. Proceedings of the 4th European Conference on Precision Agriculture. (Eds. J. Stafford & A. Werner). Wageningen Academic Publishers, Wageningen, The Netherlands, pp. 341-346.
Link, A. & Jasper, J. 2003. Site-specific N fertilization based on remote sensing - is it necessarey to take yield variability into account? In: Precision Agriculture. Proceedings

16
of the 4th European Conference on Precision Agriculture. (Eds. J. Stafford & A. Werner). Wageningen Academic Publishers, Wageningen, The Netherlands, pp. 353-359.
MacLeod, L.C. & Duffus, C.M. 1988. Reduced starch content and sucrose activity in developing endosperm of barley plants grown at elevated temperatures. Australian Journal of Plant Physiology, 15, 367-375.
MacNicol, P.K, Jacobsen, J.V, Keys, M.M. & Stuart, I.M. 1993. Effects of heat and water stress on malt quality and grain parameters of Schooner barley grown in cabinets. Journal of Cereal Science, 18, 61-68.
Marinissen, M.J. & Grashoff, C. 1994. Effect of nitrogen supply and shading on growth, kernel filling, size distribution, and protein and carbohydrate content in malting barley (Hordeum vulgare L.). Rapport DLO Instituut voor Agrobiologisch en Bodemvruchtbaarheidsonderzoek, 9.
May, L.H. & Buttrose, M.S. 1958. Physiology of Cereal Grain II. Starch Granule Formation in the Developing Barley Kernel. Australian Journal of Biological Sciences, 12, 146-149.
McDonald, A.M.L, Stark, J.R, Morrison, W.R. & Ellis, R.P. 1991. Temperature Effects on Starch Granules in Developing Barley Grains. Journal of Cereal Science, 13, 93-112.
Palmer, G.H. 2000. Malt performance is more related to inhomogeneity of protein and β-glucan breakdown than to standard malt analyses. Journal of the Institute of Brewing, 106(3)189-192.
Pettersson, C.G. 2006a. Results from 16 Swedish malting barley fartiliser trials 2001-2003. Series L3-2260. Unpublished material. Dept. of Crop Production Ecology. VPE, SLU, Uppsala.
Pettersson, C.G. 2006b. Results from 12 Swedish malting barley fartiliser trials 1995-1997. Series L3-3063. Unpublished material. Dept. of Crop Production Ecology. VPE, SLU, Uppsala.
Pettersson, C.G. & Frankow-Lindberg, B.E. 2006. Reappraisal of methods of application of nutrients at sowing on the yield, grain protein content and nitrogen economy of malting barley in Sweden, Manuscript in preparation for: Acta Agriculturae Scandinavica Section B.
Pettersson, C.G, Söderström, M. & Eckersten, H. 2006. Canopy reflectance, thermal stress, and soil electrical conductivity, as predictors for within-field variability in grain yield and grain protein of malting barley. Manuscript submitted to: Precision Agriculture.
Pettersson, C.G, Söderström, M. & Frankow-Lindberg, B. 2005. Predictions of within-field yield and protien variability in malting barley using canopy reflectance, theramal stress, and soil electrical conductivity. In: Precision Agriculture. Proceedings of the 5th European Conference on Precision Agriculture, Uppsala, Sweden. (Ed. J. Stafford). Wageningen Academic Publishers, Wageningen, The Netherlands, pp. 377-384.
Porter, J.R. 1993. AFRCWHEAT2: A model of the growth and development of wheat incorporating responses to water and nitrogen. European Journal of Agronomy, 2, 64-77.
Reusch, S. 1997. Entwicklung eines reflexionsoptischen Sensors zur Erfassung der Stickstoffversorgung landwirtschaftlicher Kulturpflanzen. [Development of an optical reflectance sensor for determining the nitrogen supply to agricultural plants]. Dissertation. Christian-Albrechts-Universität, Kiel, Germany. In German, pp. 155.
Reusch, S. 2003. Optimisation of oblique-view remote measurment of crop N-uptake under changing irradiance conditions. In: Precision Agriculture. Proceedings of the 4th European Conference on Precision Agriculture, Berlin, Germany. (Eds. J. Stafford & A. Werner). Wageningen Academic Publishers, Wageningen, The Netherlands, pp. 573-578.
Reusch, S. 2005. Optimum waveband selection for determining the nitrogen uptake in winter wheat by active remote sensing. In: Precision Agriculture. Proceedings of the 5th European Conference on Precision Agriculture, Uppsala, Sweden. (Ed. J. Stafford). Wageningen Academic Publishers, Wageningen, The Netherlands, pp. 261-266.
Reusch, S, Link, A. & Lammel, J. 2002. Tractor-mounted multispectral scanner for remote field investigation. In: Proceedings of 6th International Conference on Precision Agriculture (CD). (Ed. P.C. Robert). ASA/CSSA/SSSA, Madison, USA, pp. 1385-1393.
Riis, P. 1992. Vigour - an important malting barley feature. Stencil. Malmö 4/8 1992. Carlsberg, Köpenhamn, pp. 6.
17
Savin, R. & Nicolas, M.E. 1996. Effects of Short periods of Drought and High Temperature on Grain Growth and Starch Accumulation of Two Malting Barley Cultivars. Australian Journal of Plant Physiology, 23, 201-210.
Schwab, G.J, Pena-Yewtukhiw, E.M, Wendroth, O, Murdock, L.W. & Stombaugh, T. 2005. Wheat and yield population response to variable rate N fertilization strategies using active NDVI sensors. In: Precision Agriculture. Proceedings of the 5th European Conference on Precision Agriculture, Uppsala, Sweden. (Ed. J. Stafford). Wageningen Academic Publishers, Wageningen, The Netherlands, pp. 235-242.
Scotford, L.M. & Miller, P.C.H. 2005. Vehicle mounted sensors for estimating tiller density and leaf area index (LAI) of winter wheat. In: Precision Agriculture. Proceedings of the 5th European Conference on Precision Agriculture, Uppsala, Sweden. (Ed. J. Stafford). Wageningen Academic Publishers, Wageningen, The Netherlands, pp. 201-208.
Short, N.M. The remote sensing tutorial. NASA home page, URL: http://rst.gsfc.nasa.gov/Front/overview.html; (accessed 17-Feb-2006) Stafford, J.V. 1999. An investigation into the within-field spatial variability of grain quality.
In: Precision Agriculture 1999. Proceedings of the 2nd European Conference on Precision Agriculture. Sheffield Academic Press, Sheffield, UK, pp. 353-361.
Tester, R.F, South, J.B, Morrison, W.R. & Ellis, R.P. 1991. The Effects of Ambient Temperature During the Grainfilling Period on the Composition and Properties of Starch from Four Barley Genotypes. Journal of Cereal Science, 13, 113-127.
Tottman, D.R. & Broad, H. 1987. The decimal code for the growth stages of cereals, with illustrations. Annals of Applied Biology, 110, 441-454.

18
Acknowledgements
This work would not have been possible without the support from my family; my wife Ann-Helen and our sons Anders, Lars, Erik and Olof. They have put up with me when I have been depressed, helped me with a lot of fieldwork and Ann-Helen has scrutinized the manuscript. Thank you! I want to thank my supervisors, Henrik Eckersten and Bodil Frankow-Lindberg who have guided me to this point. A special thank you goes to Robert Hay, who has joined my group of supervisors recently, and has made wonders both with my thinking around cereals and with my English usage. Just a warning; I will need even more help! A special thank you also goes to Christian Ritz at KVL,Denmark, who, without any obligations, has guided me through the more tricky parts of statistics. Thank you to all, new and old, PhD students at the, new and old, department for being such great friends. (A more personally addressed thank you will come when I have reached the same heights as Johanna, Anuschka, Hanna and Tomas. A very special thank you, goes to Birgitta Båth who helped me out with the final contacts with the printers, thus making it possible for me and my family to get some winter holidays even this year. We all love you Birgitta!

1
Reappraisal of methods of application of nutrients at sowing on the yield, grain protein content and nitrogen economy of malting barley in Sweden
C.G. Pettersson and B.E. Frankow-Lindberg SLU, Department of Crop Production Ecology Box 7043 SE-750 07 UPPSALA Sweden Abstract Malting barley was fertilized with calcium ammonium nitrate (CAN) or compound ammonium nitrate with phosphorus (NP) applied in two ways: broadcasted and harrowed into the seedbed before seeding or banded using the Scandinavian combi-drill design, with the fertiliser between and slightly under every second seed row. A fixed nitrogen level (120 kg N ha-1) was used, giving four fertiliser treatments. Eleven experiments were carried out with 55° 55' N as southern and 59° 36' N as northern limit the years 1992-1994. Applied fertiliser use efficiency, defined as grain yield, or nitrogen yield, per unit of applied N, was strongly affected by the treatments: values for banding was higher than for broadcasting, and higher for NP than for pure N, with the effects being additive. The best treatment, using both banding and NP gave, as a mean of all trials, a grain yield increase (at 15% moisture content) of 939 kg ha-1 or 18 kg nitrogen ha-1 compared with the worst, using broadcasted CAN. The expected better use of nitrogen under dry conditions when applied with combi-drill was not found in this study. Banding worked better than broadcasting in places where extractable cations were abundant. A possible explanation for this is that fertiliser banding prevented ammonium ions from being bound to soil particles.
Key words broadcasting, combi-drill, fertiliser use efficiency, mid row banding, precipitation, soil cations
Introduction Understanding the effects of the way that phosphorus (P) fertilisers are placed, in relation to the fertilised plants, has been a classic task in agronomic research, featuring in the literature since at least the middle of the 20th century (e.g., Weidemann, 1943; Franck, 1948). Originally, all machinery placed fertiliser and seed together by the same coulter, and seedling establishment and early growth benefited from P fertiliser in contact with, or very near, the seed. Positive effects, which were found to be greatest in cold and wet soils in temperate climates where root development was restricted, were interpreted in terms of local saturation of the P-adsorption capacity of the soil (Maertens, 1978; Russell, 1978): the P concentration in the soil solution in the zone of application was higher than that with broadcast P, enhancing uptake of P by the seedlings (Mengel & Kirkby, 1979).

Any potential gain from high nutrient concentration was negated by salt injury when nitrogen (N), or compound (NP), fertilisers were placed together with the seed. To avoid these problems, new types of coulter were developed, which separated fertiliser and seed (e.g., Anon. 1998a). The overall advice has been, and still is, to keep the fertiliser amounts reasonably low when banding is used (Anon. 1997). In northern Europe, the time from seeding to harvest is short for spring sown cereal crops. For example, in central Sweden and southern Finland, sowing typically takes place during the first week of May and harvest during the last week of August, giving a crop 115-120 days to develop from dry seed to maturity with a typical grain yield of 4500 kg ha-1 (at 15% moisture content). To speed up and improve the establishment of small grain crops under such conditions, a new type of seeder was developed in the late 1960s (Huhtapalo, 1982), to apply the full rate of N at planting in areas where limited rainfall was expected during crop establishment. The resulting machinery, the combi-drill, placed the fertiliser between every second seed coulter, ideally 40 mm deeper than the seed (Figure 1), a positioning of seed and fertiliser that resembles the recently-developed midrow banding design in Canadian direct seeding systems (Anon. 2003).
Fig. 1. Detail of a typical coulter arrangement of the Scandinavian combi-drill Evaluated in many N-fertilisation field trials, the combi-drill concept resulted in higher yields (Mattsson, 1974; Esala, 1985; Ekeberg, 1986; Oskarsen, 1987; Hartman & Nyborg, 1989), usually explained by higher N uptake in situations when water shortage limited crop establishment. For this reason, since the mid
2

3
1970s, combi-drilling, or banding, has been the dominant sowing technique in those parts of Sweden and Finland where limited rainfall is expected after sowing,. Effects on nitrogen relations have been considered widely, but some positive effects on P uptake have also been reported (Mattsson, 1993; Gruveus, 1998). There may be secondary benefits of fertiliser placement, such as increased competitiveness in relation to weeds (Espeby, 1989; Rasmussen, Rasmussen & Petersen, 1996) or reduction in root diseases (Cook, Ownley, Zhang & Vakoch, 2000), but the plant nutrition effects dominate the literature. Since the early 1990s, in response to concerns about the efficiency of use and environmental impact of fertilisers in Swedish agriculture, there has been increased interest in combi-drilling as a possible approach to improved control of fertiliser utilisation. The primary objective of the present study was to establish whether combi-drilling of N or NP fertilisers was more appropriate than broadcasting the same fertilisers, and whether the type of fertiliser affected the outcome. The secondary objective was to evaluate how soil and weather conditions interact with sowing method, and to look for potential differences in the environmental impacts of these techniques. Materials and methods The experimental period was 1992 to 1994, starting in 1992 with a mild winter followed by a wet spring and a very dry and hot summer throughout Sweden, resulting in sub-optimal conditions for spring-sown crops. The winter 1992-93 was also mild, followed by a warm and dry spring and a wet and cold summer, especially in the far south where rainfall was unusually high in July. The winter 1993-94 was cold in central Sweden, with snow for long periods, but most of the time mild in the south. After a warm spring, the early summer was cold and wet but July and August were dry and hot throughout the country. Eleven experiments were carried out, all in the southern half of Sweden. Plot size was 50 m2 of which 24 m2 were harvested. Soil samples from the upper 25 cm of the profile were taken from each experiment prior to sowing. Macronutrients were extracted according to Swedish standard procedures (Egnér, Riehm & Domingo, 1960; Anon. 1993), and texture and soil organic matter were determined (Anon. 1998b) (Table 1). Precipitation was recorded on a daily basis from sowing to harvest, and accumulated rainfall was calculated for the first thirty (RF30), forty-five (RF45) and sixty (RF60) days after sowing as well as for the entire growing period (RFGP). The amount of N applied in all treatments was 120 kg N ha-1, which, at the time, was considered an adequate amount for a target grain yield of 5000 kg ha-1 (at 15% moisture content). Two application methods (broadcasting and banding with the combi-drill technique), and two fertilisers (calcium ammonium nitrate (CAN) and compound calcium ammonium nitrate with phosphorus (NP)) were combined, giving four treatments (Table 2).
4
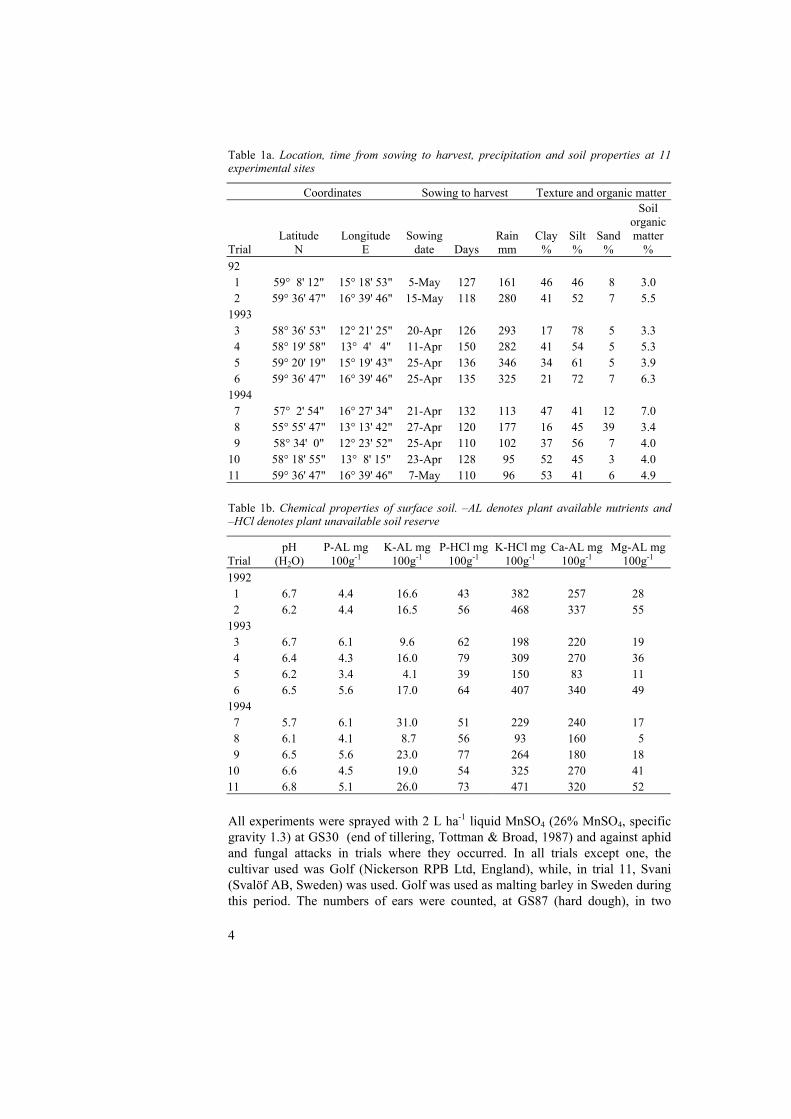
Table 1a. Location, time from sowing to harvest, precipitation and soil properties at 11 experimental sites
Coordinates Sowing to harvest Texture and organic matter
Trial Latitude
N Longitude
E Sowing
date DaysRain mm
Clay %
Silt %
Sand %
Soil organic matter
% 92 1 59° 8' 12" 15° 18' 53" 5-May 127 161 46 46 8 3.0 2 59° 36' 47" 16° 39' 46" 15-May 118 280 41 52 7 5.5 1993 3 58° 36' 53" 12° 21' 25" 20-Apr 126 293 17 78 5 3.3 4 58° 19' 58" 13° 4' 4" 11-Apr 150 282 41 54 5 5.3 5 59° 20' 19" 15° 19' 43" 25-Apr 136 346 34 61 5 3.9 6 59° 36' 47" 16° 39' 46" 25-Apr 135 325 21 72 7 6.3 1994 7 57° 2' 54" 16° 27' 34" 21-Apr 132 113 47 41 12 7.0 8 55° 55' 47" 13° 13' 42" 27-Apr 120 177 16 45 39 3.4 9 58° 34' 0" 12° 23' 52" 25-Apr 110 102 37 56 7 4.0 10 58° 18' 55" 13° 8' 15" 23-Apr 128 95 52 45 3 4.0 11 59° 36' 47" 16° 39' 46" 7-May 110 96 53 41 6 4.9 Table 1b. Chemical properties of surface soil. –AL denotes plant available nutrients and –HCl denotes plant unavailable soil reserve
Trial pH
(H2O) P-AL mg
100g-1 K-AL mg
100g-1 P-HCl mg
100g-1 K-HCl mg
100g-1 Ca-AL mg
100g-1 Mg-AL mg
100g-1 1992 1 6.7 4.4 16.6 43 382 257 28 2 6.2 4.4 16.5 56 468 337 55 1993 3 6.7 6.1 9.6 62 198 220 19 4 6.4 4.3 16.0 79 309 270 36 5 6.2 3.4 4.1 39 150 83 11 6 6.5 5.6 17.0 64 407 340 49 1994 7 5.7 6.1 31.0 51 229 240 17 8 6.1 4.1 8.7 56 93 160 5 9 6.5 5.6 23.0 77 264 180 18 10 6.6 4.5 19.0 54 325 270 41 11 6.8 5.1 26.0 73 471 320 52 All experiments were sprayed with 2 L ha-1 liquid MnSO4 (26% MnSO4, specific gravity 1.3) at GS30 (end of tillering, Tottman & Broad, 1987) and against aphid and fungal attacks in trials where they occurred. In all trials except one, the cultivar used was Golf (Nickerson RPB Ltd, England), while, in trial 11, Svani (Svalöf AB, Sweden) was used. Golf was used as malting barley in Sweden during this period. The numbers of ears were counted, at GS87 (hard dough), in two

5
marked one-metre rows, the third row from each side of the plot. Strength of straw, where 0 is total lodging and 100 a totally upright stand, was estimated for each plot at GS93. At harvest, grain samples for chemical analyses were taken from all plots. Before analyses, these were bulked to one sample per treatment and experiment. N concentration was determined by the Kjeldahl method and crude protein (CP) content calculated as 6.25 x N. Grain N-content and grain dry matter yields were used to calculate the N yield. Table 2. Fertiliser treatments in the experiments
Application method Fertiliser products
Applied nutrients (kg ha-1)
N P A Broadcast CAN Calcium ammonium nitrate (N28; 28% N) 120 - B Broadcast NP Compound CAN*P (NP26-6; 26% N, 6% P) 120 28 C Combi-drilled CAN Calcium ammonium nitrate (N28; 28% N) 120 - D Combi-drilled NP Compound CAN*P (NP26-6; 26% N, 6% P) 120 28 Statistics The experimental layout was a randomised complete block design with three replicates. The data were analysed in R 2.1.0. (R, 2005), using the function lme and associated methods (Pinheiro & Bates, 2002). In the equations there were 2 or 4 levels of the treatment term (Treat), depending on whether the effects of application method (2 levels), fertiliser product (2 levels), or fertiliser treatment (2*2=4 levels) were analysed. There were 3 replicates in each trial (Block) and 11 field trials (Trial) in the series. To estimate mean effects for each individual trial, the data were analysed according to Eq.1: observations in the same block shared the random effects term d(Block); observations with the same treatment shared the term α(Treat); and to each observation Y corresponded an error term ε. The replicates were treated as random. Both the error term and the random effects term were normally distributed random variables, each explaining a part of the variation in the data; the variation between individual measurements and between replicates, respectively. Y = d(Block) + αTreat) + ε (1) To estimate mean effects of the whole experimental series (Table 3), the data were analysed according to Eq.2. The replicates were here nested within experiment, that is, new replicates in each new experiment were both treated as random. An earlier model also included season (Year) in the structure: block nested in Trial nested in Year. This model was reduced to Eq.2 as a significant test (F-test) showed that Year did not contribute to the model. Y = d(Trial, Block) + αTreat) + ε (2)

6
All multiple comparisons (Table 3) were adjusted using the modified Bonferroni method (Holm, 1979) recommended in the R documentation. In order to adjust for varying levels of environmental descriptors (Table 1), an analysis of covariance was performed according to Eq.3, This is the same as Eq.2, with the extension of a covariate (x), a numeric measurement of accumulated rainfall or measured soil factors with one value for each trial. Y = d(Trial, Block) + αTreat) + βTreat * x + ε (3) Where the term ”β(Treat) * x ” in Eq.3 was significant in the F-test, this meant that the slopes of the regression lines were different for different levels of fertiliser treatment (Figure 3). Lack of significance for this term meant that the regression lines would be parallel to each other (Figure 4). Results In seven out of eleven trials the grain yield for at least one of the combi-drilled treatments (C or D) was significantly higher than the yield for the broadcast treatments (A or B). In the remaining trials, there was no significant difference among treatments (data not shown). Table 3. Mean results of treatments, 11 experiments 1992-1994. Different letters at the right of mean values indicate significant contrasts at 5% level
Grain yield at
15% m.c.
Grain crude
proteinNitrogen
yield Grain weight
Moisture content at
harvest Strength of straw
Stand density
kg ha-1 % DM kg ha-1 g 1000-1 % % Ears m-2 A 5429 a 10.8 a 80.2 a 48.1 a 21.1 a 93 a 700 a
B 5608 b 10.9 a 84.3 b 48.9 ac 21.0 a 92 ab 700 a
C 6013 c 11.1 a 90.8 c 49.1 ac 20.8 a 91 bd 740 a
D 6368 d 11.3 a 98.6 d 50.4 bc 19.9 b 88 cd 720 a
As all plots received the same total amount of N, differences in grain yield or in nitrogen yield could be interpreted as differences in fertiliser use efficiency from applied fertiliser, defined as grain yield, or nitrogen yield, per unit of applied fertiliser N. Applying the fertiliser with the combi-drill resulted in higher efficiencies than broadcasting, and the NP fertiliser gave higher values than pure N, both in terms of grain and nitrogen yield. These effects were additive, so that the mean crop performance in terms of both grain yield and nitrogen yield was ordered: D (Combi-drilled NP) > C (Combi-drilled CAN) > B (Broadcast NP) > A (Broadcast CAN) with significant differences between each. There were no significant differences in crude protein content among treatments, although combi-drilling and P fertilisation tended to give slightly higher levels (Table 3).

The differences in grain yield and in nitrogen yield were, over the whole series, 939 kg ha-1 at 15% moisture content, and 18.6 kg ha-1 (15 % of applied N), respectively, when the treatment with the poorest result (A) was compared with the best (D). There were some significant, but not large, effects on strength of straw and individual grain weight. The moisture content at harvest was significantly lower for treatment D than for all other treatments, which indicates that the treatment recovering the highest proportion of applied nitrogen also matured more quickly. Both application method and fertiliser type affected crop performance significantly, but there were no interactions between application method and fertiliser type. To investigate environmental explanations for the different patterns in individual trials, an analysis of covariance was performed. All available soil and weather data were used as covariates, factorised treatments were used for grouping, and grain yield was the dependent variable. Two out of four variables for accumulated rainfall, (RF45 and RFGP) correlated weakly (P = 0.076 and 0.063 respectively) with grain yield when grouped by application method, but not when grouped by fertiliser type or by fertiliser treatment. The banded treatments produced more grain than the broadcast treatments when the amount of precipitation during crop establishment (RF45) increased (10.9 compared with 3.8 kg ha-1 mm-1; Figure 2).
0 20 40 60
4000
6000
8000
Acc. prec. (mm) 45 days from sowing (RF45)
Gra
in y
ield
(kg
ha−1
)
Application methodsBroadcastCombi-drilled
Fig. 2. Grain yield plotted vs. RF45 (precipitation accumulated for 45 days, starting at sowing). The slopes of the regression lines were marginally (P = 0.076) different between fertiliser application methods. R2
adj = 0.09.
7
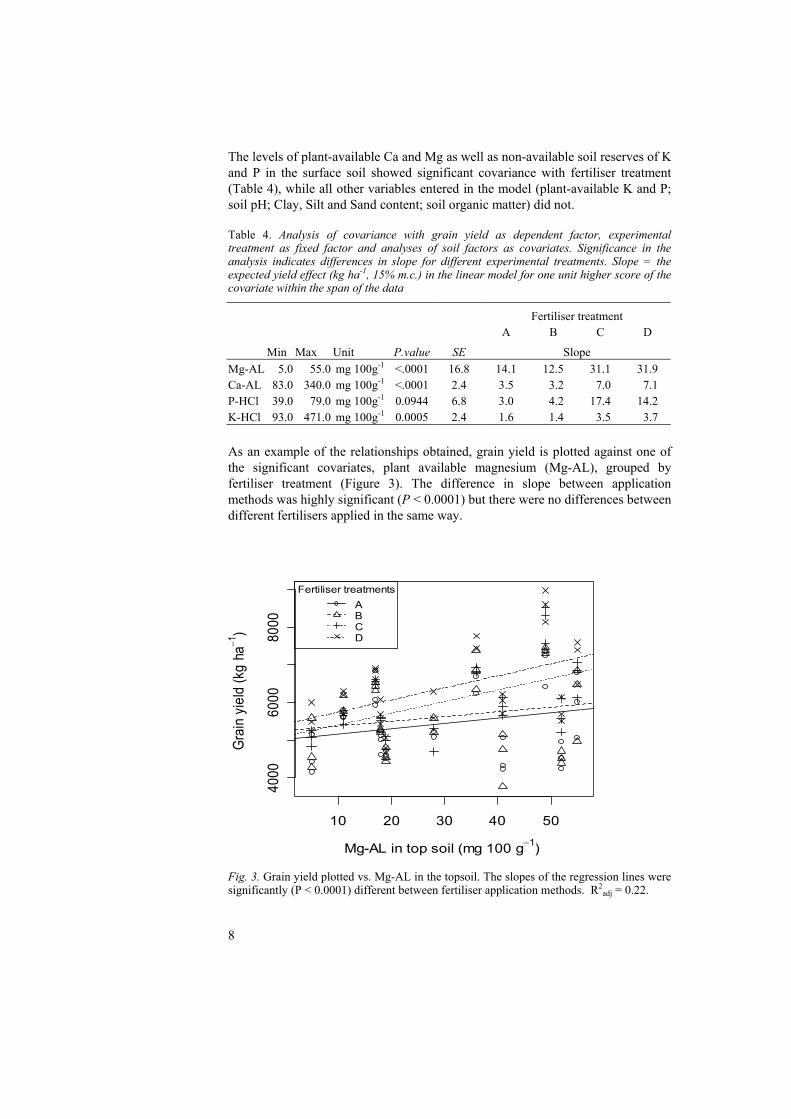
The levels of plant-available Ca and Mg as well as non-available soil reserves of K and P in the surface soil showed significant covariance with fertiliser treatment (Table 4), while all other variables entered in the model (plant-available K and P; soil pH; Clay, Silt and Sand content; soil organic matter) did not. Table 4. Analysis of covariance with grain yield as dependent factor, experimental treatment as fixed factor and analyses of soil factors as covariates. Significance in the analysis indicates differences in slope for different experimental treatments. Slope = the expected yield effect (kg ha-1, 15% m.c.) in the linear model for one unit higher score of the covariate within the span of the data
Fertiliser treatment A B C D
Min Max Unit P.value SE Slope Mg-AL 5.0 55.0 mg 100g-1 <.0001 16.8 14.1 12.5 31.1 31.9 Ca-AL 83.0 340.0 mg 100g-1 <.0001 2.4 3.5 3.2 7.0 7.1 P-HCl 39.0 79.0 mg 100g-1 0.0944 6.8 3.0 4.2 17.4 14.2 K-HCl 93.0 471.0 mg 100g-1 0.0005 2.4 1.6 1.4 3.5 3.7 As an example of the relationships obtained, grain yield is plotted against one of the significant covariates, plant available magnesium (Mg-AL), grouped by fertiliser treatment (Figure 3). The difference in slope between application methods was highly significant (P < 0.0001) but there were no differences between different fertilisers applied in the same way.
10 20 30 40 50
4000
6000
8000
Mg-AL in top soil (mg 100 g−1)
Grai
n yie
ld (k
g ha
−1)
Fertiliser treatmentsABCD
Fig. 3. Grain yield plotted vs. Mg-AL in the topsoil. The slopes of the regression lines were significantly (P < 0.0001) different between fertiliser application methods. R2
adj = 0.22.
8

Similar patterns to that in Figure 3, were found for Ca, a nutrient that, like Mg, was present in excess amounts compared with plant requirement in all trials. The pattern was not found for nutrients present in limiting amounts, such as plant-available P or K. Only one recorded soil variable, soil organic matter content, showed a significant correlation with grain yield, irrespective of fertiliser treatment. Over the range from 3.0 to 7.0%, an increase of one per cent was associated with 577 kg ha-1 increase in grain yield, but the regression lines for the different treatments were all parallel (Figure 4).
3 4 5 6 7
4000
6000
8000
Soil organic matter (SOM) in top soil (%)
Gra
in y
ield
(kg
ha−1
)
Fertiliser treatmentsABCD
Fig. 4. Grain yield plotted vs. soil organic matter (SOM) in topsoil. There was no difference in slopes between treatments. R2
adj = 0.57.
Discussion As only one, fairly high, N application level was used in the trials, it was not possible to analyse interactions among amount of applied N, application method, and fertiliser type. This would have been helpful, as a natural question is whether differences in P or K fertilisation, as well as differences in application method, influenced the optimal level of fertiliser N. P fertilisation increased N uptake and this was further enhanced by using the banding technique (+4.1 kg N ha-1, P = 0.022 vs. +7.8 kg N ha-1, P = 0.0002 for P applications in broadcast and banded treatments respectively). However, the interaction effect was not significant, which might be due to the fact that only one
9

10
level of N application was used in the trials. P fertilisation and banding, in combination, also resulted in dryer grain at harvest than the rest of the treatments, indicating a quicker maturation of the crop after this treatment. This is counter-intuitive, as higher N contents are usually expected to delay maturation. Banding of P is known to increase and speed up seedling development (Mengel & Kirkby, 1979) and this could be enough to cause a marginally, but significantly faster, maturation. Over the whole range of rainfall during the first 45 days from sowing (3-75 mm), barley fertilised by the use of the combi-drill produced more grain from increasing amounts of precipitation compared with crops receiving broadcast fertiliser. This is not consistent with the common presumption that banding is superior to broadcasting especially under early drought conditions; until now, the technique has been employed only in areas where drought after sowing is expected. If this presumption had been correct, the regression lines in Figure 2 would have converged at higher levels of RF45, and would not have diverged, as they do. This implies that previously-used explanations are not entirely valid and that new recommendations about when and where to use combi-drilling should be formulated. The fact that neither soil pH nor plant-available P had any influence on grain and nitrogen yield of the different fertiliser treatments was unexpected. However, neither of these parameters spanned a broad enough range of values to be properly evaluated, and, further, since all trials would have benefited from a yearly application of 15-20 kg P ha-1 according to official Swedish recommendations (Albertsson, 2004), the lack of effect could probably be explained this way. As both P-fertilisation and the use of mid-row banding resulted in higher nitrogen yields from the same amounts of applied N, the result would be less N left in the soil solution after the crop was harvested. The effect would be even greater if residual N was permanently incorporated into humus or permanently fixed in the clay mineral as ammonium ions. It could be concluded that banding of P, as well as being an improved application technique, is also important in reducing the risk of N leaching. The, non significant, tendency towards higher grain CP from banding and from P fertilisation (Table 3) could be a possible problem, as excessive grain CP could result in rejection of a lot as selected malting barley. However, examination of analysed grain CP from the individual trials (data not shown) reveals that the most common pattern was no effect of both combi-drill and P application, and that the tendency for higher mean CP for the whole series comes from a limited number of trials. The fertiliser treatments interacted with some covariates describing the soils, but only the N part of the fertilisers participated, as the slopes for different fertilisers were parallel (Figures 3 and 4). The reason for this is not obvious, but the strongly significant covariates in Table 4 are all major cations in the soil (Ca, K and Mg). High absolute scores for these ions indicate a high cation exchange capacity
11
(CEC). As ammonium is a cation, soils with high CEC will tend to prevent ammonium ions from leaching, which is of positive benefit to the crop, but they also have the potential to slow down the transport of ammonium ions to the plant roots, or even compete with root uptake. Concentrating the ammonium ions with the banding technique in soils with high affinity for ammonium could potentially have a similar effect as concentrating P on soils with low P status. The ammonium ions could move directly from the concentrated bands into the roots, without being bound to the negatively charged sites in the soil. If, on the other hand, the fertiliser is spread evenly in the seedbed, most ammonium ions will be bound by the soil. This means that ammonium uptake by the roots will be more dependent on exchange of ammonium between soil and soil water when the fertiliser is evenly distributed than when the fertiliser is concentrated in bands. In barley, which is dependent on rapid tillering to build a good stand, this difference in ammonium uptake could be important in explaining the effects illustrated in Figure 3. Of the individual cations, a high amount of K+ is often associated with ammonium fixation (Young & Aldag, 1982). The use of banding, “nesting”, and large fertiliser granules, have been shown to maintain soil N available to the crop for long periods, thus avoiding losses by both nitrification and ammonium fixation (Yadvinder-Singh, Malhi, Nyborg & Beauchamp, 1994), and the effects in this study could be a similar phenomenon. In conclusion, banding of N and P at sowing of Swedish malting barley, by the Scandinavian combi-drill technique, was better practice than broadcasting and harrowing the fertiliser into the seedbed. Grain yield and nitrogen yield both gained from banding and P-application. Both practices should, therefore, be used where nitrogen leaching is to be minimised as well as where grain yield is to be maximised. The positive effects of combi-drilling N were not a result of better resistance to water deficiency during crop establishment, the normal explanation for such effects. The effects were, instead, related to the amounts of major cations in the soil, possibly because of the higher affinity for ammonium in soils with high cation exchange capacity. This hypothesis requires to be confirmed by further research. Acknowledgements We wish to thank Anders Anderson and Kristina Eek (Yara Sweden) for supplying us with the dataset. Thanks also go to Christian Ritz at the Danish Royal Veterinary and Agricultural University (KVL), for statistical advice, Lennart Mattsson and Magnus Simonsson (Dept. of Soil Science, SLU), for good discussions on the properties of mineral soils, and Robert Hay (Dept. of Crop Production Ecology, SLU), for many critical comments and linguistic improvements of the manuscript.

12
References Anon. 1993. SS 028310:1993. Soil analysis - Extraction and determination of phosphorus,
potassium, calcium, magnesium and sodium from soils with ammonium lactate/acetic acid solution. (In Swedish). Svensk Standard. SIS Förlag AB, Stockholm, pp. 7.
Anon. 1997. Seed placing fertilizer? Don´t gamble with fertilizer rates!. PAMI. Research Updates 731, 1-4. http://www.pami.ca; (Accessed 17-Jan-2006)
Anon. 1998a. Five side banding openers compared. PAMI. Research Updates 738, 1-5. http://www.pami.ca; (Accessed 17-Jan-2006)
Anon. 1998b. ISO 11277:1998 Soil quality - Determination of particle size distribution in mineral soil material - Method by sieving and sedimentation. International organization for standardization, Geneve, pp. 30.
Anon. 2003. Mid row band or side band? PAMI. Research Updates 761, 1-4. http://www.pami.ca; (Accessed 17-Jan-2006)
Albertsson, B. 2004. 6 Fosfor. Riktlinjer för gödsling och kalkning 2005. Rapport 2004:2. Jordbruksverket, Jönköping, 35-36.
Cook, R. J, Ownley, B. H, Zhang, H. & Vakoch, D. 2000. Influence of paired-row spacing and fertilizer placement on yield and root diseases of direct-seeded wheat. Crop Sci. 40(4), 1079-1087.
Egnér, H, Riehm, H. & Domingo, W. R. 1960. Untersuchungen über die chemische Bodenanalyse als Grundlage für die Beurteilung des Nährstoffzustandes der Böden. II. Chemische Extraktionsmethoden zur Phosphor- und Kaliumbestimmung. Kungliga Lantbrukshögskolans Annaler 26, 199-215.
Ekeberg, E. 1986. Radgjoedsling paa myr. Forskning og Forsoek i Landbruket 37(1), 23-28. Esala, M. 1985. Resultater av ett langtidsforsok med radmyllning och bredspridning av
stigande godselgivor till varvete och korn pa lerjordar. Nordisk Jordbrugsforskning 67(2), 195.
Espeby, L. 1989. Germination of weed seeds and competition in stands of weeds and barley. Influences of mineral nutrients. Crop Production Science 6. Department of Crop Production Science. SLU, Uppsala, pp. 172.
Franck, O. 1948. Försök med nedmyllning av handelsgödsel. Lantbrukshögskolan, Jordbruksförsöksanstalten. Meddelande Uppsala. pp. 26.
Gruveus, I. 1998. Placement of P. Results from Swedish trials in spring barley. Kungl. Skogs-och lantbruksakademiens tidskrift 137(7) (pp. 89-91). (www.ksla.se)
Hartman, M. D. & Nyborg, M. 1989. Effect of early growing season moisture stress on barley utilization of broadcast-incorporated and deep-banded urea. Can. J. Soil. Sci. 69(2), 381-389.
Holm, S. 1979. A simple sequentially rejective multiple test procedure. Scand. J. Statist. 6, 65-70.
Huhtapalo, A. 1982. Scandinavian principles for fertilizer placement, utilization of fertilizer-N nitrogen. In: Proceedings of the 9th Conference of the International Soil Tillage Research Organization, ISTRO. Osijek Yugoslavia, ISTRO, Wageningen, pp. 669-674.
Maertens, C. 1978. Possibilites d'absorption des elements mineraux par les racines. Consequences sur la localisation. Science du Sol 3, 185-195.
Mattsson, L. 1974. Rapport från försök med radmyllning av gödsel. R3-P17. Data från 1971-1973. Rapport från avdelningen för växtnäringslära. Lantbrukshögskolan, Uppsala, 44 pp.
Mattsson, L. 1993. Kombisådd och radmyllning. Meddelande från Södra jordbruksförsöksdistriktet, SLU 40, 9:1-9:7.
Mengel, K. & Kirkby, E. A. 1979. Phosporus in Crop Nutrition. Principles of plant nutrition 2nd ed. (pp. 360-366). International Potash Institute, Berne.
Oskarsen, H. 1987. Radgjodsling til korn. Norsk Landbruksforskning 1(1), 47-52. Pinheiro, J. C. & Bates, D. M. 2002. Mixed-Effects Models in S and S-Plus. Springer, New
York.

13
R Development Core Team. 2005. R: A language and environment for statistical computing. http://www.R-project.org; (accessed 10-Dec-2005). R Foundation for Statistical Computing, Vienna, Austria.
Rasmussen, K. Rasmussen, J. & Petersen, J. 1996. Effects of fertilizer placement on weeds in weed harrowed spring barley. Acta Agr. Scand. B- S P 46(3), 192-196.
Russell, E. W. 1978. The uptake of fertilizer phosphate by crops. Soil conditions and plant growth 10th ed. 4th imp. (pp. 590-594). Longman, London.
Tottman, D. R. & Broad, H. 1987. The decimal code for the growth stages of cereals, with illustrations. Ann. Appl. Biol. 110, 441-454.
Weidemann, A. G. 1943. Fertilizer placement studies on Hillsdale sandy loam soil. Journal of the American Society of Agrononomy 35(9), 747-767.
Yadvinder-Singh, Malhi, S. S, Nyborg, M. & Beauchamp, E. G. 1994. Large granules, nests or bands: methods of increasing efficiency of fall-applied urea for small cereal grains in North America. Fertilizer Research 38(1), 61-87.
Young, J. L. & Aldag, R. W. 1982. 2. Inorganic forms of nitrogen in soil. In Stevenson, F. J. (ed) Nitrogen in agricultural soils (Agronomy 22) (pp. 43-66). ASA, CSSA, SSSA, Madison WI, USA.

14

1
Canopy reflectance, thermal stress, and soil electrical conductivity, as predictors for within-field variability in grain yield and grain protein of malting barley
CG. Pettersson1, M. Söderström2 and H. Eckersten1 1Dept. of Crop Production Ecology, Box 7043, SLU, SE-750 07 UPPSALA, Sweden 2Dept. of Soil Science, Div. of Precision Agriculture, Box 234, SLU, SE-532 23 SKARA, Sweden [email protected] Abstract Three consecutive crops of malting barley grown during 2002-04 on clay-loam on a Swedish farm (59°74’ N, 17°00’ E) were monitored for canopy reflectance at growth stages GS32 and GS69, and the crops were sampled for above ground dry matter and nitrogen content. GPS-positioned unfertilised plots were established and used for soil sampling. At harvest, plots of 0.25 m2 were cut in both fertilised and unfertilised plots, and 24 m2 areas were also harvested from fertilised barley. The correlations between nine different vegetation indices from each growth stage on one side, and yield and grain protein on the other side, were tested. All indices correlated well with grain yield and protein when measured at GS69 but only four when measured at GS32. The best-correlated vegetation index sampled at GS32, a thermal time stress index calculated for the grain filling period, and normalised electrical conductivity of the soil was sufficient input in the final regressions. Using these three variables, it was possible to make either one multivariate (PLS) regression model or two linear multiple regression models for grain yield and grain protein, with correlation coefficients of 0.90 and 0.73 for yield and protein respectively.
Keywords PLS-regression, SEC, TCARI/OSAVI, VI (vegetation index), Yara N-sensor
Introduction Malting barley is required to have 9.5 to 11.5 % crude protein on a dry matter basis (CP) in order to be accepted in the market. There are also indications that uneven protein levels within a lot cause problems during malting and brewing even if the mean levels are acceptable (Palmer, 2000). Knowing this, malting barley is a crop where successful precision agriculture (PA) has the potential to create easily-recognised better quality. The objective for precision agriculture in malting barley could then be to minimise variation within the field, between fields, and among regions and years. However, so far, only limited amounts of PA research have been done on this crop. Within-field variation in yield and protein content of cereal crops can be substantial, and the pattern can vary among seasons (Stafford, 1999). Thylén et al. (1999) reported within-field variations in CP of 2.8 and 2.9 % around the yearly

mean in a two-year study of malting barley. Protein maps from three successive years on one Swedish farm, from the present study, show temporal and spatial variability of a similar magnitude (Figure 1). A common approach of PA is to construct management zones from yield data. This might be possible where a large body of experimental data existed (Blackmore, 2000), but impractical using the information normally available from farmers (Joernsgaard and Halmoe, 2003). Using measured soil properties to create management zones has proved difficult, but the combination of soil electrical conductivity (SEC) and soil topography has shown to be useful (Delin, 2005). In practice, information from the actual field and crop is required (Lark and Wheeler, 2003). Börjesson and Söderström (2003) have suggested the use of canopy reflectance data from growth stage 69 (GS69, Tottman and Broad, 1987) onwards, to create harvesting zones in fields of winter wheat and malting barley with the objective of separating the harvest into lots of similar protein levels.
Fig 1. Grain protein levels (CP) in three fields of malting barley (cv. Astoria) in central Sweden 2002-2004. The map represents data from 219 GPS-positioned plots, harvested with a plot-combine in three consecutive years. The management of the crops was similar for the three seasons. In a Swedish one-year study with four fertiliser field trials, it was found that canopy reflectance at GS32 could be used to guide variable-rate fertiliser
2

application (Krafft, 2004), but it is important to know whether such an approach would work with the variation present, in practice, at the field scale.
0.4
0.6
0.8
Relative canopy reflectance
0
0.2
400 500 600 700 800 900 1000
Wavelength (nm) Fig 2. Reflection spectra for unfertilised (o) and well fertilised (+) malting barley at GS69. The NIR range and above (780 nm and over) measures biomass, while wavelengths 550-700 nm reflect the light-harvesting capacity of the crop (from Krafft, 2004). Objectives The objective of the present study was, using data from farmers´ fields, to examine the relation between observed canopy reflectance at early (GS32) and late (GS69) plant development stages on one hand, and yield and protein content of grains at harvest on the other. Special focus was placed on examining the effects on these relationships of using different vegetation indices, and evaluating what other data would be needed to improve statistical predictions. Materials and methods Crops of malting barley, cv. Astoria (Secobra, France), on a clay-loam at a Swedish farm (59°74’ N, 17°00’ E) were monitored for three years (2002-2004). Each year, the farmer established an evenly distributed, GPS-positioned, set of unfertilised (3m x 8m) plots at seeding. The remaining field areas were uniformly fertilised with combi-drilled (Huhtapalo, 1982) fertiliser (Yara OptiCrop 24-4-5 (NPK24-9-6 3S)) at recommended levels of 90-100 kg N ha-1. All crops were sown in spring, after autumn ploughing, following winter wheat, using the same 3 m seed drill (Tive 1830).
3

4
Measurements Soil samples were taken from the unfertilised plots at 0-30 and 30-60 cm depth and analysed for NO3-N and NH4-N. pH and plant-available phosphorus (P-AL), potassium (K-AL) and magnesium (Mg-AL) were measured from samples taken 0-30 cm, using Swedish standard procedures (Anon, 1993). An available technical platform to record canopy reflectance data, based on the Yara N-Sensor, exists in both tractor-mounted and hand-held versions (Reusch, Link and Lammel, 2002). The hand-held version was used in this study. Canopy reflectance was recorded in the field at GS32 and GS69 from the corners of the non-fertilised plots. One set of readings was taken with the sensor pointing into unfertilised barley, and another matching set with the sensor pointing into fertilised barley. Mean values were calculated for each set. SEC maps of the fields were produced from data collected by continuously recorded EM38 equipment (Geonics Ltd.) pulled by a 4x4 quad-bike. Vertically mounted, the equipment produces the bulk of information from approximately 40 cm deep (Sudduth, Drummond and Kitchen, 2001). A first dataset was recorded in two steps under dry conditions during the autumns 2002 and 2003, but there was some doubt about the usefulness of these data since variation in water content is the main reason for different SEC-values (EM38). As it was difficult to reconcile the results of the primary analyses from these readings with a gradient of water content in a clay-soil, a second dataset of the whole farm was recorded soon after planting in spring 2005 (EM38_05). Air temperatures were recorded at 1.8 m height at the nearest available meteorological station (Adcon Telemetry GmbH, Austria), 20 km south of the field. Randomly selected crop samples (0.25 m2) were cut within, and 2m outside, the borders of all non-fertilised plots at GS77 (2002, 2003 and 2004), and at GS87 (2003 and 2004). At harvest, the fields were sampled with a plot-combine, following a square 36m x 36m grid pattern using the tramlines as guides, each sample measuring 24 m2 (10m x2.4m). All samples were placed in cotton bags and dried at a maximum of 38 oC. The samples from GS77 were dried at 105 oC for 24 hours, weighed to give dry matter content, and milled. N-content was measured with a LECO CNS-2000 (LECO Corporation, MI). The grain samples were analysed for moisture and N content with a FOSS Infratec 1241 Grain Analyzer (FOSS, Denmark), using a ratio of 6.25 between N and CP. Interpolated measurements The plot-combine harvested plots were not placed exactly where the reflectance measurements had taken place, neither were the SEC readings. To obtain a dataset for multivariate and linear regression analyses, these data were interpolated to the coordinates of the non-fertilised plots by ordinary block kriging using GS+ (Anon, 2004b). Maps were produced using ArcGIS 8.3 (Anon, 2004a).

5
Vegetation indices The canopy reflectance was measured between 400 and 1000 nm at increments of 10 nm, at GS32 and GS69. From these measurements, nine vegetation indices (VIs) were calculated. The idea is to create an index that is possible to use for predictions, by forming ratios and differences between canopy reflectance from specific wavelengths. There are two major approaches for VI construction: (i) slope based VIs, who are combinations of the visible and near infrared bands and (ii) distance based VIs, who have the objective to cancel the effect of soil brightness where vegetation is sparse. A widely used slope based VI is NDVI (Eq. 4) while OSAVI (Eq. 5) may represent the distance based type (Thiam and Eastman, 2001). When constructing a VI there are, at least, three important positions on the spectrum to consider: (i) green at 550 nanometre (nm), which is a local minimum for chlorophyll absorption, (ii) red at 670 nm, which is a local maximum for chlorophyll absorption, and (iii) infrared at 780 nm, where the light is not absorbed by chlorophyll but instead reflected according to the amount and arrangement of leaves in the canopy. At 780 nm, well-fertilised plants tend to reflect more radiation than poorly fertilised plants (Figure 2) (Reusch, 1997). A set of nine vegetation indices (VIs) from GS32 and GS69 was calculated and evaluated as explaining variables for GY and CP from both small plots harvested at GS87 and interpolated data harvested at GS93. As no samples were taken from the small plots at GS87 during the first year, this evaluation was done on a dataset from 2003 and 2004. The VIs tested in this study varied from classical satellite indices, such as RATIO or NDVI (Eq. 3 and 4), to recently-developed VIs for specific use, such as TC/OS (Eq. 8). The algorithms were (in an alphabetic order): ”Green Normalized Difference VI ” (Shanahan et al., 2001) as: GNDVI = ( R780 - R560) / ( R780 + R560) (1) NIR/Green = R780 / R550 (2) NIR/Red = R780 / R670 (3) NIR/Red is also referred to as the RATIO index “Normalized Difference VI ” (Carlsson and Ripley, 1997; Rondeaux, et al., 1996; Reusch, 1997) calculated as: NDVI = ( R780 - R670) / ( R780 + R670) (4) “Optimised Soil Adjusted VI” (Haboudane et al., 2002; Rondeaux, et al, 1996) as: OSAVI = (1 + 0.16)(R800 - R670) / (R800 + R670 + 0.16) (5)
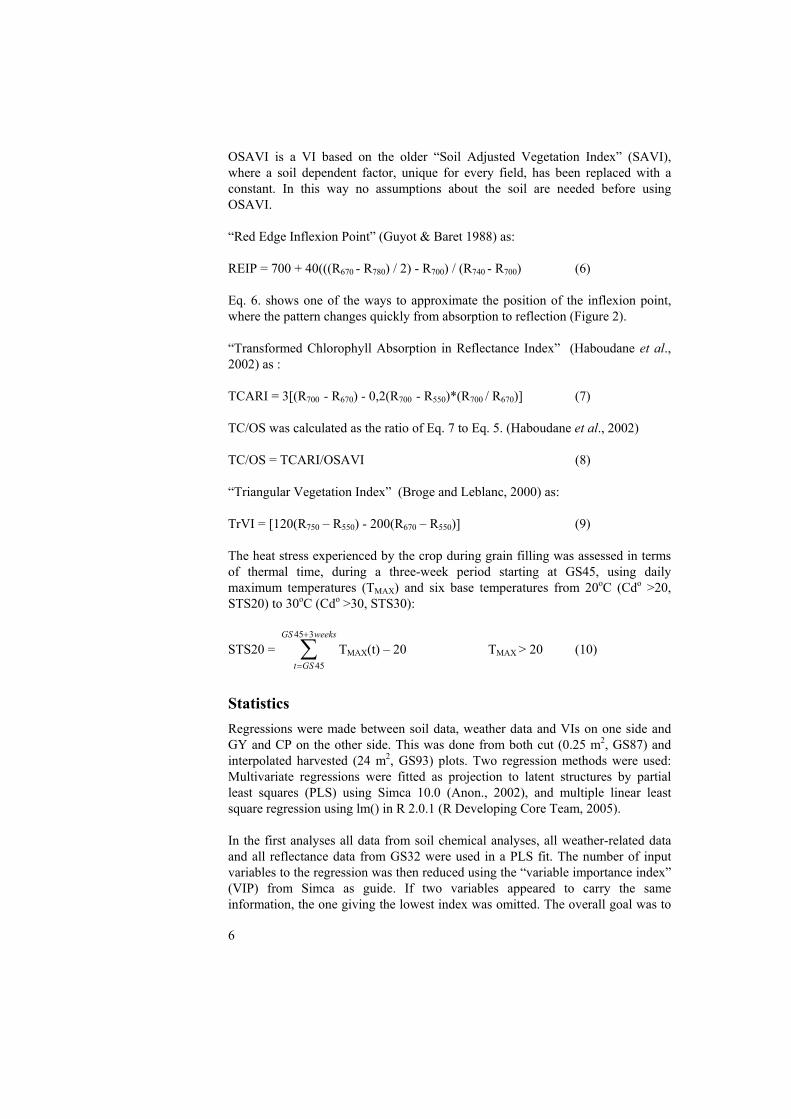
OSAVI is a VI based on the older “Soil Adjusted Vegetation Index” (SAVI), where a soil dependent factor, unique for every field, has been replaced with a constant. In this way no assumptions about the soil are needed before using OSAVI. “Red Edge Inflexion Point” (Guyot & Baret 1988) as: REIP = 700 + 40(((R670 - R780) / 2) - R700) / (R740 - R700) (6) Eq. 6. shows one of the ways to approximate the position of the inflexion point, where the pattern changes quickly from absorption to reflection (Figure 2). “Transformed Chlorophyll Absorption in Reflectance Index” (Haboudane et al., 2002) as : TCARI = 3[(R700 - R670) - 0,2(R700 - R550)*(R700 / R670)] (7) TC/OS was calculated as the ratio of Eq. 7 to Eq. 5. (Haboudane et al., 2002) TC/OS = TCARI/OSAVI (8) “Triangular Vegetation Index” (Broge and Leblanc, 2000) as: TrVI = [120(R750 – R550) - 200(R670 – R550)] (9) The heat stress experienced by the crop during grain filling was assessed in terms of thermal time, during a three-week period starting at GS45, using daily maximum temperatures (TMAX) and six base temperatures from 20oC (Cdo >20, STS20) to 30oC (Cdo >30, STS30):
STS20 = T∑+
=
weeksGS
GSt
345
45MAX(t) – 20 TMAX > 20 (10)
Statistics Regressions were made between soil data, weather data and VIs on one side and GY and CP on the other side. This was done from both cut (0.25 m2, GS87) and interpolated harvested (24 m2, GS93) plots. Two regression methods were used: Multivariate regressions were fitted as projection to latent structures by partial least squares (PLS) using Simca 10.0 (Anon., 2002), and multiple linear least square regression using lm() in R 2.0.1 (R Developing Core Team, 2005). In the first analyses all data from soil chemical analyses, all weather-related data and all reflectance data from GS32 were used in a PLS fit. The number of input variables to the regression was then reduced using the “variable importance index” (VIP) from Simca as guide. If two variables appeared to carry the same information, the one giving the lowest index was omitted. The overall goal was to
6

7
maximise the cross-validated R2 values (Q2) (Anon., 2002), for both GY and CP using as few input variables as possible. The same variables as in the final PLS models were then used for additive multiple linear regressions and reduced using the F-test from the ANOVA-table. Scatter plots were made with the plot() function in R. Results The weather conditions during the three years were contrasting, with early sowing in the first year, late in the second, and normal time for sowing in the third year. Sowing was followed by dry and cold weather conditions in the first two years, but a temperate and humid period during establishment of the third crop. All three crops received high irradiance during grain filling but thermal stress, assessed as STS20 (Eq. 10), was high in 2003, low in 2004 and medium in 2002 (Table 1). Table 1. Variables representing the final models from the three-year study, together with three soil variables used during the work but not included after the final model reductions Seeding April 23 2002 May 19 2003 May 1 2004 Harvest Aug 18 Aug 29 Sep 10 Mean Max Min Mean Max Min Mean Max Min
Grain
GY (kg ha-1) 4740 5300 4380 4050 4380 3690 6320 6810 5610 CP (% DM) 11.0 11.6 10.4 10.4 11.6 9.7 8.9 10.3 8.4
Soil
Clay (%) 39 58 17 38 44 32 40 48 33 pH H2O 6.5 6.7 6.1 6.5 6.6 6.3 6.3 6.5 6.1 P-AL (mg/100g) 3.5 6.1 2.0 2.3 4.4 1.2 4.9 11.0 2.0
Model input variables
TC/OS GS32 0.168 0.178 0.150 0.179 0.194 0.166 0.267 0.333 0.185 EM38 (norm) 0.405 0.530 0.320 0.772 0.940 0.460 0.550 0.720 0.290 EM38_05 (norm) 0.400 0.534 0.281 0.820 0.988 0.452 0.670 0.863 0.289 Thermal time (oCd >20) STS20 12.4 - - 75.8 - - 2.4 - -
Evaluation of VIs The crop grain biomass and protein content were better correlated with VIs at GS69 (Table 3) than at GS32 (Table 2). Both harvesting methods revealed the same regression patterns, although the statistical significances of the regressions with plot-combined and interpolated data at GS93 were higher than those using data from the hand-harvested 0.25m2 plots at GS87. This might be due to the higher error levels in the GS87 dataset caused by smaller samples. The interpolated data from GS93 were, therefore, preferred for the remaining analyses. All VI observations at GS69 showed high correlations
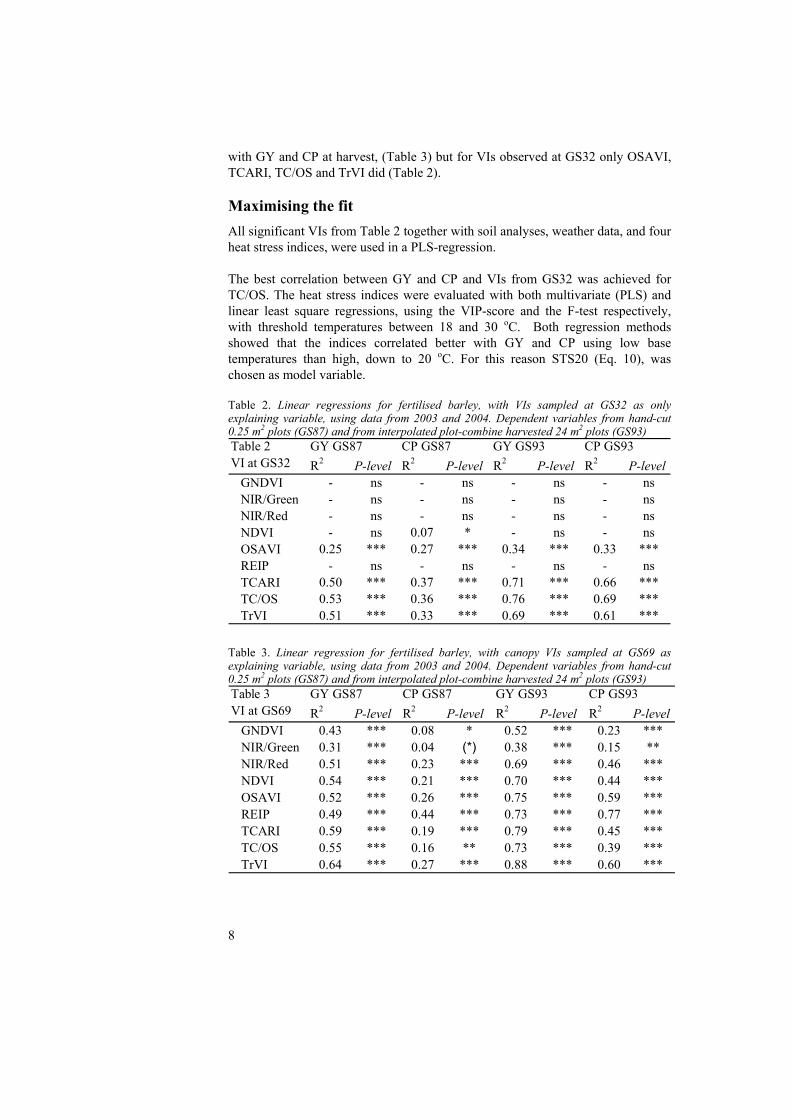
with GY and CP at harvest, (Table 3) but for VIs observed at GS32 only OSAVI, TCARI, TC/OS and TrVI did (Table 2). Maximising the fit All significant VIs from Table 2 together with soil analyses, weather data, and four heat stress indices, were used in a PLS-regression. The best correlation between GY and CP and VIs from GS32 was achieved for TC/OS. The heat stress indices were evaluated with both multivariate (PLS) and linear least square regressions, using the VIP-score and the F-test respectively, with threshold temperatures between 18 and 30 oC. Both regression methods showed that the indices correlated better with GY and CP using low base temperatures than high, down to 20 oC. For this reason STS20 (Eq. 10), was chosen as model variable. Table 2. Linear regressions for fertilised barley, with VIs sampled at GS32 as only explaining variable, using data from 2003 and 2004. Dependent variables from hand-cut 0.25 m2 plots (GS87) and from interpolated plot-combine harvested 24 m2 plots (GS93) Table 2VI at GS32 R2 P-level R2 P-level R2 P-level R2 P-level GNDVI - ns - ns - ns - ns NIR/Green - ns - ns - ns - ns NIR/Red - ns - ns - ns - ns NDVI - ns 0.07 * - ns - ns OSAVI 0.25 *** 0.27 *** 0.34 *** 0.33 *** REIP - ns - ns - ns - ns TCARI 0.50 *** 0.37 *** 0.71 *** 0.66 *** TC/OS 0.53 *** 0.36 *** 0.76 *** 0.69 *** TrVI 0.51 *** 0.33 *** 0.69 *** 0.61 ***
GY GS87 CP GS87 GY GS93 CP GS93
Table 3. Linear regression for fertilised barley, with canopy VIs sampled at GS69 as explaining variable, using data from 2003 and 2004. Dependent variables from hand-cut 0.25 m2 plots (GS87) and from interpolated plot-combine harvested 24 m2 plots (GS93) Table 3VI at GS69 R2 P-level R2 P-level R2 P-level R2 P-level GNDVI 0.43 *** 0.08 * 0.52 *** 0.23 *** NIR/Green 0.31 *** 0.04 (*) 0.38 *** 0.15 ** NIR/Red 0.51 *** 0.23 *** 0.69 *** 0.46 *** NDVI 0.54 *** 0.21 *** 0.70 *** 0.44 *** OSAVI 0.52 *** 0.26 *** 0.75 *** 0.59 *** REIP 0.49 *** 0.44 *** 0.73 *** 0.77 *** TCARI 0.59 *** 0.19 *** 0.79 *** 0.45 *** TC/OS 0.55 *** 0.16 ** 0.73 *** 0.39 *** TrVI 0.64 *** 0.27 *** 0.88 *** 0.60 ***
GY GS87 CP GS87 GY GS93 CP GS93
8

9
Model reductions, in terms of reduced number of explanatory variables, were carried out for best correlations between PLS model outputs on one side, and observed GY and CP on the other side. One model was used to predict both variables. The soil data contributed little to the correlation between the VI based regression models and GY and CP, although P-AL showed a weak negative correlation with yield. Three variables were included in the final regression model: TC/OS, thermal heat-stress time (STS20), and normalised values of soil electrical conductivity (SEC; referred to as EM38 below). The PLS model reduction procedure resulted in two linear equations, one for GY and one for CP: GY = 3340 + 12078*TC/OS - 13.3*STS20 - 598*EM38 Q2=0.90 (11) CP = 13.7 – 13.8*TC/OS + 0.0063*STS20 - 1.59*EM38 Q2 = 0.74 (12) Fitting and reducing additive linear regressions with lm() in R, using the variables from Eq. 10 and 11, gave the following: GY = 3379 + 10721*TC/OS - 16.8*STS20 R2
adj=0.90 (13) CP = 13.6 - 13.5*TC/OS + 0.007*STS20 - 1.7*EM38 R2
adj=0.73 (14) EM38 was removed from Eq. 13, due to lack of significance in the F-test. The PLS regression (Eq. 11 and 12), and the two separate linear regressions (Eq. 13 and 14), resulted in almost the same expressions and regression coefficients. To investigate further how the soil moisture content, measured with the EM38-device, affect the results, another regression using the SEC from spring 2005 (EM38_05), instead of the autumn sampled data from 2002 and 2003, was made. However, this gave almost the same results, although a slight increased R2
adj value due to a higher P value for CP. The results are logical as the EM38 values of 2002 and 2005 correlated well (EM38_05 = 0.021 + 1.07*EM38; R2 = 0.93). Discussion Correlations between VIs sampled at GS69 on one side, and GY and CP on the other, could be useful if late yield or protein maps are required (Börjesson and Söderström, 2003). As the objective of this study was to improve N application in an earlier stage, the VIs that proved useful at GS32 were the most valuable. The choice between linear least square regressions (Fox, 2002) (Eq. 13 and 14) and PLS-regressions (Eriksson et al, 2001) (Eq. 11 and 12), can be difficult. The advantage of PLS is that many variables as predictors for several dependant variables are evaluated in linked regression models, which saves time. The disadvantage is the lack of robust criteria for evaluation of when a variable should be retained and when it should be removed from the model. In this study, after model reduction, the resulting algorithms were almost identical, showing that the practical differences were not very big.

10
The regressions models described in equations 11-14 could be used in practice as they are based on a limited number of variables. The key factor for the regressions is the VI TC/OS extracted at GS32, which is related to the chlorophyll content at early stem elongation. A high score for TC/OS at GS32 reflects a potential for vigorous growth from GS32 to anthesis, a period when the maximum possible grain population density and thus the upper limit for yield is set. TC/OS at GS32 showed positive correlations with GY and negative correlations with CP. Hence there was a negative correlation between GY and CP. The portion of total grain carbon (C) that is translocated from stem storage during grain filling in barley, could vary between 60% a hot and dry year and 15% under more favourable grain filling conditions (Austin et al, 1980). As the portion of translocated stem N in the grains is not as sensitive as the portion of translocated stem C, stress from high temperature during grain filling will result in higher protein levels (Boonchoo et al., 1998; Grashoff and d'Antuono, 1997). High temperature during flowering and grain filling is known to result in high CP levels in malting barley, at least for daily maximum temperatures above 30 oC (Savin and Nicolas, 1996; Tester et al., 1991). In this study, normal summer temperatures, with 20-25oC as daily maxima, were sufficiently high to affect both GY and CP. This is in line with results of Triboi & Triboi-Blondel (2002) from wheat in France. It is not possible to calculate any general impact from the three temperature levels in this study, as this would require a bigger dataset. Temperatures appearing several weeks after adjusting fertilisation could, of course, not be used to guide fertilisation, but the thermal effect during grain filling was strong and indicates that predictions of CP are, to a certain degree, dependent upon the actual weather during later stages of the crop cycle. As weather predictions are limited to, at most, 10 days, historical weather records would be needed to make forecasts at GS32 for protein contents at harvest. The reason that TC/OS ave a good early measure of the chlorophyll content is that the algorithm can minimise disturbing influences from background soil reflectance, and LAI, better than other VIs. Haboudane et al. (2002) developed this VI for maize crops, where bare soil is visible for longer periods than in small grains. A map of TC/OS at GS32 during the three-year study, Figure 3, shows a similar pattern as Figure 1 with the difference that the relationships are reversed.

Fig 3. TC/OS (Eq. 8) at GS32 during the three-year study. The VI has a strong negative correlation with grain protein (Figure 1). SEC has proved useful to stabilise predictions of N-mineralisation over the field in situations where the mineral composition in the soil varies (Delin, 2005). As the EM38 equipment measures SEC, which is heavily influenced by soil moisture among other soil attributes, the resulting data may describe the gradient of available water in the soil profile. On level clay-loam soils, as in this study, the effect of soil humus was expected to be the main source of variation. The effect of SEC on GY was not significant at the 5% level (Eq. 13) and that on CP (Eq. 14) more likely to have been caused by soil structure factors than by soil humus, as the correlation was negative. Even if the moisture level of the soil during measurement did not seem to be critical, SEC would be difficult to use as a general variable for GY or CP as the reasons for variation in water content measured by the technique would be different in different soils. Because of this, one single role for the variable in predictions is hard to imagine. To use SEC for predictions, new correlations with GY and CP would have to be established for each new situaton. The regressions used in this study worked well, and show the potential of using TC/OS from GS32, and thermal time calculated from daily maximum temperatures during grain filling, as predictors for GY and CP in malting barley. To do real
11

12
predictions, the algorithms have to be validated with more data, work that still has to be done. Conclusions It has been possible to calculate both GY and CP in malting barley during early stem elongation from very limited recorded data. The most important control variable was the VI TCARI/OSAVI, which, together with STS20 (an index of heat stress during grain filling), and SEC (soil electrical conductivity), predicted most variation. To obtain practically applicable models, further work has to be done with larger datasets. Acknowledgements I wish to thank Kristina Eek and Anders Anderson Yara Sweden, and the Yara N-Sensor team in Hanninghof Germany, for their help and support in extracting data from obscure log files. Thank you also to Professor Robert Hay, who has helped me to think about this material in a bigger context. This project has been possible due to economic support from Stiftelsen Svensk Växtnäringsforskning, Svenska Lantmännen and Precisionsodling Sverige (POS). References Anon. 1993. Svensk Standard. SS 02 83 10:1993. Soil analysis - Extraction and
determination of phosphorus, potassium, calcium, magnesium and sodium from soils with ammonium lactate/acetic acid solution. (In Swedish). Stand. kom. Sv, 7.
Anon. 2002. Simca-P and Simca-P+ 10.0 User Guide (Umetrics AB, Umeå, Sweden) p. 366
Anon. 2004a. ESRI GIS and Mapping Software. ArcGIS 8.3 (www.esri.com, Redlands, CA, USA).
Anon. 2004b. Gamma Design Software. GS+ geostatistic software (www.gammadesign.com, Plainwell, Michigan, USA).
Austin, R. B, Morgan, C. L, Ford, M. A, and Blackwell, R. D. 1980. Contributions to grain yield from pre-anthesis assimilation in tall and dwarf barley phenotypes in two contrasting seasons. Annals of Botany 45, 309-319.
Blackmore, S. 2000. The interpretation of trends from multiple yield maps. Computers and Electronics in Agriculture 26, 37-51.
Boonchoo, S, Fukai, S, and Hetherington, S. E. 1998. Barley yield and grain protein concentration as affected by assimilate and nitrogen availability. Australian Journal of Agricultural Research 49(4), 695-706.
Börjesson, T, and Söderström, M. 2003. Prediction of protein content in cereals using canopy reflectance. In: Precision Agriculture. Proceedings of the 4th European Conference on Precision Agriculture, edited by J. Stafford (Wageningen Academic Publishers, Wageningen), p. 89-94.
Broge, N. H, and Leblanc, E. 2000. Comparing prediction power and stability of broadband and hyperspectral vegetation indices for estimation of green leaf area index and canopy chlorophyll density. Remote Sensing of Environment. 76, 156-172.
Carlsson, T. N, and Ripley, D. A. 1997. On the Relation between NDVI, Fractional Vegetation Cover and Leaf Area Index. Remote Sensing of Environment. 62, 241-252.
Delin, S. 2005. Site-specific nitrogen fertilization demand in relation to plant available soil nitrogen and water. Potential for prediction based on soil characteristics (SLU. Doctoral thesis, Skara, Sweden) p. 117.

13
Eriksson, L, Johansson, E, Kettaneh-Wold, N, and Wold, S. 2001. PLS (Chapter 4). In: Multi- and Megavariate data analysis. Principles and applications (Umetrics Academy, Umeå, Sweden), 71-111.
FOSS, Denmark, www.foss.dk Fox, J. 2002. Linear least square regressions (Chapter 4.1). In: An R and S-plus companion
to applied regression (SAGE Publications, Thousand Oaks, CA), 119-124. Geonics Ltd. Canada, www.geonics.com Grashoff, C, and d'Antuono, L. F. 1997. Effect of shading and nitrogen application on yield,
grain size distribution and concentrations of nitrogen and water soluble carbohydrates in malting spring barley (Hordeum vulgare L.). European Journal of Agronomy 6(3-4), 275-293.
Haboudane, D, Miller, J. R, Tremblay, N, Zarco-Tejada, P. J, and Dextraze, L. 2002. Integrated narrow-band vegetation indices for prediction of crop chlorophyll content for application to precision agriculture. Remote Sensing of Environment 81, 416-426.
Huhtapalo, A. 1982. Scandinavian principles for fertilizer placement, utilization of fertilizer-N nitrogen. In: Proceedings of the 9th Conference of the International Soil Tillage Research Organization, ISTRO. Osijek Yugoslavia, (ISTRO), 669-674.
Joernsgaard, B, and Halmoe, S. 2003. Intra-field variation over crops and years. European Journal of Agronomy 19, 23-33.
Krafft, A. 2004. Fjärranalys av maltkorn - tio vegetationsindex förmåga att prediktera kväveskörd, avkastning och proteinhalt. [Remote sensing of malting barley - Ten vegetation indices ability to predict nitrogen yield, yield and protein content]. Examensarbete, MSci thesis (SLU. Department of Ecology and crop production sciences, Uppsala, Sweden) p. 51.
Lark, R. M, and Wheeler, H. C. 2003. Experimental and analythical methods for studying within-field variation of crop responses to inputs. In: Precision Agriculture. Proceedings of the 4th European Conference on Precision Agriculture, edited by J. Stafford and A. Werner (Wageningen Academic Publishers, Wageningen, The Netherlands), 341-346.
LECO Corporation, MI, USA, www.leco.com Palmer, G. H. 2000. Malt performance is more related to inhomogeneity of protein and β-
glucan breakdown than to standard malt analyses. Journal of the Institute of Brewing 106(3), 189-192.
R Developing Core Team 2005. A language and environment for statistical computing. URL http://www.R-project.org (R Foundation for Statistical Computing, Vienna, Austria).
Reusch, S. 1997. Entwicklung eines reflexionsoptischen Sensors zur Erfassung der Stickstoffversorgung landwirtschaftlicher Kulturpflanzen. [Development of an optical reflectance sensor for determining the nitrogen supply to agricultural plants]. Dissertation (Christian-Albrechts-Universität, Kiel, Germany. In German.), p. 155.
Reusch, S, Link, A, and Lammel, J. 2002. Tractor-mounted multispectral scanner for remote field investigation. In: Proceedings of 6th International Conference on Precision Agriculture (CD), edited by P. C. Robert (ASA/CSSA/SSSA, Madison, USA), 1385-1393.
Rondeaux, G, Steven, M, and Baret, F. 1996. Optimization of Soil-Adjusted Vegetation Indices. Remote Sensing of Environment. 55, 95-107.
Savin, R, and Nicolas, M. E. 1996. Effects of Short periods of Drought and High Temperature on Grain Growth an Starch Accumulation of Two Malting Barley Cultivars. Australian Journal of Plant Physiology 23, 201-210.
Shanahan, J. F, Schepers, J. S, Francis, D. D, Varvel, G. E, Wilhelm, W. W, Tringe, J. M, Schlemmer, M. R, and Major, D. J. 2001. Use of Remote-Sensing Imagery to Estimate Corn Grain Yield. Agronomy Journal 93, 583-589.
Stafford, J. V. 1999. An investigation into the within-field spatial variability of grain quality. In: Precision Agriculture 1999. Proceedings of the 2nd European Conference on Precision Agriculture edited by J. Stafford (Sheffield Academic Press, Sheffield, UK), 353-361.
14
Sudduth, K. A, Drummond, S. T, and Kitchen, N. R. 2001. Accuracy issues in electromagnetic induction sensing of soil electrical conductivity for precision agriculture. Computers and Electronics in Agriculture 31, 239-264.
Tester, R. F, South, J. B, Morrison, W. R, and Ellis, R. P. 1991. The Effects of Ambient Temperature During the Grainfilling Period on the Composition and Properties of Starch from Four Barley Genotypes. Journal of Cereal Science 13, 113-127.
Thiam, A, and Eastman, J. R. 2001. Vegetation Indices (Chapter 4). In: idrisi32 Release 2, edited by J. R. Eastman (Clark Labs, Worcester, MA), 89-101.
Thylén, L, Algerbo, P. A, and Pettersson, C. 1999. Grain quality variations within fields of malting barley. In: Precision Agriculture 1999. Proceedings of the 2nd European Conference on Precision Agriculture, edited by J. Stafford (Sheffield Academic Press Ltd, Sheffield, UK), 287-296.
Tottman, D. R, and Broad, H. 1987. The decimal code for the growth stages of cereals, with illustrations. Annals of Applied Biology 110, 441-454.
Triboi, E, and Triboi-Blondel, A. -M. 2002. Productivity and grain or seed composition: a new approach to an old problem - invited paper. European Journal of Agronomy 16, 163-186.

Reports from the Department of Crop Production Ecology No. 1 Variations of yield and protein content of malting barley. Methods to monitor and ways to control.