variation in the expression of a ... - bmc plant biology
TRANSCRIPT
RESEARCH ARTICLE Open Access
Variation in the expression of atransmembrane protein influences cellgrowth in Arabidopsis thaliana petals byaltering auxin responsesCharlotte N. Miller, Jack Dumenil, Fu Hao Lu, Caroline Smith, Neil McKenzie, Volodymyr Chapman, Joshua Ball,Mathew Box and Michael Bevan*
Abstract
Background: The same species of plant can exhibit very diverse sizes and shapes of organs that are geneticallydetermined. Characterising genetic variation underlying this morphological diversity is an important objective inevolutionary studies and it also helps identify the functions of genes influencing plant growth and development.Extensive screens of mutagenised Arabidopsis populations have identified multiple genes and mechanismsaffecting organ size and shape, but relatively few studies have exploited the rich diversity of natural populations toidentify genes involved in growth control.
Results: We screened a relatively well characterised collection of Arabidopsis thaliana accessions for variation inpetal size. Association analyses identified sequence and gene expression variation on chromosome 4 that made asubstantial contribution to differences in petal area. Variation in the expression of a previously uncharacterised geneAt4g16850 (named as KSK) had a substantial role on variation in organ size by influencing cell size. Over-expressionof KSK led to larger petals with larger cells and promoted the formation of stamenoid features. The expression ofauxin-responsive genes known to limit cell growth was reduced in response to KSK over-expression. ANT expressionwas also reduced in KSK over-expression lines, consistent with altered floral identities. Auxin responses werereduced in KSK over-expressing cells, consistent with changes in auxin-responsive gene expression. KSK maytherefore influence auxin responses during petal development.
Conclusions: Understanding how genetic variation influences plant growth is important for both evolutionary andmechanistic studies. We used natural populations of Arabidopsis thaliana to identify sequence variation in a promoterregion of Arabidopsis accessions that mediated differences in the expression of a previously uncharacterisedmembrane protein. This variation contributed to altered auxin responses and cell size during petal growth.
Keywords: Arabidopsis thaliana/organ size variation/natural genetic variation/auxin responses
© The Author(s). 2020 Open Access This article is licensed under a Creative Commons Attribution 4.0 International License,which permits use, sharing, adaptation, distribution and reproduction in any medium or format, as long as you giveappropriate credit to the original author(s) and the source, provide a link to the Creative Commons licence, and indicate ifchanges were made. The images or other third party material in this article are included in the article's Creative Commonslicence, unless indicated otherwise in a credit line to the material. If material is not included in the article's Creative Commonslicence and your intended use is not permitted by statutory regulation or exceeds the permitted use, you will need to obtainpermission directly from the copyright holder. To view a copy of this licence, visit http://creativecommons.org/licenses/by/4.0/.The Creative Commons Public Domain Dedication waiver (http://creativecommons.org/publicdomain/zero/1.0/) applies to thedata made available in this article, unless otherwise stated in a credit line to the data.
* Correspondence: [email protected] and Developmental Biology Department John Innes Centre, NorwichResearch Park, Norwich NR4 7UH, UK
Miller et al. BMC Plant Biology (2020) 20:482 https://doi.org/10.1186/s12870-020-02698-5
BackgroundCell proliferation and cell growth are coordinated togenerate the characteristic sizes, shapes and functions ofplant organs. This coordination involves multiple cellu-lar processes, including signaling mechanisms, cell div-ision, turgor-driven cell expansion, and cell wall andprotein synthesis [1]. During the formation of determin-ate plant organs such as leaves and petals, cell prolifera-tion with limited cell growth occurs at earlier stages oforgan formation, followed by cell growth with limitedcell proliferation, which occurs to increase cell size, ac-companied by differentiation as the developing organ at-tains its final characteristic size and shape [2]. Very littleis known about the spatial and temporal integration ofcell proliferation and cell growth to generate the finalsizes and shapes of organs and seeds, despite its funda-mental and applied importance.Many plant species display a wide range of forms due
to altered sizes and shapes of organs, reflecting adapta-tion to their natural environments. The natural range ofthe annual species Arabidopsis thaliana extends fromnorthern Scandinavia to Africa, and it exhibits a corres-pondingly diverse range of phenotypes [3–5], such thatmost accessions are phenotypically distinct. However,genetic variation underlying this phenotypic variation isstill poorly understood. For example, the extent to whichvariation in the functions of genes influencing organ sizeestablished in one experimental accession influences nat-ural variation in organ sizes in populations of Arabidop-sis thaliana is not well understood. Also, the extent ofconservation of known mechanisms influencing organsize and many other traits in natural populations is alsoinsufficiently documented. Therefore, an increased un-derstanding of the genetic foundations of natural vari-ation in traits such as organ size will shed light on hownatural genetic variation influences mechanisms control-ling organ size and other traits.Arabidopsis thaliana has adapted to diverse habitats
worldwide, with extensive natural variation in organ sizereflecting these different life histories [4]. Although vari-ation in the shapes and sizes of different floral organsare correlated in order to maintain the reproductivefunctions of the flower [6], significant genetic variationinfluencing several floral morphology traits was identi-fied by QTL analyses of Arabidopsis Recombinant In-bred Line (RIL) populations [7, 8]. More recently, QTLanalyses identified six independent loci influencing vari-ation in petal shape and size, with variation at the ERECTA (ER) locus accounting for 51% of this variation [9].Haplotype variation in 32 accessions at the GA1 locuswas associated with variation in petal, stamen and stylelengths [10]. In one of the few studies exploiting naturalvariation to identify a previously unknown growth regu-lator, BRX was established as a regulator of cell
proliferation during root growth [11]. Despite thesestudies, there are limited examples of the identificationand characterisation of natural variation in organ size inArabidopsis.Genome-wide association (GWA) mapping in Arabidopsis
is increasingly used to access a wider range of natural geneticvariation, to identify small-effect alleles, and to mapgenotype-phenotype relationships more precisely [12]. Thevery small size of their genomes has facilitated the re-sequencing of a large range of Arabidopsis thaliana acces-sions and the identification of vast numbers of SNP andsmall indel variants by comparison to the assembled Col-0accession [13]. Within this wide-ranging set of accessions,those from Sweden are relatively well documented [14] andhave been screened for variation in over-wintering responses[15]. Initial inspection of this collection showed considerablevariation in petal size and shape, therefore we conducted anassociation analysis of 272 Swedish accessions. We identifiedvariation in the promoter of a hypothetical gene At4G16850,predicted to encode a 6-transmembrane (6TM) protein. Ac-cessions with increased At4g16850 expression had largerpetals due to increased cell growth. This was confirmed bytransgenic lines over-expressing the coding region ofAt4g16850, which was called KSK. Over-expression ofAt4g16850 lowered expression of several auxin-responsivegenes that modulate petal cell size and also reduced auxin re-sponses. At4g16850 over-expression also led to the partialhomeotic conversion of petals to stamenoid structures, andthis was attributed to altered expression of floral organ devel-opment genes.
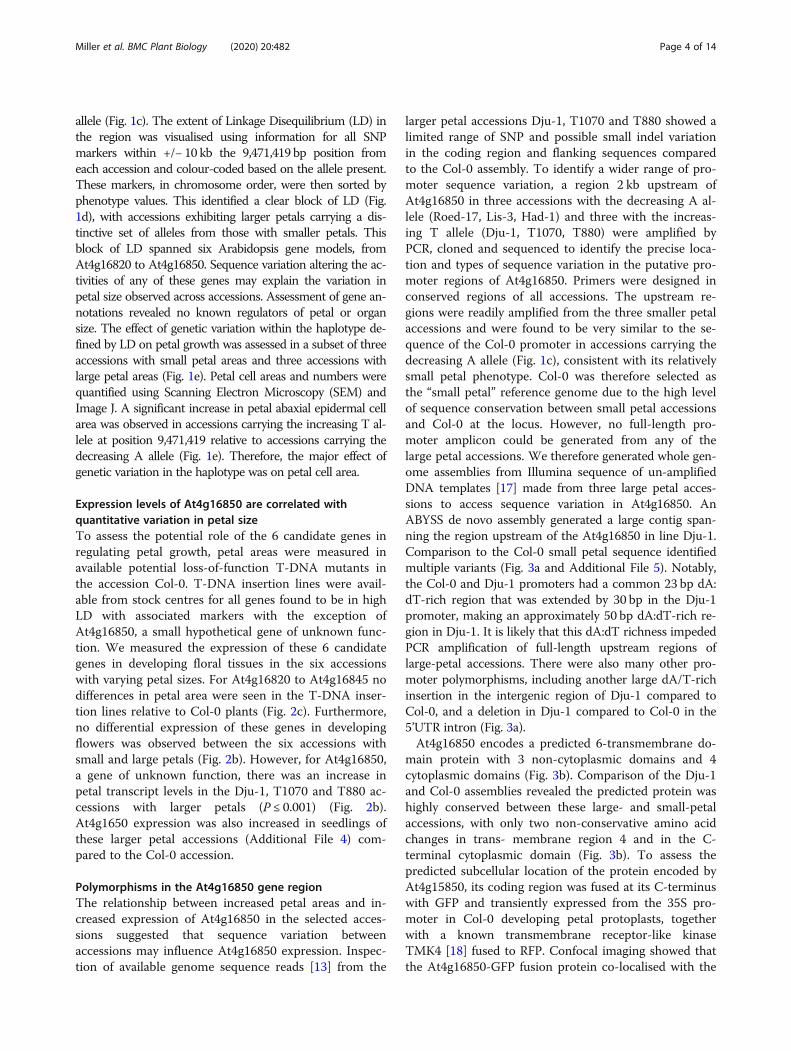
ResultsIdentifying a locus influencing petal areaWe measured the length, maximum width and area of petalsof 272 Arabidopsis thaliana accessions collected from south-ern and northern Sweden (Additional File 1) that weregrown in controlled conditions after vernalization. Add-itional File 2 shows petal phenotype measurements. All threepetal parameters varied substantially within the sampled col-lection. For example, mean petal areas varied from 0.915mm2 (Hov1–10) to 4.92mm2 (Vår2–6), a difference of537%. Additional File 3 shows representative petals fromthese accessions and from Död 1, an intermediate size forcomparison. Fig. 1a shows that mean petal area variationformed a normal distribution and was therefore suitable forassociation studies. GWAPP was used [16] with an Acceler-ated Mixed Model, incorporating information across 250,000SNPs. This analysis identified a significant SNP associationon chromosome 4 for petal area (Fig. 1b). The most signifi-cantly associated SNP within this region was located at pos-ition 9,471,419 bp, within gene model At4G16830. Themarker at this position was bi-allelic, with those accessionscarrying a “T” allele at this locus exhibiting a ~ 15% increasein petal area relative to those carrying the alternative “A”
Miller et al. BMC Plant Biology (2020) 20:482 Page 2 of 14
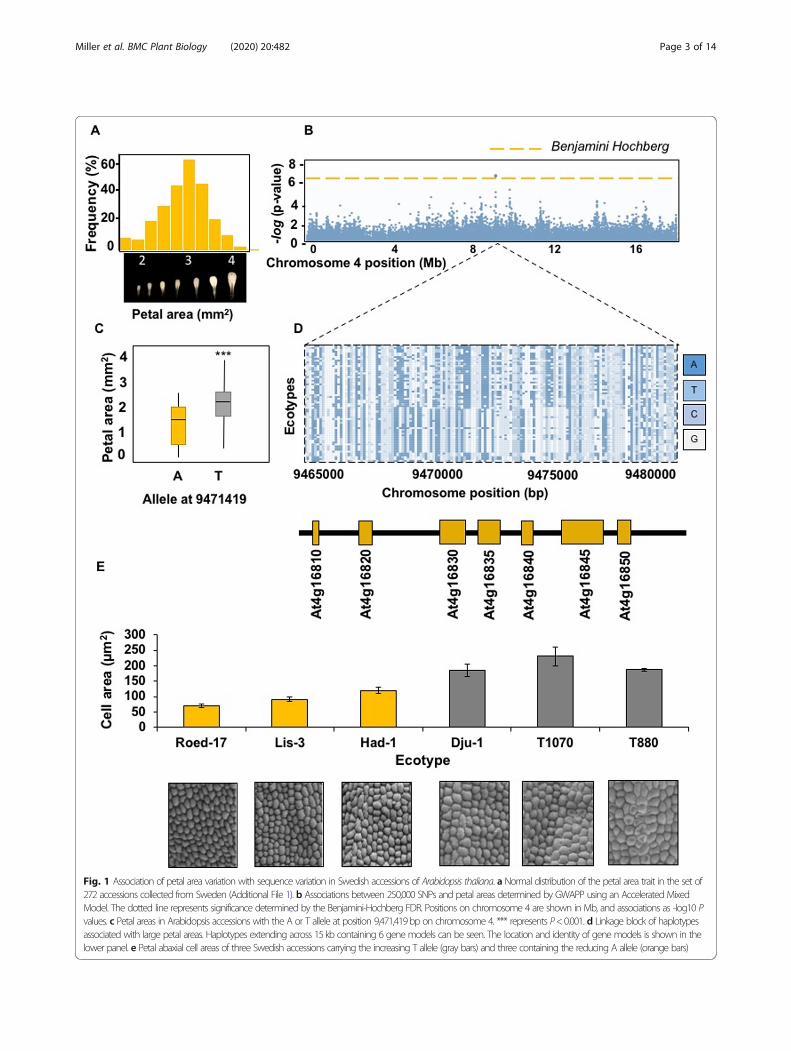
Fig. 1 Association of petal area variation with sequence variation in Swedish accessions of Arabidopsis thaliana. a Normal distribution of the petal area trait in the set of272 accessions collected from Sweden (Additional File 1). b Associations between 250,000 SNPs and petal areas determined by GWAPP using an Accelerated MixedModel. The dotted line represents significance determined by the Benjamini-Hochberg FDR. Positions on chromosome 4 are shown in Mb, and associations as -log10 Pvalues. c Petal areas in Arabidopsis accessions with the A or T allele at position 9,471,419bp on chromosome 4. *** represents P<0.001. d Linkage block of haplotypesassociated with large petal areas. Haplotypes extending across 15kb containing 6 gene models can be seen. The location and identity of gene models is shown in thelower panel. e Petal abaxial cell areas of three Swedish accessions carrying the increasing T allele (gray bars) and three containing the reducing A allele (orange bars)
Miller et al. BMC Plant Biology (2020) 20:482 Page 3 of 14
allele (Fig. 1c). The extent of Linkage Disequilibrium (LD) inthe region was visualised using information for all SNPmarkers within +/− 10 kb the 9,471,419 bp position fromeach accession and colour-coded based on the allele present.These markers, in chromosome order, were then sorted byphenotype values. This identified a clear block of LD (Fig.1d), with accessions exhibiting larger petals carrying a dis-tinctive set of alleles from those with smaller petals. Thisblock of LD spanned six Arabidopsis gene models, fromAt4g16820 to At4g16850. Sequence variation altering the ac-tivities of any of these genes may explain the variation inpetal size observed across accessions. Assessment of gene an-notations revealed no known regulators of petal or organsize. The effect of genetic variation within the haplotype de-fined by LD on petal growth was assessed in a subset of threeaccessions with small petal areas and three accessions withlarge petal areas (Fig. 1e). Petal cell areas and numbers werequantified using Scanning Electron Microscopy (SEM) andImage J. A significant increase in petal abaxial epidermal cellarea was observed in accessions carrying the increasing T al-lele at position 9,471,419 relative to accessions carrying thedecreasing A allele (Fig. 1e). Therefore, the major effect ofgenetic variation in the haplotype was on petal cell area.
Expression levels of At4g16850 are correlated withquantitative variation in petal sizeTo assess the potential role of the 6 candidate genes inregulating petal growth, petal areas were measured inavailable potential loss-of-function T-DNA mutants inthe accession Col-0. T-DNA insertion lines were avail-able from stock centres for all genes found to be in highLD with associated markers with the exception ofAt4g16850, a small hypothetical gene of unknown func-tion. We measured the expression of these 6 candidategenes in developing floral tissues in the six accessionswith varying petal sizes. For At4g16820 to At4g16845 nodifferences in petal area were seen in the T-DNA inser-tion lines relative to Col-0 plants (Fig. 2c). Furthermore,no differential expression of these genes in developingflowers was observed between the six accessions withsmall and large petals (Fig. 2b). However, for At4g16850,a gene of unknown function, there was an increase inpetal transcript levels in the Dju-1, T1070 and T880 ac-cessions with larger petals (P ≤ 0.001) (Fig. 2b).At4g1650 expression was also increased in seedlings ofthese larger petal accessions (Additional File 4) com-pared to the Col-0 accession.
Polymorphisms in the At4g16850 gene regionThe relationship between increased petal areas and in-creased expression of At4g16850 in the selected acces-sions suggested that sequence variation betweenaccessions may influence At4g16850 expression. Inspec-tion of available genome sequence reads [13] from the
larger petal accessions Dju-1, T1070 and T880 showed alimited range of SNP and possible small indel variationin the coding region and flanking sequences comparedto the Col-0 assembly. To identify a wider range of pro-moter sequence variation, a region 2 kb upstream ofAt4g16850 in three accessions with the decreasing A al-lele (Roed-17, Lis-3, Had-1) and three with the increas-ing T allele (Dju-1, T1070, T880) were amplified byPCR, cloned and sequenced to identify the precise loca-tion and types of sequence variation in the putative pro-moter regions of At4g16850. Primers were designed inconserved regions of all accessions. The upstream re-gions were readily amplified from the three smaller petalaccessions and were found to be very similar to the se-quence of the Col-0 promoter in accessions carrying thedecreasing A allele (Fig. 1c), consistent with its relativelysmall petal phenotype. Col-0 was therefore selected asthe “small petal” reference genome due to the high levelof sequence conservation between small petal accessionsand Col-0 at the locus. However, no full-length pro-moter amplicon could be generated from any of thelarge petal accessions. We therefore generated whole gen-ome assemblies from Illumina sequence of un-amplifiedDNA templates [17] made from three large petal acces-sions to access sequence variation in At4g16850. AnABYSS de novo assembly generated a large contig span-ning the region upstream of the At4g16850 in line Dju-1.Comparison to the Col-0 small petal sequence identifiedmultiple variants (Fig. 3a and Additional File 5). Notably,the Col-0 and Dju-1 promoters had a common 23 bp dA:dT-rich region that was extended by 30 bp in the Dju-1promoter, making an approximately 50 bp dA:dT-rich re-gion in Dju-1. It is likely that this dA:dT richness impededPCR amplification of full-length upstream regions oflarge-petal accessions. There were also many other pro-moter polymorphisms, including another large dA/T-richinsertion in the intergenic region of Dju-1 compared toCol-0, and a deletion in Dju-1 compared to Col-0 in the5’UTR intron (Fig. 3a).At4g16850 encodes a predicted 6-transmembrane do-
main protein with 3 non-cytoplasmic domains and 4cytoplasmic domains (Fig. 3b). Comparison of the Dju-1and Col-0 assemblies revealed the predicted protein washighly conserved between these large- and small-petalaccessions, with only two non-conservative amino acidchanges in trans- membrane region 4 and in the C-terminal cytoplasmic domain (Fig. 3b). To assess thepredicted subcellular location of the protein encoded byAt4g15850, its coding region was fused at its C-terminuswith GFP and transiently expressed from the 35S pro-moter in Col-0 developing petal protoplasts, togetherwith a known transmembrane receptor-like kinaseTMK4 [18] fused to RFP. Confocal imaging showed thatthe At4g16850-GFP fusion protein co-localised with the
Miller et al. BMC Plant Biology (2020) 20:482 Page 4 of 14

Fig. 2 (See legend on next page.)
Miller et al. BMC Plant Biology (2020) 20:482 Page 5 of 14

(See figure on previous page.)Fig. 2 Expression levels and petal area phenotypes of candidate genes. a Representation of predicted genes in the 15 kb region of LD associatedwith variation for petal size. Predicted and known functions of genes in the LD block are shown. The diagram is not to scale. b Mean geneexpression levels of candidate genes in petals of three small and three large petal accessions. These are shown in Fig. 1e. Expression ofAt4g16850 was significantly increased (P < 0.001) in large petal accessions. Expression levels are relative to EF1ALPHA gene expression. Data aregiven as means of +/−SE (n = 3 biological replicates. P values were determined by Student’s t-test. ns is not significant. c Petal areas of T-DNAinsertion alleles of candidate genes in accession Col-0. ns is not significant. No T-DNA mutant was available for At4g16850
Fig. 3 Characterisation of candidate gene At4g16850. a Sequence variation in the 322 bp intergenic and 5’UTR region between VRN2 andAt4g16850 transcription start site, and in the 5’UTR, between the large petal accession Dju-1 and small petal genotype Col-0. Two A/T insertionsin Dju-1 relative to Col-0 are shown above the line, and insertions in Col-0 relative to Dju-1 are shown below the line. Additional File 5 shows asequence alignment of these regions. b The coding regions of At4g16850 from the large petal accession Dju-1 and the small petal accession Col-0 were aligned to identify predicted protein sequence differences. The coding regions were analysed with InterPro to identify putativetransmembrane and cytoplasmic protein domains, shown as coloured bars under the predicted coding sequence. Amino acid differences areshown as gray highlights. c Transient expression of At4g16850 coding region fused to GFP at its C-terminus from the 35S promoter in Col-0 petalprotoplasts. A known plasma-membrane protein TMK4 fused to RFP was used to reveal co-location in the plasma membrane. The white colour inthe overlay reveals co-location of At4g16850-GFP and TMK4-RFP
Miller et al. BMC Plant Biology (2020) 20:482 Page 6 of 14

RFP-tagged TMK4 plasma membrane protein (Fig. 3c),demonstrating that it can be localised to the plasmamembrane. At4g16850-GFP fusion protein was also ob-served in cytoplasmic structures.
Overexpression of At4G16850 increases petal size due toincreased cell growthAnalysis of the expression of At4G16850 across acces-sions displaying high variation for petal area establishedthat differential expression could account for 76% of thevariation in petal size in the tested accessions (Fig. 4a).To establish whether this variation in At4g16850 causedpetal size variation, the coding region of At4g16850 fromCol-0 was expressed from the constitutive 35S promoterin transgenic Arabidopsis Col-0 plants. Col-0 has rela-tively small petals and inherits the decreasing allele inthe associated haplotype that segregates with lowAt4G16850 expression. Therefore Col-0 was an
appropriate accession in which to observe any expectedincrease in petal size following overexpression ofAt4g16850. Comparison of petal areas in transgenic linesand untransformed Col-0 plants revealed that all trans-genic plants overexpressing At4G16850 (lower panel)exhibited significantly increased petal size relative toCol-0 (P ≤ 0.01) (Fig. 4b). Therefore, increased expres-sion of At4g16850 leads to increases in petal area by ap-proximately 125%, indicating that variation inAt4g16850 expression among the accessions directly in-fluences petal area. In the tested accessions exhibitingincreased At4g16850 expression, cell areas were in-creased (Fig. 1e). Petal cell areas were also increased intransgenic lines overexpressing At4g16850 by approxi-mately 175% (Fig. 4c). This suggested there were fewerlarger cells in larger petals. Taken together, these resultsshow that increased expression of At4g16850 promotescell growth in Arabidopsis petals. To take account of
Fig. 4 Over-expression of At4g16850 leads to larger petal cells. a Correlation of At4g16850 gene expression and petal areas in accessionsexhibiting a wide range of petal areas. b Petal areas in transgenic Col-0 lines overexpressing the At4g16850 coding region from the 35Spromoter. Eight independent transgenic lines with elevated At4g16850 transcript levels in petals were selected and petal areas measured (n = 50petals, *P < 0.05). The lower panel shows relative expression levels of At4616850 in the transgenic lines compared to Col-0. c Cell areas on theabaxial side of petals from two selected over-expressing lines (OE1 and OE2) described in panel B above are increased (***P < 0.001, n = 50 cells)
Miller et al. BMC Plant Biology (2020) 20:482 Page 7 of 14

this information about a previously unknown gene inArabidopsis thaliana we named the gene KSK (Kron-bladStorleK, Swedish for petal size).
Increased expression of KSK reduces expression of genesthat limit petal cell growthPrevious studies have identified several genes that influ-ence petal cell growth in Arabidopsis. BPEp [19] andARF8 function together [20] to limit petal cell growth,and FRL1 [21] also represses petal cell growth. The ex-pression of these genes in developing petals of threetransgenic Col-0 lines over-expressing At4g16850 and inuntransformed Col-0 was measured using Q-RT-PCR toassess whether KSK may influence petal cell growththrough these genes. Although only one transgenic lineshowed significant reduction in BPE expression in petals(Fig. 5a), consistent reductions in ARF8 and FRL1 ex-pression in developing transgenic petals was seen(Figs. 5b, c) compared to Col-0. This suggested that KSKmay promote petal cell growth by reducing the expres-sion of these petal cell growth genes. AGAMOUS re-duces BPEp expression [19] and the ag-1 loss of
function mutant has larger petals [22], consistent withthe larger cell and petal sizes in BPEp loss of functionmutants. Although we did not observe consistent reduc-tion of BPEp expression in all KSK overexpressing trans-genic lines, we tested whether AG influences KSKexpression. KSK expression was doubled in the ag-1loss-of-function mutant (Fig. 5d) consistent with amodel in which AG repressed KSK expression, leadingto increased ARF8 and FRL1 expression and correspond-ing reduced petal cell size and overall petal area.
Overexpression of KSK leads to partial homeoticconversion of petals to stamenoid structuresIn addition to observing a significant increase in petalcell growth in the 35S::KSK over-expressing lines, wealso observed partial organ identity changes in ~ 10% offlowers from all eight 35S::KSK transgenic plants (Add-itional File 6). Flowers with organ identity changes hadan additional petal-like structure in the second whorl.This developed in the outer margin of the second whorland displayed varying extents of stamenoid features suchas a partial pollen sac (Fig. 6a) and stomata, a cell type
Fig. 5 Reduced expression of petal cell growth genes in KSK over-expressing lines. Expression levels of BPE (a), ARF8 (b) and FRL1 (c) indeveloping petals of 35SS::KSK overexpressing lines (OE 1,2,3). ** P < 0.01; *** P < 0.001. Expression levels are relative to EF1ALPHA gene expression.Data are given as means of +/−SE (n = 3 biological replicates. P values were determined by Student’s t-test. D. Expression of KSK in developingpetals of Col-0 and the agamous-1 mutant. Expression levels are relative to EF1ALPHA gene expression. Data are given as means of +/−SE (n = 3biological replicates. P values were determined by Student’s t-test
Miller et al. BMC Plant Biology (2020) 20:482 Page 8 of 14
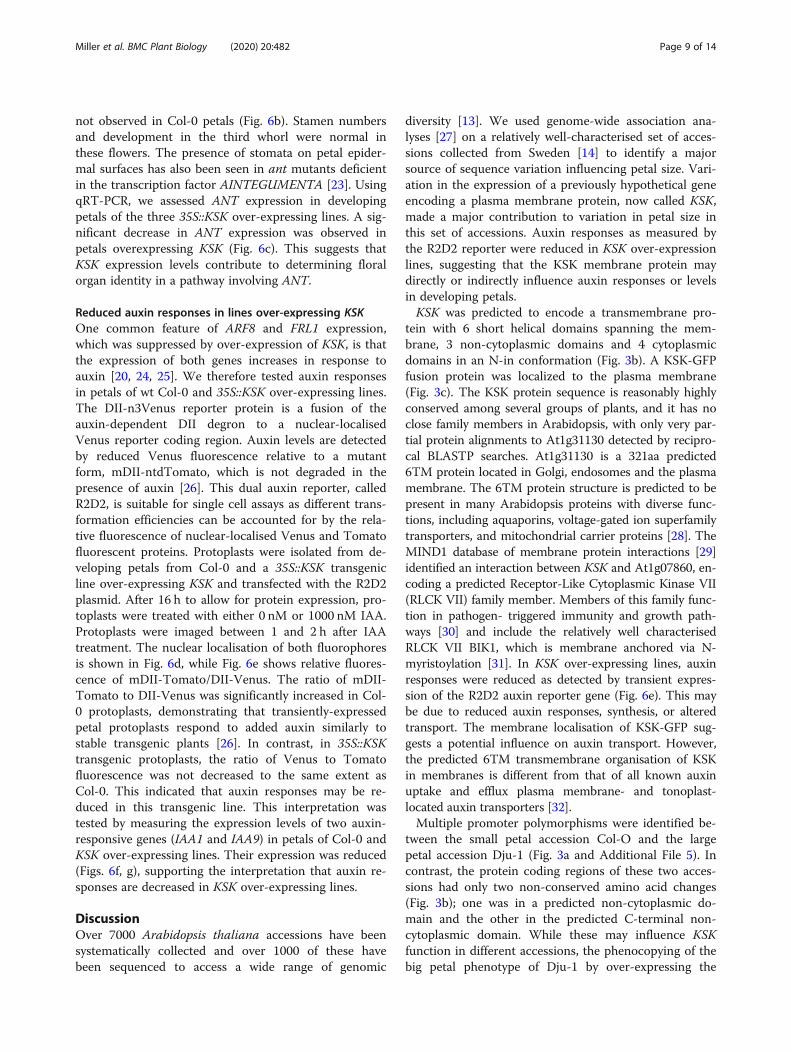
not observed in Col-0 petals (Fig. 6b). Stamen numbersand development in the third whorl were normal inthese flowers. The presence of stomata on petal epider-mal surfaces has also been seen in ant mutants deficientin the transcription factor AINTEGUMENTA [23]. UsingqRT-PCR, we assessed ANT expression in developingpetals of the three 35S::KSK over-expressing lines. A sig-nificant decrease in ANT expression was observed inpetals overexpressing KSK (Fig. 6c). This suggests thatKSK expression levels contribute to determining floralorgan identity in a pathway involving ANT.
Reduced auxin responses in lines over-expressing KSKOne common feature of ARF8 and FRL1 expression,which was suppressed by over-expression of KSK, is thatthe expression of both genes increases in response toauxin [20, 24, 25]. We therefore tested auxin responsesin petals of wt Col-0 and 35S::KSK over-expressing lines.The DII-n3Venus reporter protein is a fusion of theauxin-dependent DII degron to a nuclear-localisedVenus reporter coding region. Auxin levels are detectedby reduced Venus fluorescence relative to a mutantform, mDII-ntdTomato, which is not degraded in thepresence of auxin [26]. This dual auxin reporter, calledR2D2, is suitable for single cell assays as different trans-formation efficiencies can be accounted for by the rela-tive fluorescence of nuclear-localised Venus and Tomatofluorescent proteins. Protoplasts were isolated from de-veloping petals from Col-0 and a 35S::KSK transgenicline over-expressing KSK and transfected with the R2D2plasmid. After 16 h to allow for protein expression, pro-toplasts were treated with either 0 nM or 1000 nM IAA.Protoplasts were imaged between 1 and 2 h after IAAtreatment. The nuclear localisation of both fluorophoresis shown in Fig. 6d, while Fig. 6e shows relative fluores-cence of mDII-Tomato/DII-Venus. The ratio of mDII-Tomato to DII-Venus was significantly increased in Col-0 protoplasts, demonstrating that transiently-expressedpetal protoplasts respond to added auxin similarly tostable transgenic plants [26]. In contrast, in 35S::KSKtransgenic protoplasts, the ratio of Venus to Tomatofluorescence was not decreased to the same extent asCol-0. This indicated that auxin responses may be re-duced in this transgenic line. This interpretation wastested by measuring the expression levels of two auxin-responsive genes (IAA1 and IAA9) in petals of Col-0 andKSK over-expressing lines. Their expression was reduced(Figs. 6f, g), supporting the interpretation that auxin re-sponses are decreased in KSK over-expressing lines.
DiscussionOver 7000 Arabidopsis thaliana accessions have beensystematically collected and over 1000 of these havebeen sequenced to access a wide range of genomic
diversity [13]. We used genome-wide association ana-lyses [27] on a relatively well-characterised set of acces-sions collected from Sweden [14] to identify a majorsource of sequence variation influencing petal size. Vari-ation in the expression of a previously hypothetical geneencoding a plasma membrane protein, now called KSK,made a major contribution to variation in petal size inthis set of accessions. Auxin responses as measured bythe R2D2 reporter were reduced in KSK over-expressionlines, suggesting that the KSK membrane protein maydirectly or indirectly influence auxin responses or levelsin developing petals.KSK was predicted to encode a transmembrane pro-
tein with 6 short helical domains spanning the mem-brane, 3 non-cytoplasmic domains and 4 cytoplasmicdomains in an N-in conformation (Fig. 3b). A KSK-GFPfusion protein was localized to the plasma membrane(Fig. 3c). The KSK protein sequence is reasonably highlyconserved among several groups of plants, and it has noclose family members in Arabidopsis, with only very par-tial protein alignments to At1g31130 detected by recipro-cal BLASTP searches. At1g31130 is a 321aa predicted6TM protein located in Golgi, endosomes and the plasmamembrane. The 6TM protein structure is predicted to bepresent in many Arabidopsis proteins with diverse func-tions, including aquaporins, voltage-gated ion superfamilytransporters, and mitochondrial carrier proteins [28]. TheMIND1 database of membrane protein interactions [29]identified an interaction between KSK and At1g07860, en-coding a predicted Receptor-Like Cytoplasmic Kinase VII(RLCK VII) family member. Members of this family func-tion in pathogen- triggered immunity and growth path-ways [30] and include the relatively well characterisedRLCK VII BIK1, which is membrane anchored via N-myristoylation [31]. In KSK over-expressing lines, auxinresponses were reduced as detected by transient expres-sion of the R2D2 auxin reporter gene (Fig. 6e). This maybe due to reduced auxin responses, synthesis, or alteredtransport. The membrane localisation of KSK-GFP sug-gests a potential influence on auxin transport. However,the predicted 6TM transmembrane organisation of KSKin membranes is different from that of all known auxinuptake and efflux plasma membrane- and tonoplast-located auxin transporters [32].Multiple promoter polymorphisms were identified be-
tween the small petal accession Col-O and the largepetal accession Dju-1 (Fig. 3a and Additional File 5). Incontrast, the protein coding regions of these two acces-sions had only two non-conserved amino acid changes(Fig. 3b); one was in a predicted non-cytoplasmic do-main and the other in the predicted C-terminal non-cytoplasmic domain. While these may influence KSKfunction in different accessions, the phenocopying of thebig petal phenotype of Dju-1 by over-expressing the
Miller et al. BMC Plant Biology (2020) 20:482 Page 9 of 14
Fig. 6 Over-expression of KSK leads to partial homeotic conversion of petals to stamenoid structures and leads to reduced auxin responses. aSEM (upper) and bright field (lower) image of a petal from a 35S::KSK transgenic line showing stamenoid features such as a pollen sac. The scalebar represents 100 μm. b SEM of petal epidermal cells from a 35S::KSK transgenic line showing a stomata. The scale bar represents 10 μm. cRelative expression of ANT in Col-0 and 35S::KSK OE1, OE2 and OE3 developing petals. Expression levels are relative to EF1ALPHA gene expression.Data are given as means of +/−SE (n = 3 biological replicates. P values were determined by Student’s t-test. ** P < 0.01; *** P < 0.001. d Nuclearlocalisation of DII-Venus (middle panel) and mDII-Tomato (lower panel) from transiently expressed R2D2 in Col-0 petal protoplasts. The upperpanel is the imaged protoplast in bright field. e Ratios of mDII-Tomato to DII-Venus transiently expressed in Col-O or 35S::KSK petal protoplasts.Protoplasts from line OE1 were treated with 0 nM or 1000 nM IAA for 1–2 h before imaging. The increased ratio of mDII/DII shows reduced levelsof DII-Venus in response to elevated auxin levels. n = 25 protoplasts were measured for each treatment in each of two independent experiments.P values were determined by Student’s t-test. ** P < 0.001. f. f and g. Reduced expression of the auxin-responsive genes IAA1 (Panel F) and IAA9(Panel g) in developing petals of Col-0 and three transgenic lines overexpressing KSK. Expression levels are relative to EF1ALPHA gene expression.Data are given as means of +/−SE (n = 3 biological replicates. P values were determined by Student’s t-test. ** P < 0.01; *** P < 0.001
Miller et al. BMC Plant Biology (2020) 20:482 Page 10 of 14
Col-0 coding region indicated that promoter variationthat increases expression most likely causes the largepetal phenotype in the screened accessions. An interest-ing feature of the Dju-1 promoter region is the accumula-tion of expanded dA:dT-rich tracts of over 50 bp.Polymorphisms of this length are very common in Arabi-dopsis genome assemblies [33], and are over-representedin many eukaryotic genomes, where they may be gener-ated by replication slippage [34]. dA:dT tracts in pro-moters have a well-established role in regulating geneexpression by forming part of scaffold attachment regions(SARS) and by introducing curvature in DNA that influ-ences transcription factor and nucleosome access.KSK over-expression led to reduced expression of
ARF8 and FRL1, two genes that exert a specific negativeeffect on petal cell size (Figs. 5a, b, c). FRL1 encodes asterol methyltransferase that influences endoreduplica-tion [35]. ARF8 is an auxin-responsive transcription fac-tor that forms a transcription complex with the bHLHtranscription factor BPEp [20]. BPEp also restricts cellexpansion specifically in petals. BPEp is highly expressedduring the later stages of petal development, while ARF8is ubiquitously expressed, but more highly expressedduring the later stages of petal development. The expres-sion of both FRL1 and ARF8 was increased in responseto auxin [24, 25, 36], and as auxin responses are reducedin KSK over-expressing lines (Fig. 6e), it is possible thatKSK over-expression may reduce expression of theseauxin-responsive negative regulators of petal cell size,leading to increased petal cell size and overall increasesin petal area. The down-regulation of ANT expression inKSK over-expression lines (Fig. 4c) is consistent with re-duced auxin responses, as auxin increases ANT gene ex-pression [37]. ANT encodes an AP2/ERF transcriptionfactor that influences several stages of floral develop-ment, including specification of floral organ identity.Petals in KSK over-expressing lines often exhibited apartial conversion to stamenoid features, and also hadstomata, a cell type not normally found in petals (Figs.6a, b). In ant mutants petal cell identity was also alteredto form stomata [22, 23], supporting the conclusion thatKSK modulates ANT expression, perhaps by alteredauxin responsiveness, leading to partial homoeotic con-version of petals to stamenoid features. Such conversionis consistent with another function of ANT in excluding,together with AP2, AGAMOUS (AG) expression fromthe second whorl [23]. AG activates expression of SPOR-OCYTELESS/NOZZLE (SPL/NZZ), a transcription factorthat promotes microsporogenesis [38]. A lessening ofthis restriction of AG expression could therefore con-ceivably lead to stamenoid features developing on KSKover-expressing petals.Floral morphology plays a central role in plant fitness,
for example by attracting specific pollinators. In Brassica
napus crops, reduced petal size is an important trait as itincreases light penetration through dense canopies. Inwild populations of A. thaliana, the adaptive signifi-cance, if any, of varying petal areas is not well under-stood. Although Arabidopsis thaliana is primarily self-pollinating, some populations exhibit elevated outcross-ing, especially in species-rich rural environments [39].Diverse insects visit Arabidopsis flowers and are poten-tial pollinators [40], therefore it is reasonable to specu-late that genetic variation in petal size may have anadaptive role in securing outcrossing in Swedish popula-tions. The three lines selected with large petals camefrom different locations in southern Sweden (AdditionalFile 1), all of which harbour accessions with varyingsized petals. Natural variation in petal size in A. thalianamay therefore contribute to diversifying outcrossing op-portunities by attracting different types of insect visitors.
MethodsPlant material and phenotypingThe 272 Arabidopsis thaliana accessions were obtainedfrom Caroline Dean at the John Innes Centre. These arepart of the 1001 Genomes Consortium study of Arabi-dopsis thaliana natural variation and are available fromthe Arabidopsis Biological Resources Centre under ac-cession ID CS78942 [13]. All accessions, transgenicplants and T-DNA mutants were grown on soil in agrowth chamber with 16/8 h day/night at 22 °C after 48 hstratification at 5 °C.To quantify petal lengths, widths and areas, 10 petals
were dissected from the first set of completely openflowers from 3 biological replicates per genotype to min-imise any developmental differences. Petals were mountedon black cardboard and laminated to protect the petals.Petals were scanned at 200dpi resolution and petal length,maximum width and areas measured using Image J.
GWASGWAS was carried out using the open-source GWASsoftware, GWAPP: https://gwas.gmi.oeaw.ac.at/ with the250 K SNP dataset. Analyses were performed using theAMM function.
DNA constructsp35S::3xHA-At4g16850 transgenic lines were created bycloning At4g16850 cDNA into the pENTR TOPO-Dvector (Thermofisher, UK) using the primers describedin Additional File 7. The At4g16850 CDS was transferredinto the 35S PB7HA binary vector using LR Clonase mixII (Thermofisher, UK). The pAt4g16850::At4G16850-GFP transgenic line was generated by cloning the pro-moter and coding region from genomic DNA into thepENTR TOPO-D vector and LR clonase was then usedto transfer the target sequence into the pEARLYGate
Miller et al. BMC Plant Biology (2020) 20:482 Page 11 of 14
103 vector. All constructs were sequenced before use.The p35S::3XHA-At4g16850 construct was transformedinto Agrobacterium tumefaciens strain GV3101, andArabidopsis Col-0 plants were transformed using thefloral dip method [41].
Genotyping Arabidopsis T-DNA linesSequence indexed T-DNA insertion lines, obtained fromThe Nottingham Arabidopsis Stock Centre (NASC), weregenotyped using gene-specific primers designed using theprimer design tool http://signal.salk.edu/tdnaprimers.2.html: Primer sequences are in Additional File 7. Genotyp-ing was carried out using TAKARA EX taq (Takara Bio,USA) according to the manufacturer’s instructions.
cDNA synthesis, PCR and genome sequencingRNA was extracted from developing petals dissected fromdeveloping floral buds or 12- day- old seedlings using theSPECTRUM Total Plant RNA kit (Sigma, UK). 1 μg ofRNA was incubated with RQ1 RNase-Free DNase (Pro-mega, USA) before cDNA synthesis. This used GoScriptReverse Transcription (Promega, USA) with OligoDT.cDNA samples were diluted 1:10 in water before use. Q-RT-PCR was performed using SYBR green mastermix(Thermofisher) and on a Lightcycler 480 (Roche,Switzerland). Additional File 7 describes the primers usedfor q-RT -[42]PCR. Primer efficiencies and relative expres-sion calculations were performed according to . All q-RT-PCR assays were repeated in triplicate at least twice. AllPCR reactions were carried out using Phusion High Fidel-ity DNA polymerase (New England BioLabs) according tomanufacturer’s instructions. Capillary sequencing was car-ried out by GATC Biotech (Germany). For whole genomeassembly of accessions Dju-1, T880 and TI070, high MWDNA was prepared using Qiagen columns and PCR-freeindexed Illumina libraries prepared as described [43].After QC approximately 50m 150 bp paired-end readswere generated (Novagene, Hong Kong) for each library.Cleaned reads were assembled using ABySS v1.3.6 [44]with a k-mer size of 75. Genome assemblies were alignedwith the genomic region of At4g16850 using MUSCLEv3.8.31 [45]. Assemblies of the three accessions are avail-able at ENA (PREJB28030).
Scanning Electron microscopyPetals were dissected, fixed and critical point dried be-fore SEM imaging. Chemical fixation was in 2.5% glutar-aldehyde in 0.05M sodium cacodylate, pH 7.4. Vacuuminfiltration was carried out until the petals sank beforeleaving overnight in fixative at 4 °C. After rinsing in buf-fer twice and then water twice for 15 min each, petalswere dehydrated through an ethanol series for 30 mineach in 30, 50, 70, 90, 100, and 100% dry ethanol, thencritical point dried using a Leica EM CPD300 system
(Leica Microsystems Ltd., Milton Keynes, UK) accordingto the manufacturer’s instructions. Dried samples weremounted on the surface of an aluminium pin stub usingdouble-sided adhesive carbon discs (Agar Scientific Ltd.,Stansted, Essex). The stubs were then sputter coatedwith approximately 15 nm gold in a high-resolutionsputter coater (Agar Scientific Ltd) and transferred to aZeiss Supra 55 VP FEG scanning electron microscope(Zeiss SMT, Germany). The samples were viewed at 3kV and digital TIFF files were stored.
Transient expression in Arabidopsis protoplastsTransient expression assays were carried out using proto-plasts isolated from Arabidopsis Col-0 developing petals [46].Protoplasts were transformed with 5μg plasmid DNA puri-fied using the Qiagen Plasmid Maxi Kit (Qiagen). After anovernight incubation at 20 °C, transfected protoplasts wereharvested and imaged using confocal microscopy. The R2D2plasmid (Addgene 61,629 pGreenIIM RPS5A-mDII-ntdTomato/RPS5A-DII-n3Venus) was transfected into petalprotoplasts isolated from Col-0 or 35S::KSK plants. Afterovernight incubation, protoplasts were treated with 0 or1000 nM IAA for 1–2 h before imaging. A Leica SP5 set upfor photon counting at 12-bit resolution was used for im-aging transfected protoplasts. Gain was set to 50% for To-mato fluorescence and to 10% for Venus fluorescence.Venus was excited at 514 nm and detected at 524-540 nm,and Tomato was excited at 561 nm and detected at 571-630nm. ImageJ was used to calculate the mean gray value offluorescence within nuclei.
Supplementary informationThe online version contains supplementary material available at https://doi.org/10.1186/s12870-020-02698-5.
Additional file 1 List of Arabidopsis thaliana accessions used in theGWAS analysis.
Additional file 2. Petal phenotype data.
Additional file 3. Representative petals from the Swedish accessions.(PPTX 3030 kb)
Additional file 4. Q-RT-PCR analysis of At4g16850 in seedlings of Col-0,Dju-1, T880 and T1070.
Additional file 5 Promoter alignments of the Dju-1 and Col-0 KSKgenes.
Additional file 6 Organ counts in Col-0 and 35S::KSK flowers.
Additional file 7. Primer sequences used in this study.
AbbreviationsAbySS: Assembly by Short Sequencing; FDR: False Discovery Rate;GWAS: Genome Wide Association Studies; LD: Linkage Disequilibrium;RIL: Recombinant Inbred Line; q-RT-PCR: Quantitative Reverse TranscriptionPolymerase Chain Reaction; QTL: Quantitative Trait Locus; SEM: ScanningElectron Microscopy; SNP: Single Nucleotide Polymorphism
AcknowledgementsWe are grateful to Dr. Benguo Gu for carrying out Q-RT-PCR experiments, tomembers of Caroline Dean’s group at the John Innes Centre for assistance
Miller et al. BMC Plant Biology (2020) 20:482 Page 12 of 14

with the Swedish accessions, and to staff from the John Innes Centre Horti-cultural Services for expert plant maintenance.
Authors’ contributionsCNM, JD, MB and MWB conceived the experiments, MWB supervised the work,CNM, JD, F-HL, CS, NMcK, VC and JB carried out the work, CNM and MWB wrotethe paper. The author(s) read and approved the final manuscript.
FundingThis work was supported by ERA-CAPS Grant ABCEED to MWB. MWB wasalso supported by a Biological and Biotechnological Sciences Research Coun-cil (BBSRC) Institute Strategic Grants GRO (BB/J004588/1) and GEN (BB/P013511/1). JD was supported by a BBSRC-funded CASE PhD studentship.
Availability of data and materialsSequence reads of the A. thaliana accessions Dju-1, TBA_01 and TI-070 areavailable at ENA (PRJEB28030). Plant materials are available from the corre-sponding author.
Ethics approval and consent to participateNot Applicable.
Consent for publicationNot applicable.
Competing interestsThe authors declare they have no competing interests.
Received: 14 January 2020 Accepted: 13 October 2020
References1. Sablowski R. Control of patterning, growth, and differentiation by floral
organ identity genes. J Exp Bot. 2015;66:1065–73.2. Hepworth J, Lenhard M. Regulation of plant lateral-organ growth by
modulating cell number and size. Curr Opin Plant Biol. 2014;17:36–42.3. Koornneef M, Alonso-Blanco C, Vreugdenhil D. Naturally occurring genetic
variation in Arabidopsis thaliana. Annu Rev Plant Biol. 2004;55:141–72.4. Alonso-Blanco C, Aarts MGM, Bentsink L, Keurentjes JJB, Reymond M,
Vreugdenhil D, et al. What has natural variation taught us about plantdevelopment, physiology, and adaptation? Plant Cell. 2009;21:1877–96.
5. Weigel D. Natural variation in Arabidopsis: from molecular genetics toecological genomics. Plant Physiol. 2012;158:2–22.
6. Brock MT, Weinig C. Plasticity and environment-specific covariances: Aninvestigation of floral--vegetative and within flower correlations. Evolution.2007;61:2913–24.
7. Juenger T, Pérez-Pérez JM, Bernal S, Micol JL. Quantitative trait loci mappingof floral and leaf morphology traits in Arabidopsis thaliana: evidence formodular genetic architecture. Evol Dev. 2005;7:259–71.
8. Juenger T, Purugganan M, Mackay TF. Quantitative trait loci for floralmorphology in Arabidopsis thaliana. Genetics. 2000;156:1379–92.
9. Abraham MC, Metheetrairut C, Irish VF. Natural variation identifies multipleloci controlling petal shape and size in Arabidopsis thaliana. PLoS One.2013;8:e56743.
10. Brock MT, Kover PX, Weinig C. Natural variation in GA1 associates with floralmorphology in Arabidopsis thaliana. New Phytol. 2012;195:58–70.
11. Mouchel CF, Briggs GC, Hardtke CS. Natural genetic variation in Arabidopsisidentifies BREVIS RADIX, a novel regulator of cell proliferation andelongation in the root. Genes Dev. 2004;18:700–14.
12. Nordborg M, Weigel D. Next-generation genetics in plants. Nature. 2008;456:720–3.
13. 1001 Genomes Consortium. Electronic address: [email protected], 1001 Genomes Consortium. 1,135 Genomes Reveal the GlobalPattern of Polymorphism in Arabidopsis thaliana. Cell. 2016;166:481–91.
14. Long Q, Rabanal FA, Meng D, Huber CD, Farlow A, Platzer A, et al. Massivegenomic variation and strong selection in Arabidopsis thaliana lines fromSweden. Nat Genet. 2013;45:884–90.
15. Shindo C, Lister C, Crevillen P, Nordborg M, Dean C. Variation in theepigenetic silencing of FLC contributes to natural variation in Arabidopsisvernalization response. Genes Dev. 2006;20:3079–83.
16. Seren Ü, Vilhjálmsson BJ, Horton MW, Meng D, Forai P, Huang YS, et al.GWAPP: a web application for genome-wide association mapping inArabidopsis. Plant Cell. 2012;24:4793–805.
17. Weisenfeld NI, Yin S, Sharpe T, Lau B, Hegarty R, Holmes L, et al.Comprehensive variation discovery in single human genomes. Nat Genet.2014;46:1350–5.
18. Dai N, Wang W, Patterson SE, Bleecker AB. The TMK subfamily of receptor-like kinases in Arabidopsis display an essential role in growth and a reducedsensitivity to auxin. PLoS One. 2013;8:e60990.
19. Szécsi J, Joly C, Bordji K, Varaud E, Cock JM, Dumas C, et al. BIGPETALp, abHLH transcription factor is involved in the control of Arabidopsis petal size.EMBO J. 2006;25:3912–20.
20. Varaud E, Brioudes F, Szécsi J, Leroux J, Brown S, Perrot-Rechenmann C,et al. AUXIN RESPONSE FACTOR8 regulates Arabidopsis petal growth byinteracting with the bHLH transcription FACTOR BIGPETALp. Plant Cell. 2011;23:973–83.
21. Hase Y, Tanaka A, Baba T, Watanabe H. FRL1 is required for petal and sepaldevelopment in Arabidopsis. Plant J. 2000;24:21–32.
22. Krizek BA, Prost V, Macias A. AINTEGUMENTA promotes petal identity andacts as a negative regulator of AGAMOUS. Plant Cell. 2000;12:1357–66.
23. Krizek B. AINTEGUMENTA and AINTEGUMENTA-LIKE6 act redundantly toregulate Arabidopsis floral growth and patterning. Plant Physiol. 2009;150:1916–29.
24. Carland FM, Fujioka S, Takatsuto S, Yoshida S, Nelson T. The identification ofCVP1 reveals a role for sterols in vascular patterning. Plant Cell. 2002;14:2045–58.
25. Paponov IA, Paponov M, Teale W, Menges M, Chakrabortee S, Murray JAH,et al. Comprehensive Transcriptome analysis of Auxin responses inArabidopsis. Mol Plant. 2008;1:321–37.
26. Liao C-Y, Smet W, Brunoud G, Yoshida S, Vernoux T, Weijers D. Reporters forsensitive and quantitative measurement of auxin response. Nat Methods.2015;12:207–10 2 p following 210.
27. Atwell S, Huang YS, Vilhjálmsson BJ, Willems G, Horton M, Li Y, et al.Genome-wide association study of 107 phenotypes in Arabidopsis thalianainbred lines. Nature. 2010;465:627–31.
28. Demidchik V, Davenport RJ, Tester M. Nonselective cation channels inplants. Annu Rev Plant Biol. 2002;53:67–107.
29. Jones AM, Xuan Y, Xu M, Wang R-S, Ho C-H, Lalonde S, et al. Bordercontrol--a membrane-linked interactome of Arabidopsis. Science. 2014;344:711–6.
30. Rao S, Zhou Z, Miao P, Bi G, Hu M, Wu Y, et al. Roles of receptor-likecytoplasmic kinase VII members in pattern-triggered immune signaling.Plant Physiol. 2018;177:1679–90.
31. Veronese P, Nakagami H, Bluhm B, Abuqamar S, Chen X, Salmeron J, et al.The membrane-anchored BOTRYTIS-INDUCED KINASE1 plays distinct roles inArabidopsis resistance to necrotrophic and biotrophic pathogens. Plant Cell.2006;18:257–73.
32. Grones P, Friml J. Auxin transporters and binding proteins at a glance. J CellSci. 2015;128:1–7.
33. Schneeberger K, Ossowski S, Ott F, Klein JD, Wang X, Lanz C, et al.Reference-guided assembly of four diverse Arabidopsis thaliana genomes.Proc Natl Acad Sci U S A. 2011;108:10249–54.
34. Dechering KJ, Cuelenaere K, Konings RN, Leunissen JA. Distinct frequency-distributions of homopolymeric DNA tracts in different genomes. NucleicAcids Res. 1998;26:4056–62.
35. Hase Y, Fujioka S, Yoshida S, Sun G, Umeda M, Tanaka A. Ectopicendoreduplication caused by sterol alteration results in serrated petals inArabidopsis. J Exp Bot. 2005;56:1263–8.
36. Wójcikowska B, Gaj MD. Expression profiling of AUXIN RESPONSE FACTORgenes during somatic embryogenesis induction in Arabidopsis. Plant CellRep. 2017;36:843–58.
37. Yamaguchi N, Jeong CW, Nole-Wilson S, Krizek BA, Wagner D. AINTEGUMENTA and AINTEGUMENTA-LIKE6/PLETHORA3 induce LEAFYexpression in response to Auxin to promote the onset of flower formationin Arabidopsis. Plant Physiol. 2016;170:283–93.
38. Ito T, Wellmer F, Yu H, Das P, Ito N, Alves-Ferreira M, et al. The homeoticprotein AGAMOUS controls microsporogenesis by regulation ofSPOROCYTELESS. Nature. 2004;430:356–60.
39. Bomblies K, Yant L, Laitinen RA, Kim S-T, Hollister JD, Warthmann N, et al.Local-scale patterns of genetic variability, outcrossing, and spatial structurein natural stands of Arabidopsis thaliana. PLoS Genet. 2010;6:e1000890.
Miller et al. BMC Plant Biology (2020) 20:482 Page 13 of 14
40. Hoffmann MH, Bremer M, Schneider K, Burger F, Stolle E, Moritz G. FlowerVisitors in a Natural Population of Arabidopsisthaliana.
41. Clough SJ, Bent AF. Floral dip: a simplified method for agrobacterium-mediated transformation of Arabidopsis thaliana. Plant J. 1998;16:735–43.
42. Pfaffl MW. A new mathematical model for relative quantification in real-timeRT–PCR. Nucleic Acids Res. 2001;29:e45.
43. Clavijo BJ, Venturini L, Schudoma C, Accinelli GG, Kaithakottil G, Wright J,et al. An improved assembly and annotation of the allohexaploid wheatgenome identifies complete families of agronomic genes and providesgenomic evidence for chromosomal translocations. Genome Res. 2017;27:885–96.
44. Simpson JT, Wong K, Jackman SD, Schein JE, Jones SJM, Birol I. ABySS: aparallel assembler for short read sequence data. Genome Res. 2009;19:1117–23.
45. Edgar RC. MUSCLE: a multiple sequence alignment method with reducedtime and space complexity. BMC Bioinformatics. 2004;5:113.
46. Wu F-H, Shen S-C, Lee L-Y, Lee S-H, Chan M-T, Lin C-S. Tape-ArabidopsisSandwich - a simpler Arabidopsis protoplast isolation method. PlantMethods. 2009;5:16.
Publisher’s NoteSpringer Nature remains neutral with regard to jurisdictional claims inpublished maps and institutional affiliations.
Miller et al. BMC Plant Biology (2020) 20:482 Page 14 of 14